Save 23% ($351) & Get a Free 1-1 Call with our Team ⏰ : 0d 2h 59m 43s
Technical Analysis
Shiba Inu (SHIB) technical analysis: Is $0.0000283 target achievable?
Shiba Inu (SHIB) holds steady above the 200 EMA and $0.0000176 support, showing potential for upward movement. With key resistance at $0.0000215, a breakout could pave the way toward $0.0000283. Market sentiment supports further gains.

Disclaimer: This is not financial or investment advice. You are responsible for any capital-related decisions you make, and only you are accountable for the results.
Overview
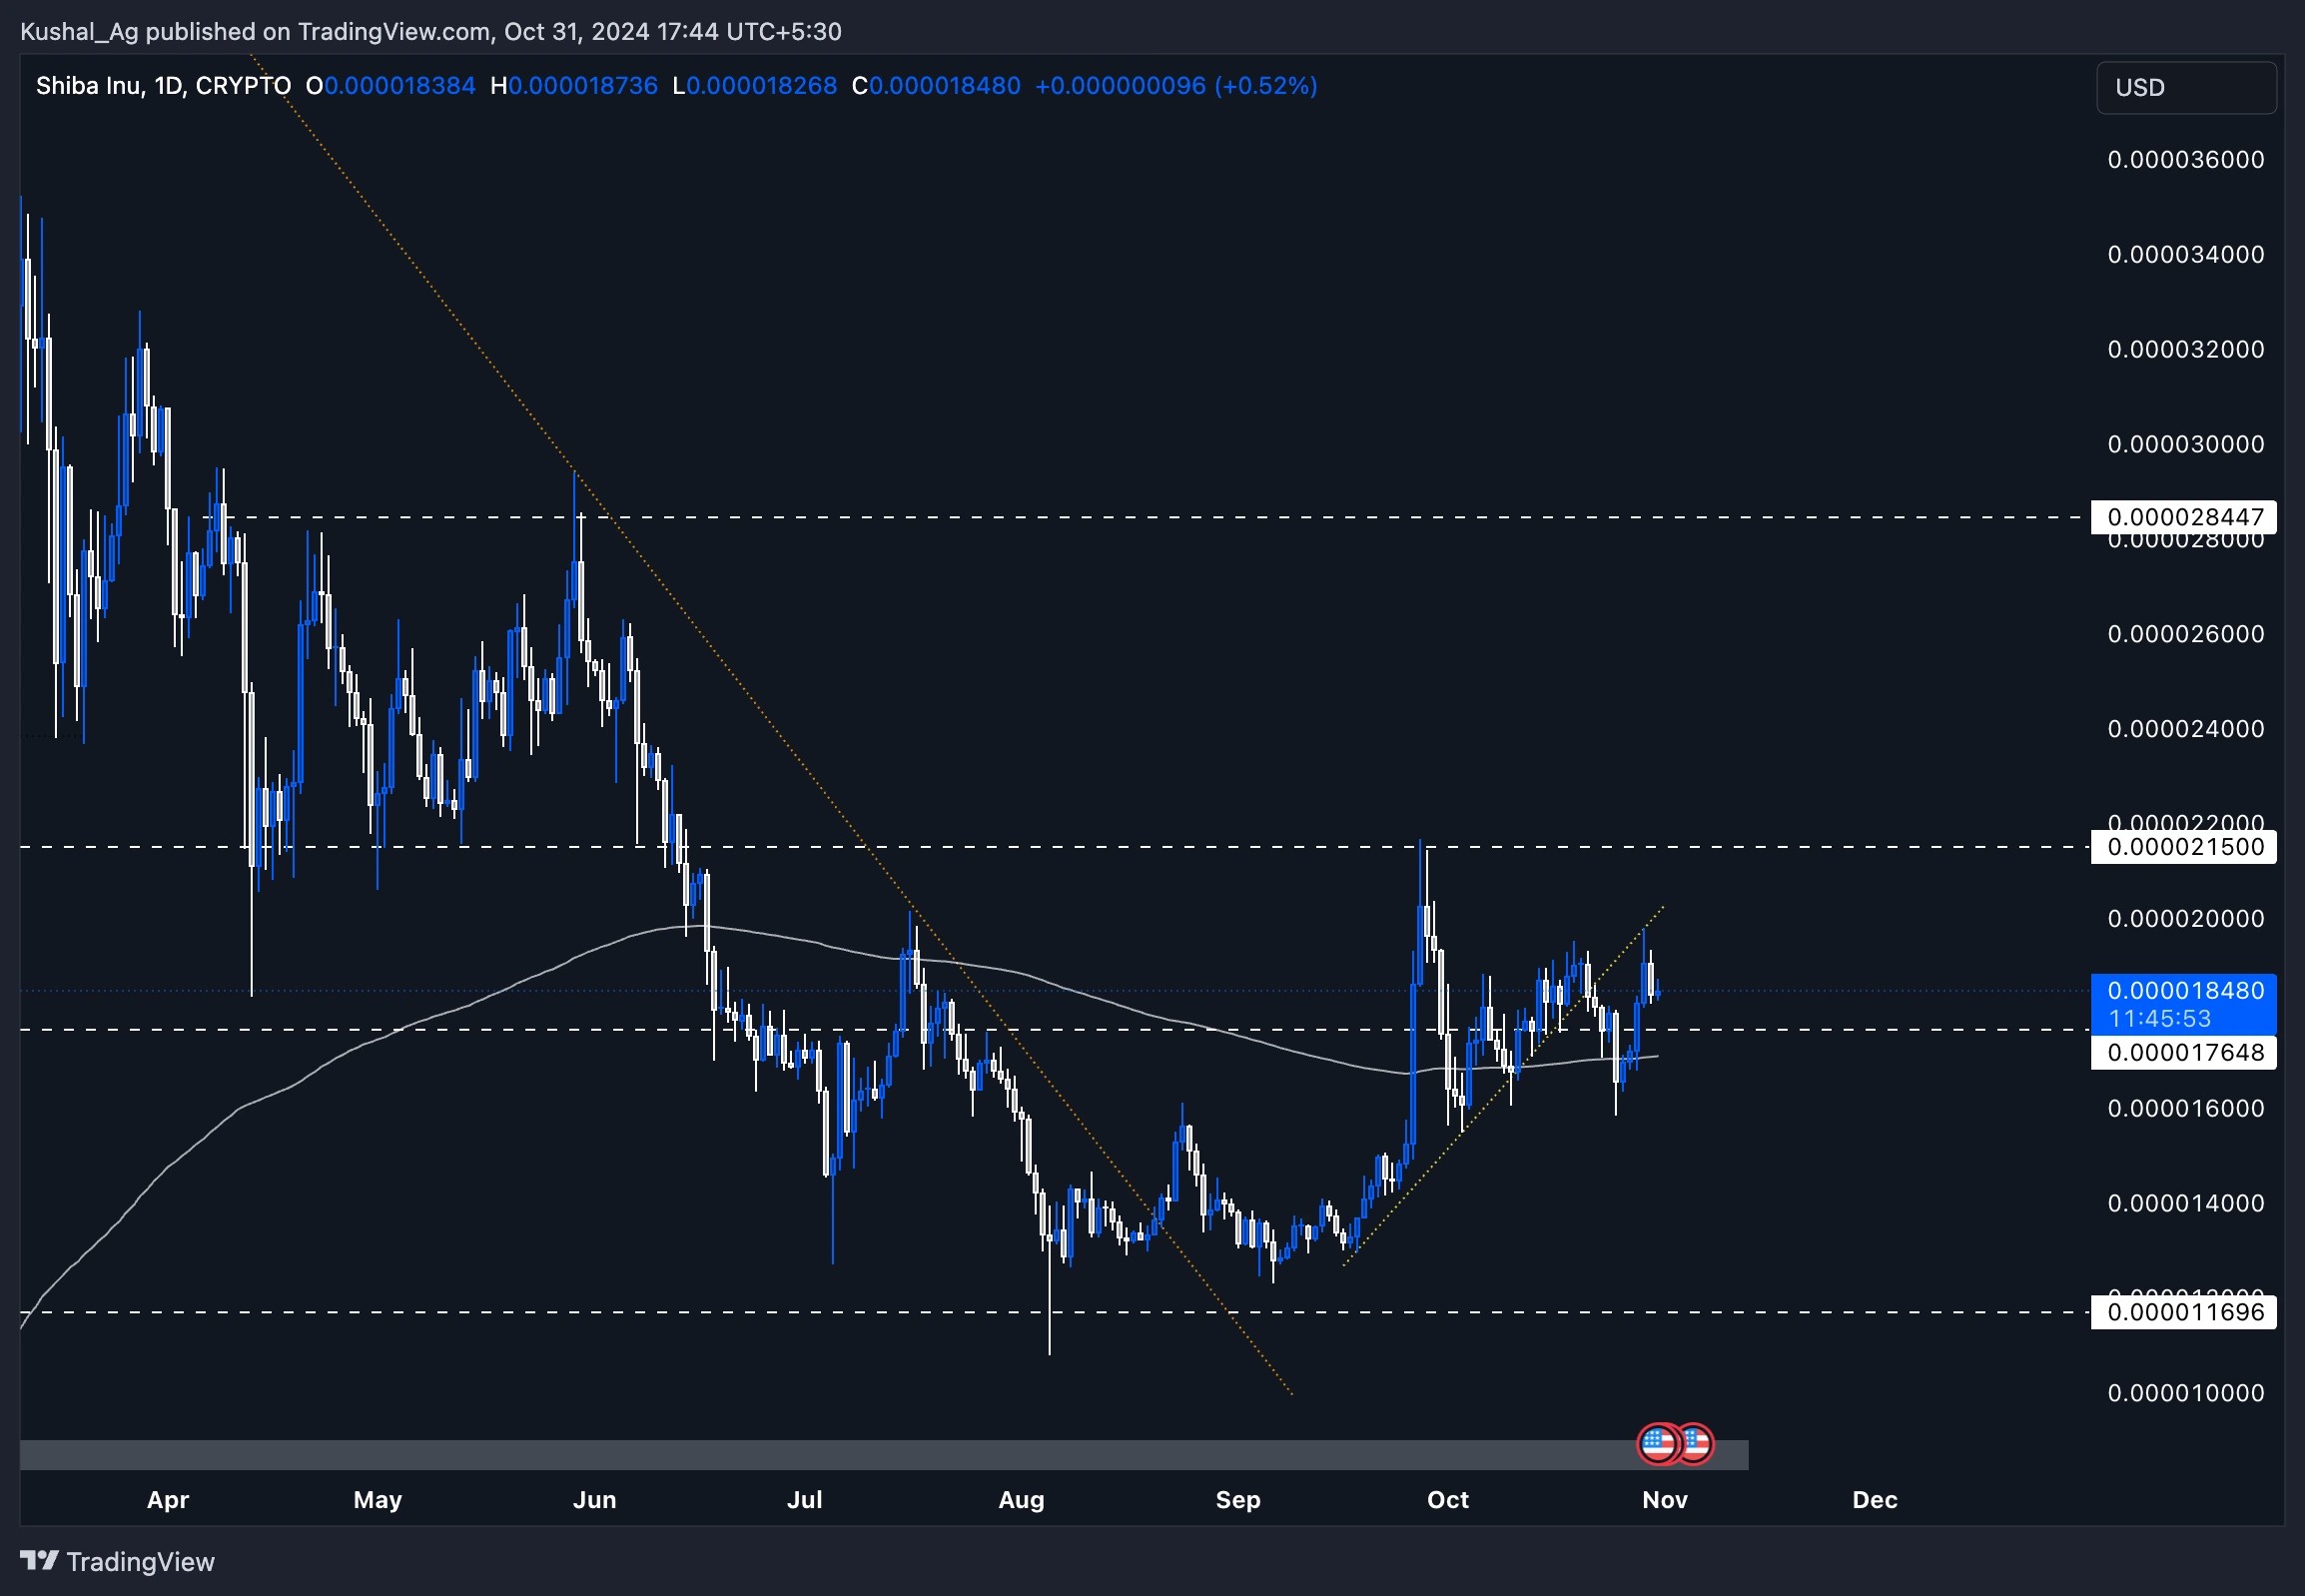
Shiba Inu ($SHIB) is showcasing a solid technical structure on the daily timeframe. With the 200 EMA providing a strong base, $SHIB appears well-supported, especially as it consolidates and contracts sideways. Since tapping the $0.0000215 resistance, SHIB has retraced to this foundational support, creating a favourable setup on the charts.Daily timeframe analysis
Shiba Inu has been steady around its 200 EMA, which has formed a reliable support zone, indicating potential strength in the asset's base. After breaking down from the yellow uptrend trendline about 10 days ago, $SHIB experienced a quick liquidity grab below the trendline, briefly dipping but quickly recovering, tapping into the 200 EMA.It reversed sharply in the next candle, reclaiming the 200 EMA and moving above the $0.0000176 level, a key support zone. Currently, $SHIB is showing signs of stability and trading above both the 200 EMA and the $0.0000176 support, which provides a sturdy platform for potential upward movement.
Potential scenarios
- Upside: Should $SHIB maintain its position above the 200 EMA and the $0.0000176 support, there is room for it to rally up to the $0.0000215 resistance level. A successful break above this level could trigger further momentum, with a medium-term target around the $0.0000283 area.
- Downside: If $SHIB fails to sustain above the 200 EMA, we could see a pullback to retest previous support levels, though current indicators suggest a stable base.
Cryptonary's take
With solid support around the 200 EMA and the consolidation in this range, $SHIB is positioned for a potential upward move. While the meme sector remains highly speculative, $SHIB's price action and technical support suggest a possible continuation to higher levels if broader market sentiment aligns.Recommended from Cryptonary


PRO
Market Updates
11 min read
Mar 27, 2026

PRO
Market Direction
11 min read
Mar 24, 2026

PRO
Market Updates
8 min read
Mar 23, 2026
