Save 23% ($351) & Get a Free 1-1 Call with our Team ⏰ : 0d 2h 59m 44s
Should we expect a pullback? | February 2nd
Although we believe the rally isn’t over, the market needs a pullback. For higher prices to follow, the market needs to first go down. Otherwise, upside will become unsustainable and this will eventually lead to a fast descent. In that case, we recommend taking profits. We’re sure there are plenty to take for most of you.
Disclaimer: Not financial or investment advice. You are responsible for any capital-related decisions you make, and only you are accountable for the results.
TLDR
- The aftermath of the FOMC meeting is positive. A 25 base points increase was announced, which was expected by market participants. As a result, prices have risen.
- The Total Market Cap needs to close above $1.03T on the weekly timeframe to confirm further upside.
- There’s still fuel left for the rally to continue throughout Q1 and Q2, but the market needs to retrace first. This will leave room for higher prices.
Total Market Cap
The Total Market Cap index represents the entire valuation of the cryptocurrency market. We track this index to understand where the market is now and predict where it will go.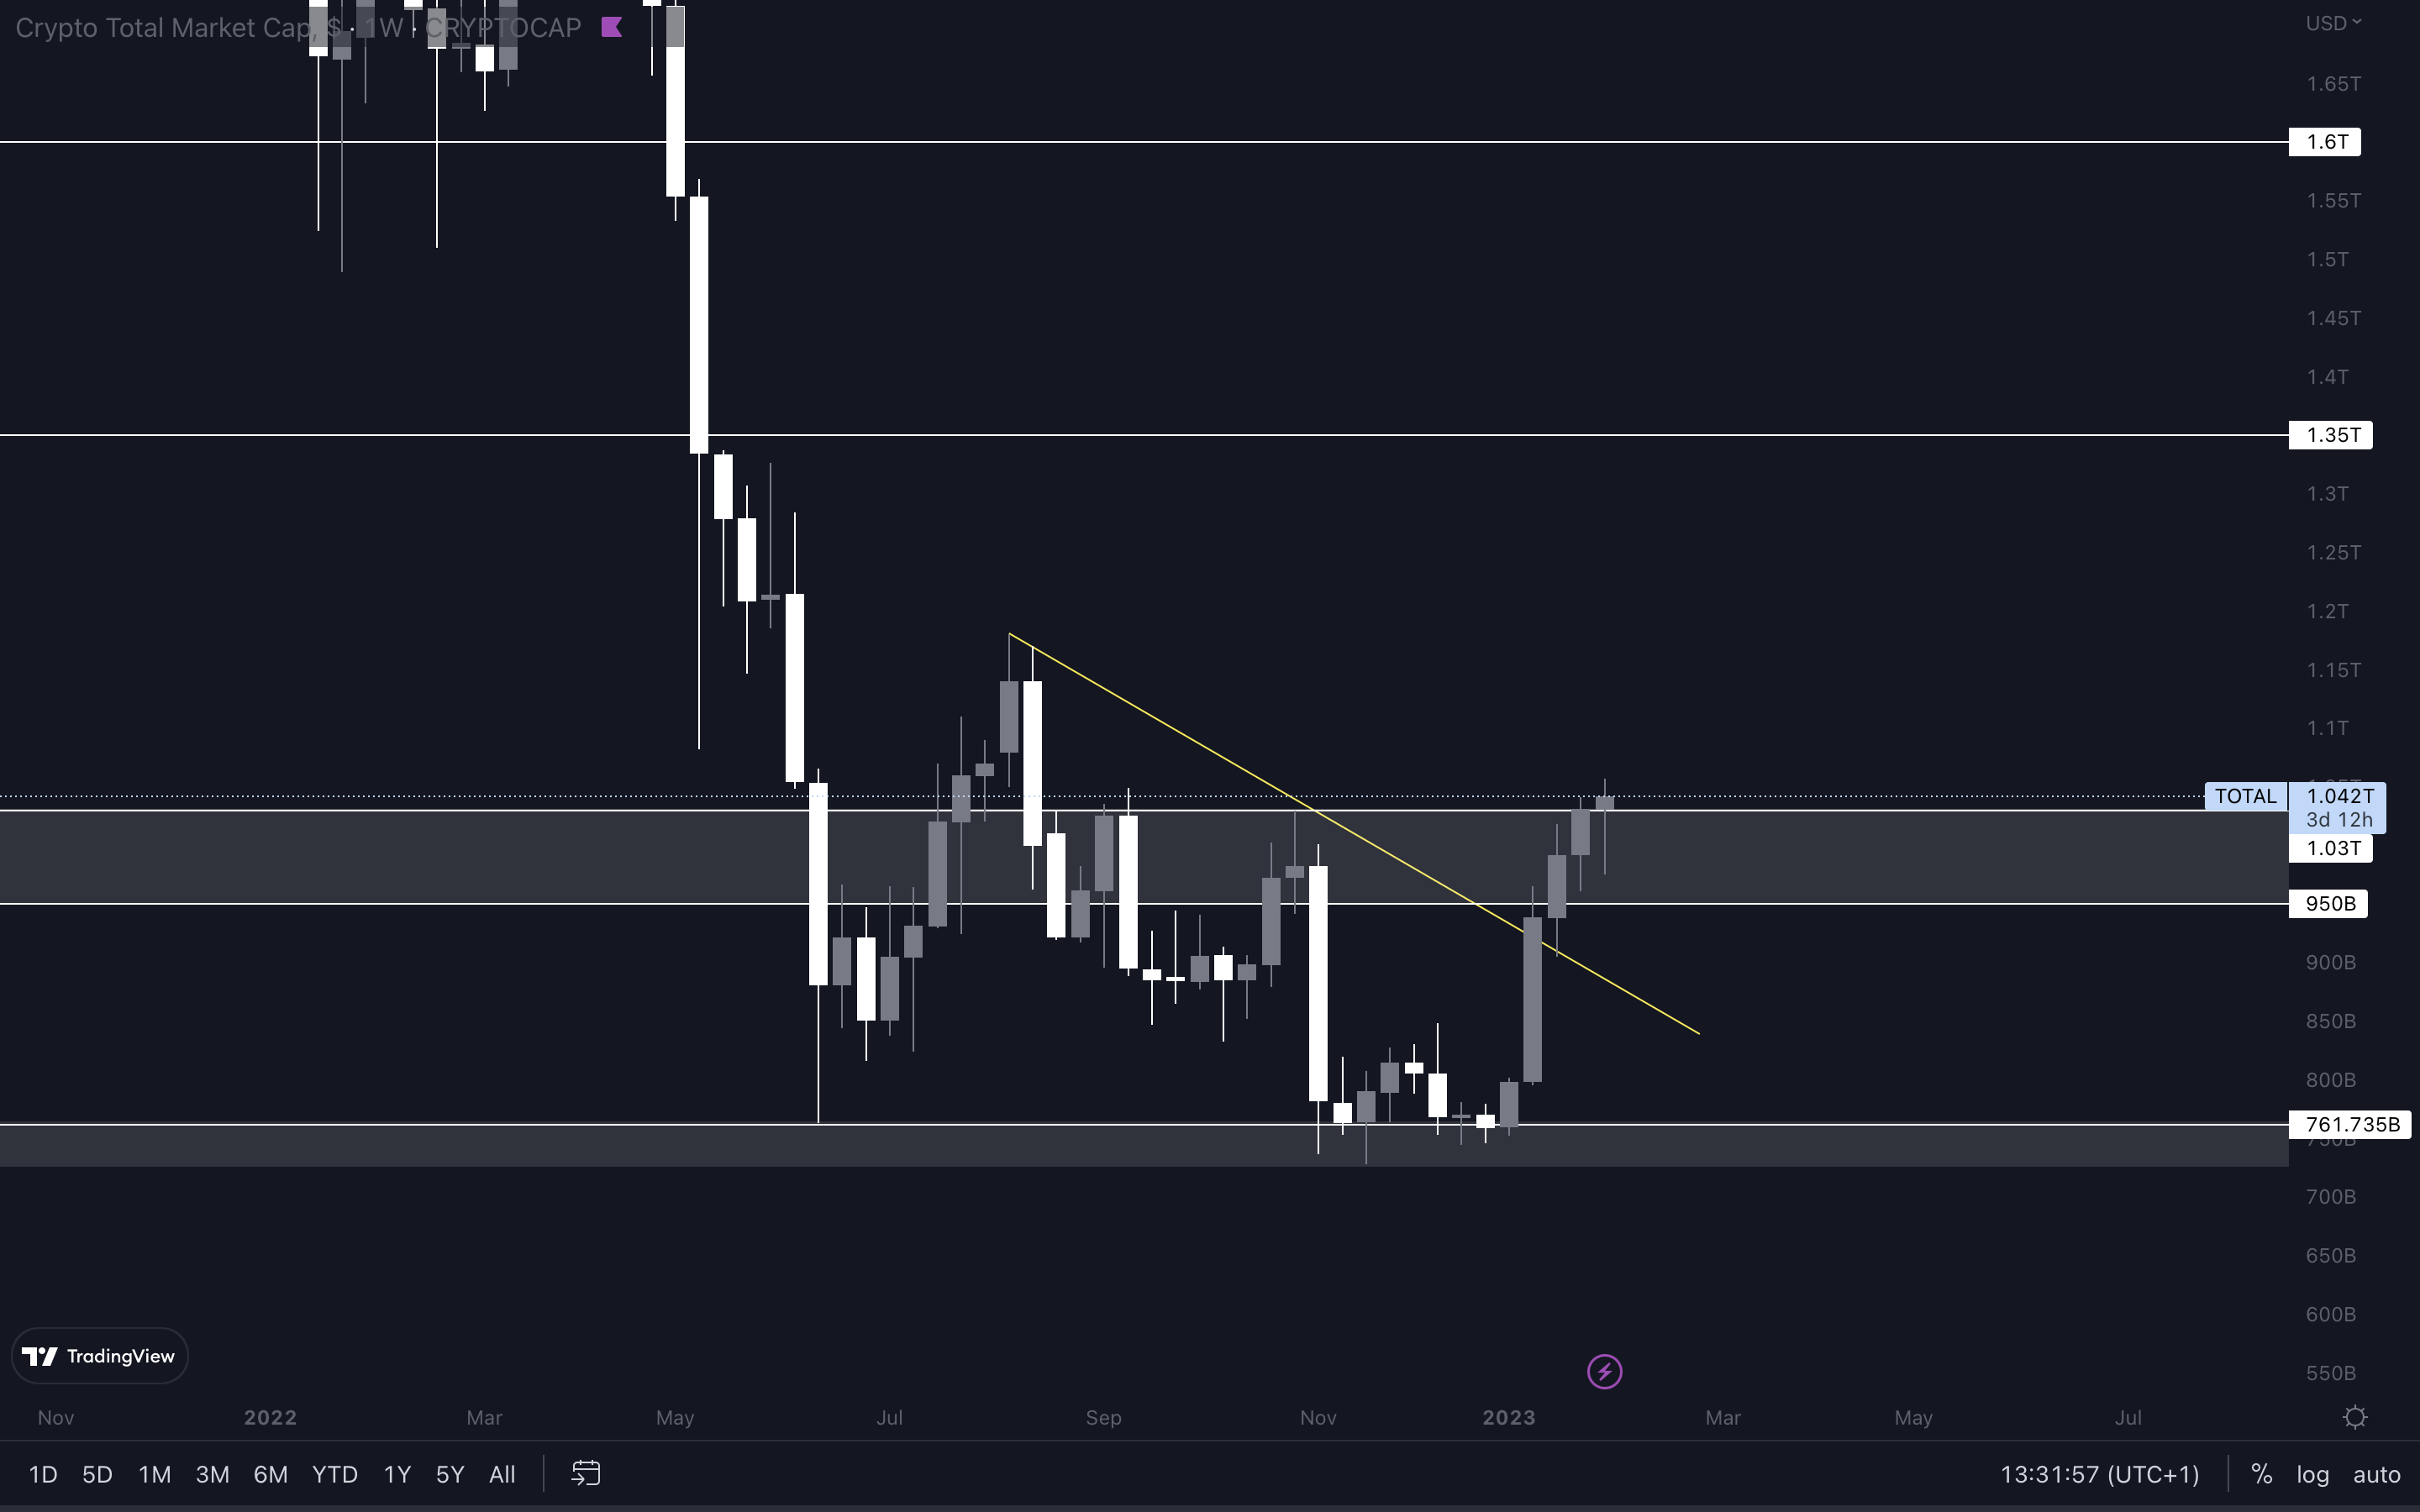
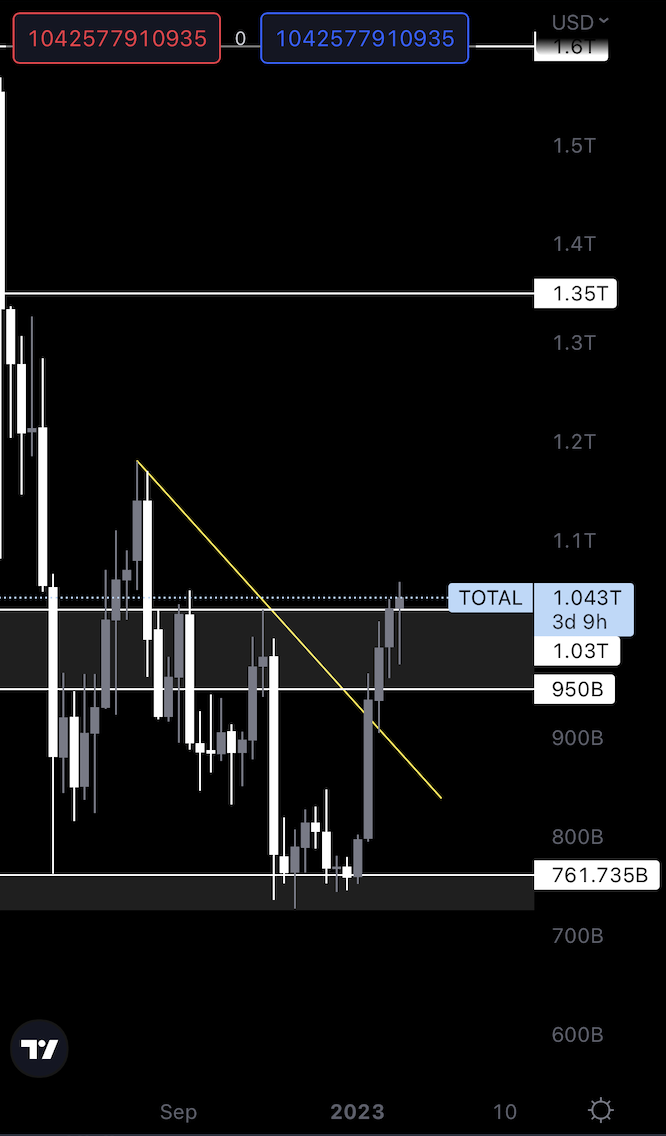 The aftermath of the FOMC meeting is positive. The market saw a slight increase, which brought the Total Market Cap above its $1.03T resistance level.
It’s common to see prices retrace after a FOMC meeting, and the same thing could happen here. It’s important that the Total Market Cap closes the week above $1.03T. A reclaim of this level would put $1.35T on the cards, which is a target that could be achieved sometime during Q1 or Q2.
For now, our interest lies in the $1.03T level. If we do see a reclaim, it’s also important that the index holds it as support. A loss of $1.03T would invalidate the upside scenario.
The aftermath of the FOMC meeting is positive. The market saw a slight increase, which brought the Total Market Cap above its $1.03T resistance level.
It’s common to see prices retrace after a FOMC meeting, and the same thing could happen here. It’s important that the Total Market Cap closes the week above $1.03T. A reclaim of this level would put $1.35T on the cards, which is a target that could be achieved sometime during Q1 or Q2.
For now, our interest lies in the $1.03T level. If we do see a reclaim, it’s also important that the index holds it as support. A loss of $1.03T would invalidate the upside scenario.
Altcoins Market Cap
The Altcoins Market Cap index represents the entire valuation of the altcoins market (all coins other than BTC).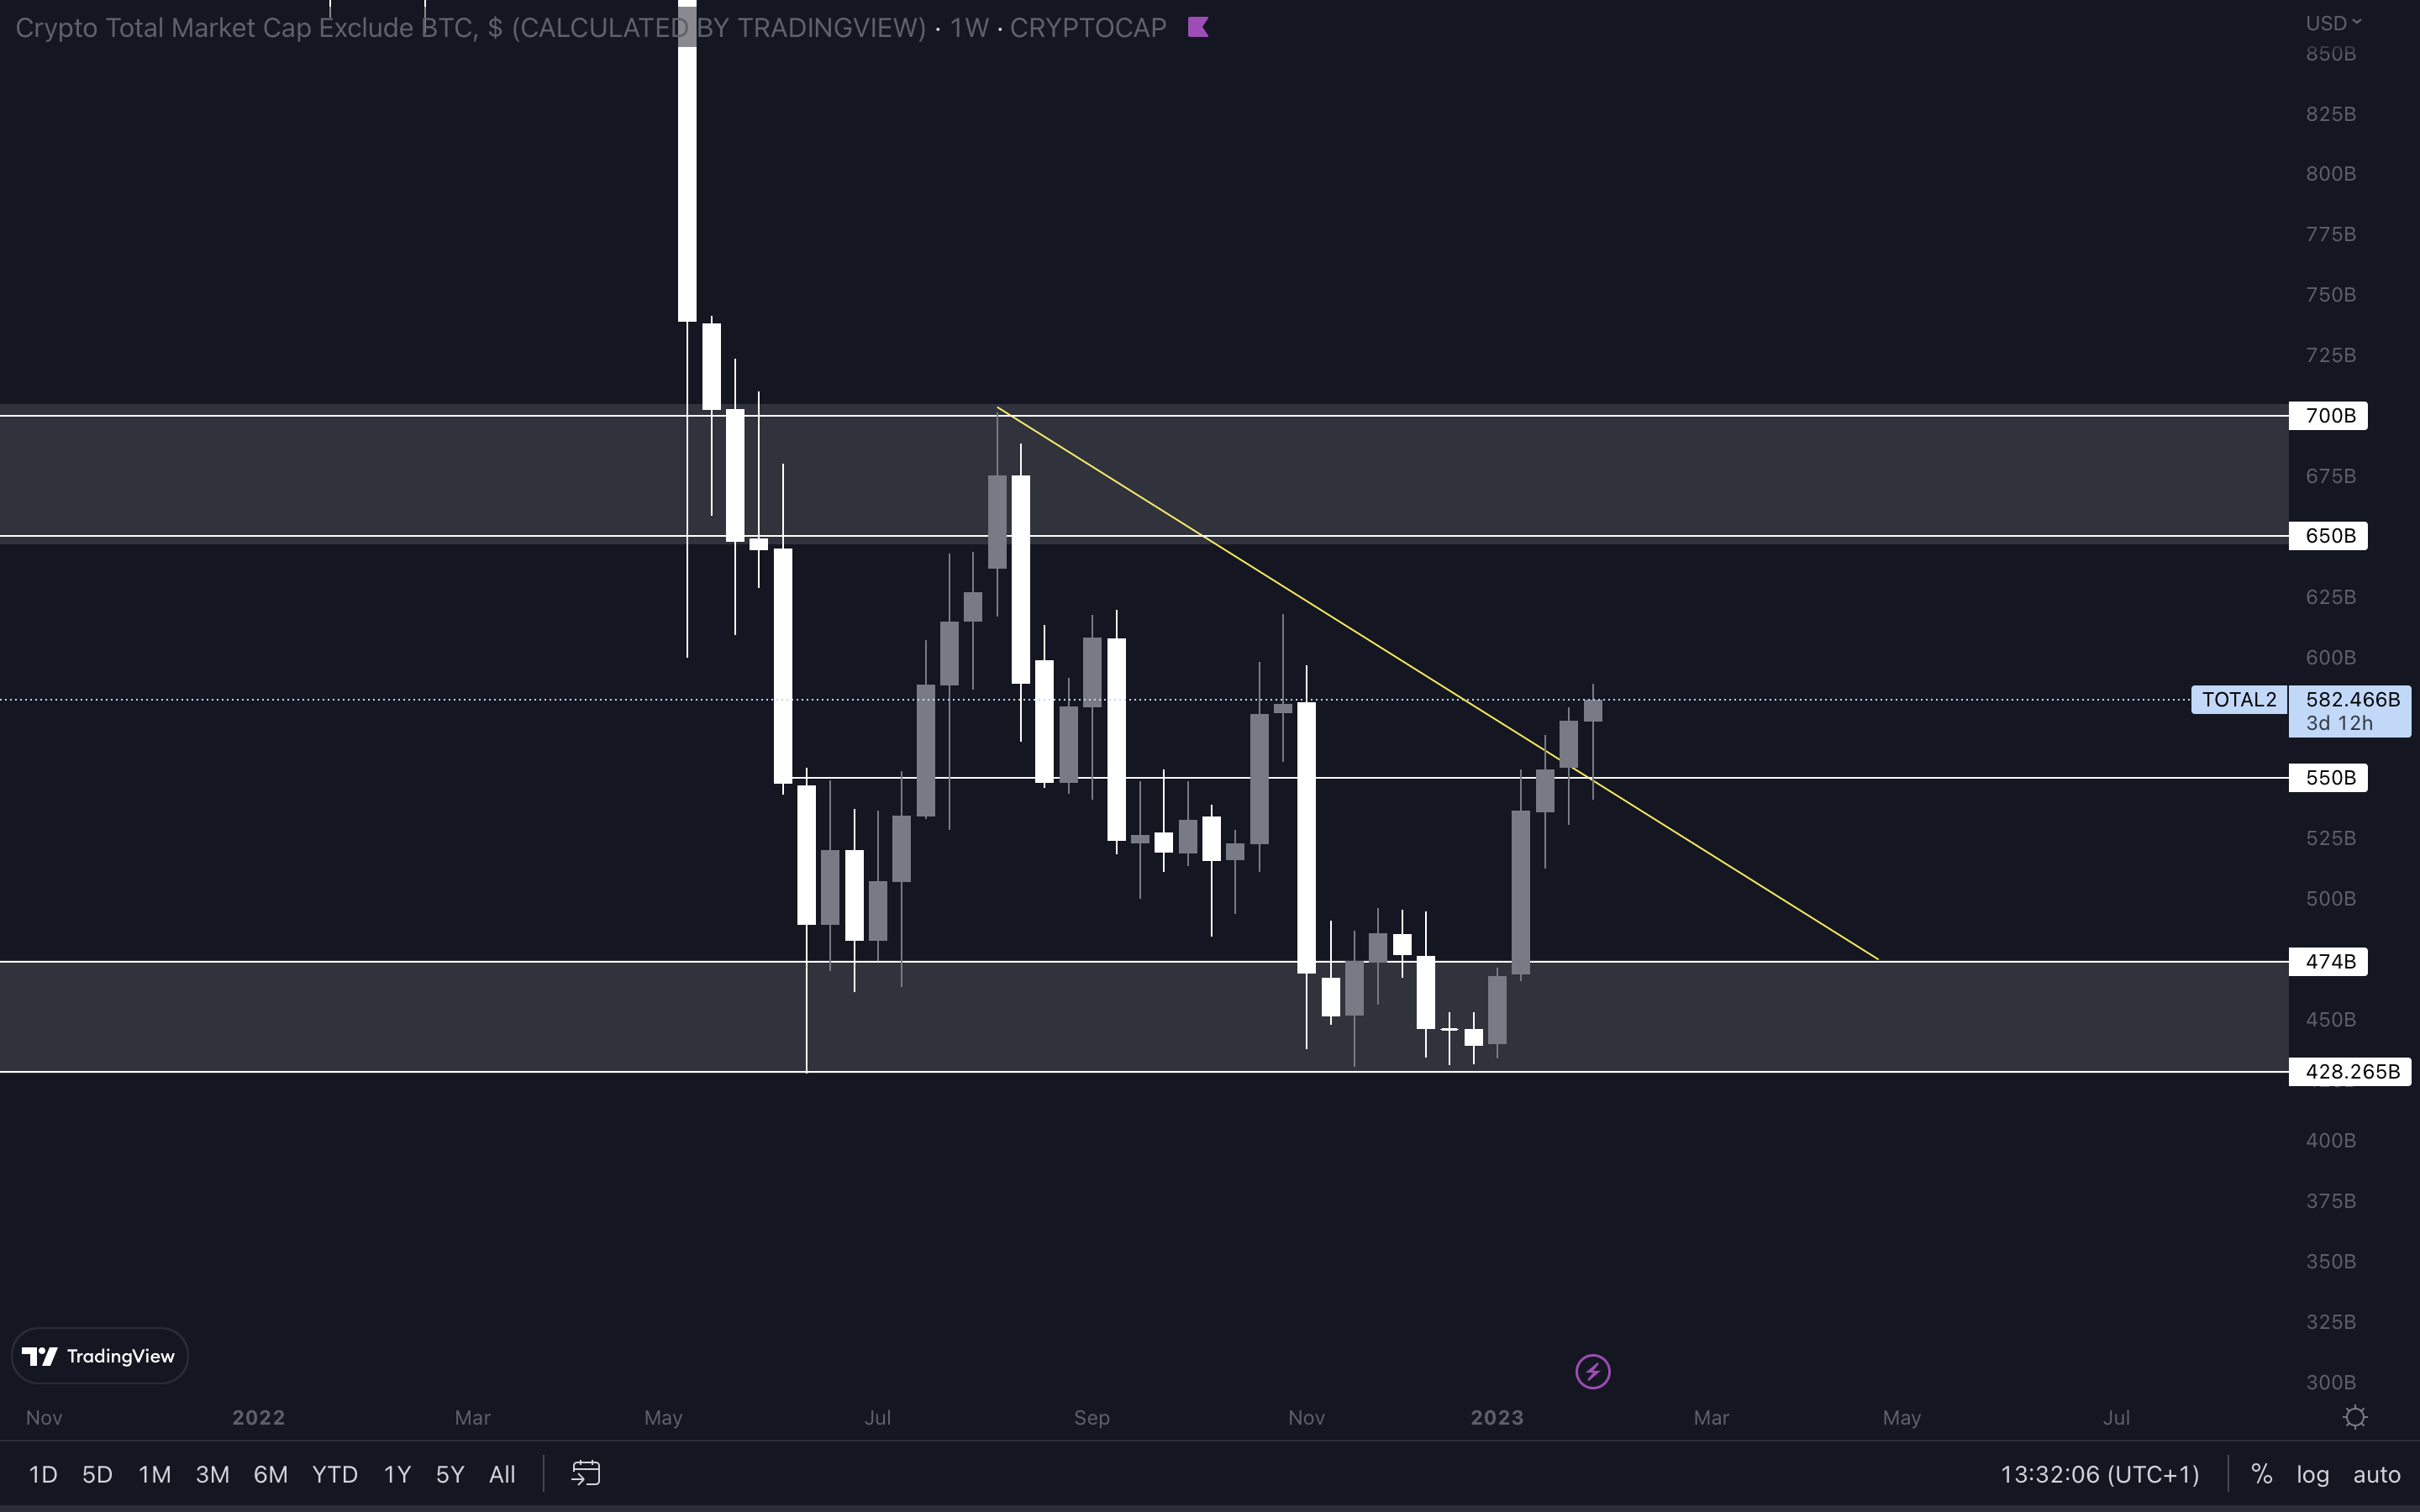
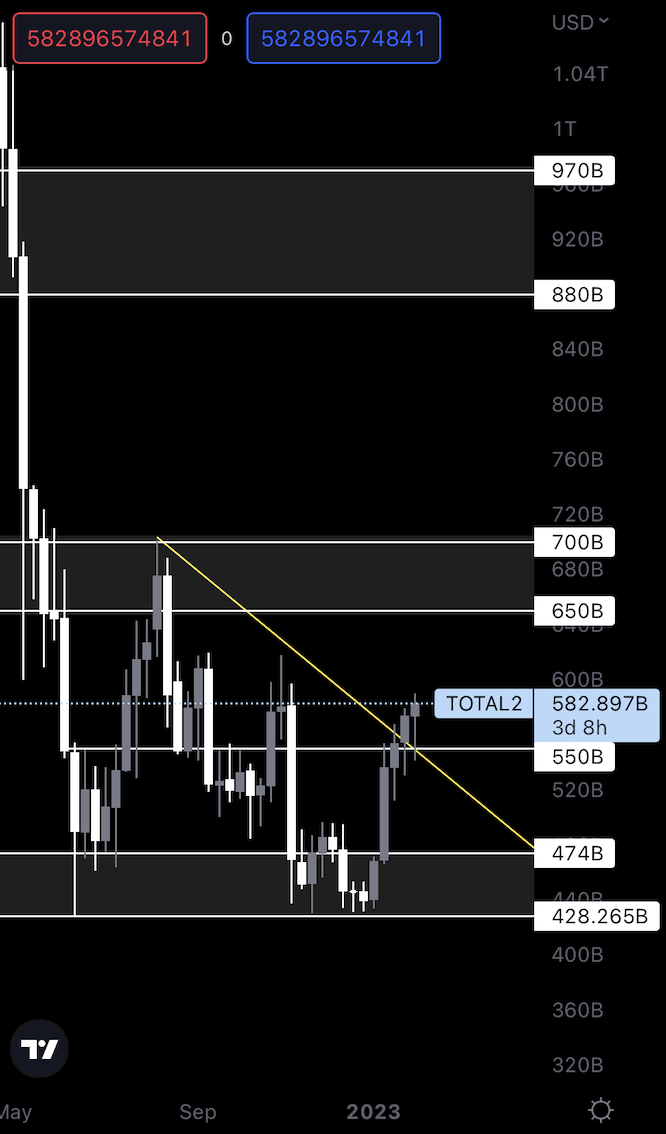 The altcoins market is looking even better, bouncing from its $550B support. As long as this level isn’t lost, our target for this index for Q1 / Q2 is $650B. However, we might be looking at a pullback at some point as we haven’t had one yet. This would provide us with great entry points for assets that we might have missed before.
During a rally, it’s essential to know which coins will outperform, to increase your returns. This week, we published a new edition of our Monthly Digest, where we analyse our top picks to understand where they’re going in the next month(s).
BTC | Bitcoin
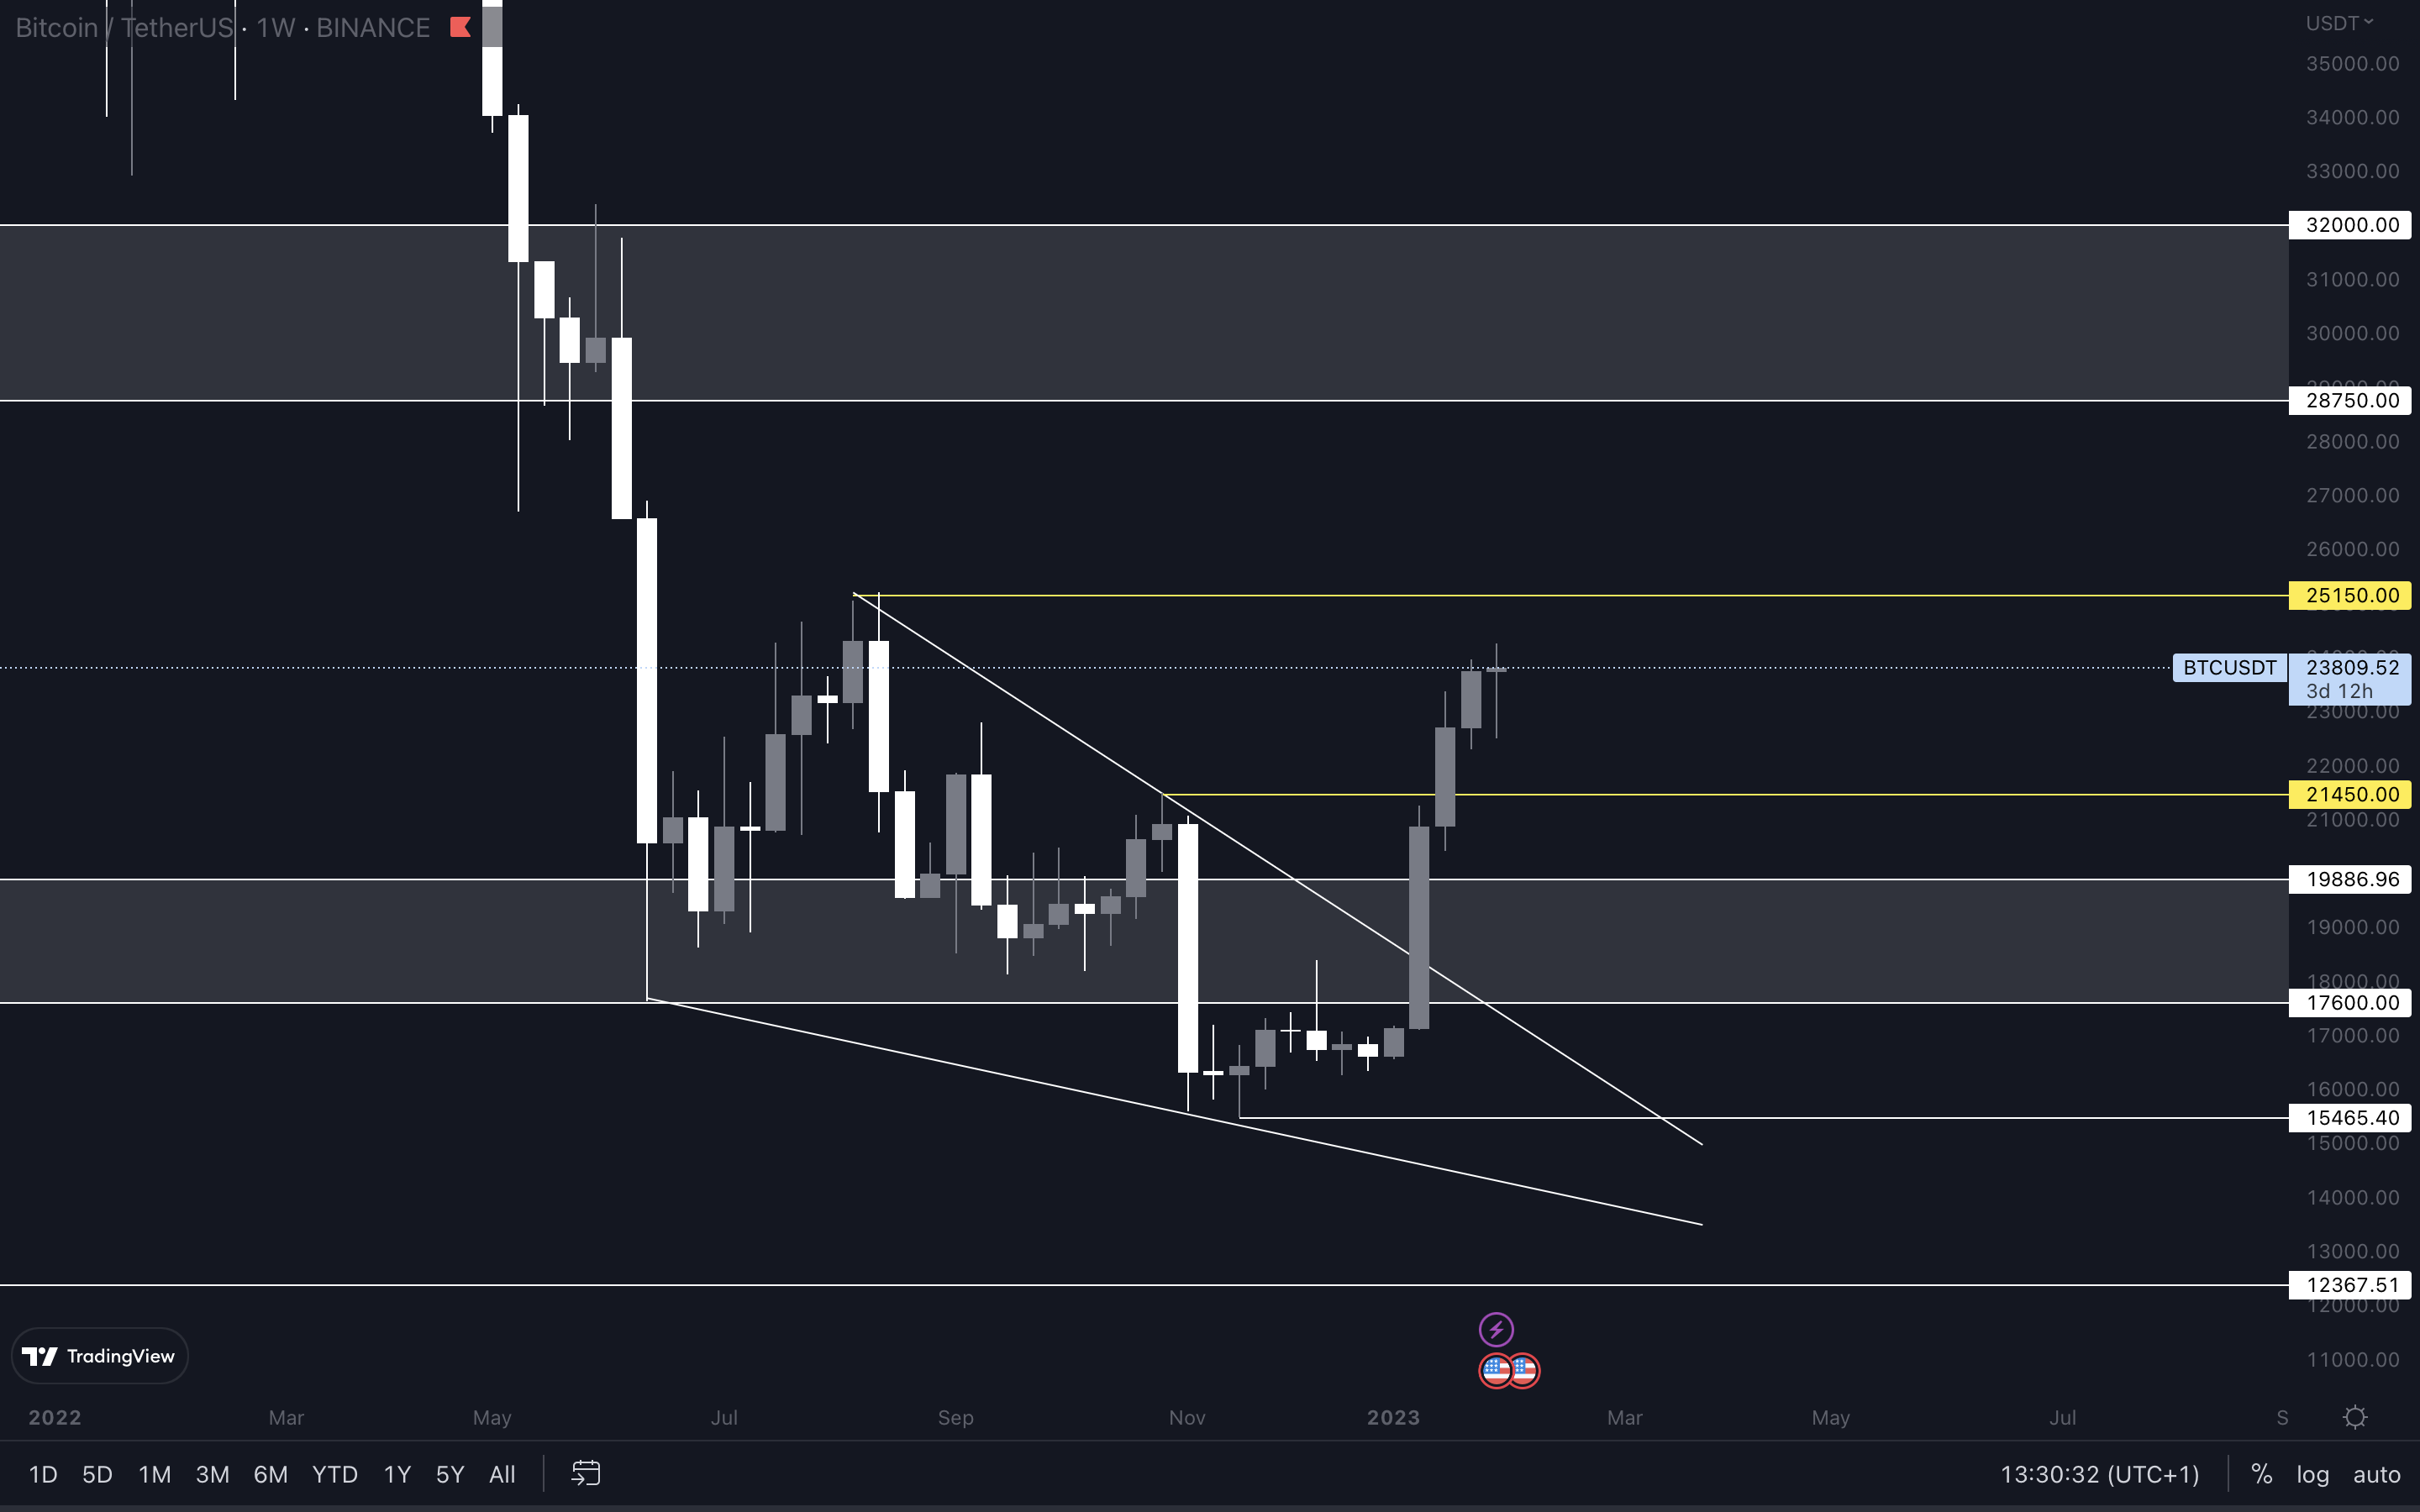
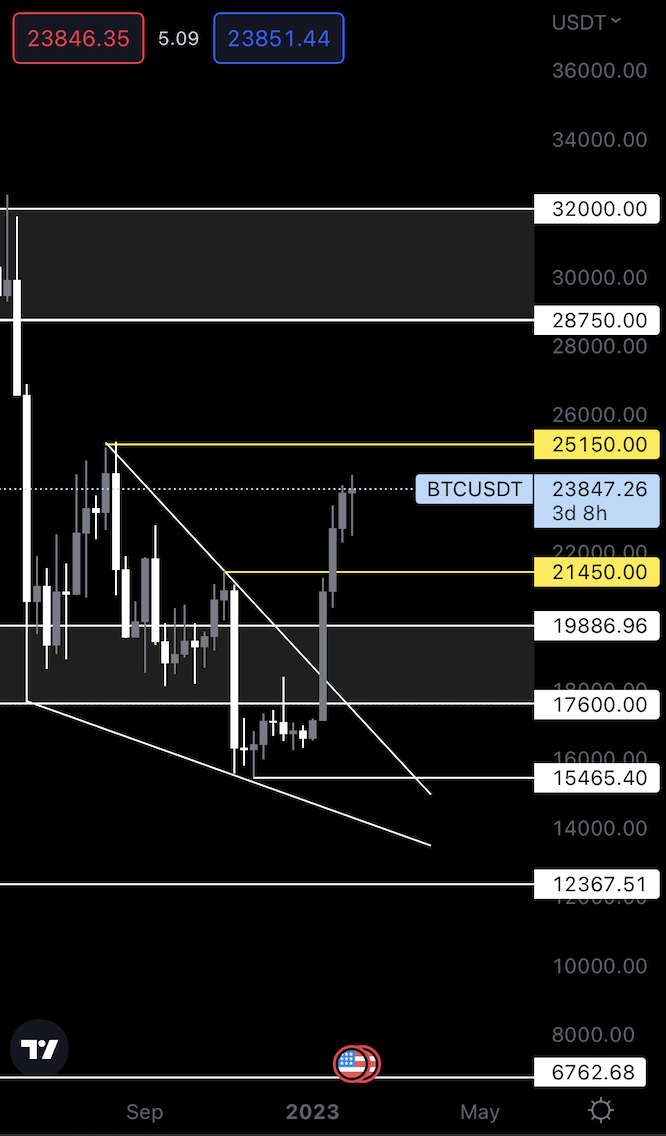 Bitcoin reached a new daily high today, as a result of the positive reaction from the FOMC meeting. Although we could still see it tackle $25,150, we can’t help but notice the slow down in its price.
For that reason, we believe we might see a pullback from $25,150. Prices need to cool off for a bit, to allow more room for upside in the future.
As Bitcoin has made a weekly higher high, a pullback would likely lead to the formation of a higher low. All that’s needed after is another higher high, and we’d be left with a weekly change in market structures. There’s still development needed for this to occur, but we believe it could happen during Q1 or Q2, after which Bitcoin could test the $28,750 - $32,000 resistance area.
Bitcoin reached a new daily high today, as a result of the positive reaction from the FOMC meeting. Although we could still see it tackle $25,150, we can’t help but notice the slow down in its price.
For that reason, we believe we might see a pullback from $25,150. Prices need to cool off for a bit, to allow more room for upside in the future.
As Bitcoin has made a weekly higher high, a pullback would likely lead to the formation of a higher low. All that’s needed after is another higher high, and we’d be left with a weekly change in market structures. There’s still development needed for this to occur, but we believe it could happen during Q1 or Q2, after which Bitcoin could test the $28,750 - $32,000 resistance area.
ETH | Ethereum
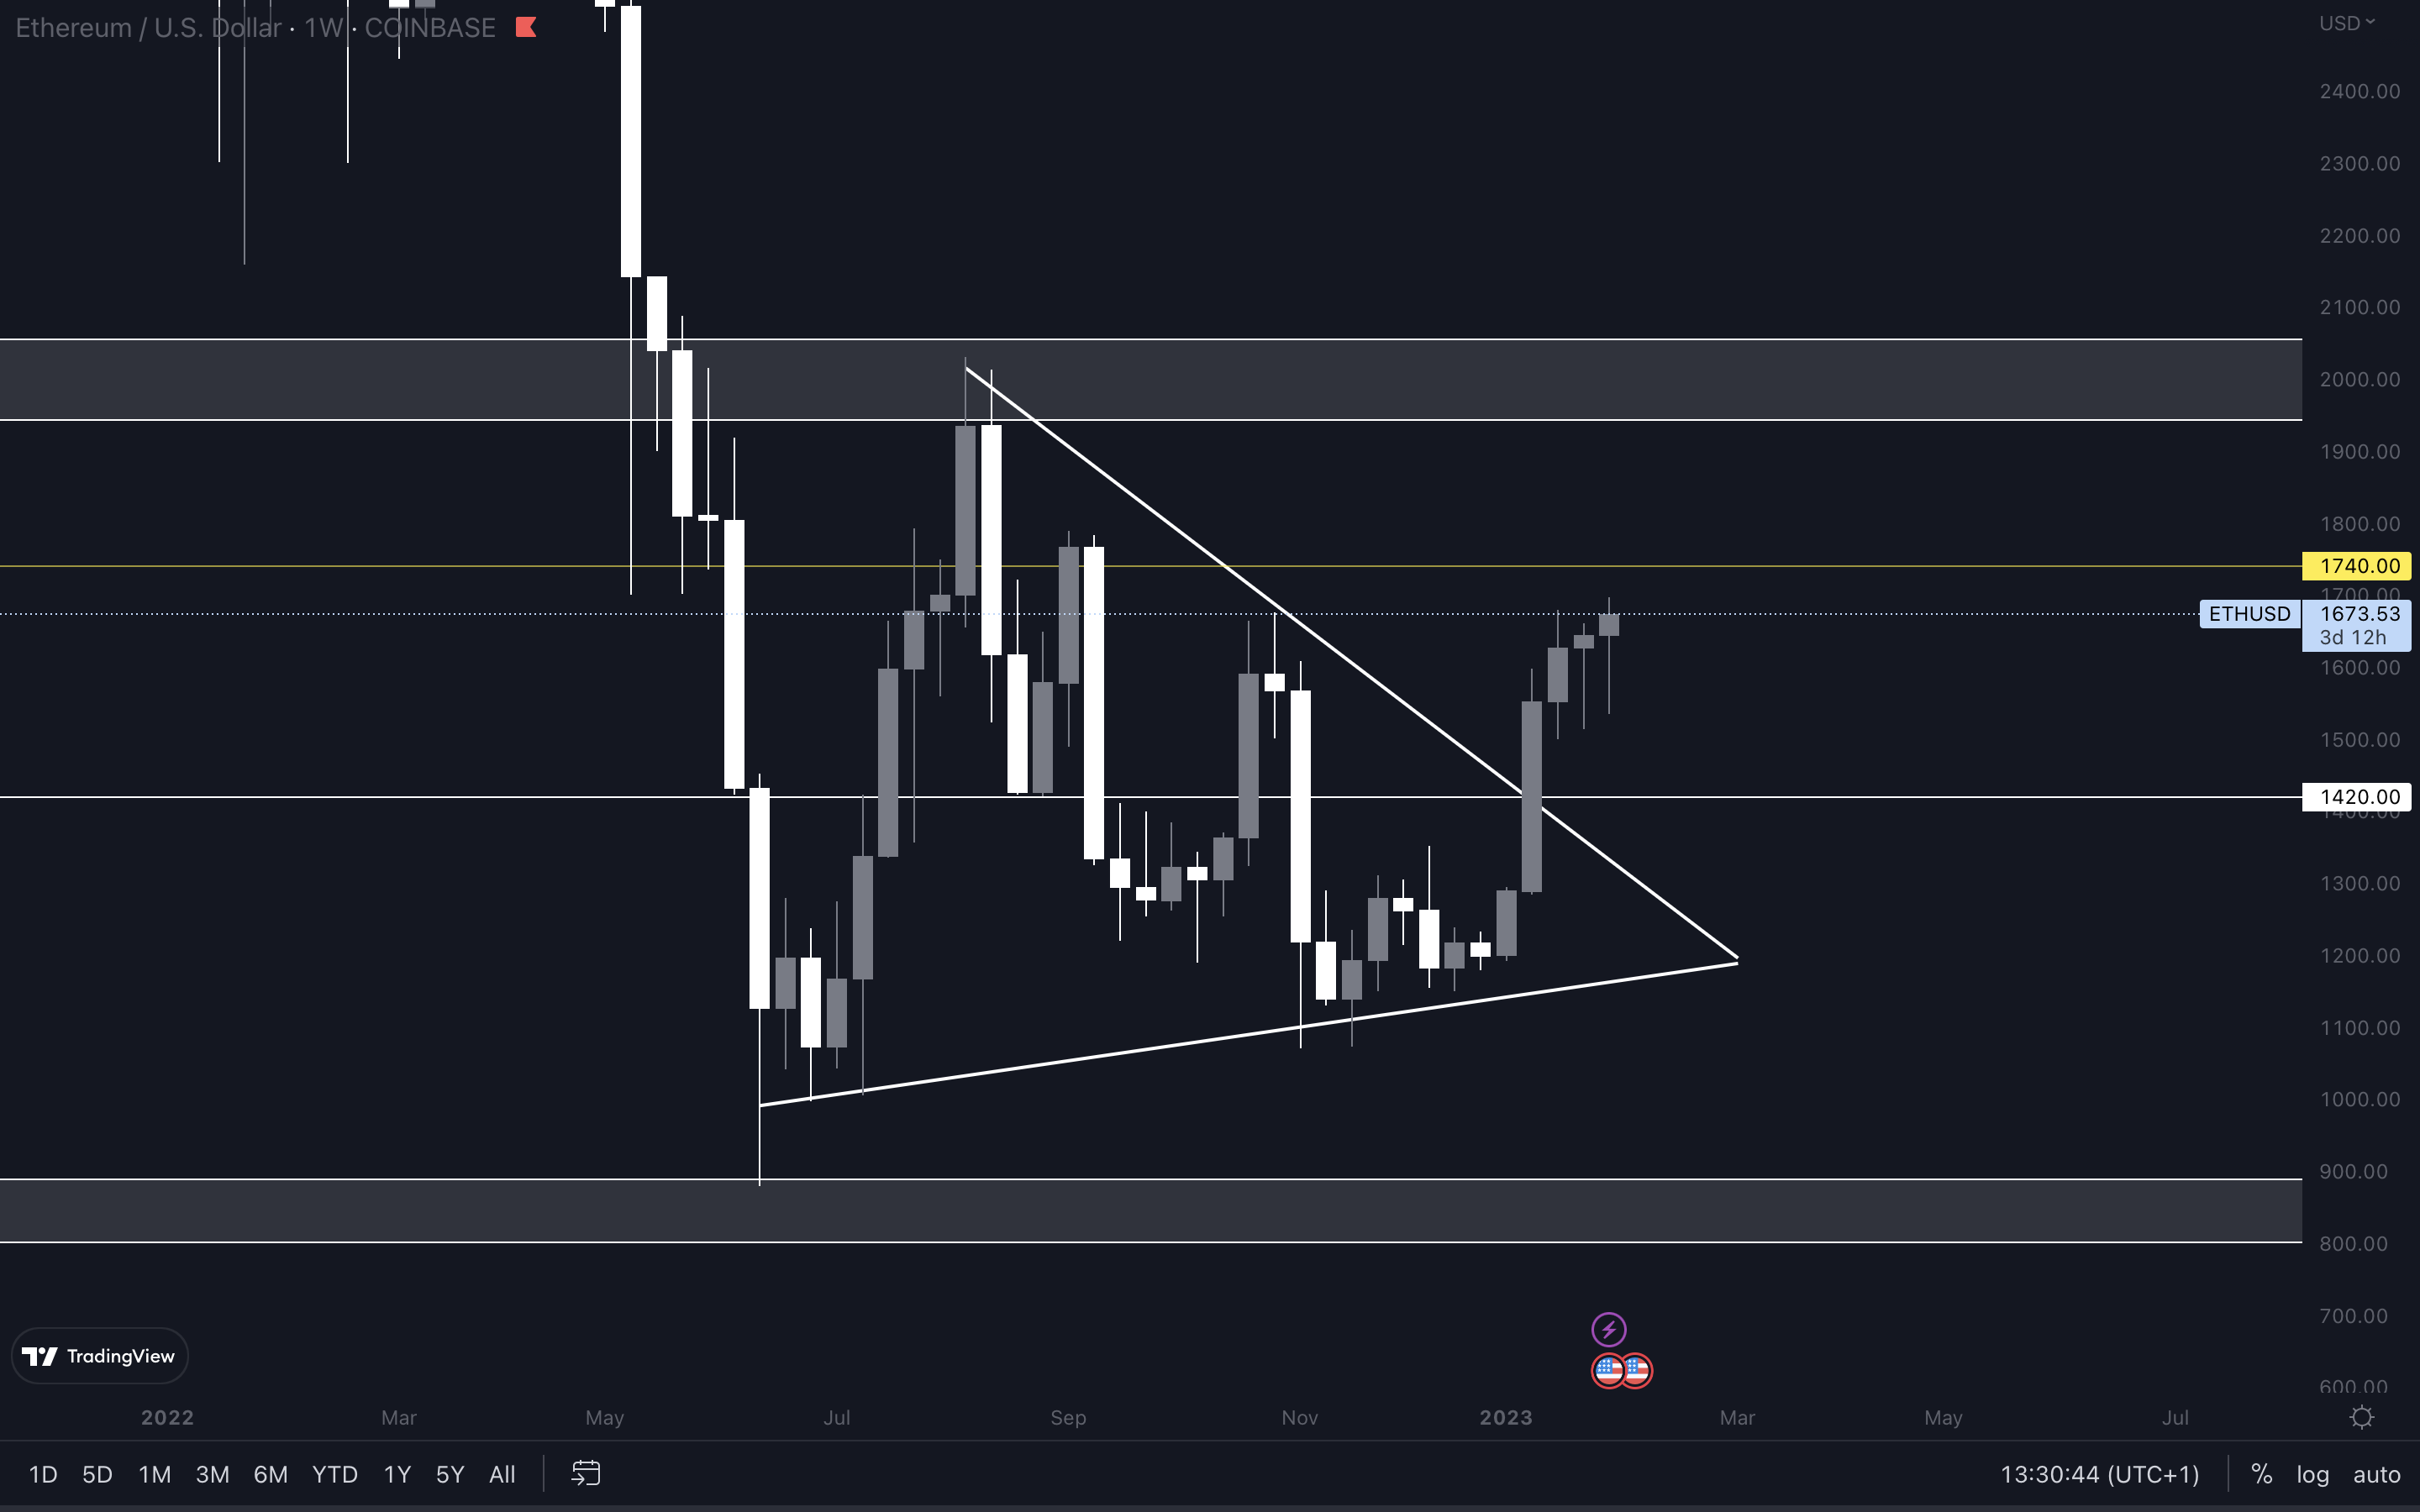
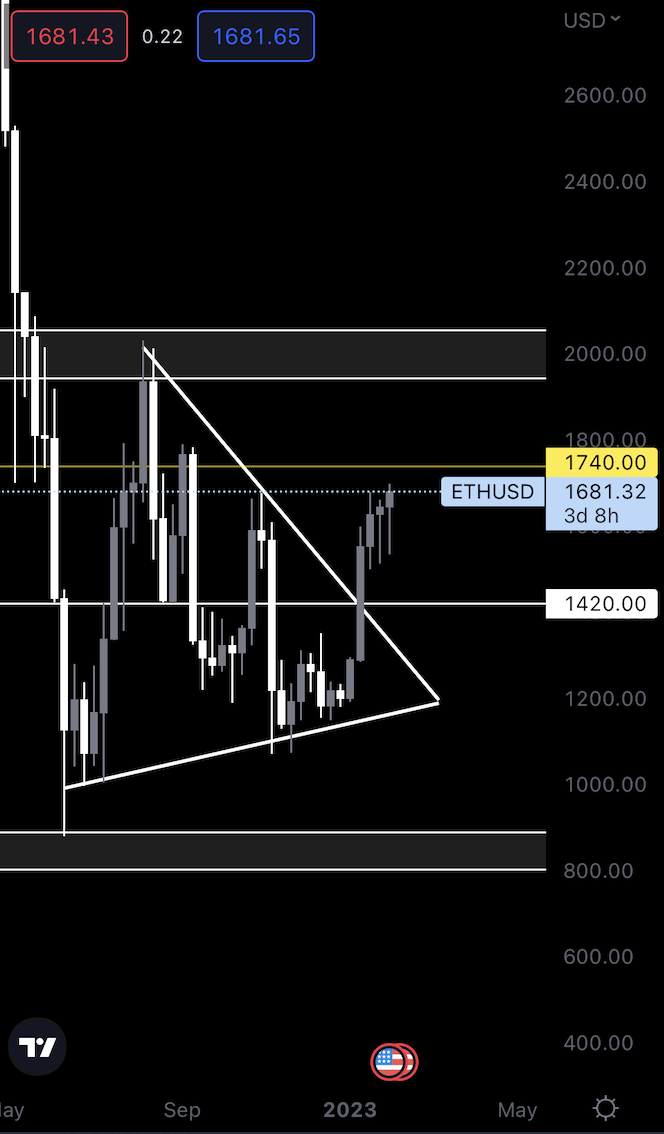 On track for $1740.
Bitcoin and Ether could potentially test their first resistance levels simultaneously, so we could be looking at a market-wide pullback soon. The last two weeks have been choppy - both sellers and buyers are present, but buyers have the upper hand for the time being.
As soon as $1740 is tested, sellers might step in and reject Ether’s price from going higher, which is why we recommend taking profits. After all, it’s better to have some than none at all.
On track for $1740.
Bitcoin and Ether could potentially test their first resistance levels simultaneously, so we could be looking at a market-wide pullback soon. The last two weeks have been choppy - both sellers and buyers are present, but buyers have the upper hand for the time being.
As soon as $1740 is tested, sellers might step in and reject Ether’s price from going higher, which is why we recommend taking profits. After all, it’s better to have some than none at all.
SOL | Solana
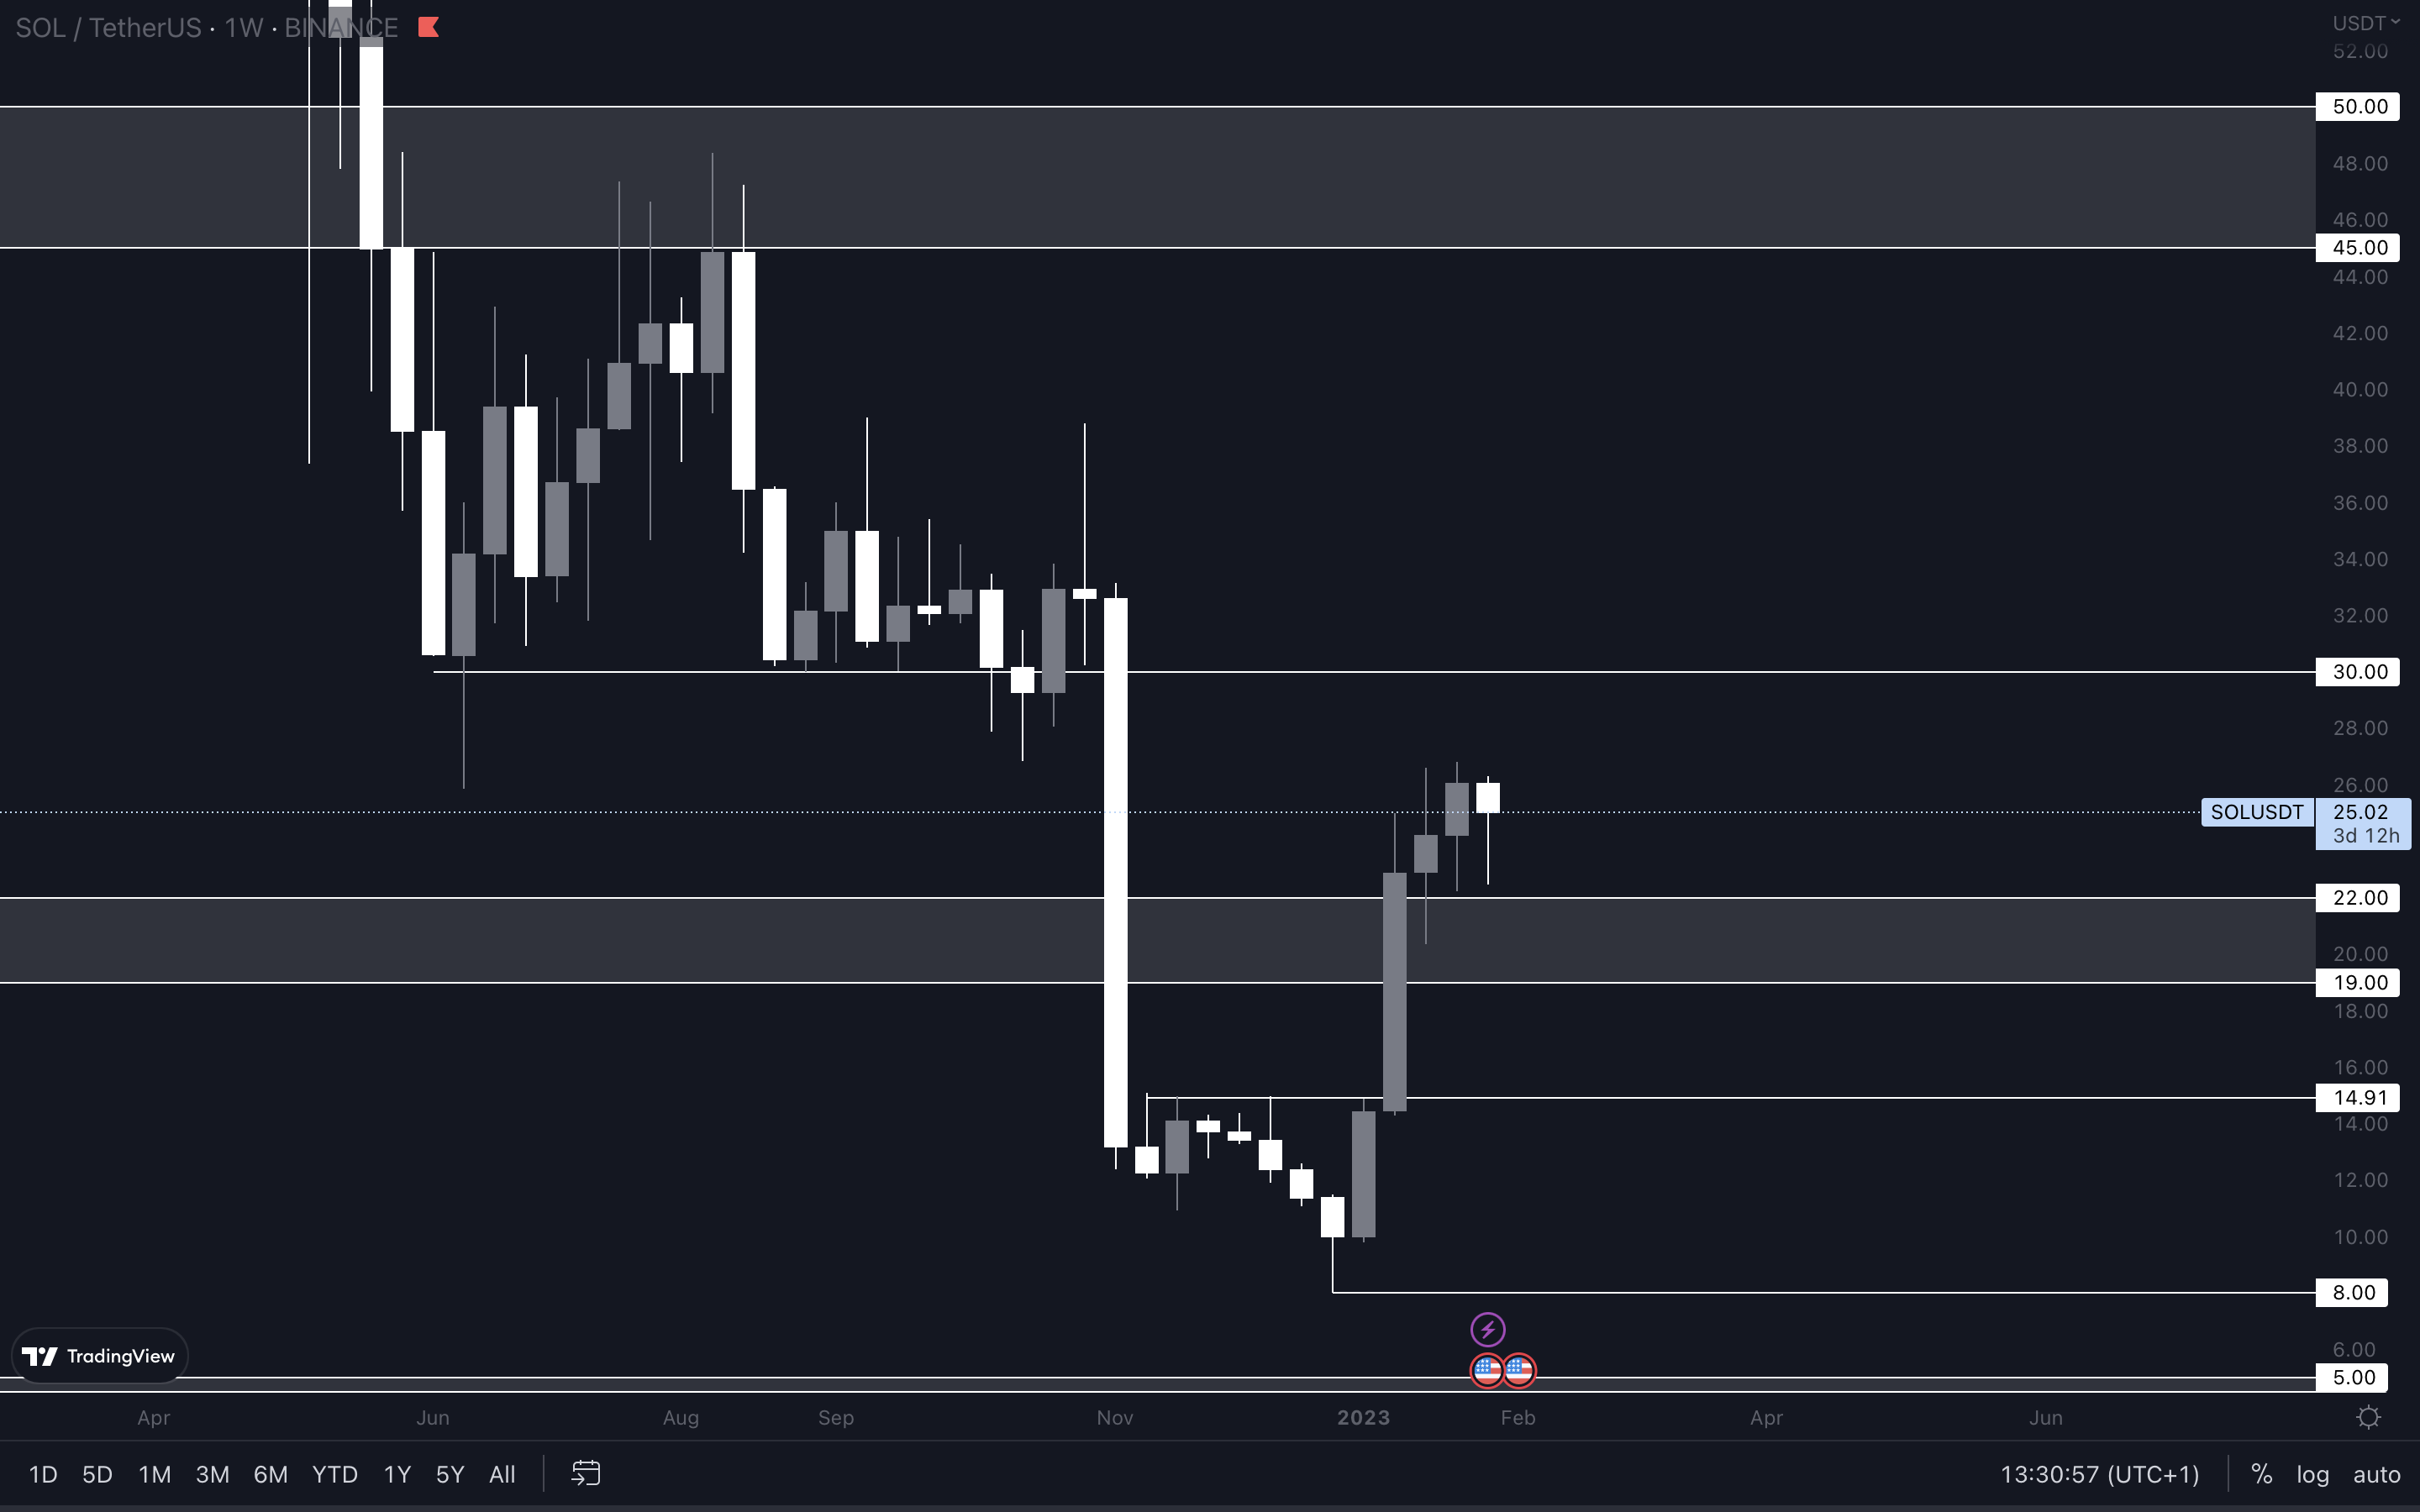
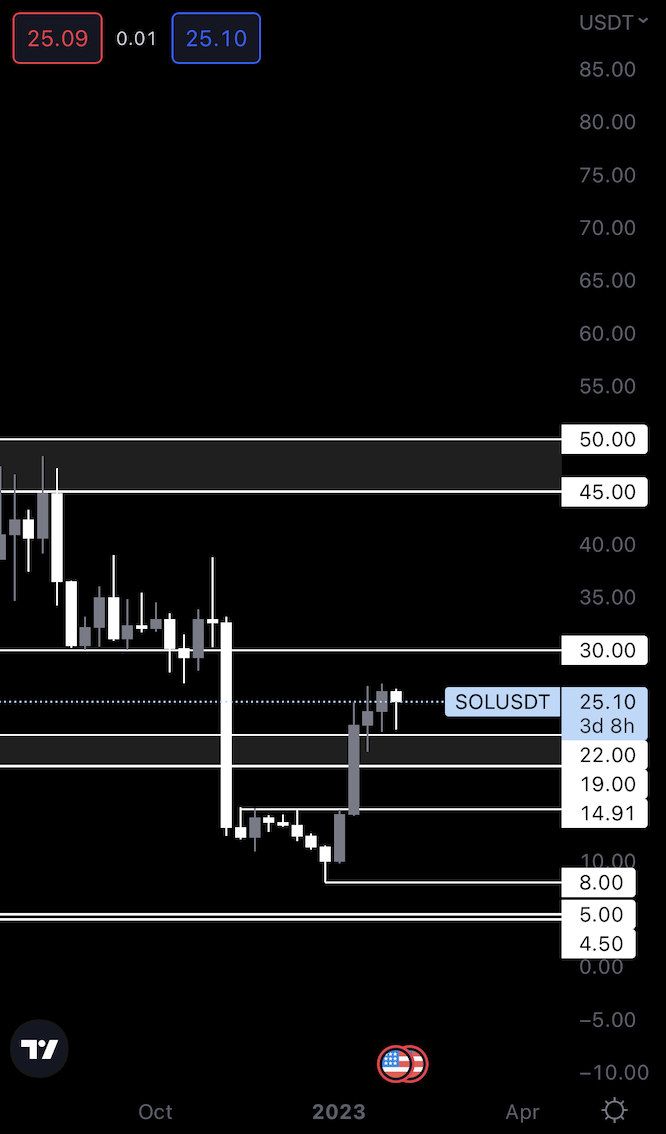 Our short-term view for SOL hasn’t changed because the technicals haven’t changed either. Unless SOL losses $19 as support (weekly closure under $19 is needed for confirmation), then we’ll likely see $30 being tested in the next few weeks.
Ranging between $22 and $30 is possible. If the majors encounter issues in terms of price action (it becomes choppy, and both bullish and bearish candles form all over the place), SOL could consolidate for some time before testing $30. This scenario is unlikely. If it does happen, lower timeframe trading opportunities might appear.
Our short-term view for SOL hasn’t changed because the technicals haven’t changed either. Unless SOL losses $19 as support (weekly closure under $19 is needed for confirmation), then we’ll likely see $30 being tested in the next few weeks.
Ranging between $22 and $30 is possible. If the majors encounter issues in terms of price action (it becomes choppy, and both bullish and bearish candles form all over the place), SOL could consolidate for some time before testing $30. This scenario is unlikely. If it does happen, lower timeframe trading opportunities might appear.
BNB | Binance
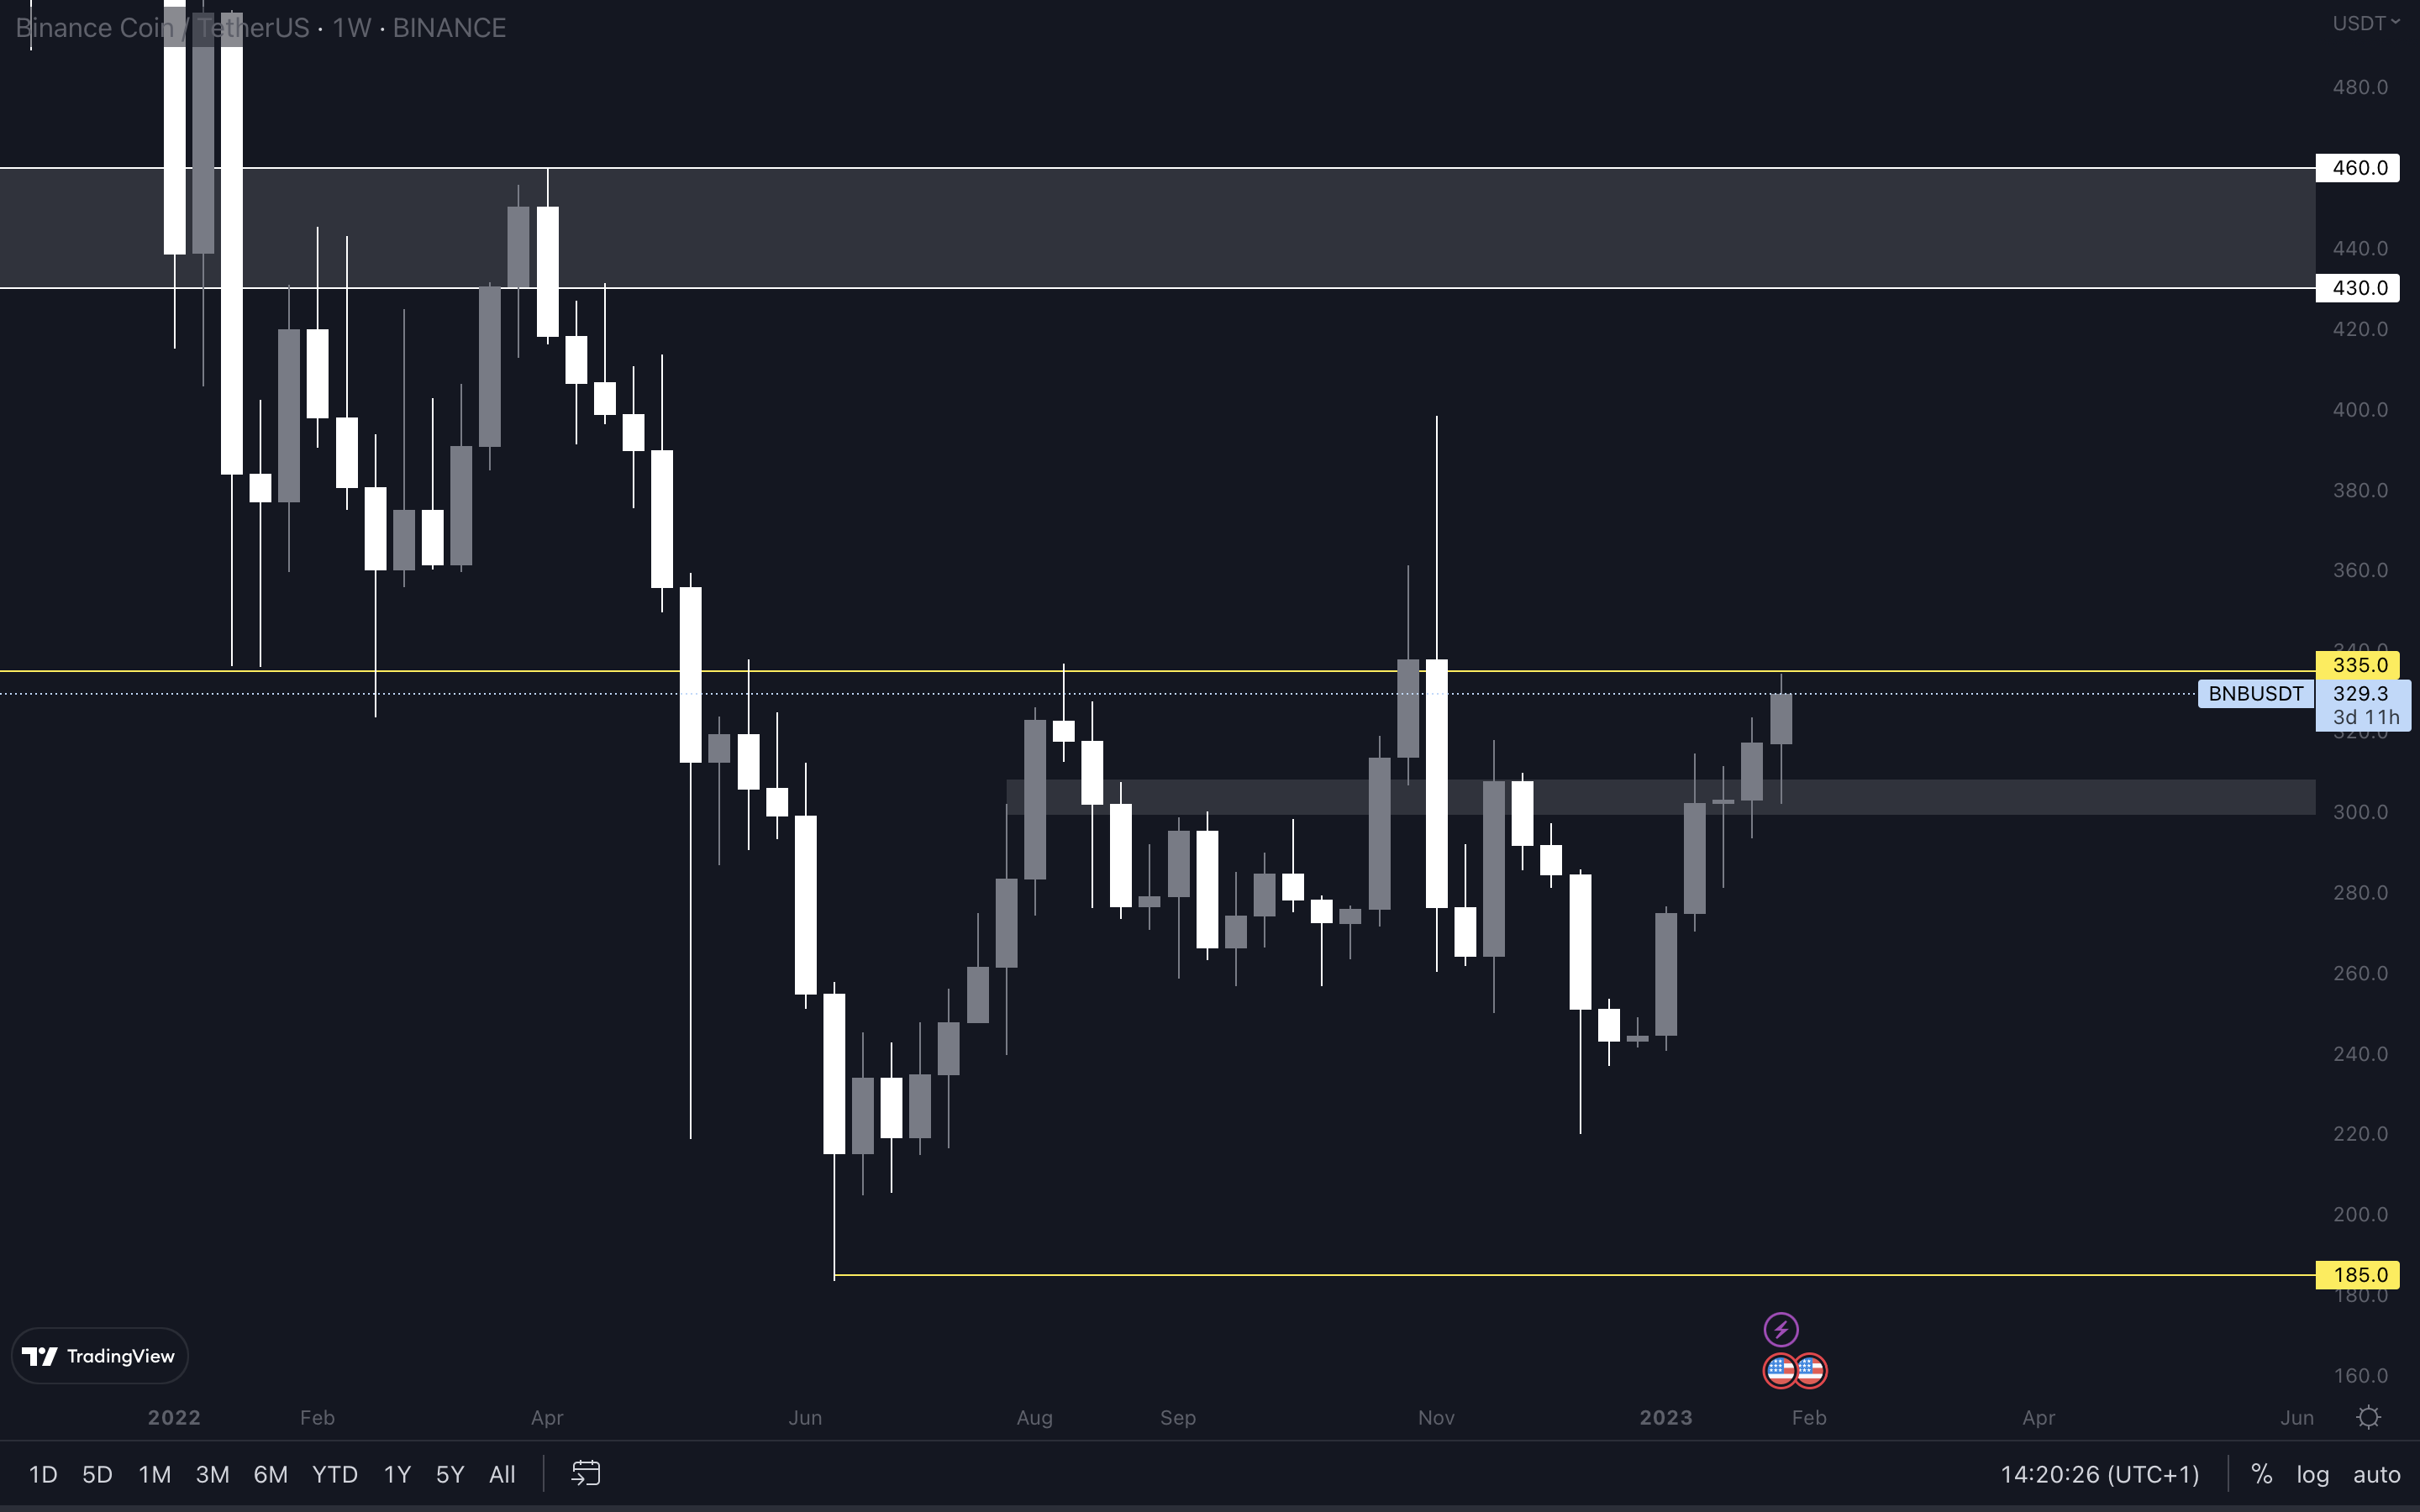
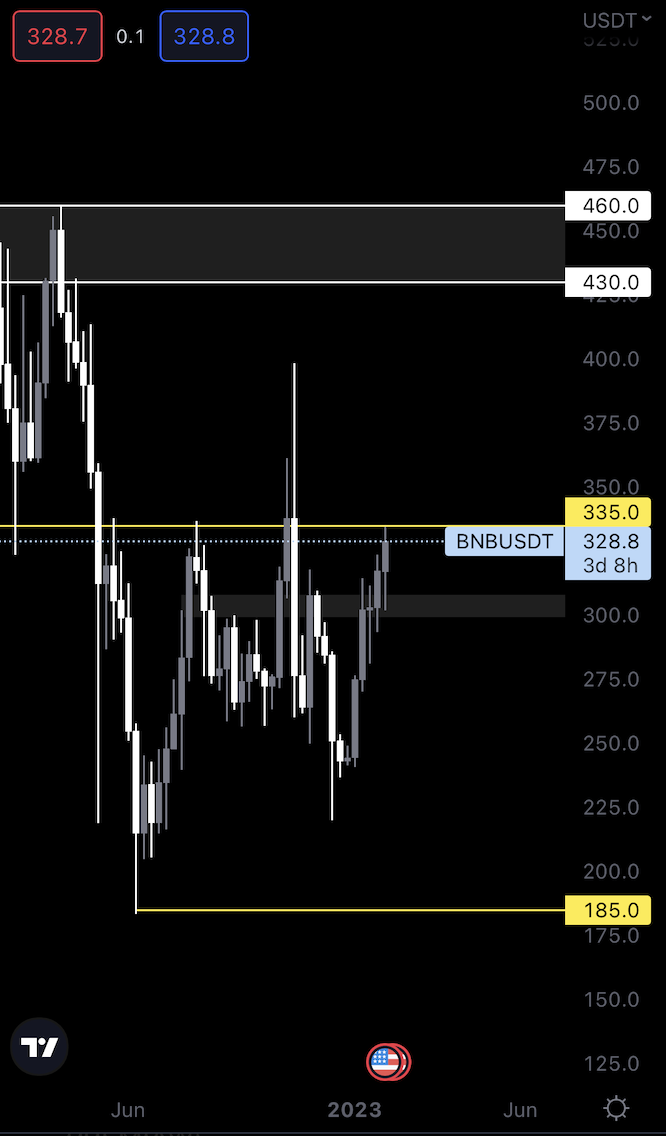 $335 has been reached, and BNB is now at resistance. Given how Bitcoin still has some room to go before it hits the $25,150 resistance level, we can assume BNB will break resistance.
However, as a pullback is expected, BNB will likely come back down and lose $335. Because of this, we wouldn’t recommend jumping on this in case $335 is reclaimed on either the daily or weekly timeframes. We need the breakout to look a lot more convincing before deciding to get in and ride a move higher to the next resistance level of $430.
$335 has been reached, and BNB is now at resistance. Given how Bitcoin still has some room to go before it hits the $25,150 resistance level, we can assume BNB will break resistance.
However, as a pullback is expected, BNB will likely come back down and lose $335. Because of this, we wouldn’t recommend jumping on this in case $335 is reclaimed on either the daily or weekly timeframes. We need the breakout to look a lot more convincing before deciding to get in and ride a move higher to the next resistance level of $430.
UNI | Uniswap
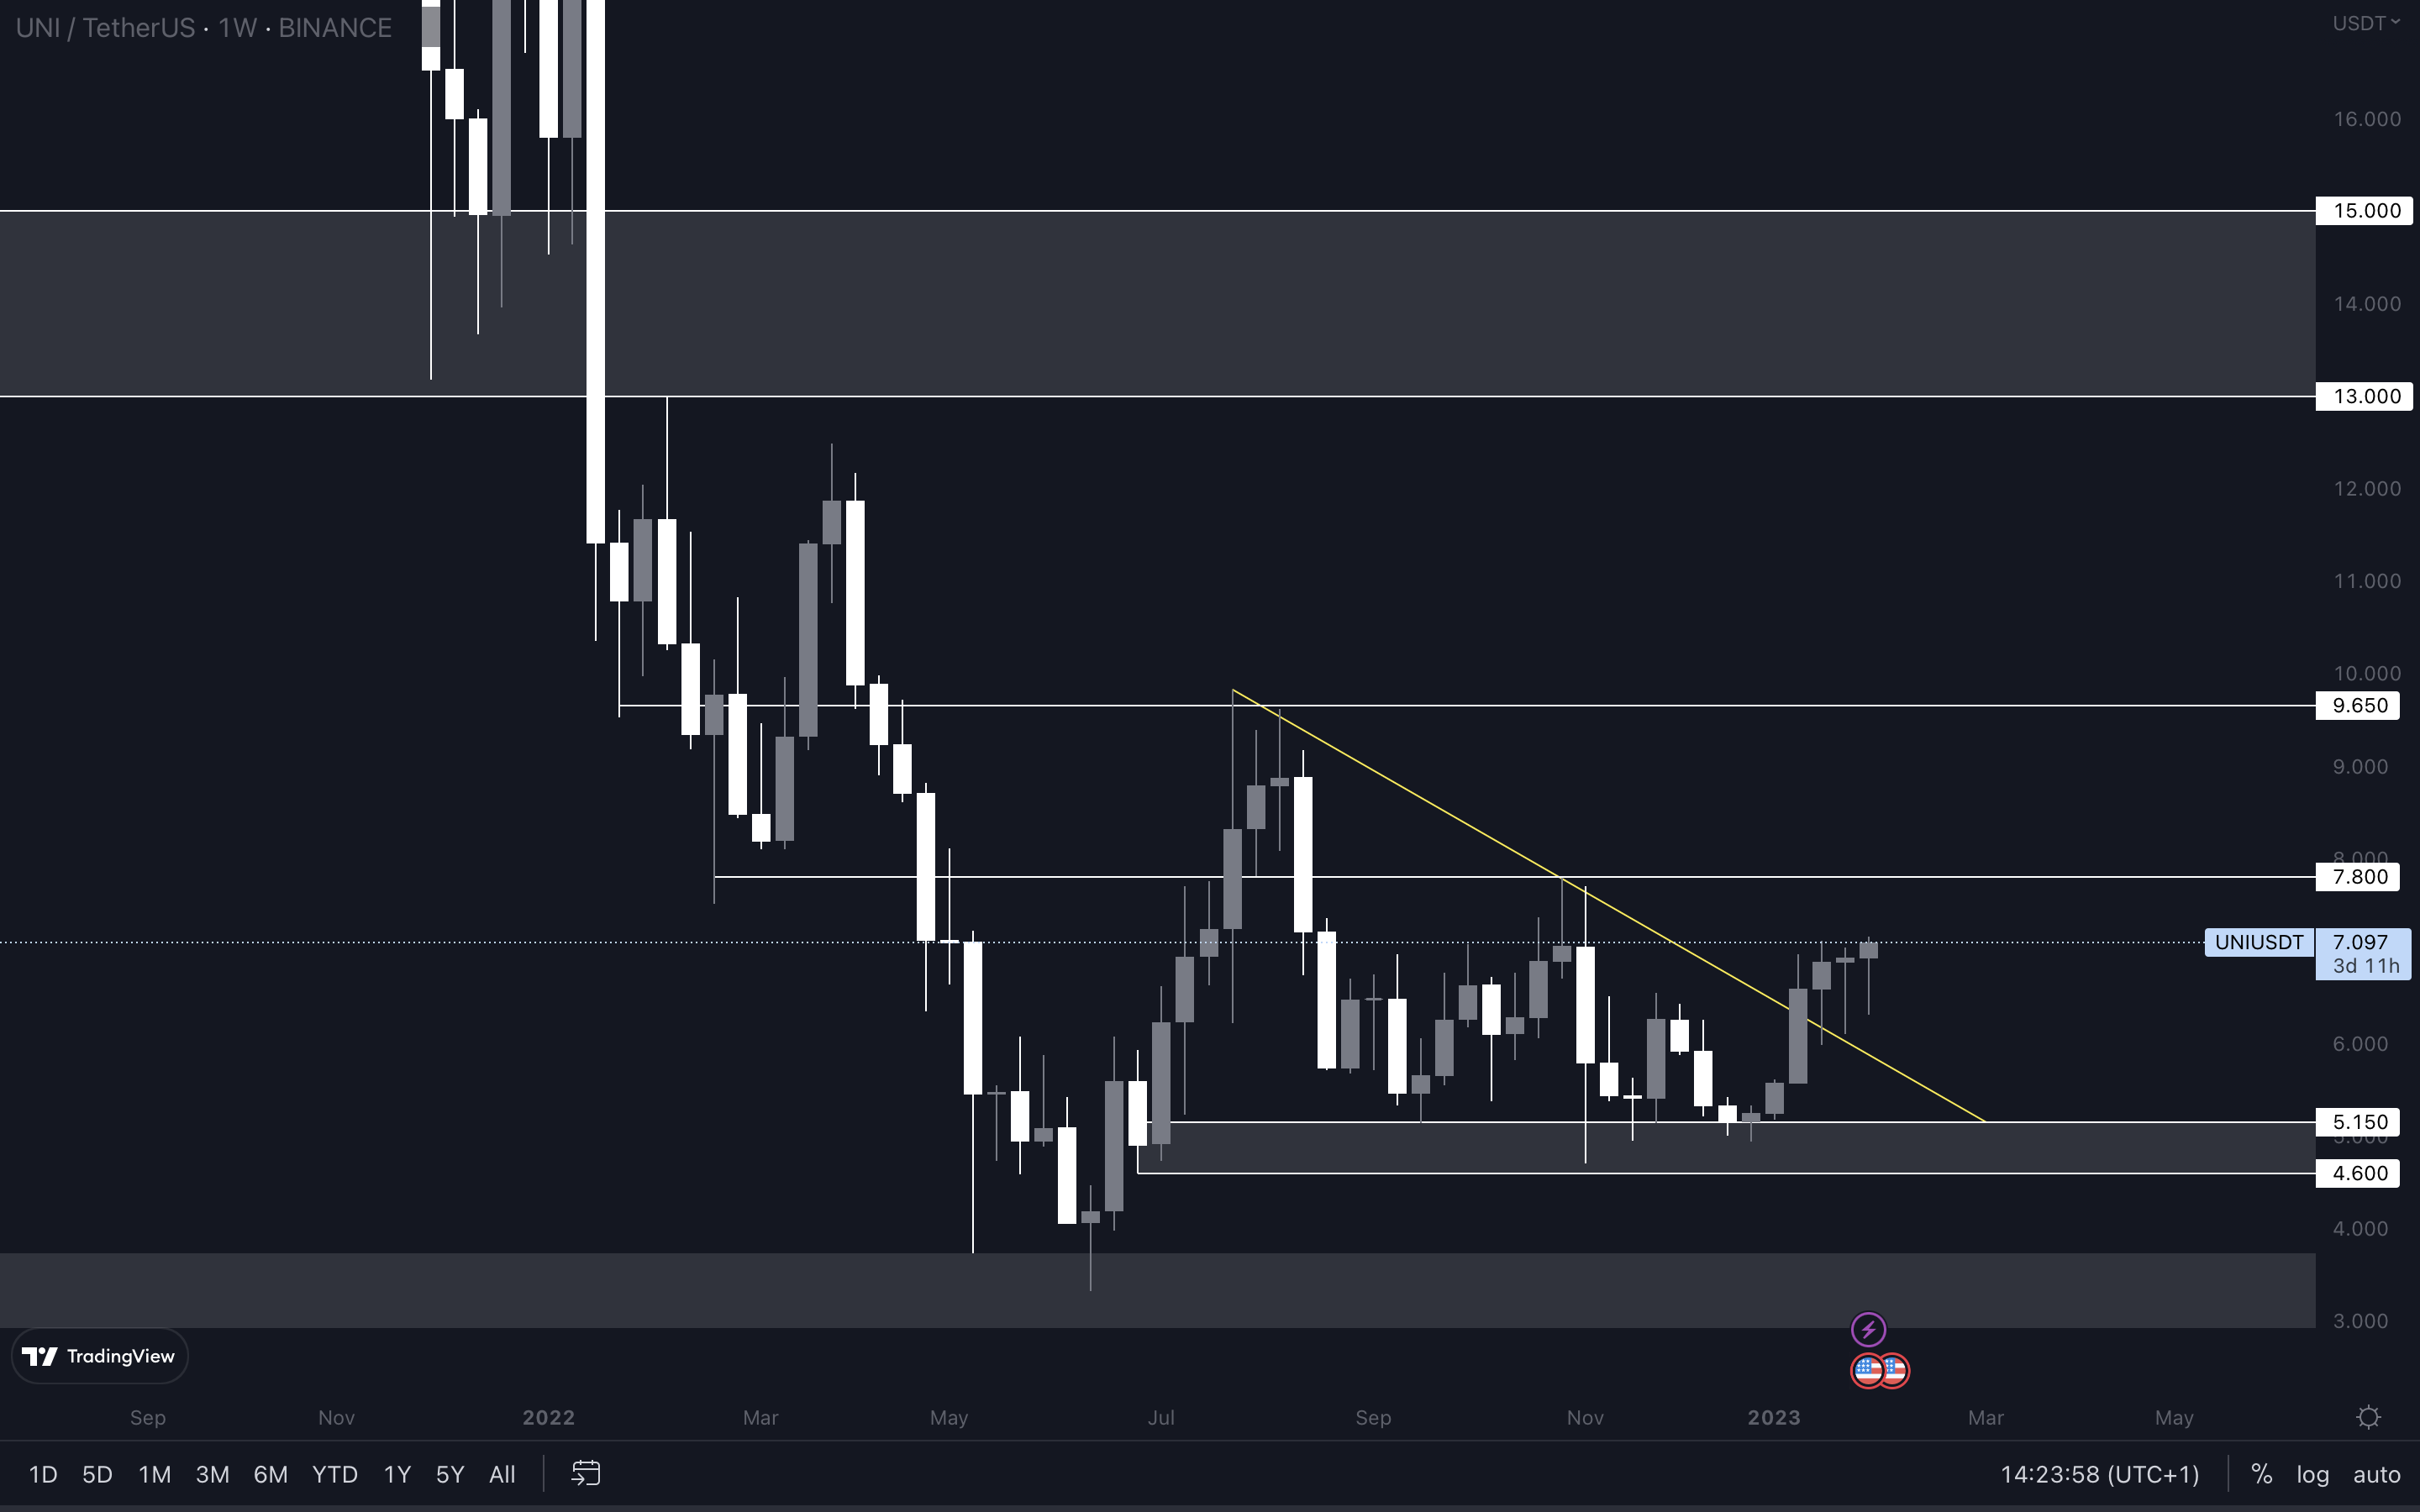
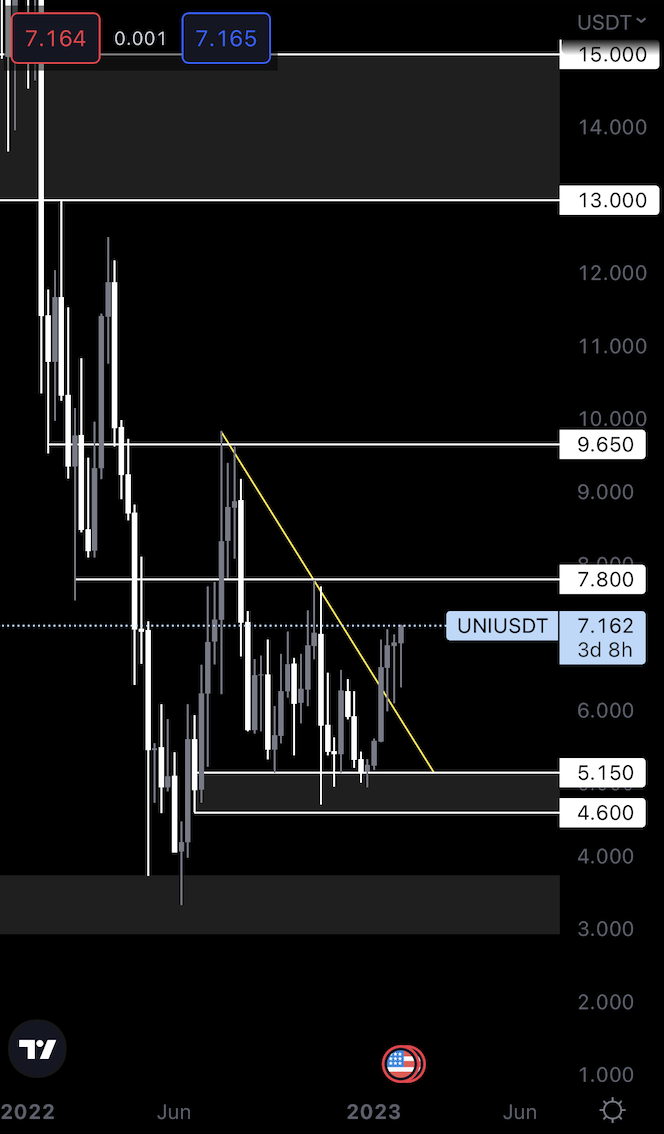 UNI’s road to $7.80 is continuing as expected. At some point soon, UNI will test $7.80, where it will likely see a rejection. This is in confluence with the points made for the majors (Bitcoin and Ether) and the indexes, which we believe will experience a pullback after testing their next resistance levels.
UNI’s January monthly candle closed as a bullish engulfing. Out of all the bullish technical signals out there, a bullish engulfing candle on the monthly timeframe is the most powerful. Bullish engulfings have formed on different assets after January’s closure, including on most of our top picks. This is another reason we believe the rally is not over.
With that said, UNI could see prices higher than $7.80 during Q1 and Q2, specifically $9.65 and $13. These are the next resistance levels for the asset.
UNI’s road to $7.80 is continuing as expected. At some point soon, UNI will test $7.80, where it will likely see a rejection. This is in confluence with the points made for the majors (Bitcoin and Ether) and the indexes, which we believe will experience a pullback after testing their next resistance levels.
UNI’s January monthly candle closed as a bullish engulfing. Out of all the bullish technical signals out there, a bullish engulfing candle on the monthly timeframe is the most powerful. Bullish engulfings have formed on different assets after January’s closure, including on most of our top picks. This is another reason we believe the rally is not over.
With that said, UNI could see prices higher than $7.80 during Q1 and Q2, specifically $9.65 and $13. These are the next resistance levels for the asset.
Cryptonary's take
The rally isn’t over. A pullback is never a bad thing during a rally, it’s the healthiest way to keep the trend going and to leave room for even more upside. Our expectations for when a pullback could start might be wrong, but just know it will happen at some point during Q1 of 2023.
Action Steps
- If your interests lie in the short-term, you might want to take profits.
- For those looking to enter lower, a DCA strategy is your best approach.
- We see no reason to de-risk long-term positions. We believe the bottom has been set.
Recommended from Cryptonary


