Save 23% ($351) & Get a Free 1-1 Call with our Team ⏰ : 0d 2h 59m 44s

This is a market report you probably won't like to read, but one that you should DEFINITELY read!
Managing expectations upfront, we're deep-diving into the suit-and-tie world of economics and finance. Yes, we’d love to keep a casual and chill tone all the time. But sometimes, we gotta go beyond feelings to look at the cold, hard reality of the markets – trading or investing in crypto is serious business.- Where the crypto markets may be headed and how to read the signs
- How monetary policy could create volatility for crypto
- When the next crypto downturn could strike
- Target buy zones for Bitcoin and altcoins
It might even buy or sell assets or do some other fancy moves. And the bond market? It's grooving to every beat from the Fed.
But then comes the moment of truth - the equity market gets a makeover based on the bond market's new dance moves. Risk is in the air, and guess who's catching the vibe?
Yep, Bitcoin! And where Bitcoin goes, the Altcoins follow suit.
Everything we’ve just described is the macro -it’s like a director of a blockbuster movie, and guess what? Bitcoin has a starring role!
Our October market report assesses where the macro has been, where it seems to be going, and what this may likely mean for Bitcoin and Alts.
Ready to understand the market? LFG!!!
Disclaimer: Not financial or investment advice. Any capital-related decisions you make are your full responsibility.
Breaking down the Macro
18 months ago, the Federal Reserve began increasing interest rates in the U.S. to squash demand and bring inflation down. Since then, we’ve seen an increase of over 550 basis points in interest rates, and inflation has come down from north of 9.0% to 3.7% now.U.S. headline inflation
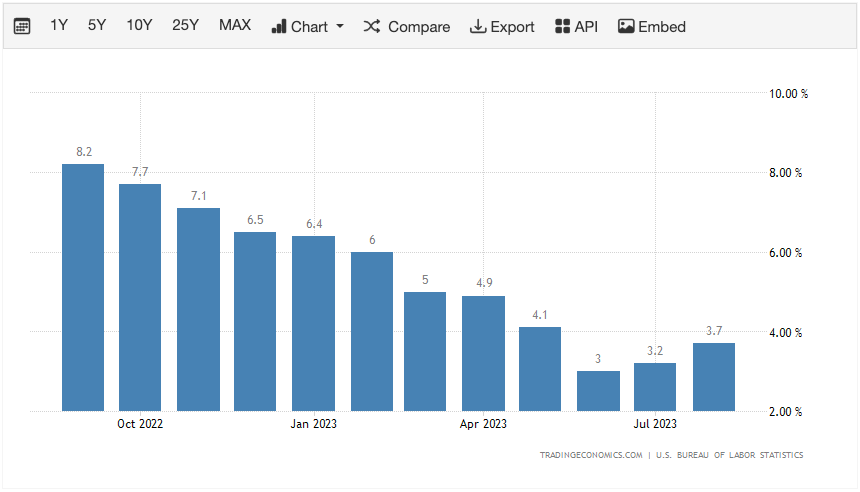
The FED’s first aim was to get rates high enough that the real rate was meaningfully restrictive, i.e., the interest rate is greater than the inflation rate. Since theFedfront-loaded with 75 basis point rate increases over 4 consecutive meetings, we now potentially find ourselves at a level where we’re sufficiently restrictive. Interest Rates at 5.5% > Inflation Rate at 3.7%.
Fed rate hikes
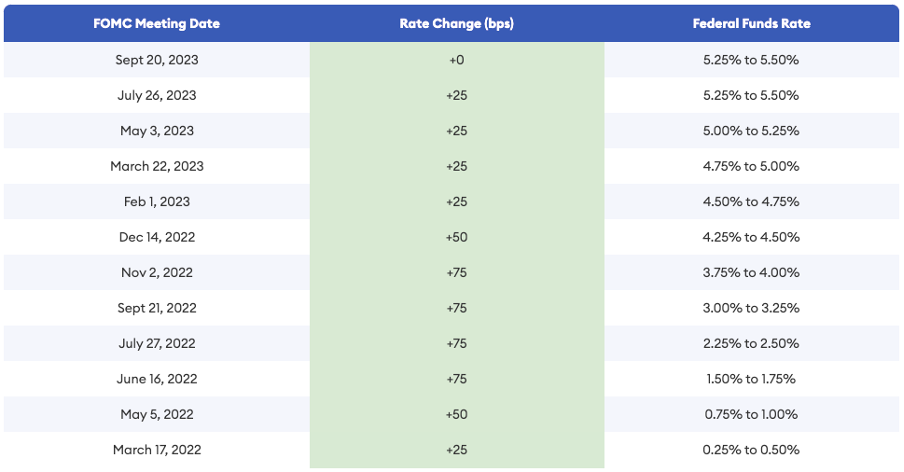
In the above, we can see how quickly theFedraised rates in this rate hike cycle, and all this tightening comes with a lag, so it’s very likely that the economy isn’t feeling the full effects of it yet. Due to this, theFedhas leaned into its “higher for longer” narrative.
This is theFedsaying that rather than cutting rates a lot next year, they will hold them at a higher level than what the market was pricing in, so less rate cuts. We saw this at the most recent FOMC meeting, where the new Summary of Economic Projections was released.
The chart below shows several different metrics and the FED’s expected changes in those metrics from the SEP they released in June to the SEP they released last week (September’s release). Pay special attention to the data in the bottom two rows.
Fed’s economic projections – September
The Fed has upped its projections for the rate of interest in 2024 and 2025 by 50 basis points each year – from 4.6% to 5.1% in 2024 and from 3.4% to 3.9% in 2025. These are fewer rate cuts than what was originally expected – but it aligns with the higher for longer narrative.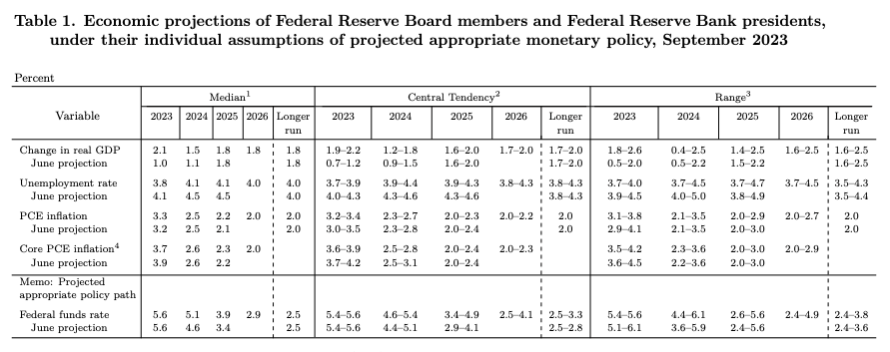
Following this, Bond Yields and the Dollar (DXY – Dollar Index) re-priced higher. The Fed is now restrictive regarding its real rate. By the way, a stronger dollar is naturally tightening in itself – it makes U.S. exports more expensive in relation to the rest of the world, and corporate revenues suffer as a result.
The Fed is currently in an okay spot. It has done over 500 basis points of tightening to bring inflation back to its mandated level of 2.0%. Inflation has also gone from 9.0% to 3.7% (a low of 3.0% back in June 2023).
And so far, the Unemployment Rate has stayed between 3.4% and 3.8%, which is historically low.
It was predicted that with the Fed raising rates by 500 basis points, the labour market would take a battering. For one, as the effects of the Fed’s tightening become more prominent, the worry is that the consumer will start to feel the pinch, they’ll spend less, corporations’ revenues will fall, they’ll then lay workers off to cut costs to maintain profit margins, and then, the Unemployment Rate will soar.All while inflation remains well above the FED’s 2.0% mandated target. This would then put the Fed between a rock and a hard place. For now, it can tighten as the labour market can take it. But, as soon as the labour market begins to break, it will be very hard for the Fed to continue tightening while the consumer and businesses are being walloped and are crying out forFedbailouts.
How is the consumer holding up?
A chart that was recently released by ‘J.P. Morgan Equity Macro Research’, perhaps sums up the current state of the consumer.Household excess savings are exhausted
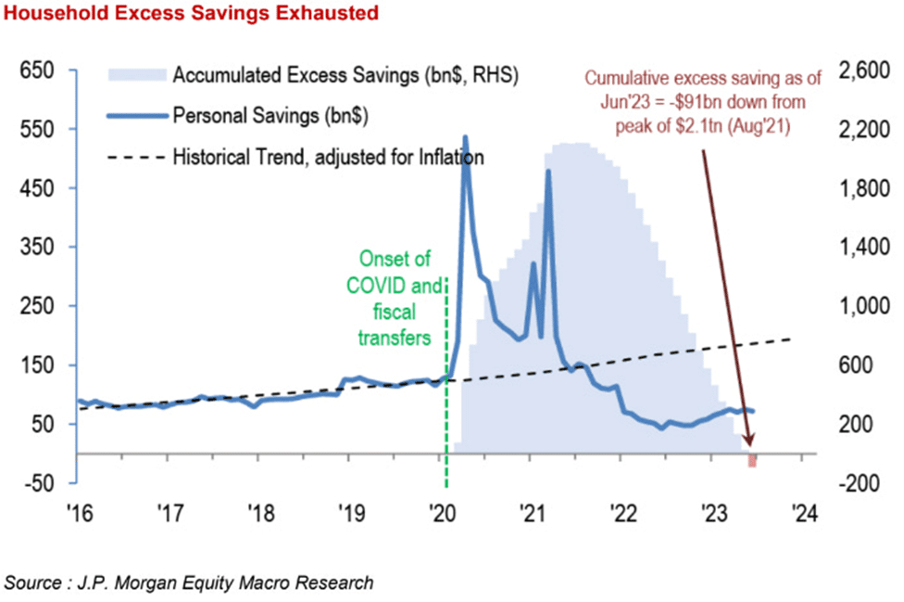
Following COVID-19, the consumer was able to amass large amounts of savings due to theFedstimulating the economy with liquidity injections into markets (the buying up of Bonds and Mortgage-Backed securities) and providing ‘Economic Impact Payments’ to all adults in the US.
We can now see from the above that not only has Household Excess Savings fallen below its historical trend, but it is now negative. Accumulative Household Savings is down -$91 billion.
So, the excess savings are gone, but are consumers now turning to their credit cards, and what is the stress level there?
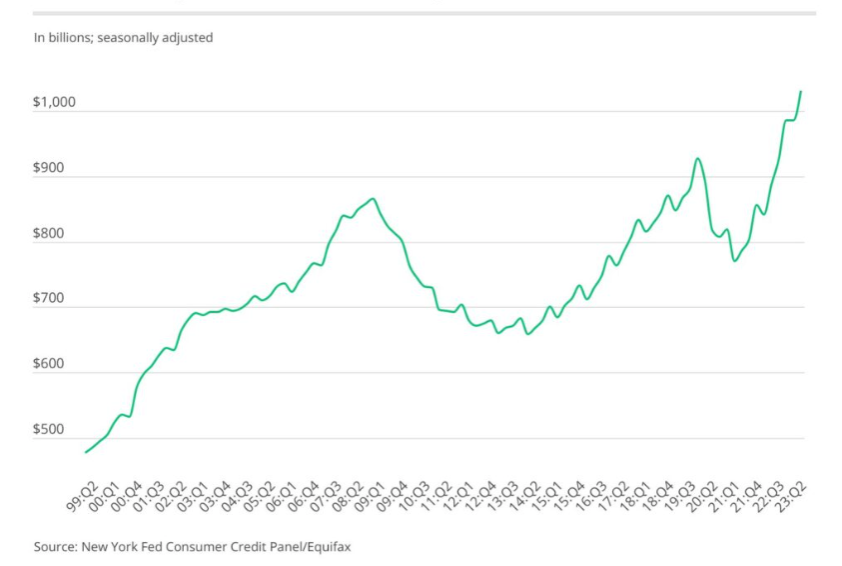
Total outstanding credit card balances since 1999
In 2008, soaring credit card debt finally peaked and turned down drastically in the aftermath of the global financial crisis. In the years after COVID-19, we can see that credit card debt has risen at an even greater pace than it did before 2008/the global financial crisis.
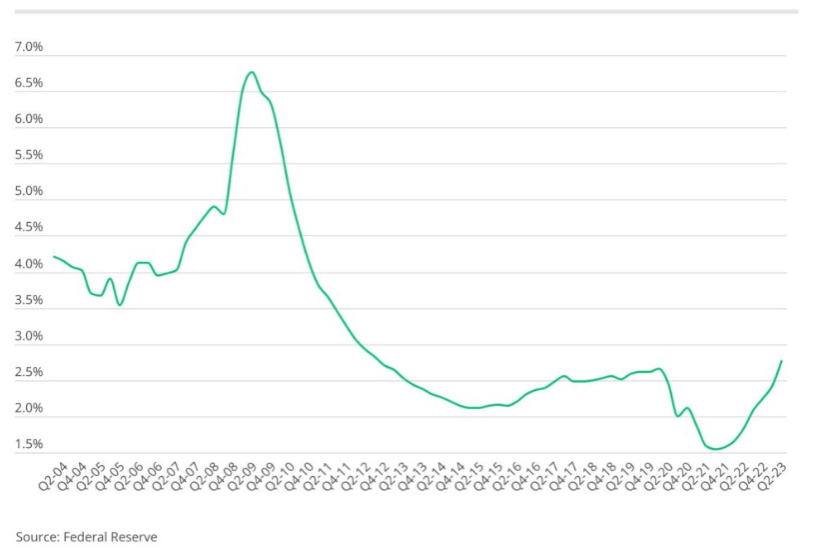
Let’s look at delinquencies (see below chart). We can see that the percentage of Americans who are currently at least 30 days delinquent has increased from 1.5% in Q1 2022 to 2.75% in Q2 2023 –a relatively rapid increase over the 15-month period.
However, this metric has come from historic lows, again due to the COVID-19 stimulus giving consumers excess cash, meaning they had fewer reasons to resort to credit cards. So, this is a metric in which we can see the tightening, but it may take further months to see this metric soar meaningfully higher.
Percent of total outstanding credit card balances at least 30 days overdue
So far, we’ve looked at credit card balances and delinquencies from a zoomed-out view. But, in assessing the effects of the FED’s aggressive tightening on the consumer, we need to take a more zoomed-in view.
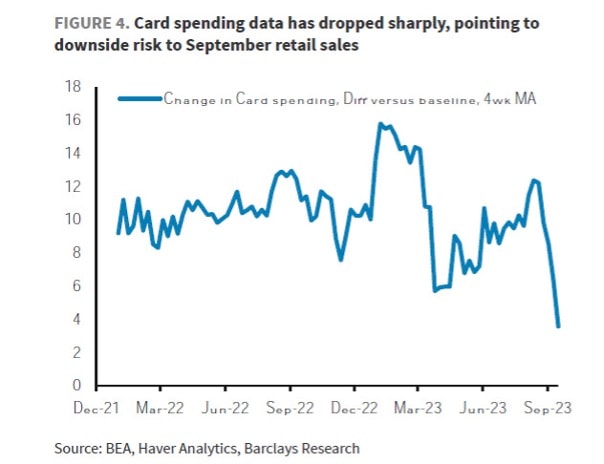
Change in consumer card spending (difference versus the 4-week moving average baseline)
Barclays Research recently released the above chart showing the significant decrease in card spending from consumers over the past two months.
 Consumers were propped up by the Fed stimulus during COVID-19, which enabled them to spend and save more. Simultaneously, credit card debt and delinquencies decreased because consumers were less reliant on credit cards.
Since the Fed began raising interest rates and began its quantitative tightening program, household excess savings have dwindled to negative levels. We’ve also seen both credit card debt and delinquencies increase significantly. We’re now also beginning to see that card spending is decreasing.
So, in putting all of this together, the consumer is beginning to struggle. It is likely that the full effects of the FED’s tightening have not been wholly felt as of yet. We would say it’s now not so much a case of if the consumer will crack but when the consumer will crack. They have arguably already begun to.
It is our feeling now that the key data points the Fed and markets will be watching are labour market data. If the labour market begins to break, that’ll indicate that a recession is starting and underway.
Labour market data
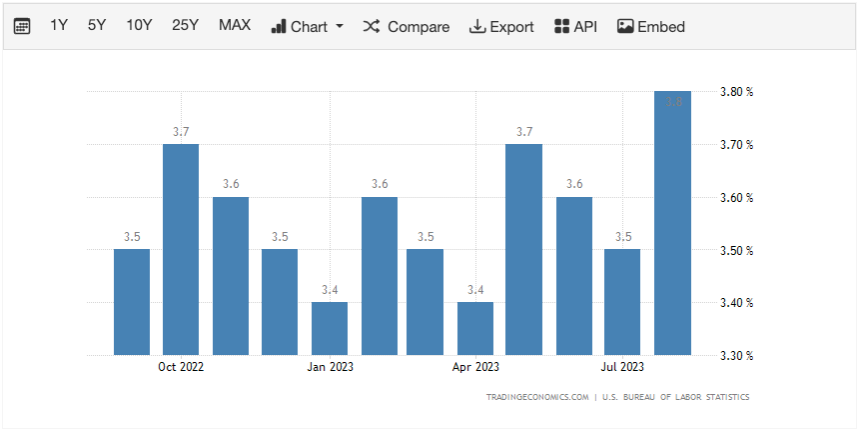
At the time of writing, the headline labour market data points are indicating contrasting signals.Over the past 12 months, the Unemployment Rate has stayed between 3.4% and 3.8%, although the 3.8% reading came in in August, and the data suggests another 3.8% reading for September’s data.
U.S. unemployment rate
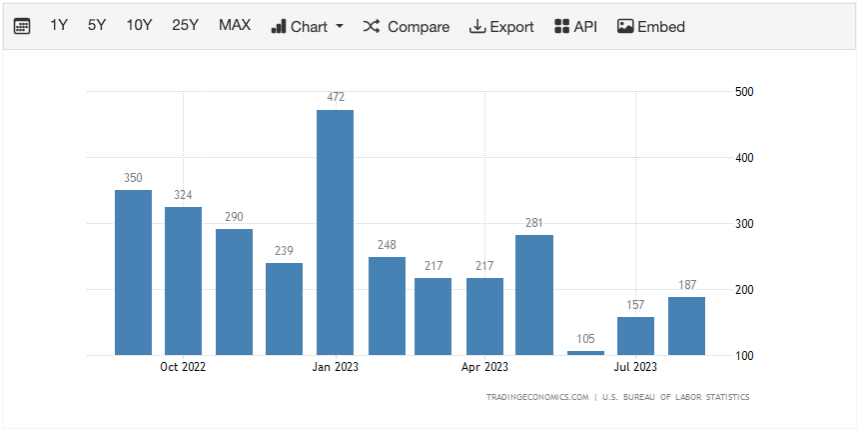
Over the same 12-month timeframe, Non-Farm payrolls (the number of jobs added) have downtrended. U.S. nonfarm payrolls
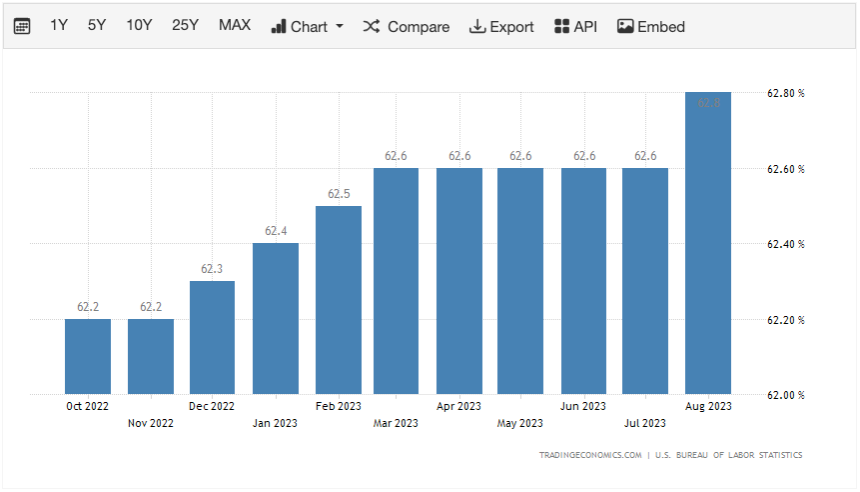
Alongside this, the labour force Participation Rate has increased, indicating more people are returning to work. September’s data is expected to come in at 62.9%, a further increase.
U.S. labour Force participation rate
The above 3 charts suggest that the labour market is beginning to weaken but not yet breaking.
Going forward, it’s important to continue tracking these 3 metrics, but 2 metrics that may give us more forward-looking indications of whether the labour market will break and a full-blown recession is upon us are Jobless Claims and JOLTS.
Jobless Claims are the number of Americans filing for unemployment benefits. Over the past few months, Jobless Claims have decreased; over the past year, it remains relatively flat. You’d expect in a weakening labour market that, the number of Jobless Claims would be increasing. If we see the Unemployment Rate, Non-Farm Payrolls, and Participation Rate weaken, we’d expect Jobless Claims to increase. This is a metric that moves late into the process.
U.S. jobless claims
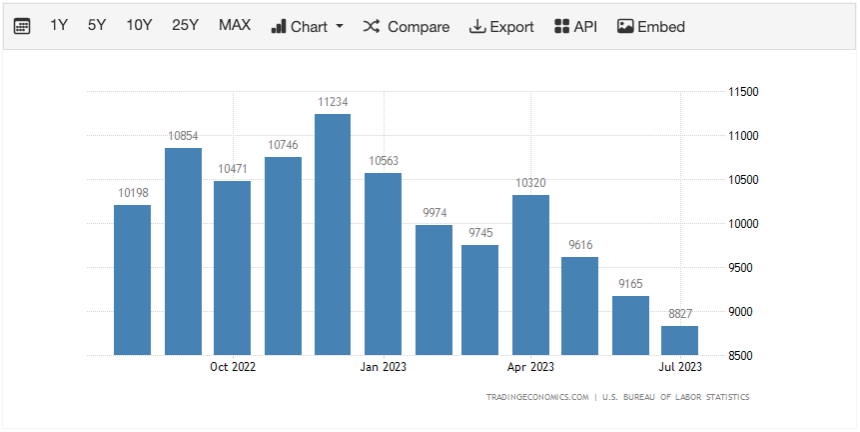
The second metric is JOLTS. This is the number of job openings, i.e., how many employers are looking to recruit more staff and, therefore, have jobs open/available.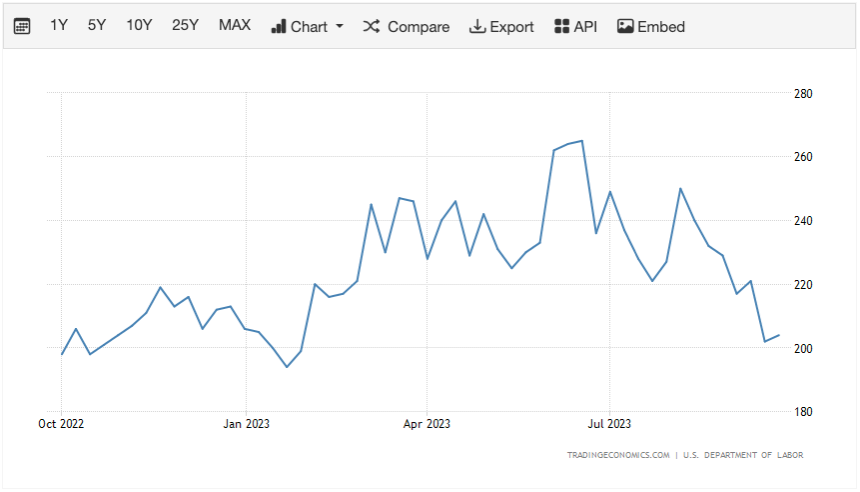
We can see in the chart below that this is in a steady downtrend, meaning fewer open jobs available. This is to be expected following a 500-basis point increase from the FED. If the interest rate dramatically increases, this means the cost of borrowing is more expensive. Therefore, businesses are less likely to borrow money (for the expansion of their business, for example) and, therefore, are less likely to need more staff.
U.S. JOLT’s job openings
Currently, it looks as if the consumer is beginning to feel the pinch of the Fed’s tightening but is not yet broken to the point where they need a bailout.
Historically, when the labour market has broken, it has broken quickly, having shown weakness for a long period up to the breaking. It’s very possible we’re currently in that period of weakening before the breaking.
In the Summary of Economic Projections (third chart in this report), the Fed has projected that the Unemployment Rate will be at 4.1% in 2024. In July 2023, the Unemployment Rate was at 3.5%. Now, every time the Unemployment Rate has risen by 0.5% in a 6-month period, the US has entered a recession. August’s reading was 3.8%. Something to keep a close eye on.
Does all the above mean that a recession will happen, and if so, when?
Recessions and an inverted yield curve
One of the best indicators of predicting prior recessions has been the US Yield Curve inverting.A yield curve inverts when long-term interest rates drop below short-term rates. i.e., investors are selling short-term bonds and buying long-term bonds due to them becoming pessimistic about the economic prospects/growth in the near term. Therefore, they’re more interested in taking on risk in the long term but reducing their level of risk in the near term.
If we look at the last 7 recessions, a yield curve inversion preceded all of them. Below, we can see how many months after yield curve inversion, the US fell into recession:
- 1973 to 1975 (7 months after inversion).
- 2000 to 2002 (10 months after inversion).
- 1981 to 1982 (11 months after inversion).
- 1970 to 1971 (14 months after inversion).
- 1990 to 1991 (16 months after inversion).
- 1980 (16 months after inversion).
- 2007 to 2009 (18 months after inversion).
Macro summary
Since the Fed began raising interest rates 18 months ago, demand and, therefore, inflation have come down.It was expected that a 500-basis point increase would really hit the labour market and potentially drive the economy into a recession. Despite the US labour market showing weakness in some areas, it hasn’t broken yet, and the U.S. has not fallen into a recession.
However, much of the data suggests that we’re beginning to enter a critical period where there is likely to be an inflection point.
As the macro data currently presents itself, with forward indicators positioned as they are, it’s possible that a recession may be just a few quarters away. Therefore, it would be prudent not to be fully allocated to risk assets with these potential major headwinds upon the near-term horizon.
With the macro context outlined above, we will now assess Bitcoin’s on-chain data to assess where a good long-term entry price for Bitcoin may be.
On-chain Data
We look at on-chain data to assess Bitcoin over many metrics as to whether it is undervalued or overvalued relative to its history.But, as this is our first monthly report, we have placed an emphasis on the macro. Therefore, we will keep the on-chain reasonably simple and analyse two key metrics with the goal being to identify price levels which could make for attractive long-term buying opportunities for Bitcoin.
The first of these is the Realised Price. The chart below assumes that we are correct in our macro-outlook and that a recession will likely come. So, we are identifying price levels that are lower than Bitcoin’s current price $28,250).
Realised price
The Realised Price is the average cost basis of all UTXOs (Bitcoins) at which they were last moved on-chain. Historically, the Realised Price has acted as a support for Bitcoin’s price and a good opportunity for investors to buy Bitcoin. The current Realised Price is $20,290, well below Bitcoin’s current price of $28,250.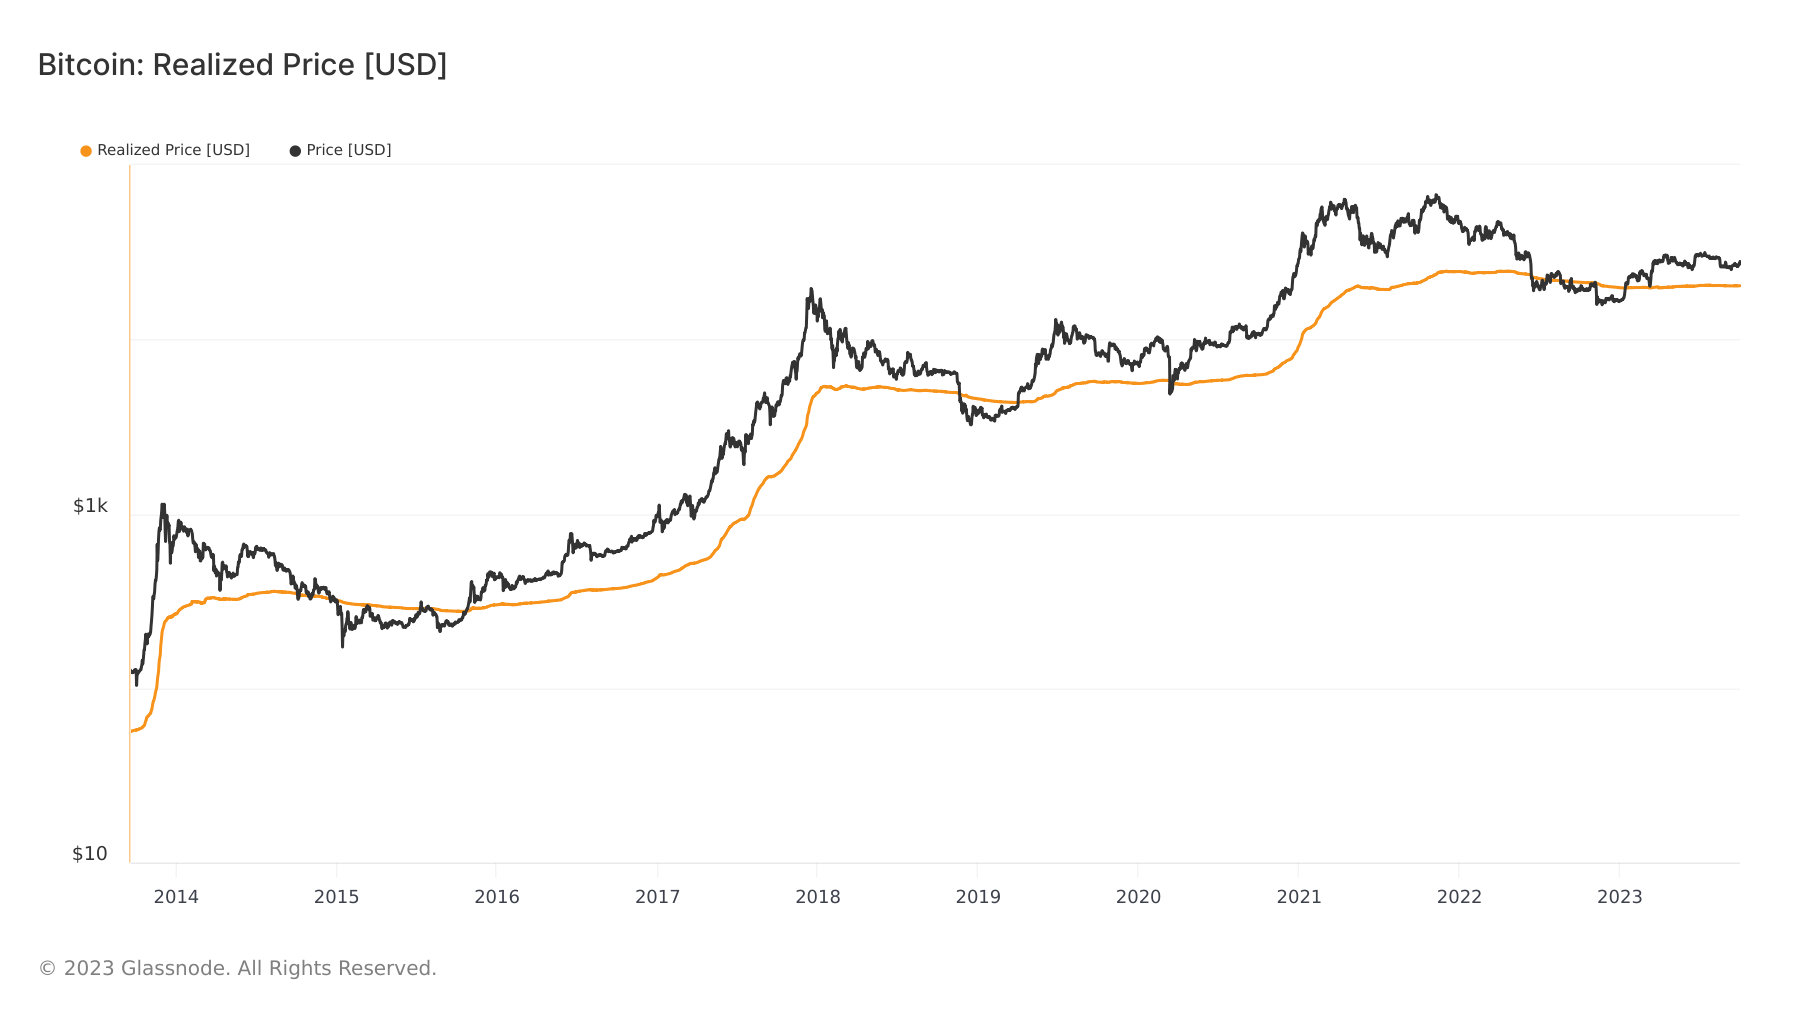
The second key on-chain indicator we’ve focused on is Bitcoin’s cost of production – Bitcoin’s Electrical Cost. The Electrical Cost essentially calculates how much miners pay in electricity costs to produce/mine Bitcoin.
This metric suggests that Bitcoin is at least worth its production cost, particularly now that the Mining Hash Rate is at record highs, two years into a bear market where only the most cost and energy-efficient miners are left.
Like Bitcoin’s Realised Price, the Electrical Cost has acted as a good floor for Bitcoin’s price every time the price comes down to it. Bitcoin’s Electrical Cost is currently $21,240.
Electrical cost
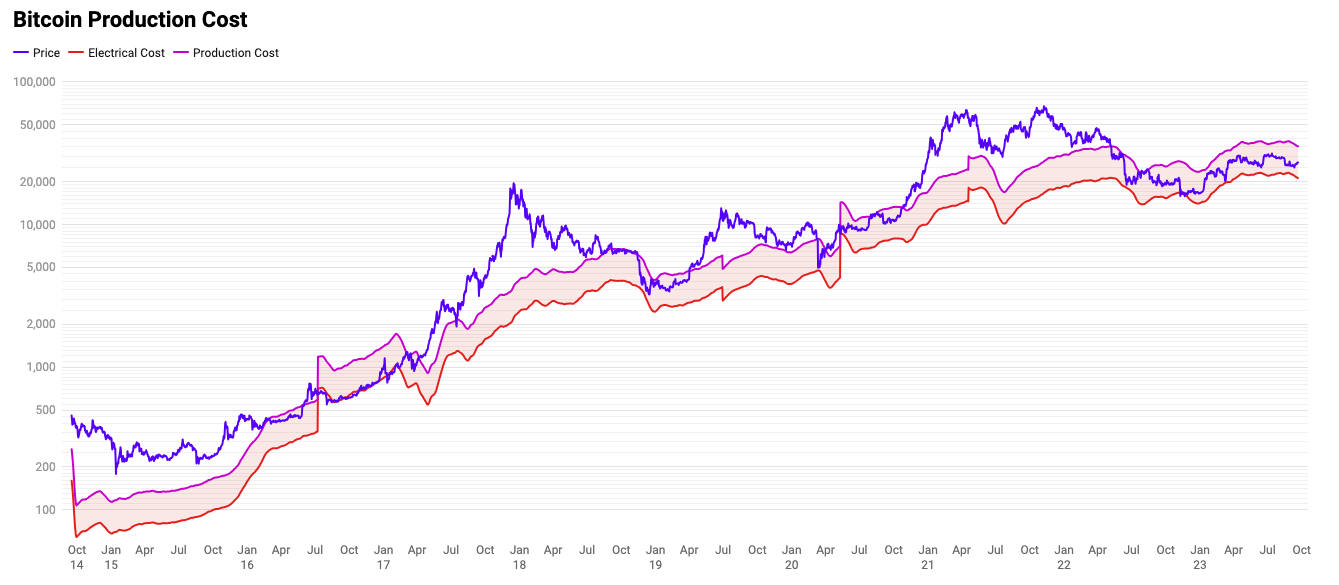
Both the Realised Price and the Electrical Cost sit at $20,290 and $21,240, respectively. If Bitcoin’s price were to dip back towards this price range, I feel it would present an excellent buying opportunity, particularly with the next Bitcoin halving in April 2024.
The halving is where the new issuance of Bitcoins paid to miners will be half of what it currently is, lowering Bitcoin’s inflation rate from 1.6% per year to 0.8% per year.
To put this in perspective, Gold has an inflation rate of 1.6% per year and a market cap of $12.8 trillion. Bitcoin’s market cap is $0.55 trillion.
Identifying the opportunities against the macro headwinds
With Bitcoin sitting at $28,250, we believe it’s still relatively undervalued here.However, when we look at the macro data, and we see that inflation is still well above the FED’s 2.0% target, likely, the full effects of the FED’s tightening haven’t yet been felt, and it’ll likely need to be felt to bring inflation back down to target.
Alongside this, the labour market is showing signs of weakness, but there aren’t alarms going off suggesting that it’s going to break imminently.
If we look at the Summary of Economic Projections, the Fed is predicting that Unemployment is going to move up to 4.1% next year. Yet it remains firm in its “higher for longer” narrative regarding interest rates.
This suggests to us that they’re okay with Unemployment going up, and they probably feel that it’s necessary to bring inflation back down to target.
Cutting Rates & Liquidity
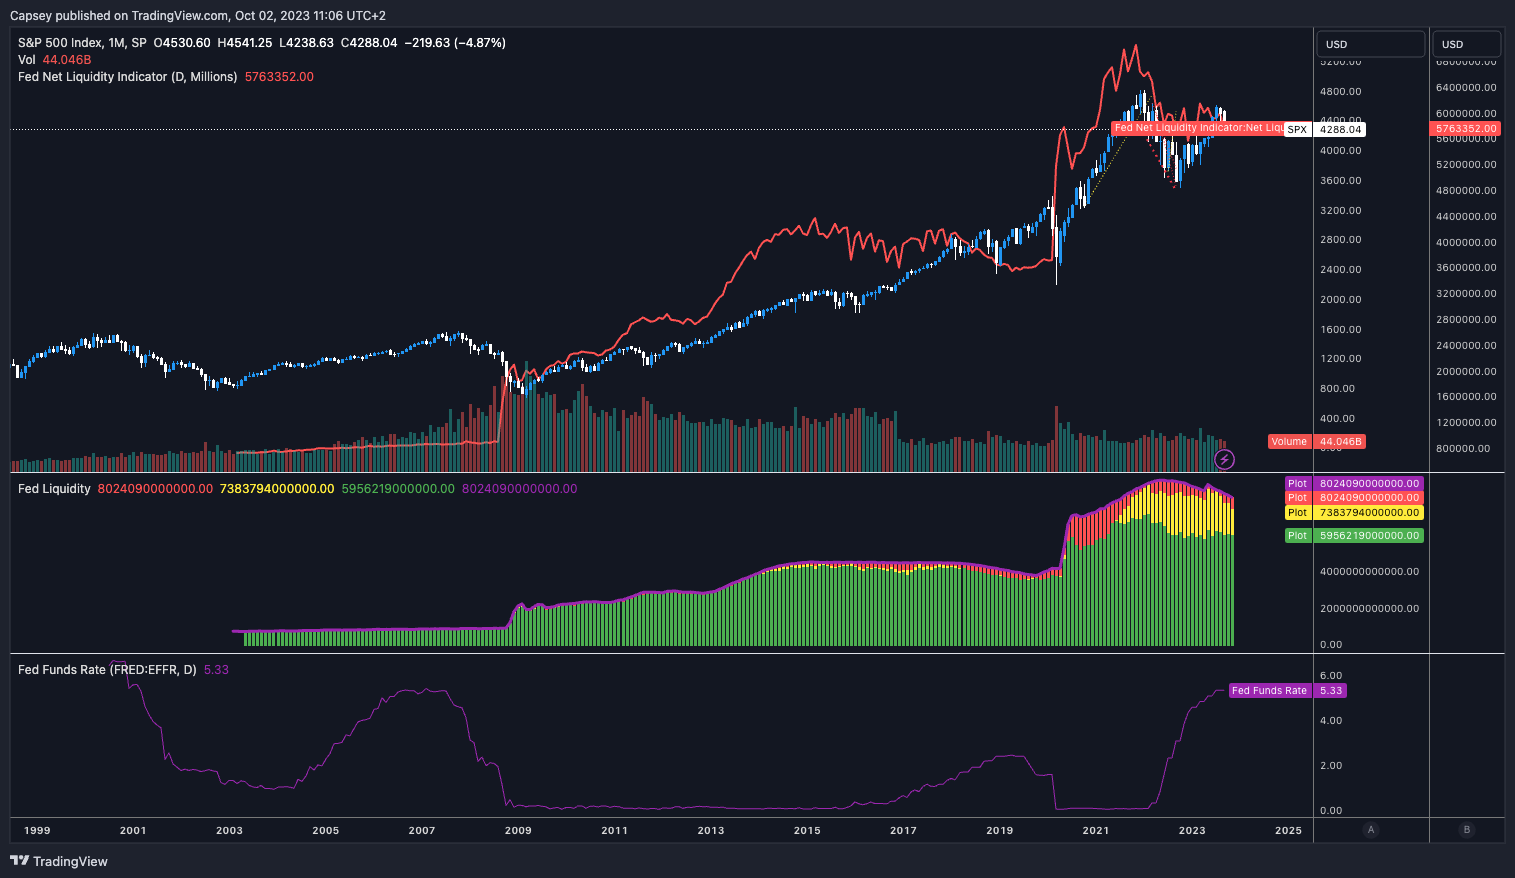
There is the theory that the bull market will begin when the Fed cuts interest rates, and liquidity in the markets increases. While this is partly correct, what people skip over is why cuts are happening and how markets perform during this.The below graph is the S&P’s performance against Fed Interest Rates and Fed Net Liquidity from 1999 to today.
It shows how correlated the S&P is against Fed liquidity, i.e., if the Fed is injecting liquidity into markets, the S&P performs well. Liquidity is injected into markets to help stimulate growth, usually following an economic downturn. This is when risk assets (like Bitcoin) outperform.
We can also see that when the Fed pauses rates, the S&P goes up. This has been the case for 1999 to 2000, 2006 to 2007, and 2019. But, when the Fed has cut rates, they’re cutting rates to provide relief to the economy and markets because something is breaking.
So, during the early phase of rate cuts, markets usually see more substantial sell-off as they price in an economic collapse. The continuing cutting of rates and the added stimulus from the Fed(the increase in liquidity) drive markets up from there. The aim is to buy into the market sell-off before the Fed intervenes with fresh stimulus.
The S&P is a basket of equities (risk assets) that just aren’t as far along the risk curve as Bitcoin but which perform well when liquidity is increased. Bitcoin has a relatively strong correlation to the S&P; hence, we track it and liquidity closely.
S&P price, against Fed funds rate, against Fed liquidity
Today, we have the Fed at the top of their rate hike cycle (or likely just another 25 basis points away from the top). With the macro data worsening and the Fed’s willingness to stay “higher for longer,” the full effects of tightening can be felt with the consumer then breaking and inflation likely returning to target.
Due to the Unemployment Rate coming off a historic low (3.4%), the Fed is probably willing to see more material weakening from the consumer and is perhaps looking to engineer it. The Fed needs the economy to break for demand to come down enough, which results in inflation moving materially lower.
That, for us, is opportunity. A sell-off the Fed is essentially looking to engineer but cannot come outright and say.
Cryptonary’s take
It’s possible that while the Fed remains on pause, markets can still perform well.The Fed will then stay “higher for longer” until they see something break – the labour market will likely be the next major mover, indicating a breaking economy.
Trouble in markets will come when something does break. Looking at the yield curve inversion data and the other macro data we have, it’s possible a recession is upon us in the next few quarters.
If we then pair this alongside the next Bitcoin halving in April 2024 (7 months away) and also assess the on-chain indicators. This enables us to define a timeline in which we should be looking to DCA into Bitcoin (and then Alts).
For us, that timeline is now, and to the next, Bitcoin halving, with the potential fantastic buying opportunity that a recession (and the panic in markets due to this) might bring.
We have, therefore, plotted the Bitcoin halving (the vertical yellow line on the right) in the below graph, along with a buying zone for Bitcoin that lines up with the on-chain data we have analysed in this report.
For context, we have also plotted the last Bitcoin halving (the yellow line on the left) to show the price performance following the last halving and the significant decrease in Bitcoin issuance due to this.
When should you buy Bitcoin?
Our personal strategy will be to DCA into the turquoise zone. We will look to be 60% allocated between now and the halving. The remaining 40% we will keep in cash in case of market panic (potentially due to the recession coming to fruition). We will want to take advantage of the prices offered if markets crash.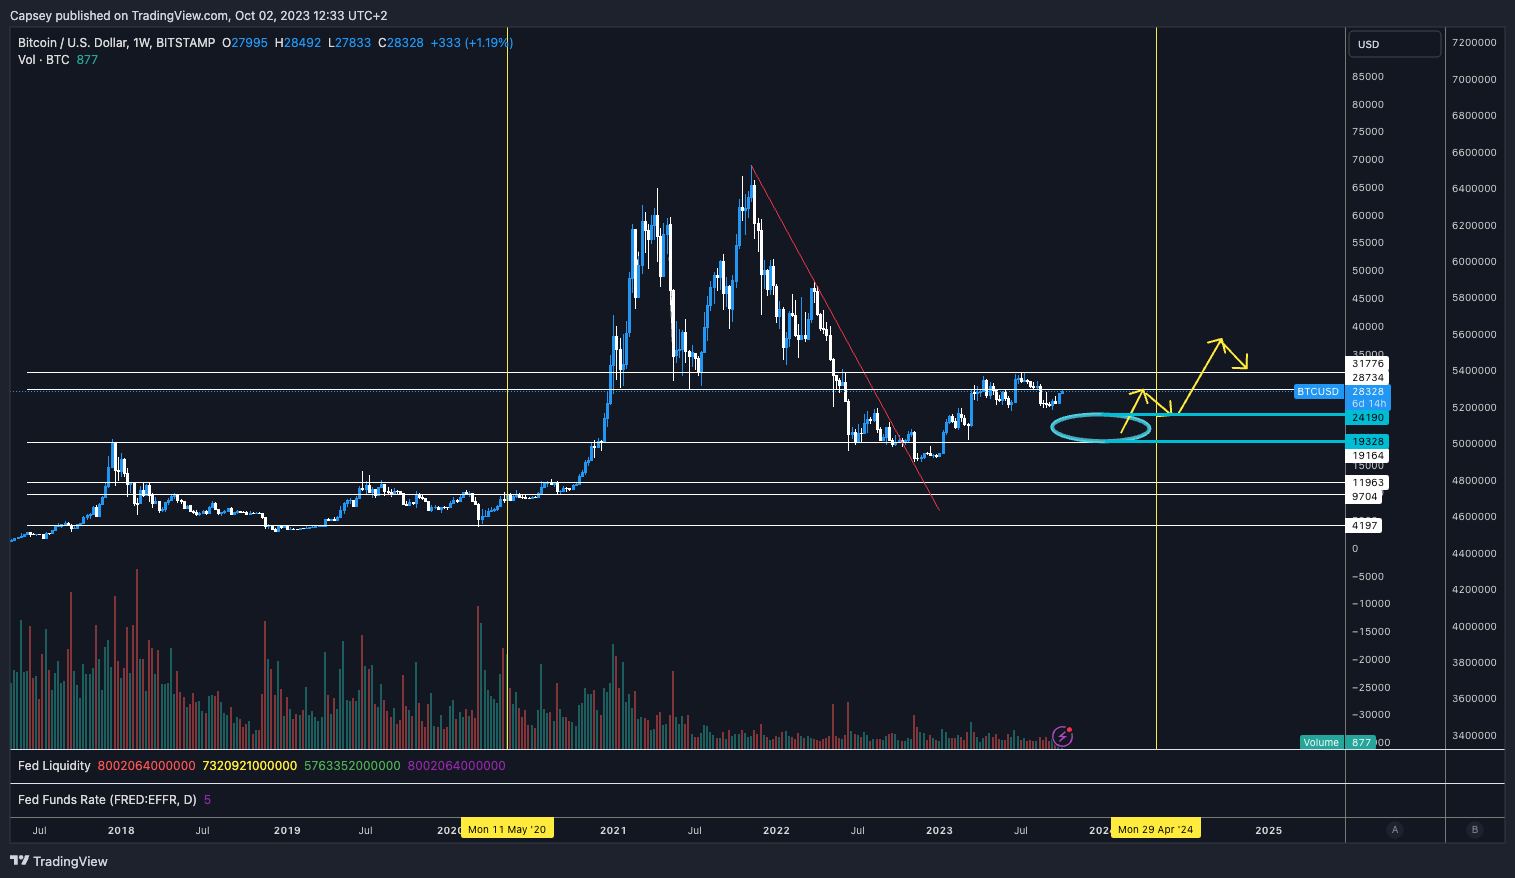
If we don’t get the crash, we will DCA with the 40% once we see the macro data has improved. We believe that the cycle bottom is in ($15,600 following the FTX crash). So, the turquoise zone we highlighted may present a good buying opportunity for the next bull run. We believe the bull run will be in the second half of 2024 and most of 2025.
Of course, we will continue to assess the data and our allocations based on how this data comes in throughout the timeline we have outlined.
Action points
- Start DCA into the turquoise zone, targeting 60% allocation pre-halving.
- Hold 40% in cash for potential market downturns due to a recession.
- Be prepared to capitalise on market opportunities with reserved cash.
- Consider DCA for the remaining 40% once there’s improved macroeconomic data.
- Anticipate the next bull run in the latter half of 2024 to most of 2025.
Cryptonary OUT!
Recommended from Cryptonary


