Save 23% ($351) & Get a Free 1-1 Call with our Team ⏰ : 0d 2h 59m 44s
Technical Analysis
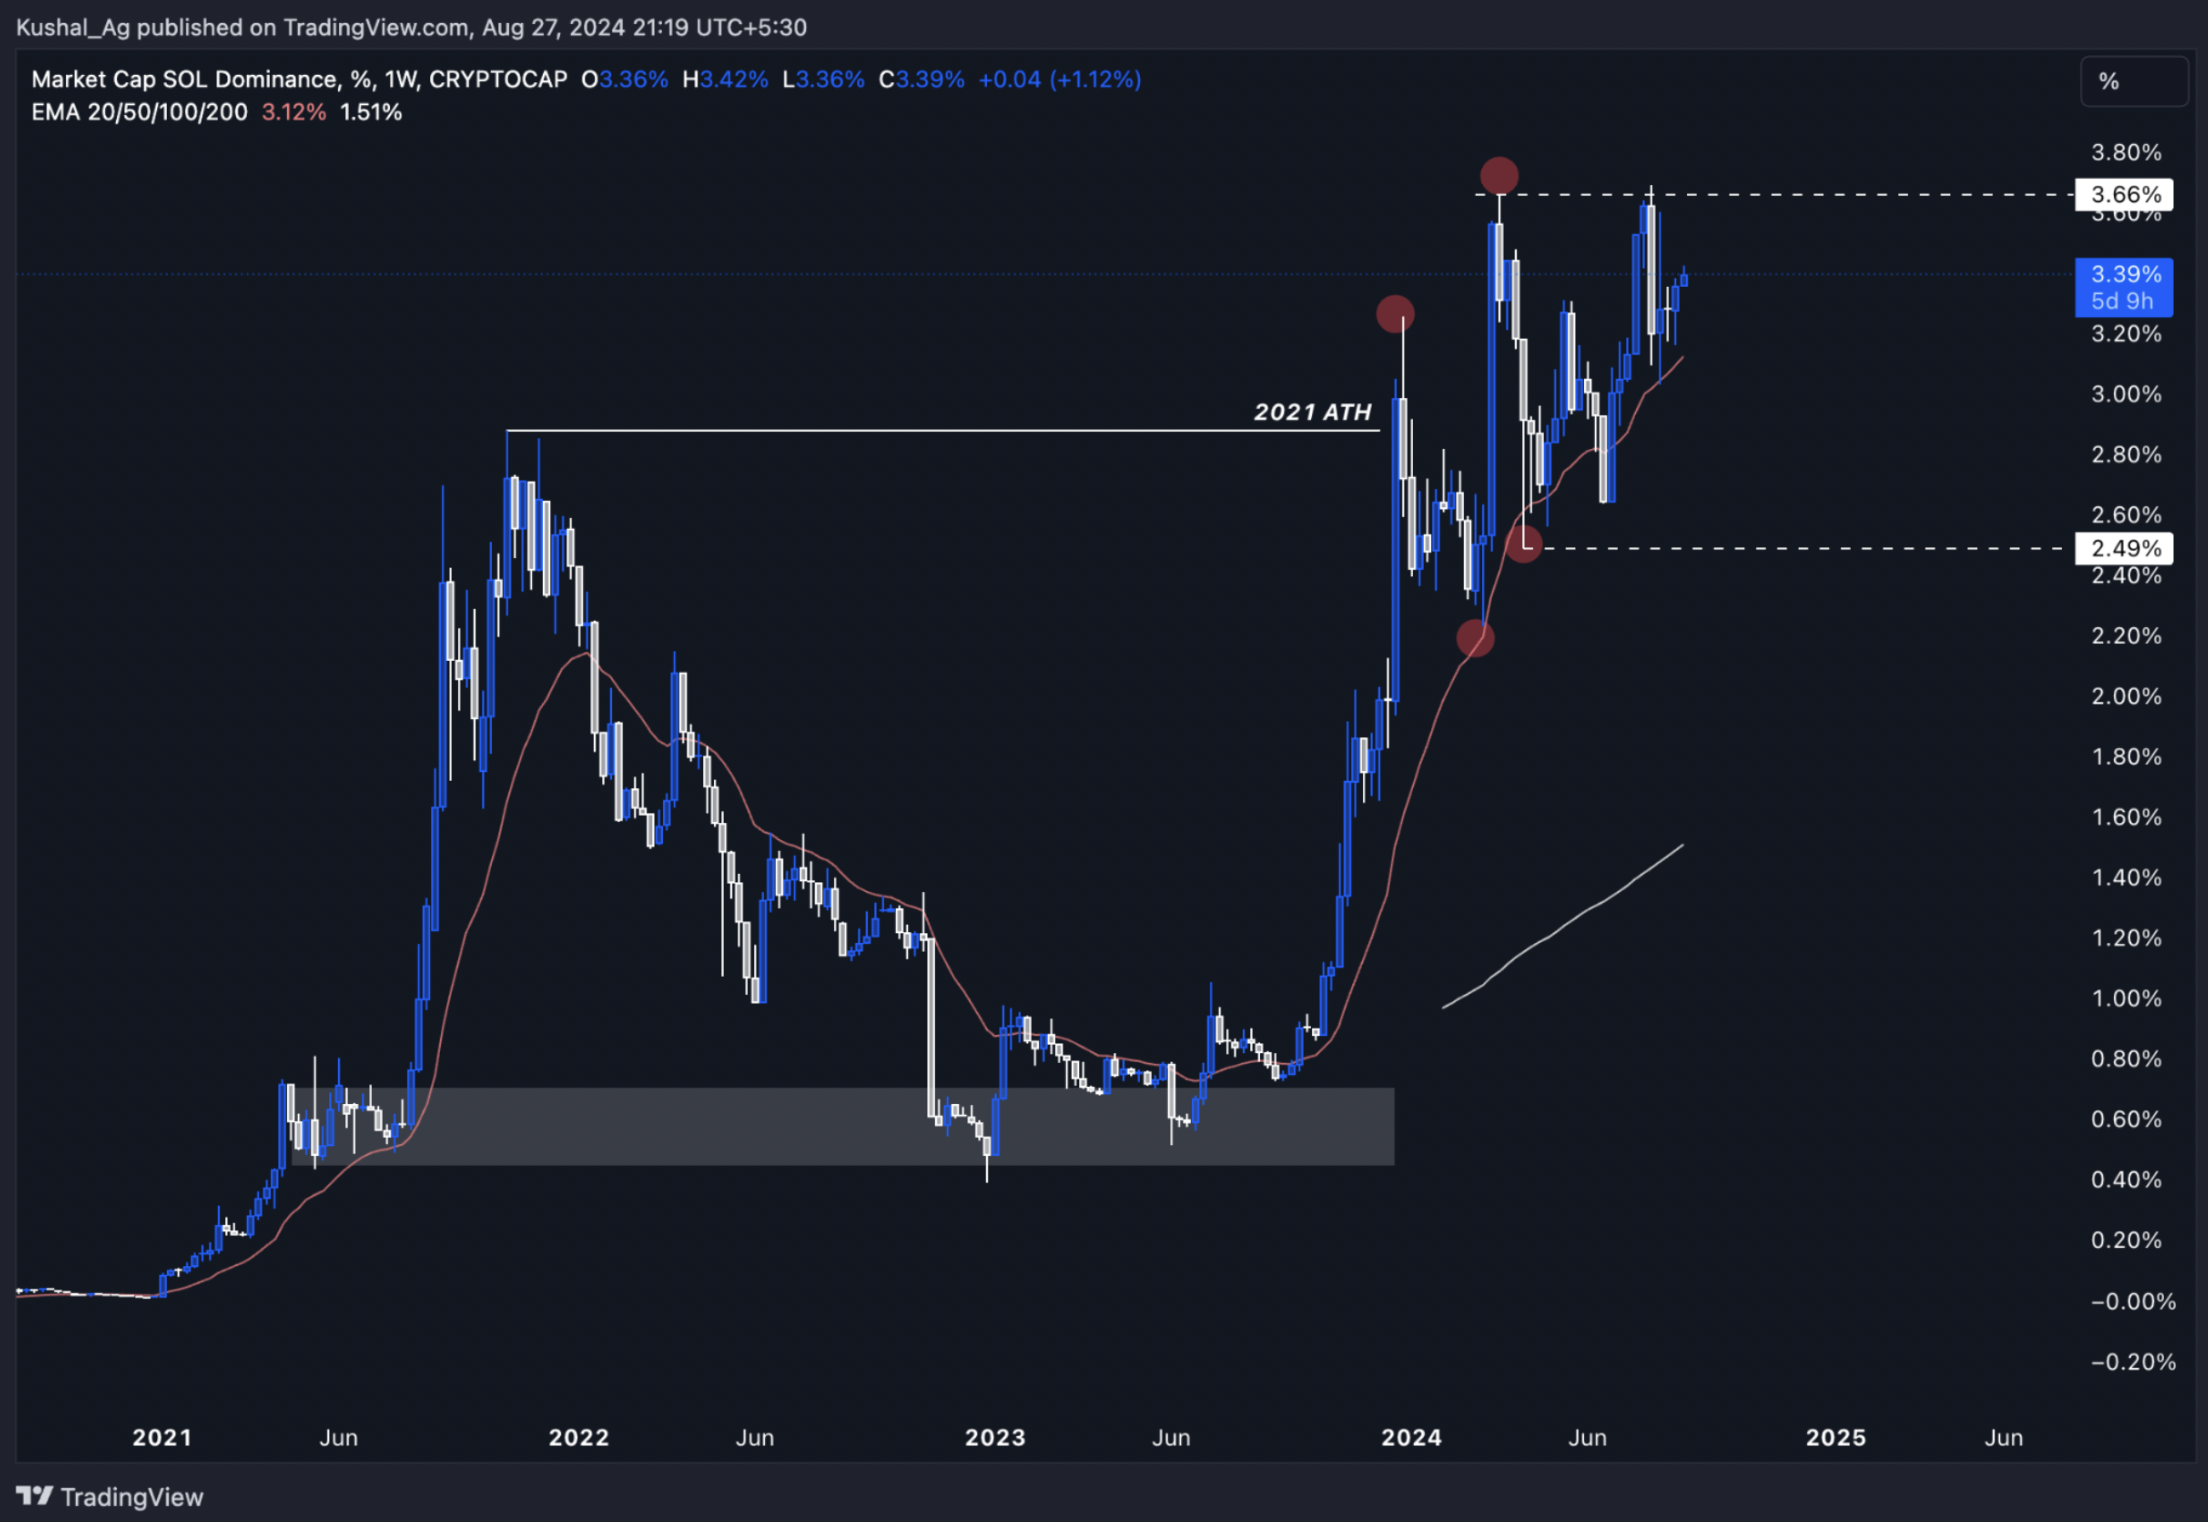
Sol dominance analysis: Is a breakout above 3.66% imminent?
Resistance: As SOL.D continues to squeeze within this range, the likelihood of a significant breakout increases. This move is expected to lead to Solana capturing an even larger share of the total market cap, reinforcing its position as a leading asset in the crypto space.

Current State
Today, we're analysing SOL dominance on the weekly timeframe to gain a cleaner and larger overall view of Solana's market position. Solana has been holding firmly above its 2021 ATH, consistently forming higher lows as it contracts within a range defined by the 3.66% level and the 20 EMA, which is marked by the red line. As mentioned earlier, the 20 EMA is a crucial indicator in trending markets, and it has once again proven to be reliable in SOL's ongoing trend.Key Observations:
Support: The 20 EMA, currently positioned around the 3.66% level, has provided strong support, helping SOL maintain its bullish structure. The 2.5% level remains the key support on the downside, ensuring that SOL retains its dominance within the broader market.Market Dynamics: The ongoing contraction in SOL dominance suggests that the market is preparing for a significant move. With SOL holding above its 2021 ATH and the 20 EMA offering consistent support, Solana is well-positioned to increase its dominance in the coming months.
Conclusion
SOL dominance is squeezing into a pivotal range, with the 3.66% level and 20 EMA providing strong support. As Solana continues to consolidate, a breakout is likely, allowing SOL to capture a larger share of the total market cap. This chart remains one of the most bullish indicators for Solana's continued success.Disclaimer: This is not financial or investment advice. You are responsible for any capital-related decisions you make, and only you are accountable for the results.
Recommended from Cryptonary


Market Pulse
4 min read
Mar 19, 2026

PRO
Market Direction
13 min read
Mar 17, 2026

PRO
Market Updates
9 min read
Mar 16, 2026
