Save 23% ($351) & Get a Free 1-1 Call with our Team ⏰ : 0d 2h 59m 44s
While SOL has held support around $55, the key level to watch is the overhead resistance of $80. A decisive break above $55 could send SOL on a rally towards $100.
However, the technicals also suggest the potential for a pullback, especially with indicators extremely overextended on the 3D and weekly timeframes. With open interest still elevated but positioning balanced, risks appear two-sided for SOL.
TLDR
- SOL deals with critical horizontal support at $55 and resistance at $80.
- A head & shoulders pattern on 12hr could trigger a move to the low $50s, but SOL is clinging onto the uptrend.
- Open interest remains high, positioning balanced, but overbought on larger timeframes.
- We recommend that traders await high conviction signs of a break in either direction before trading.
Disclaimer: Not financial or investment advice. You are responsible for any capital-related decisions you make, and only you are accountable for the results. “One Glance” by Cryptonary sometimes uses the RR trading tool to help you quickly understand our analysis. They are not signals, and they are not financial advice.
SOL 12hr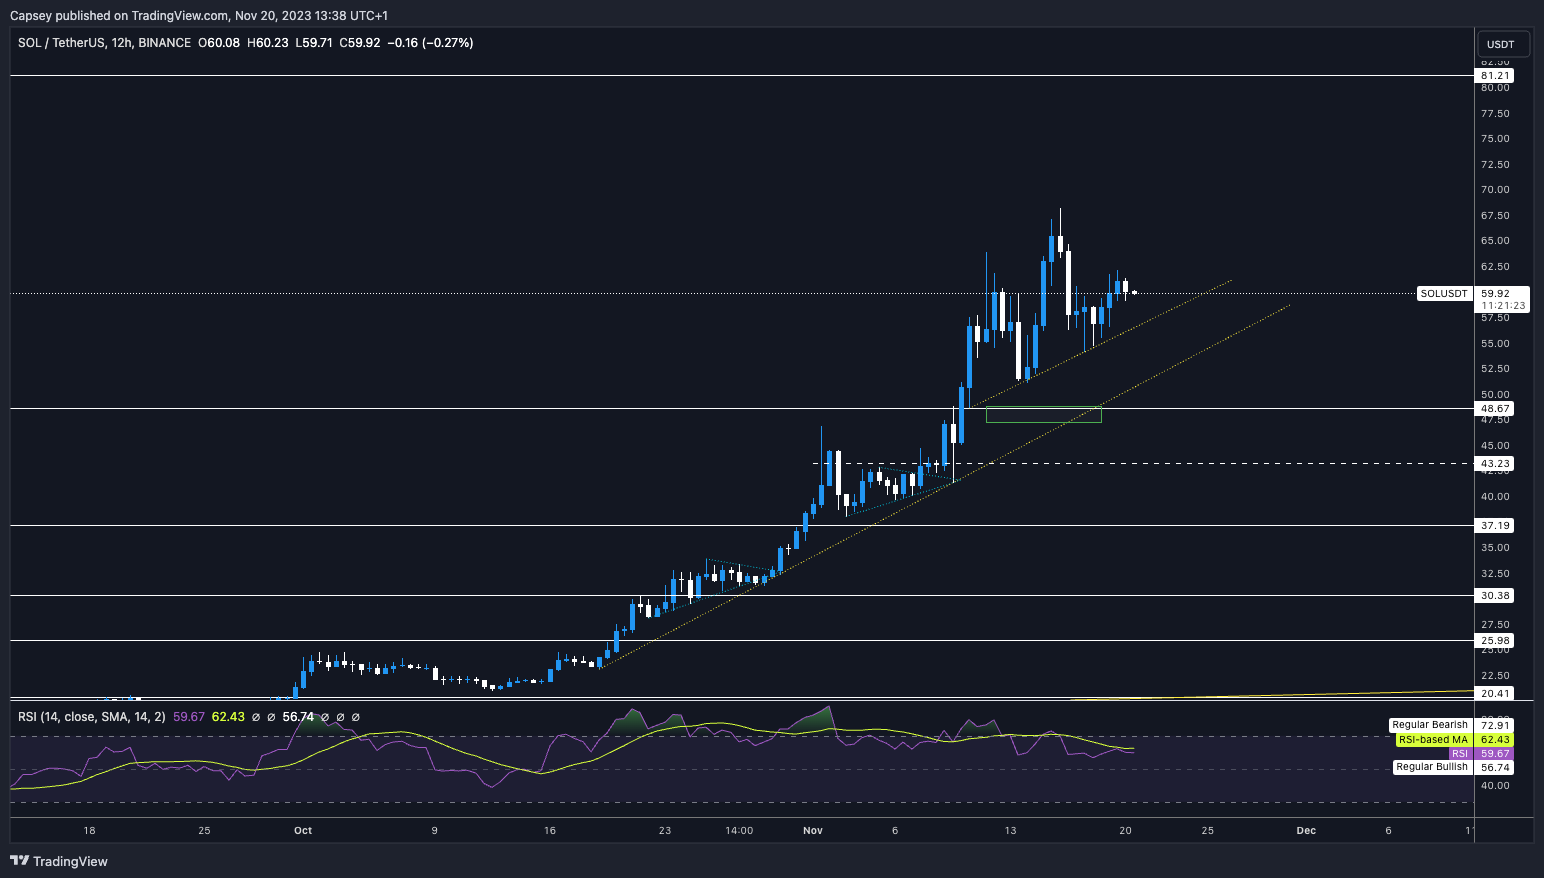
Technical analysis
SOL looks interesting from a technical perspective here.- SOL is still within its local and main uptrends - positive for continued bullish momentum.
- The local support is at $55, with the major horizontal support at $47 to $49. The overhead horizontal resistance is at $80. So, if SOL can break above $67, then $80 would be the next higher target.
- The RSI on the 12-hour and the daily timeframes have reset and are now back below overbought territory. However, the 3D and weekly timeframes are still extremely overbought on the RSI and, from this indicator, look relatively toppy.
Market mechanics
The mechanics for SOL are much healthier than they have been, but there is still some froth. Let’s take a look:- Open interest remains high, currently at $770M, well above the $200-300M average we’ve had over the past year.
- The OI-weighted funding rate is at 0.0099%. This means longs and shorts are in much more of an even balance - this is a healthy setup.
- The long/short Ratio is at 0.9885, suggesting more participants have gone short rather than long over the past 24 hours, but it is not at an alarming margin. This shouldn't be a big concern for us.
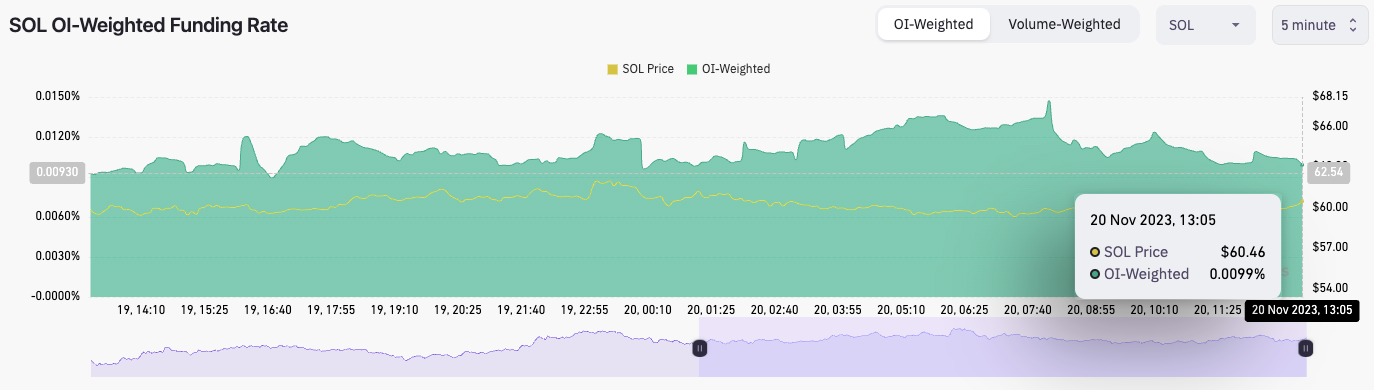
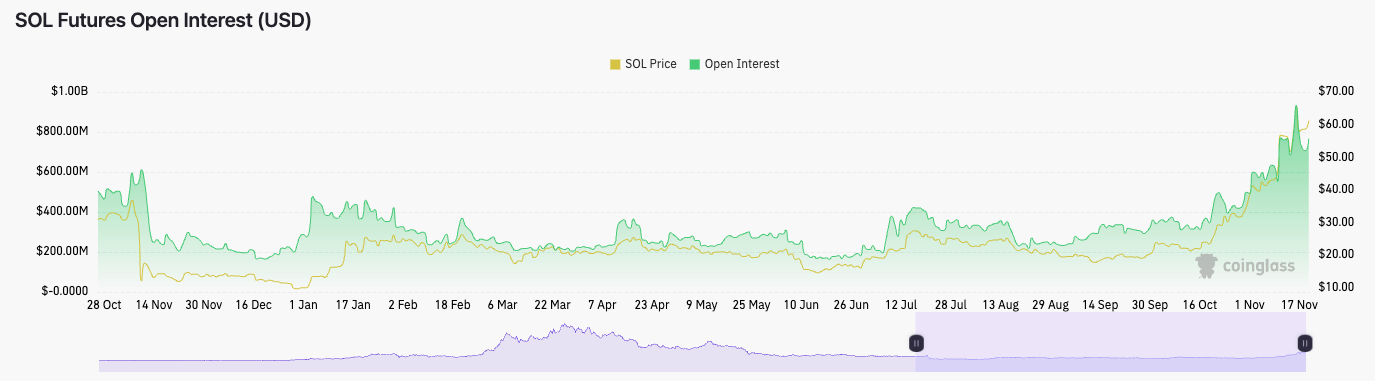
There is still a large build-up of leverage in SOL, but there is an even balance between longs and shorts.
Cryptonary’s take
While there is a large leverage build-up, positioning is now in better balance, meaning neither side is heavily offside and vulnerable to a squeeze. However, if there is a meaningful move in one direction, we’ll likely see that side be squeezed, pushing the price further.Looking at the technical analysis, we can see a unique head and shoulders pattern forming in the 12-hour timeframe, which could see SOL move down to the low $50s. With the 3D and weekly RSI’s still heavily overbought, there is convergence for a significant price move down, as this would also flush out some of the excess open interest.
In the short term, we’re not looking to trade SOL. It looks as if a further move down could be on the cards, but without longs becoming meaningfully offside, price may continue to grind higher also. Based on our current information, this only offers a low risk/reward for a trade. Hence, we’re not taking any action.
If SOL falls to $48 or below this level, we will add more to our DCA bags.
Recommended from Cryptonary


