Save 23% ($351) & Get a Free 1-1 Call with our Team ⏰ : 0d 2h 59m 43s
Market Direction

Disclaimer: This is not financial or investment advice. You are responsible for any capital-related decisions you make, and only you are accountable for the results.
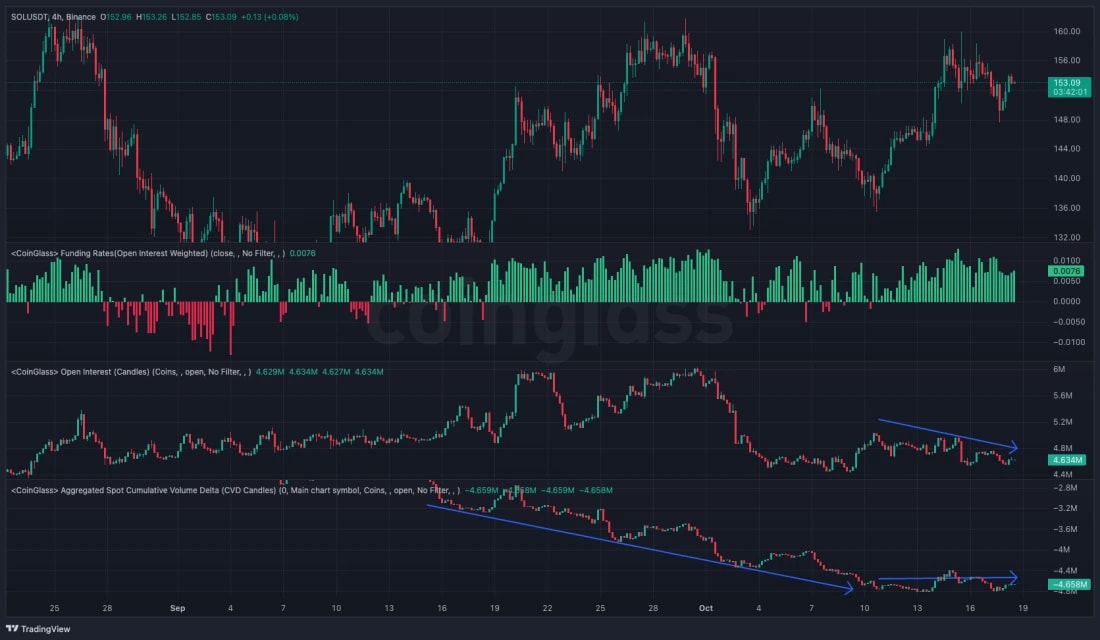
- SOL is interesting from a mechanics viewpoint here.
- Open Interest fell significantly a month ago and has remained relatively flat since (not much new leverage is being put on here).
- Funding rates have increased but aren't meaningfully positive, whilst Spot CVD has trended lower and has remained flat since.
- There isn't huge interest from buyers in SOL currently. Perhaps we see this change on SOL convincingly breaking above key resistance levels.
Technical analysis
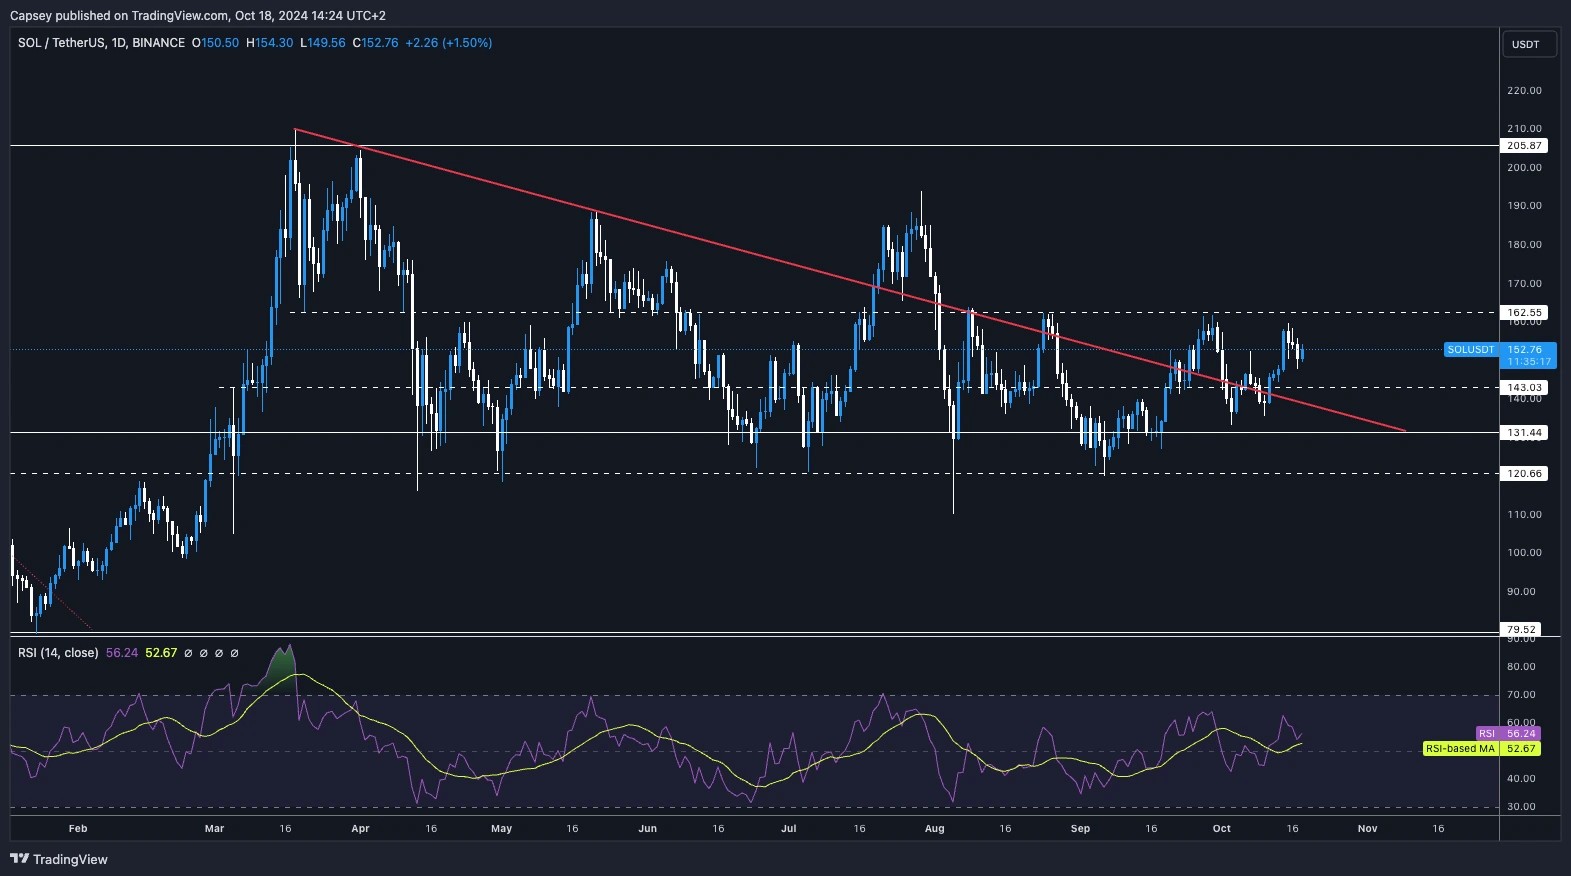
- SOL is now in the upper range of its larger price range between the lows at $131 and the highs/resistance at $162. The $143 should act as a middle level/support for SOL on the local timeframes.
- The horizontal resistance is $162. A breakout of this level might see more volume come into SOL, and you could see a swift move up, potentially testing $190.
- To the downside, we expect the support range between $120 and $131 to act as major support for the price.
- The RSI is back in the middle territory and has somewhat just been sitting there for quite some time now.
- Next Support: $143
- Next Resistance: $162
- Direction: Neutral
- Upside Target: $162 ($190 upon breakout)
- Downside Target: $131
Cryptonary's take
SOL remains super boring here to be honest as it is still range-bound between $131 and $162. However, a break out of the range could be quite volatile as it would likely see volume come in and chase the move higher (assuming it is higher, which we believe it will be).Our expectation is that we probably just continue to chop over the next 3-7 days. A break out beyond $162 would be the signal to get super bullish again. Until that happens we will sit tight and remain patient in our Spot bags.
Recommended from Cryptonary


PRO
Market Direction
13 min read
Mar 17, 2026
PRO
Market Direction
12 min read
Mar 13, 2026

PRO
Market Direction
13 min read
Mar 10, 2026
