Save 23% ($351) & Get a Free 1-1 Call with our Team ⏰ : 0d 2h 59m 44s

We've all been feeling the pain lately as the markets continue in choppy waters. It’s been hard to make a significant profit on blue chip tokens like BTC, ETH, SOL, DOT, RUNE, and THOR, or any major coin, for that matter.
But is there any room for profit in the short term? Is it time to buy the dip, or will it keep dipping?
Before you pull the trigger, let's dive into the key points from our latest Market Direction.
Every day, our analysts spend hours reviewing macro events, market mechanics, on-chain data, market sentiment, and news headlines – all to get the pulse of where these assets are headed.
Today, our Head of Analysis starts again with a short video in which he assesses multiple data points, starting with the war in Israel, to build a data-driven bullish or bearish bias for BTC.
Ready to win? Let’s go
TLDR
-
On ETH, more downside is possible if support breaks. It is not worth trading currently due to risk/reward.
-
On SOL, a small bounce is possible but not worth longing due to market risks.
-
DOT broke below key support and is now almost in a price discovery downtrend.
-
RUNE could see a small relief bounce up, but it might be smart to trim position on any bounce.
-
Overall, signs still point to further downside for most majors. Consider taking profits when possible rather than aggressively buying dips.
Disclaimer: Not financial or investment advice. You are responsible for any capital-related decisions you make, and only you are accountable for the results. “One Glance” by Cryptonary sometimes uses the R:R trading tool to help you quickly understand our analysis. They are not signals, and they are not financial advice. Any capital-related decision you make is your responsibility and yours only.
ETH | Ethereum
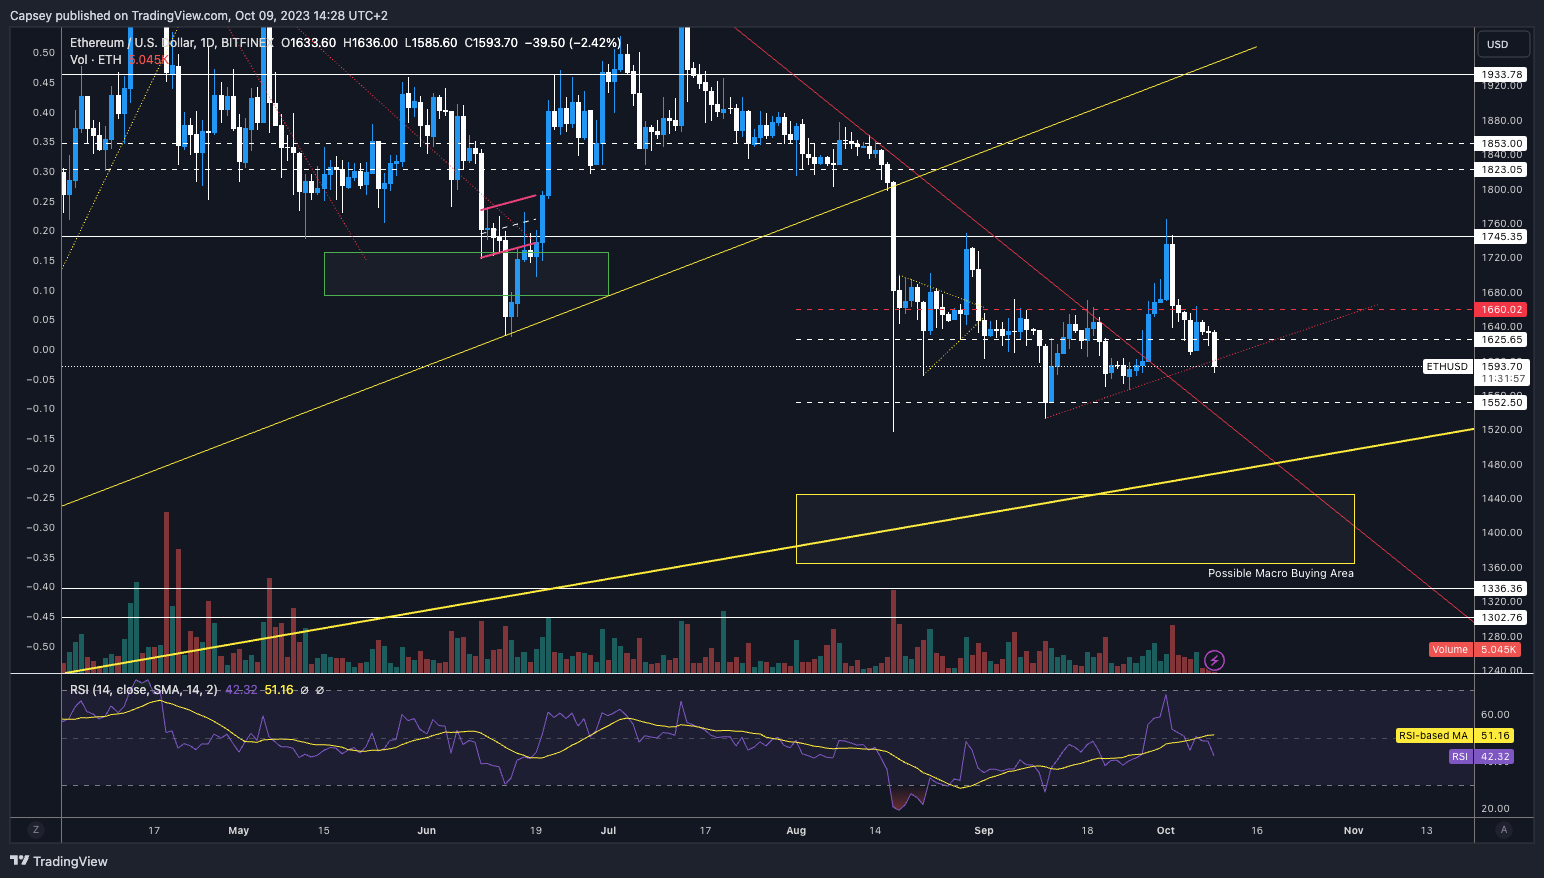
Let’s face it; there’s poor price action from ETH here. The fact that BTC has maintained the $27,100 - $27,300 horizontal support levels is perhaps what is saving the alts market from really capitulating here.
Technical analysis
So far, ETH has really struggled to hold the range and liquidity area of $1,590 to $1,660 - currently at the $1,590 area.
The next area lower between $1,550 and $1,590 is key. If this level does not hold, we feel ETH can see a considerable downside. If lost, $1,400 could be on the cards. If we were to get to $1,400, we would begin DCA’ing into this price point with a small % of our USDT that we have allocated for future ETH exposure.
RSI and funding rates
The RSI is at 42 on the daily timeframe, so there is further room to go lower. So, regarding whether this move has been exhausted to the downside, we would say no, there is room to go lower. On divergences, there is nothing on the charts. So, no indications of this element. The funding rate is in relatively positive territory, so it is a healthy market.
TLDR: neither longs nor shorts are vulnerable here to any squeezes.
Conclusion on trading ETH
ETH is at a pivotal point here and needs to hold the support range of $1,550 to $1,590. It can hold this area unless there is an escalation of the conflict in the Middle East. But we think the conflict in the Middle East will escalate, so ETH is not worth the trade in terms of risk/reward here.
We can hold support, but an escalation at any moment in the Middle East can drive risk assets (ETH) lower. It’s not worth being on the wrong side of this.
Action
Steering clear of trading ETH for now.
SOL | Solana
We were eyeing this for a Short, but unfortunately, indicators didn’t align for us to jump into the short trade. Let’s dive into it and see what we can expect from here.
Technical analysis
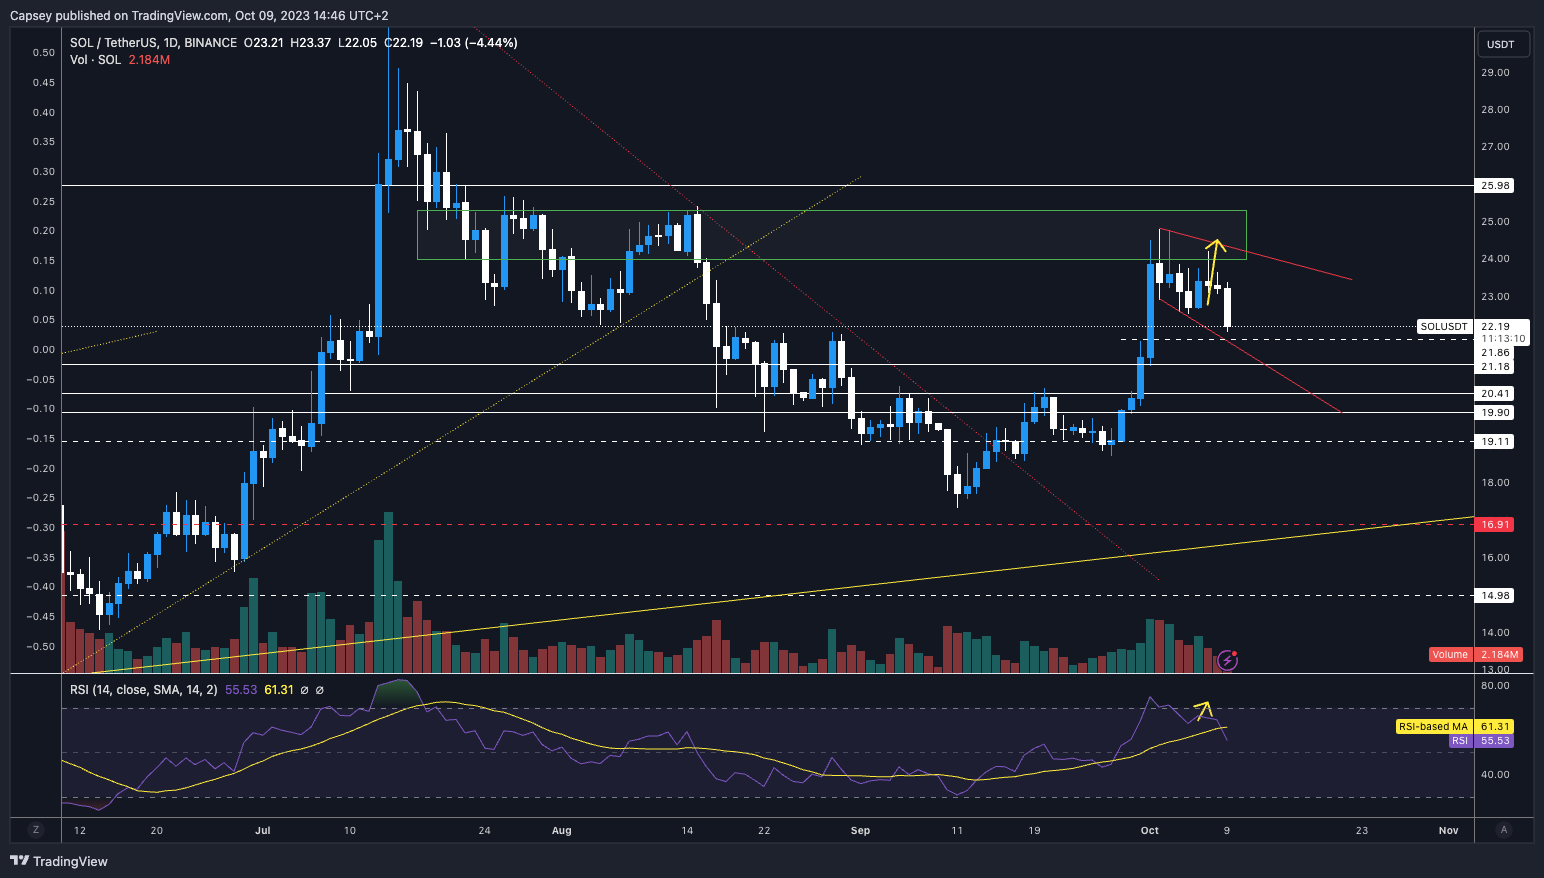
We were hoping to see SOL move higher back into the $24.00 to $25.00, as this would have given us a move back into a resistance zone (local resistance), and we would have likely got a bearish divergence from over-bought conditions… A prime setup for a Short. Unfortunately, we did not get that, so the trade opportunity didn’t materialise.
Instead, we have just seen a clear rejection. SOL is now moving into the local support area of $21.80 to $22.20. If BTC and the overall market can hold up, SOL should get a small bounce from this zone and maybe retest the $23 area.
RSI and funding rates
The RSI has now just reset here; there’s nothing regarding divergences, and it is back to neutral territory at 57. The Funding Rate is mixed and likely to change (flip-flop). Therefore, SOL could experience increased volatility, which will likely chop traders in and out of positions.
Conclusion on trading SOL
We are now watching to see if SOL can bounce from here ($22.20), although high risks remain for risk assets if there is an escalation in the Middle East. Trading here is not worth it. We think Alts can hold this lower level and try to get a small relief bounce, but they’re not worth Longing due to the geopolitical headwinds/risks that remain.
Action
We’re not interested in playing SOL here; we’d prefer to sit back and see how this unfolds.
DOT | Polkadot
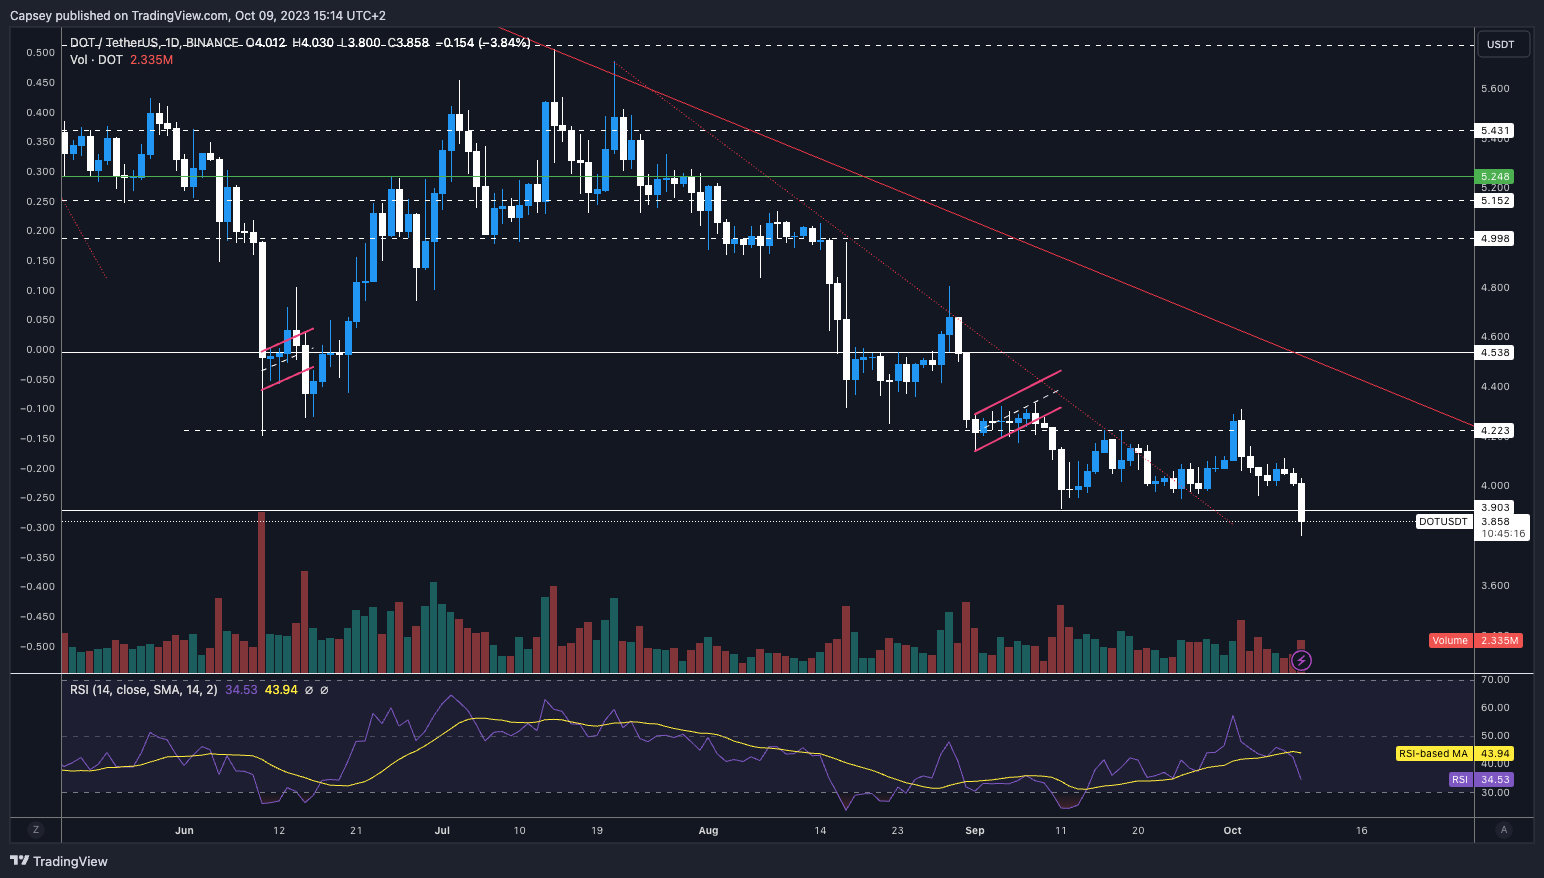
It looks super ugly here and has lost a key horizontal support area at $3.90. DOT must close today’s daily candle back above $3.90.
Technical analysis
Since breaking out of the local downtrend line, DOT moved higher but rejected into the first local horizontal resistance at $4.22. It’s then moved lower and broken below the major support of $3.90, which is really not good. As mentioned, a daily candle closure above $3.90 is needed to save this. If $3.60 is broken, DOT could move down to as low as $2.70.
RSI and funding rates
The RSI is quite key here. We’ve put a lower low in for price but a higher low on the oscillator - a bullish divergence. However, we’re not in oversold territory or even too close to it at 34, so there is room for further downside. Funding Rates are massively mixed and at polar ends of the spectrum. This is likely to reset at some point.
Conclusion on trading DOT
Overall, this is ugly, and DOT is almost into price discovery to the downside - not something you want to be holding a big bag of DOT or Longing DOT into. We think we see this even lower over the coming months.
Action
Again, we’re doing nothing, but if we held a bag of DOT, we'd really look to take some size off the table if we were to get a relief rally into the $4.00 area.
RUNE| THORChain
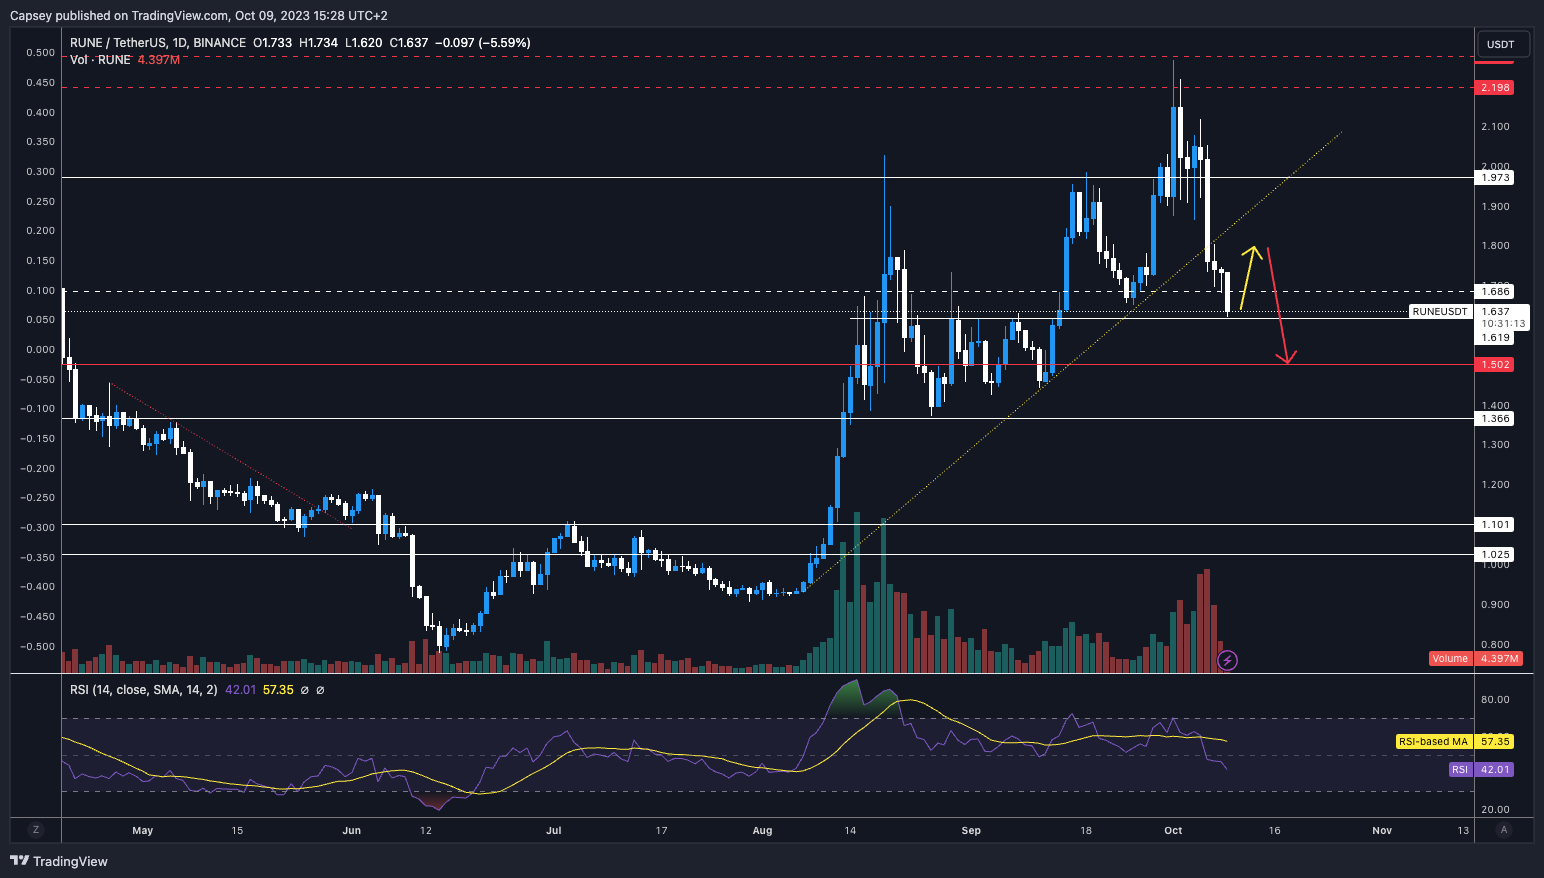
After a fantastic move up, we’ve been saying over the past week or two that the $2.00 area would be a good area to take profits and reduce exposure to RUNE. Now, at $1.63, this turned out to be a wise move.
Technical analysis
After a considerable battle at $2.00, RUNE has unfortunately been unable to turn that level into support and has broken below there. Following the issue with ThorChain, RUNE continued to move lower and has broken below its main uptrend line, which we pointed out last week, is not positive for price action going forward.
Since then, RUNE has moved lower and is now testing a more main horizontal support at $1.62. Considering the sell-off, we'd like to think this can get some form of bounce from here, probably only a small relief bounce to, say, $1.75 - $1.80 and then rejection and further downside from there. Arrows drawn.
RSI and funding rates
The RSI has reset to a more neutral territory at 42, which is a slight surprise to me; we would have thought that the sell-off would have pushed the RSI far lower, closer to oversold territory. Funding Rates are reflective of other coins, a constant flip-flopping and not really indicating any clear direction.
Conclusion on trading RUNE
The feeling here is that RUNE is due for some relief, with a possible bounce into the $1.75 to $1.80 level being possible.
Action
If we held a big spot bag of this, and we didn’t sell some of our size into the $2.00 area, we would look to target the $1.75 to $1.80 area to trim a considerable portion of our RUNE holdings.
THOR | THORSwap
THOR is looking super ugly here. Mid-term, due to a bounce, but we think further downside in the near-term is possible, particularly whilst confidence is low.
Technical analysis
THOR experienced a huge drawdown and has found some support at the more major horizontal support level of $0.135, although the price is now forming a bear flag. These are typically bearish patterns which break to the downside.
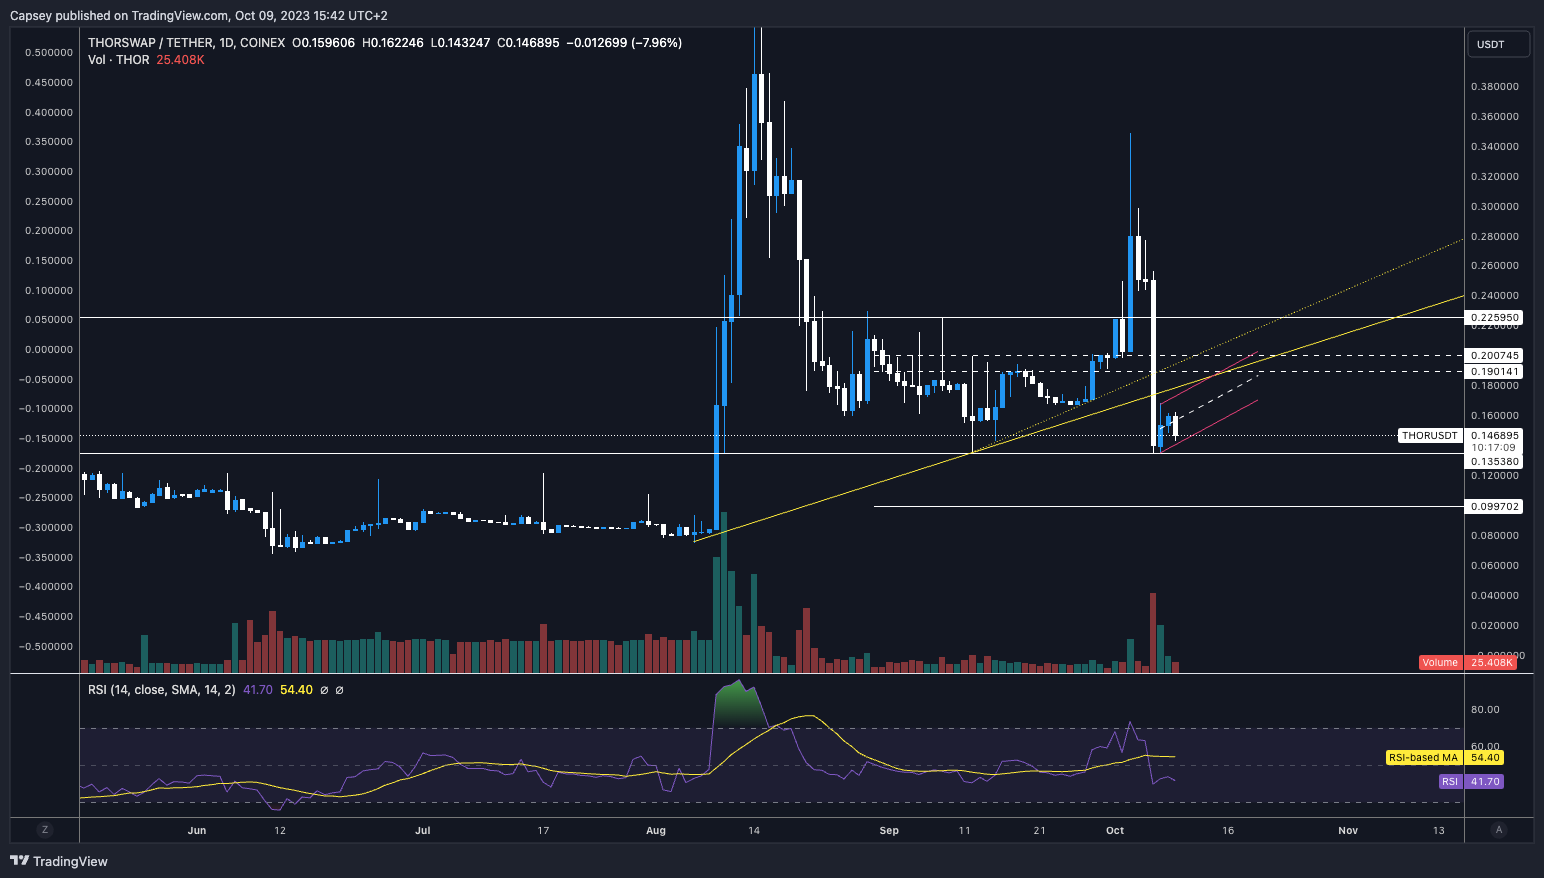
RSI and Funding Rates
We'd expect the RSI to be much lower here, so with it being sat at 41 on the daily timeframe; we feel it’s possible THOR can go lower here price-wise. THOR funding rates we do not have the data for.
Conclusion on trading THOR
The key is if the bar flag breaks down, where does it break down to? We would hope that it breaks down and can hold and bounce off of the horizontal support at $0.135. If it can’t do this, we think the door opens to another 10-20% downside. Let this one prove itself to you first before you start taking major positions.
Action
Again, let it prove itself to you. Perhaps it is not worth selling your bags here. If we get a relief bounce, and the bear flag breakdown will need to hold the $0.135 horizontal support to get this, then we will sell some of our bags if the price can retest the $0.17 level.
Cryptonary’s take
We give you all the ammo you need to make the smartest moves during this rough patch. Ultimately, the decision is in your hands; just make think it through and be sure you are making a rational decision.
It can be tempting to dive in and scoop up discounts when prices are down, but sometimes patience pays off more.
Consider taking some profit off the table if you get the chance. But more importantly, hold off aggressively buying the dip until we get more confirmation of an upward trend.
As always, thanks for reading.
Cryptonary out!
Recommended from Cryptonary


