Save 23% ($351) & Get a Free 1-1 Call with our Team ⏰ : 0d 2h 59m 44s
Steady hands win: Patience, despite the noise on crypto Twitter
The market has been more volatile than usual over the past week, but we continue to maintain a relaxed approach. We moved into more stable positions (the barbell portfolio) a few months back.

When we get that "macro green light" (the signal for Interest Rate cuts), we'll get more bullish overall and begin to go more fully risk-on again. For now, though, we will stay patient and wait for that signal.
We're relaxed here; there is no panic from our side, despite some of the opinions we see on the Twitter timeline. Today's market update provides insights to help you filter through the noise on crypto Twitter.
After a relatively hectic week last week with Bitcoin breaking below the $60k level, let's begin by diving into some key macro data points coming out this week and their implications for markets.
Key questions
- What crucial macro data is dropping this week, and how might it impact the Fed's next move?
- Why are some experts unfazed by Bitcoin's recent dip below $60k?
- What intriguing divergence is occurring between major stock indices and crypto markets?
- Are there hidden bullish signals in the technical charts of Bitcoin and Ethereum?
- What strategic portfolio approach should you adopt to navigate current market conditions?
Disclaimer: This is not financial or investment advice. You are responsible for any capital-related decisions you make, and only you are accountable for the results.
Last week's and this week's data
Last Friday, we had the release of the labour market data. This showed a slight uptick and a continuation of the uptrend in the Unemployment Rate from 4.0% to 4.1%. Alongside this, Non-Farm Payrolls (the number of jobs added in the US) still came in relatively strong at 206k.However, as we see every month, the figures for the last two months of Jobs' gains were revised substantially lower. There are some suggestions that these Jobs numbers are being made to look better than they actually are for political reasons going into an election.
But, the overall summary here is that the labour market is moderating, and this, therefore, aids the Fed cutting rates in the September argument - in order to moderate policy rather than keep it so restrictive that it pushes the economy into an outright recession.
The key macro data this week is Thursday's Inflation data. The figures are expected to come in the same as last month, but with the Headline Inflation rate falling from 3.3% to 3.1%.
The impact of the data on markets
We know the Fed has a dual mandate: to keep prices stable at 2% growth and maintain a healthy Employment market. We're now seeing disinflation along with a labour market that is moderating but not outright weakening. Last week's labour market data confirmed this; we expect the inflation data to show the same this Thursday.Therefore, the Fed should consider easing policy (reducing Interest Rates) to reduce how restrictive the "real interest rate" is. Otherwise, they risk causing a recession. This, as it stands—assuming the Fed doesn't push the economy over the edge and into a recession—is good for risk assets.
Market breadth and indexes
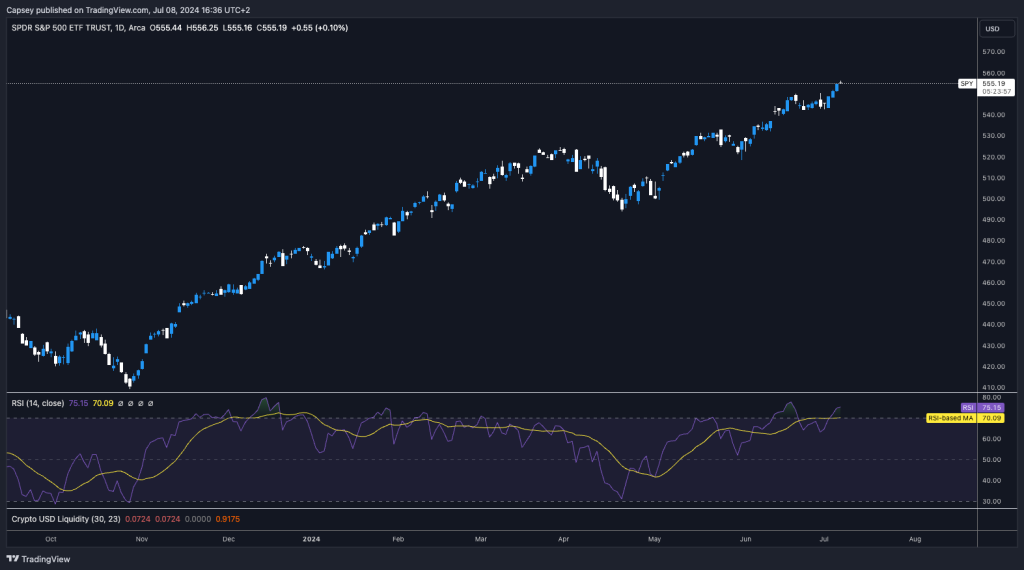
One slight cause for concern is that the TradFi markets have moved significantly higher in the last few weeks, whilst Bitcoin has sold off. The worry here comes if the S&P has a 5-10% sell-off. Does this mean Bitcoin and crypto have another further sell-off itself? One argument against this is that Bitcoin's correlation to the S&P is relatively low despite the correlation increasing recently.Bitcoin's Correlations
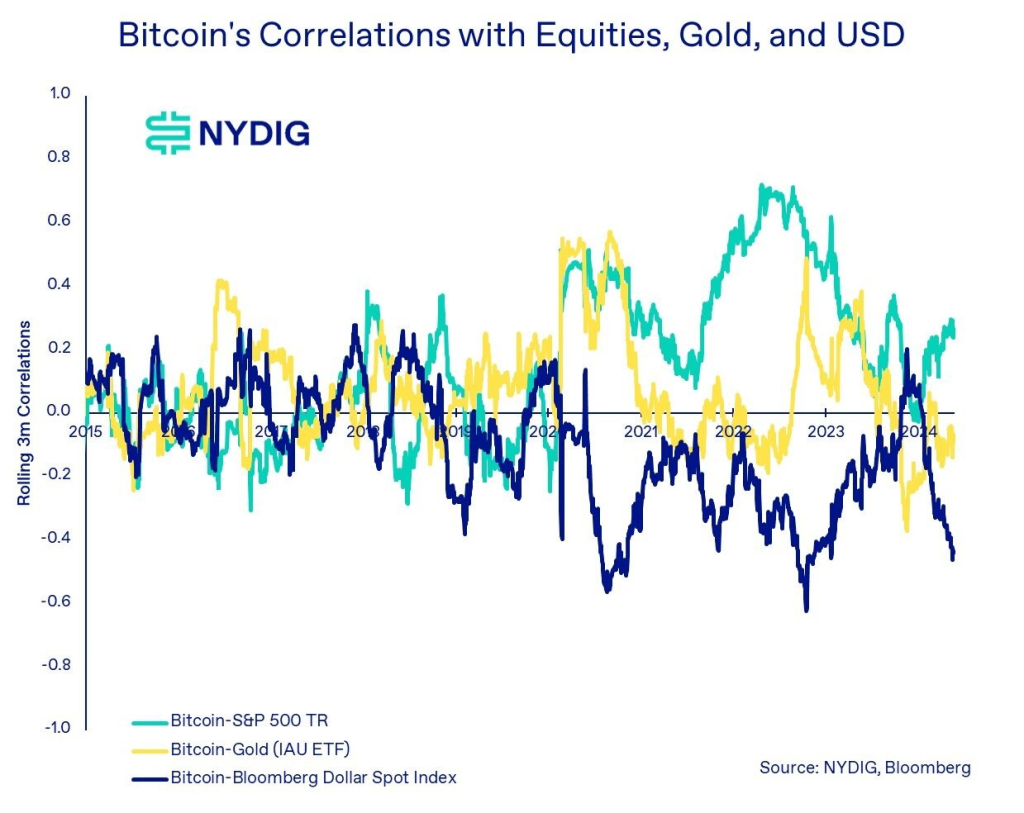
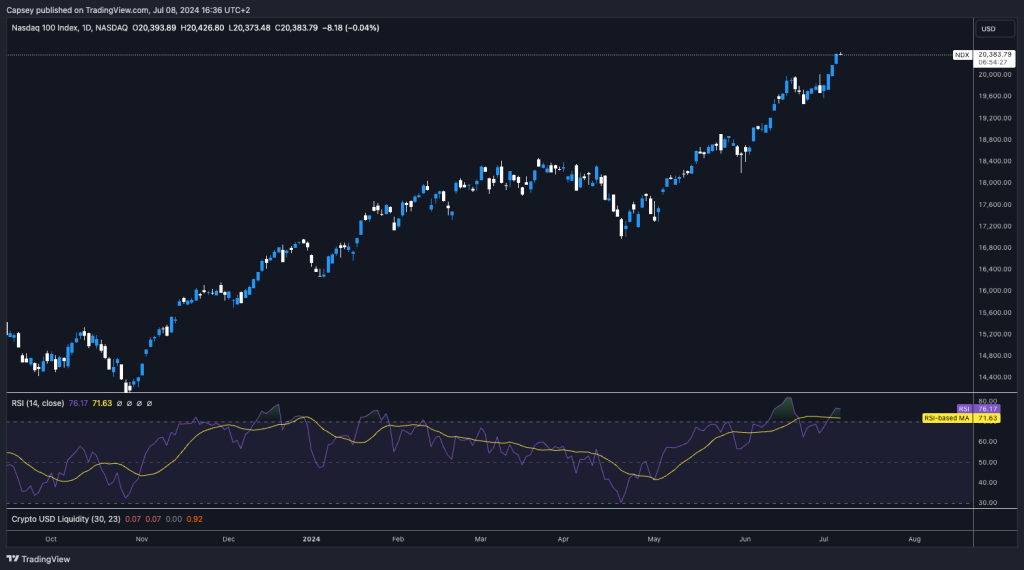
We can see the divergence between the S&P and the Nasdaq moving substantially higher, whilst Bitcoin has done the opposite.
S&P Chart
Nasdaq Chart
However, we can see that the Russell (Small-cap companies) hasn't hit highs and remains 5% off the highs.
Russel 2000 Chart

So, the S&P's performance is coming from the 'Mag 7' companies, and the concentration in those top stocks is becoming increasingly concentrated.
The Russell and the equal-weighted S&P Index will do well again once Interest Rate cuts come, as that will reduce the debt servicing costs of small-cap companies.
Capital will rotate into smaller caps, and this market-broadening effect will also be positive for the risk assets furthest along the risk curve: Bitcoin and crypto.
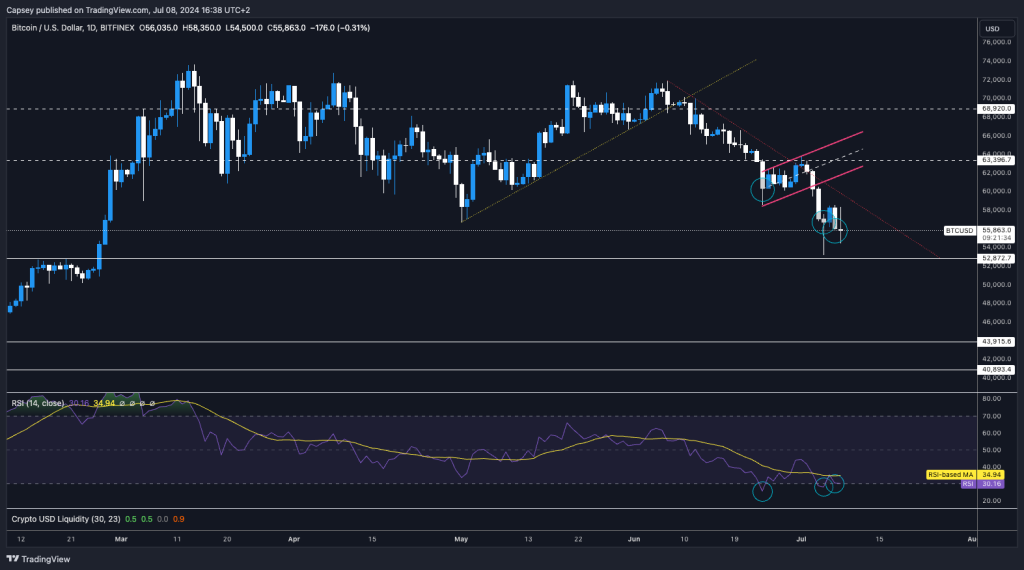
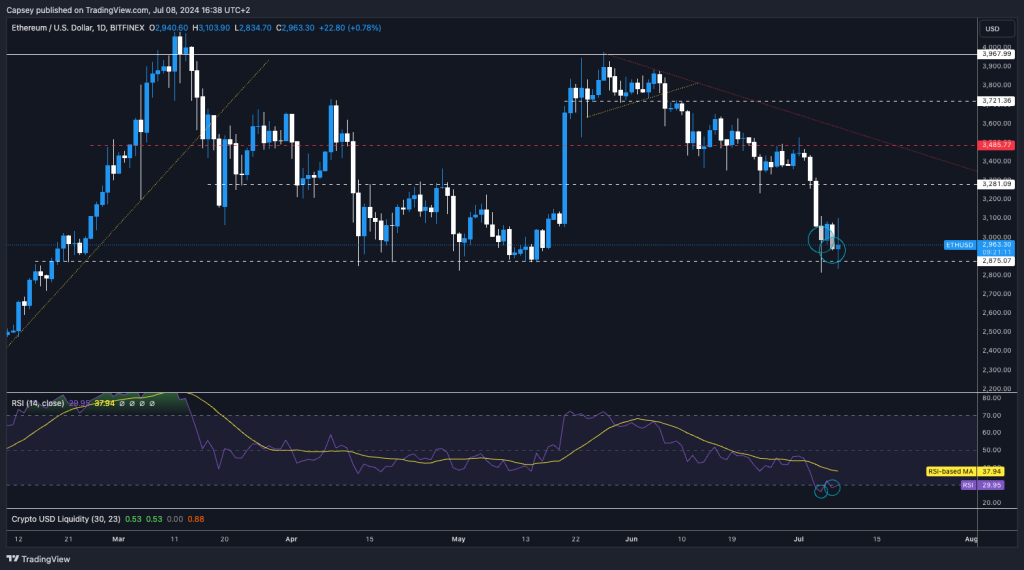
Bullish divergences on majors - educational
A strong technical pattern is when price bounces off a support area, but price puts in lower lows, whilst the RSI oscillator puts in higher lows, particularly if these lows on the RSI oscillator are in oversold territory (below 30 on the RSI).The turquoise bubbles on the chart show this. We're currently getting this on Bitcoin and ETH, which is a rare formation from a technical standpoint. These formations are usually bullish for price action going forward.
For Bitcoin, the short-term target should be $60,000. For ETH, the target is $3,220.
BTC 1D Chart
ETH 1D Chart
Cryptonary's take
We expect prices to struggle over the next month or two, even though we think we could see a small bounce in the coming days. Despite this, we're still constructive on the market and continue to hold core positions, as we expect the macro "green light" to come from the Fed on the July 31st Fed Meeting or at Jackson Hole in mid-August for a September Interest Rate cut.Of course, we're bullish from September onwards, and we expect the bull market to continue fully.
Currently, the market has a heavy supply overhang from the Mt Gox coins and the German government's sale of seized Bitcoins. For now, we see this as short-term noise and are still dip buyers.
The strategy is to stay positioned in the barbell strategy: BTC, ETH, SOL, WIF and POPCAT, and continue to build up USDT reserves. When the time is right (when we get that macro "green light"), we'll then look to put the USDT we've built up to work.
Recommended from Cryptonary


