Save 23% ($351) & Get a Free 1-1 Call with our Team ⏰ : 0d 2h 59m 43s
Sui and Jupiter at make-or-break levels
Sui and Jupiter are at a crossroads as they revisit major demand zones. With resistance levels holding strong, can bulls regain momentum, or is further downside ahead? Let's dive into their price action and what's next for these key assets.

Disclaimer: This is not financial or investment advice. You are responsible for any capital-related decisions you make, and only you are accountable for the results.
Sui ($SUI)
Overview
Sui has been in a retracement phase after breaking down from its daily uptrend, confirming a bearish structure shift since mid-January. The breakdown below $4.50 and $4.20 led to a steady decline, bringing it back to a key demand zone from November 2024.This area previously acted as an accumulation base before Sui's 230% rally from $1.60 to $5.30 between November and January. Currently, Sui is hovering above this demand zone, making it a critical level to watch for either a potential reversal or deeper correction.
Key levels
- Support Levels
- $2.34 - A recent reclaim level acting as immediate support
- $1.86 (Midpoint of Weekly Demand Zone) - Unmitigated liquidity area, potential downside target
- $1.60 - $2.10 (Weekly Demand Zone) - Major demand area that previously triggered a strong bullish move
- Resistance Levels
- $2.86 - Immediate resistance level Sui needs to reclaim
- $3.19 - Next resistance level before a broader trend shift can occur
Potential scenarios
- Bullish Case - If Sui holds above $2.34 and consolidates, it could attempt a move toward $2.86 and $3.19 as the market stabilizes.
- Bearish Case - If $2.34 fails as support, a deeper correction could see Sui testing the demand zone and potentially $1.86.
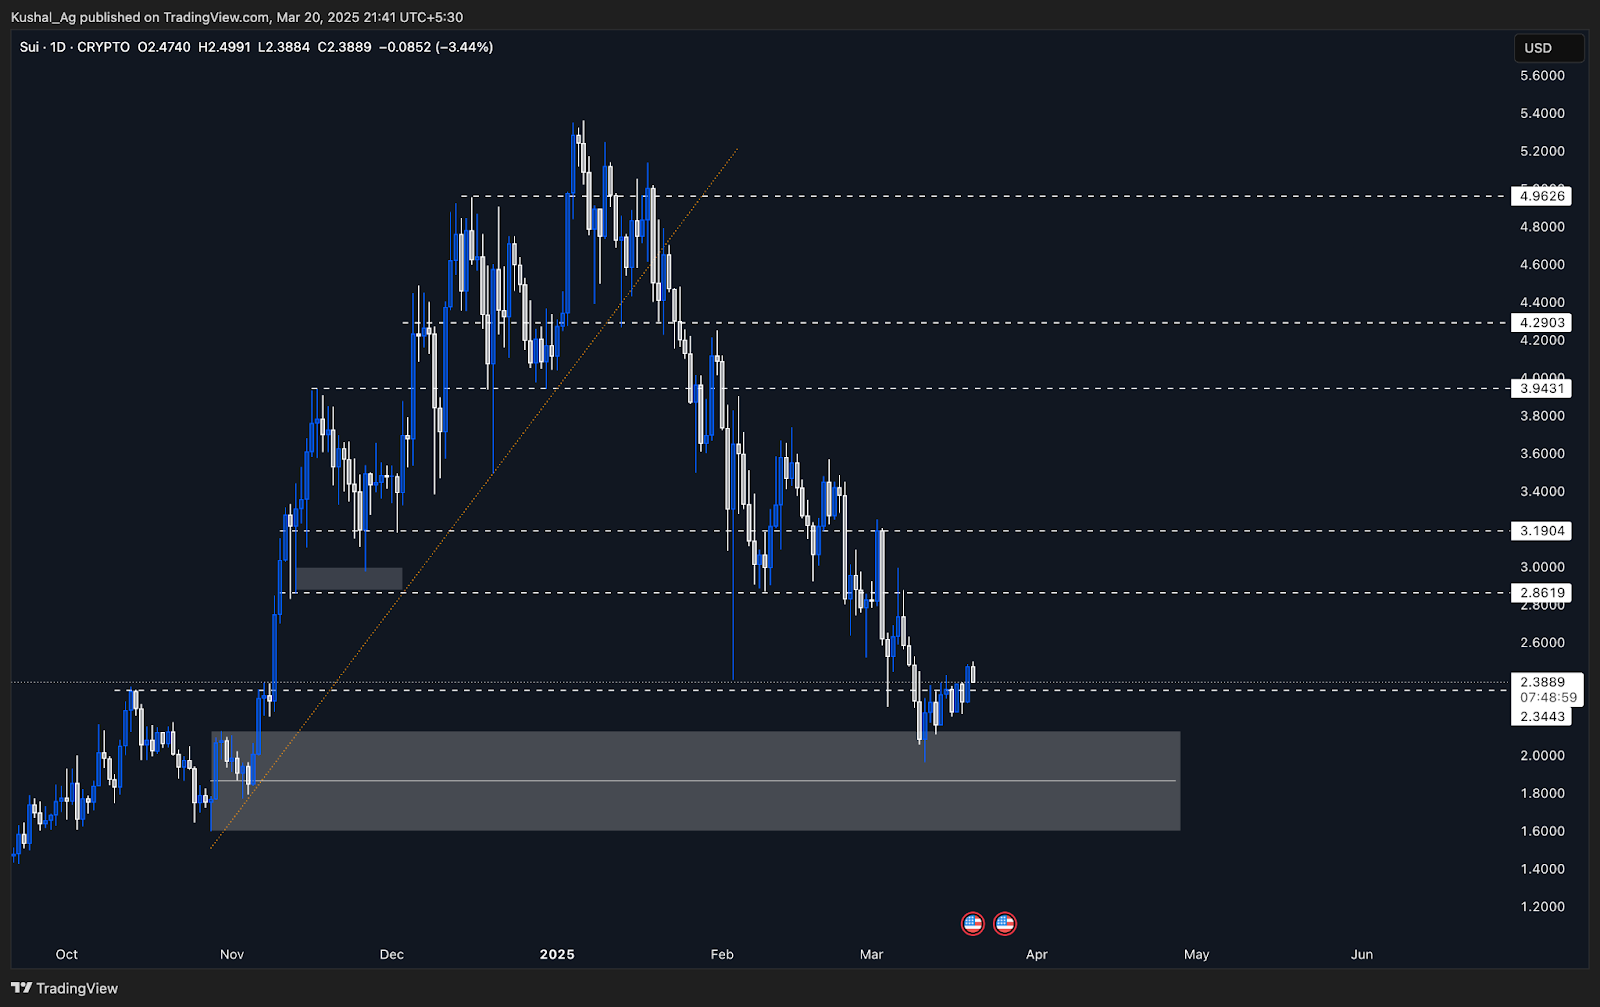
Cryptonary's take
Sui's structure remains weakened, but it has now entered a historically strong demand area. If it holds, this could act as a re-accumulation phase before another potential upside move.However, a failure to reclaim $2.86 and $3.19 would indicate further downside, making the weekly demand zone the last line of defence for a long-term bullish structure.
Jupiter ($JUP)
Overview
Jupiter has retraced back to its March 2024 origin levels, marking its first revisit to this accumulation zone since the 300% rally to $1.847 earlier last year. This move brings Jupiter into a key demand area, which ranges from $0.471 to $0.629.Historically, Jupiter never retested these levels after its explosive breakout, making this a crucial test for the asset's next directional move. The asset recently broke below $0.6843, a level that had acted as strong support throughout 2024.
Reclaiming this level is critical for a technical shift in momentum. Until then, Jupiter remains in an accumulation phase, with the potential for further downside if buyers do not step in at these historical levels.
Key levels
- Support Levels
- $0.471 - $0.629 - Accumulation range, first major demand area
- $0.4281 - Deeper support below the accumulation range
- Resistance Levels
- $0.6843 - Key resistance and previous strong support; reclaiming this is crucial for a bullish shift
Potential scenarios
- Bullish Case - If Jupiter establishes a base within the accumulation range and reclaims $0.6843, it could signal a potential bottom formation, allowing for a move back toward higher levels.
- Bearish Case - If Jupiter fails to hold the accumulation range and breaks below $0.471, it could see further downside, potentially testing $0.4281 as the next support.
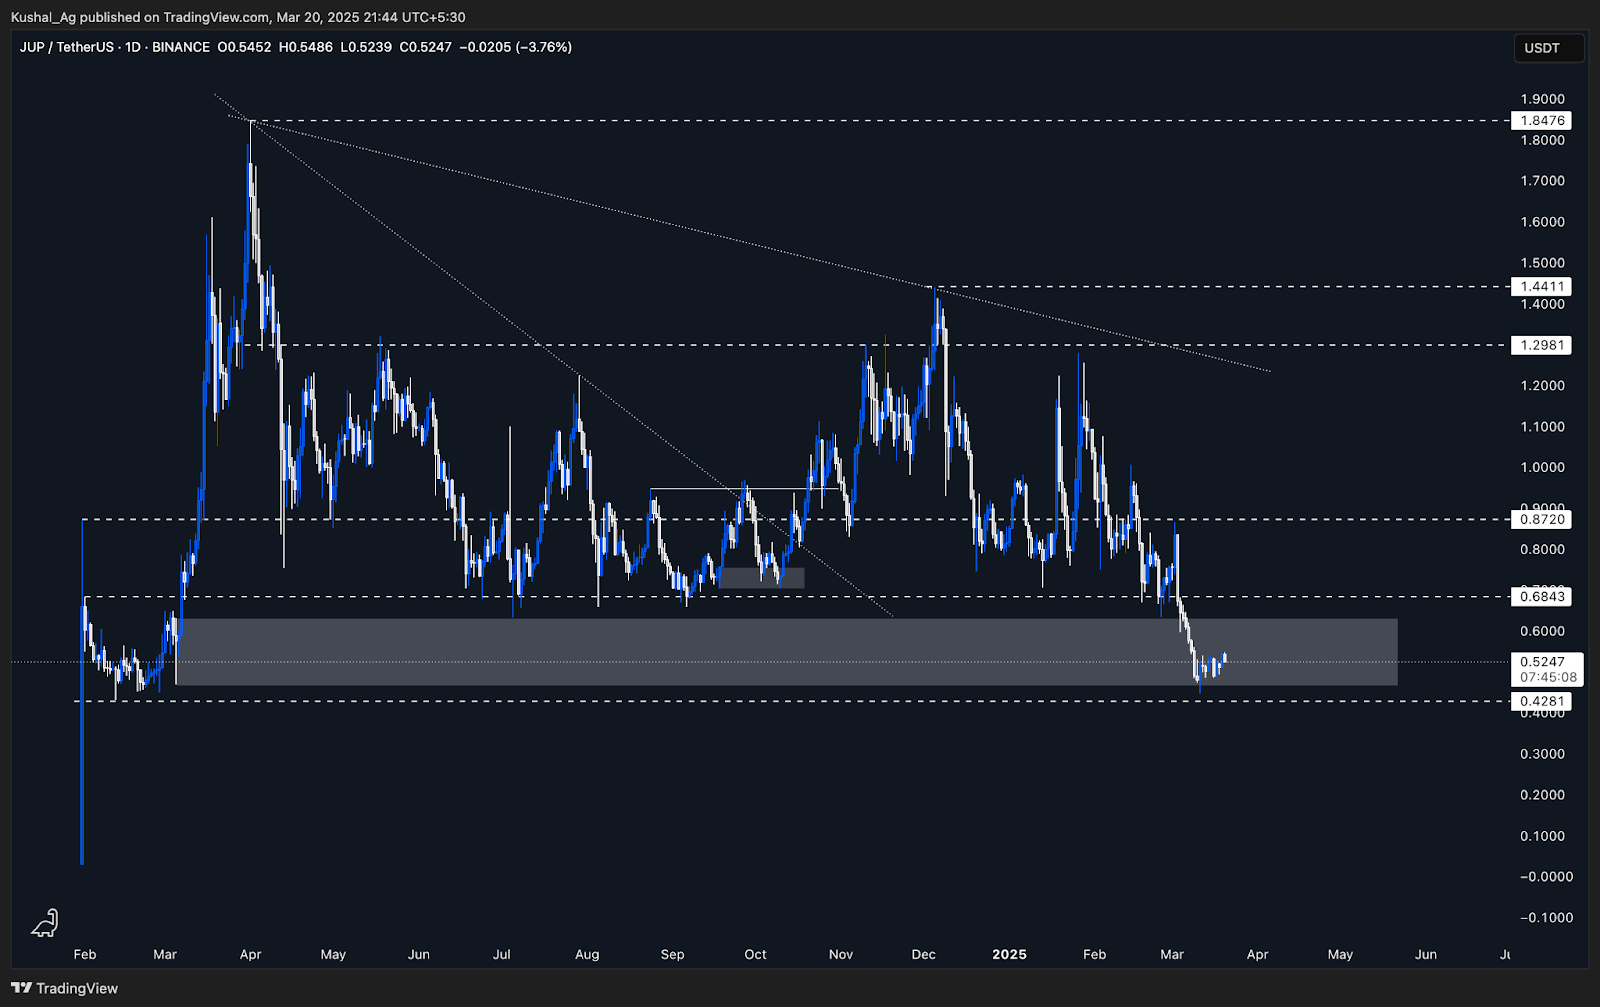
Cryptonary's take
Jupiter is in a critical phase, returning to an area of previous strength that fueled a major rally earlier this year. Whether this becomes a new accumulation zone or a breakdown point will depend on the strength of buyers stepping in here.The most important factor is reclaiming $0.6843-without this, Jupiter remains in a weak position and at risk of further decline.
Recommended from Cryptonary


