Save 23% ($351) & Get a Free 1-1 Call with our Team ⏰ : 0d 2h 59m 43s
Disclaimer: This is not financial or investment advice. You are responsible for any capital-related decisions you make, and only you are accountable for the results.
SUI:
Market context
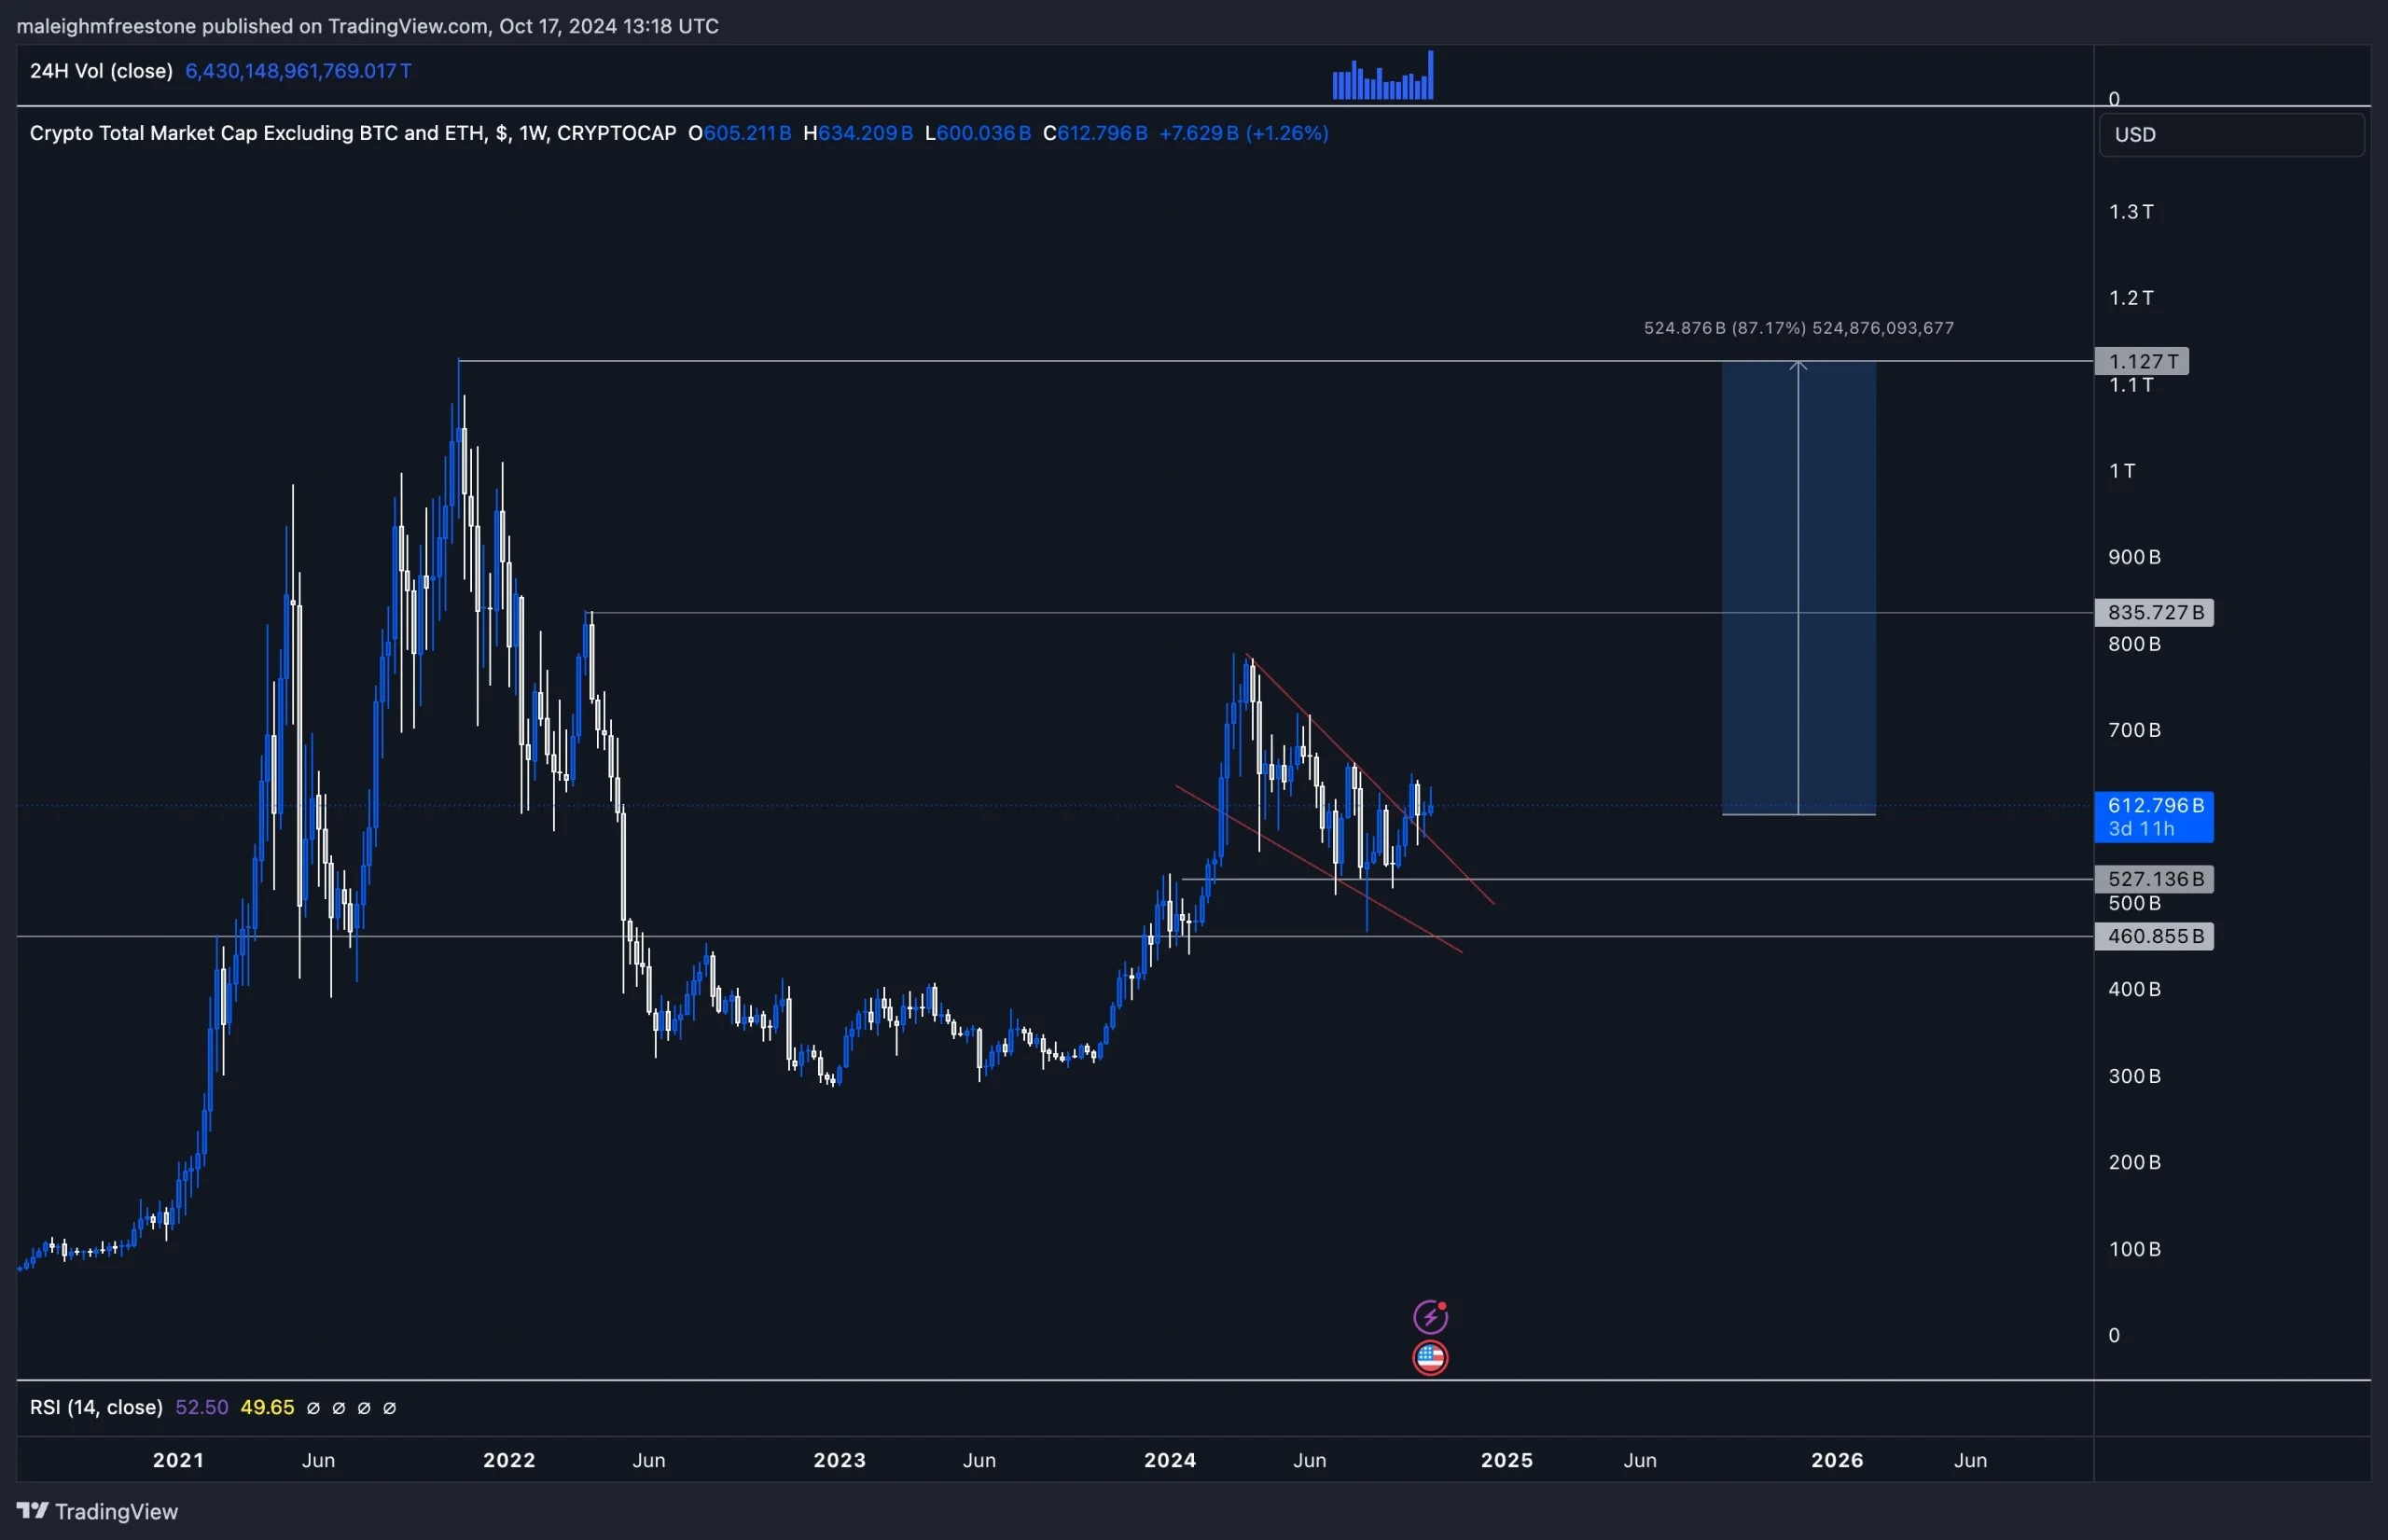
Last week's weekly candle for SUI has really set the tone for potential upside. The $2 level was breached, marking a significant resistance point where key selling pressure was previously found. While there was a higher probability of the market retracing, it didn't happen, which makes this even more interesting now.What's crucial going forward is how the market treats $2. A key educational point here is that setting a higher high in price indicates that buyers are willing to pay a higher price. The fact that buying is now occurring above the $2 mark signals demand at that level.
If SUI sustains above $2, this could become the new floor, which is impressive considering its recent performance. SUI has outperformed most other assets over the last couple of months, dominating market attention and performing exceptionally well.

Playbook & hypothesis
- Resistance is now at the $2.36 mark. Current support is $2. We're seeing some buy-in on the daily timeframe, which will be interesting to monitor.
- In the event of a breakdown, $1.8 serves as midterm support, with key support at $1.4 if selling intensifies. But for now, the focus remains on the $2 level.
- SUI has captured significant mindshare, leading to strong performance.
- With key catalysts discussed in market updates pointing to potential high prices in November, December, and Q1, building spot positions remains attractive. Leverage trading isn't advisable at this point, as the market could experience volatility.
- From a broader perspective, the total three market cap is still 85% off all-time highs, meaning there is still potential for capital flow into assets like SUI as attention moves beyond majors and into high-performing alts.
Key levels
- $2.36 (resistance)
- $2 (support)
- $1.8 (midterm support)
- $1.4 (key support)
Risk management
Given SUI's recent performance and the upcoming catalysts, we suggest focusing on spot positions rather than leverage trades. As the total three market caps start to gain traction and Bitcoin dominance potentially decreases, SUI could continue to benefit from market flows. The key question is how much further it can run this cycle, and for long-term holders, accumulating spot positions remains a sound strategy.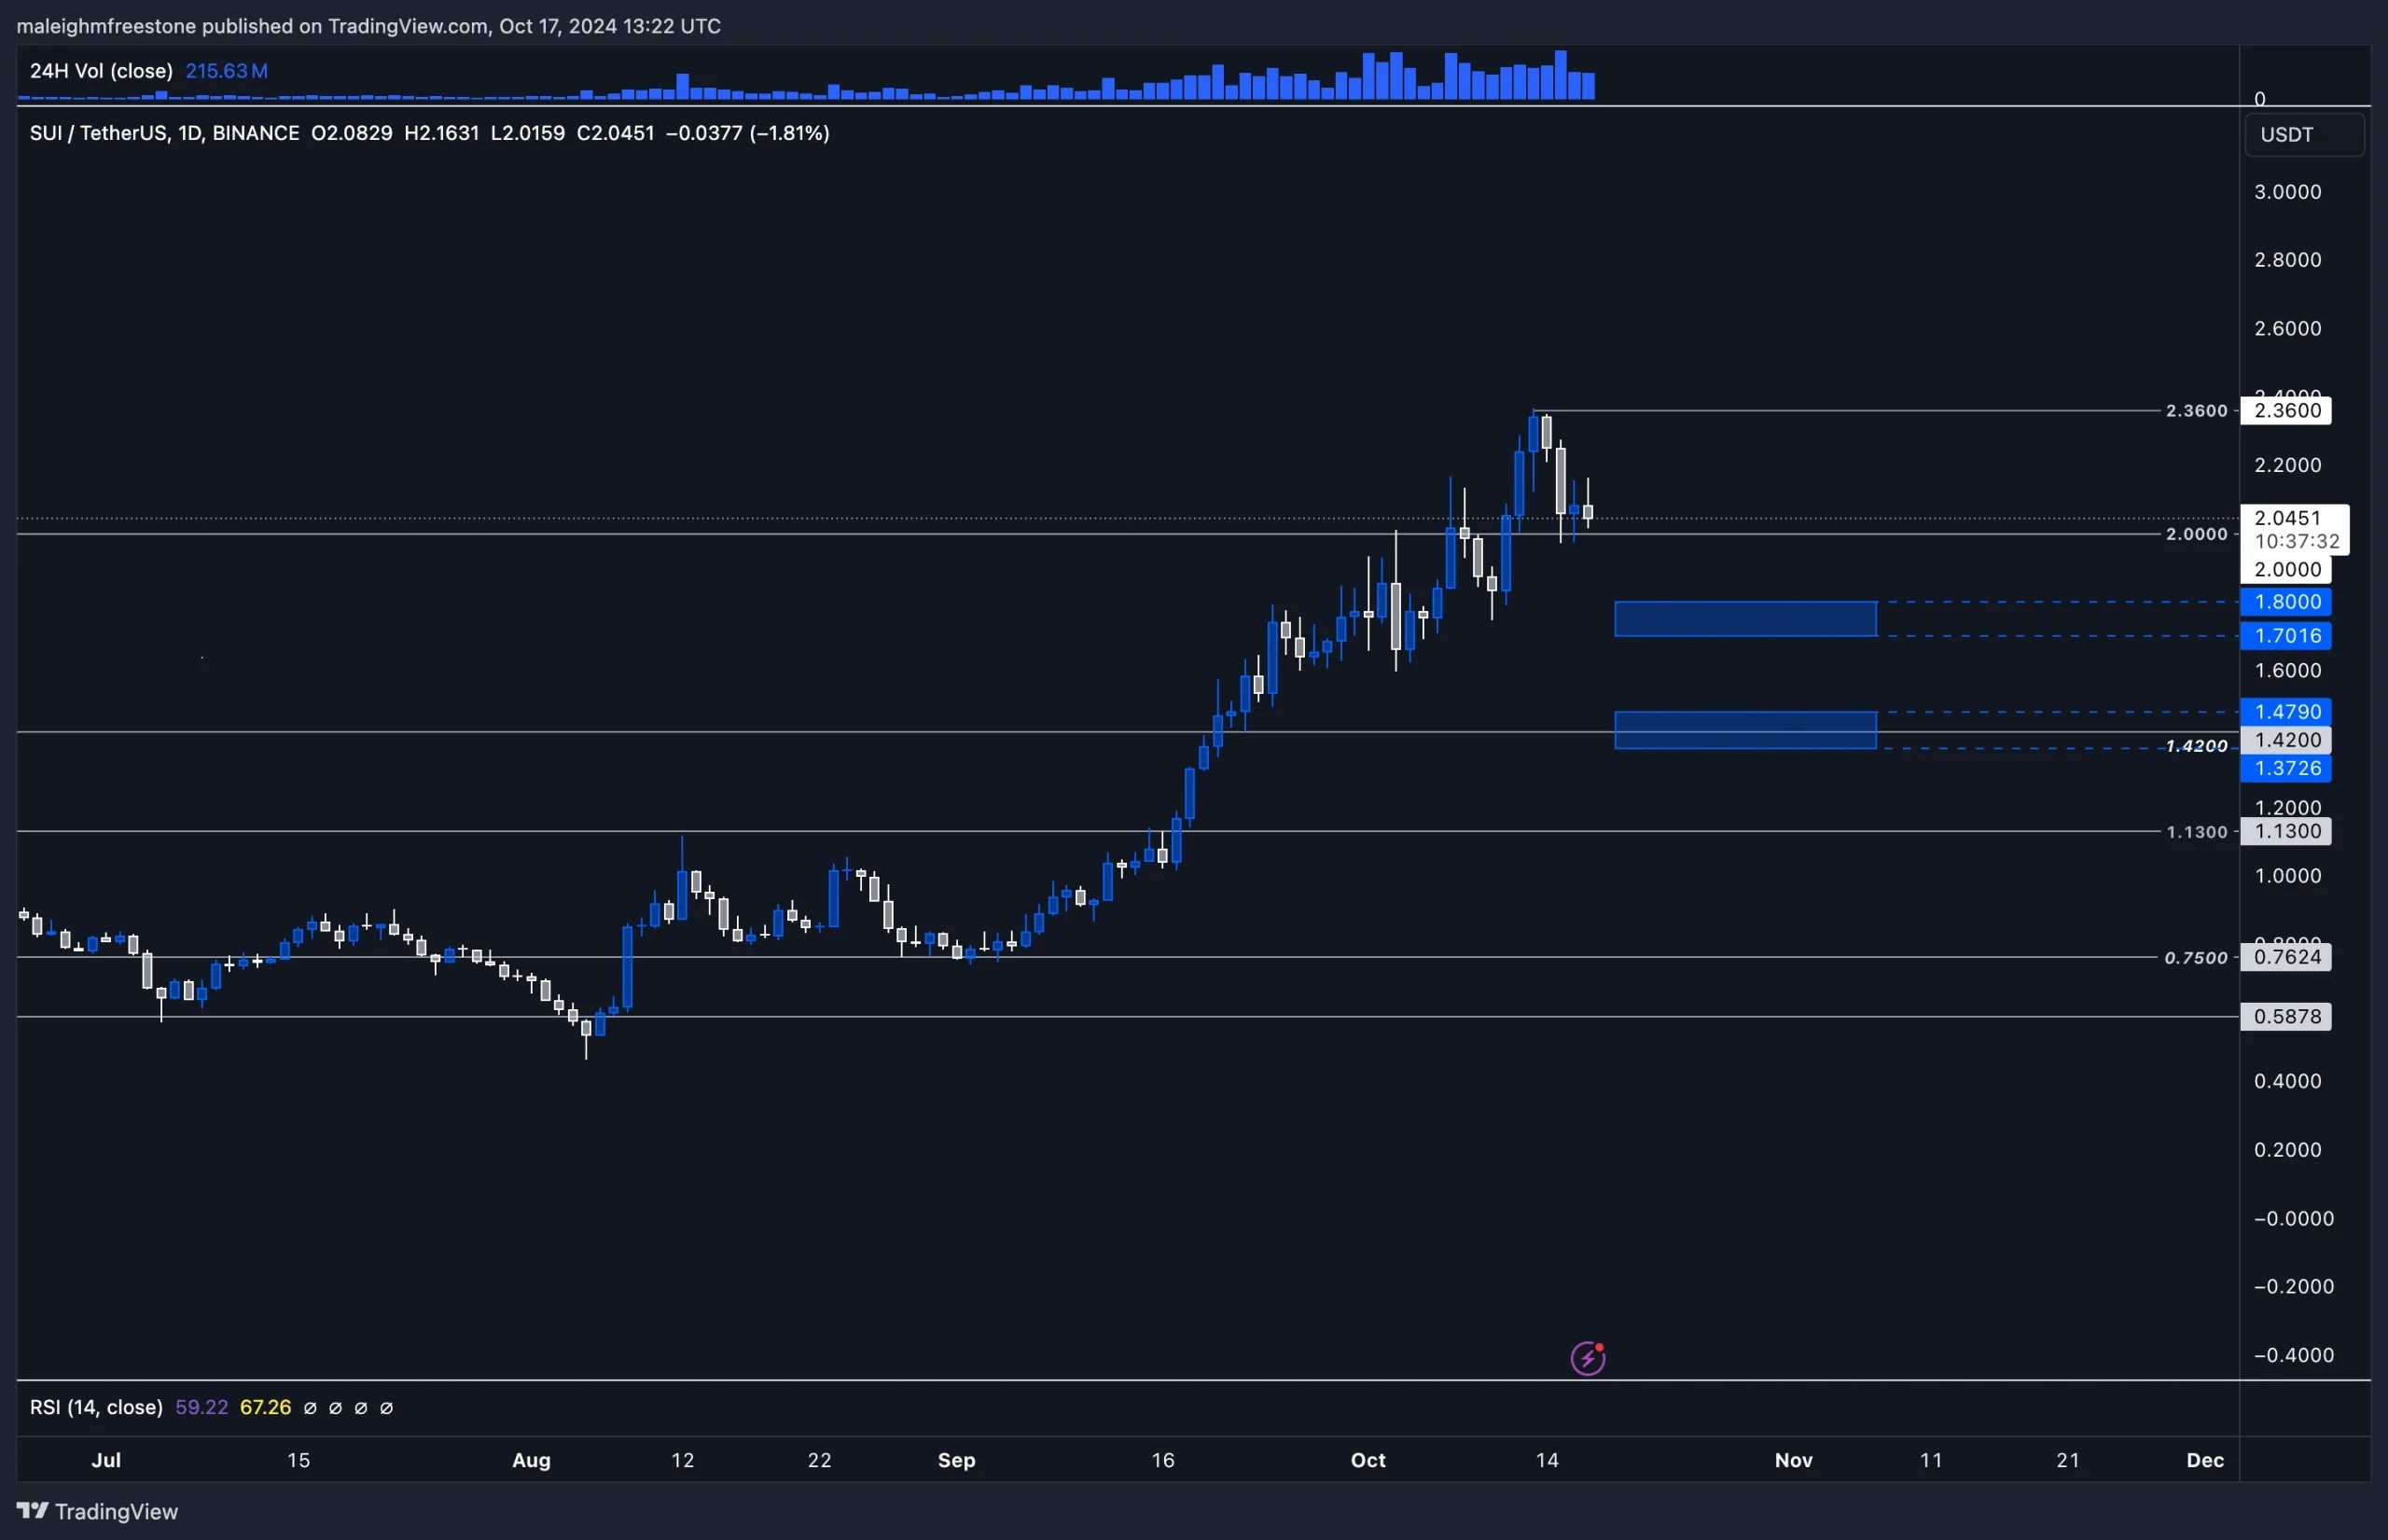
Cryptonary's take
SUI has been one of the best-performing assets in recent months, and the fact that it's holding above $2 suggests strong market demand. If we can sustain above this level, SUI could continue its outperformance, especially as we move into a period of potential market catalysts.With the total three market cap still significantly off all-time highs, there's room for assets like SUI to see further upside as market dynamics potentially shift. Accumulation here seems wise, but stay cautious with leverage positions, as the market is still in a key phase. This isn't an asset we are invested in or have on CPRO Picks, but here we are highlighting its performance.
KASPA:
Market context
We've observed some interesting developments on Kaspa, particularly around the $0.13 level in August. Historically, this has been a key level of support, as we saw back in March. Recently, we've seen it act as support again, especially last week, indicating that this is a key level for the asset.Now, on the higher timeframes, $0.1 to $0.107 is a key level to watch. This is significant because Kaspa has previously found demand at these levels, creating an interesting chart structure with higher highs and higher lows. This is one of the reasons why Kaspa has been a popular asset that we've monitored closely, especially when looking at opportunities within altcoins.
Although we're not invested in Kaspa, it has captured attention. For members who have been accumulating around the $0.1 to $0.09 range, strong historical support was found could be an excellent area to consider building positions. While we aren't certain we'll revisit those prices, this is still a good area to watch for investors looking to reestablish their stance.
Playbook
- A move from $0.1 up to the highs would present around a 100% move, offering a potential 2x return. Beyond that, there could be further upside potential.
- In comparison to other projects, Kaspa has outperformed in this phase of the market, showing resilience and strength.
Key levels
- $0.13 (recent support)
- $0.1 to $0.107 (key support to watch)
- $0.09 (strong historical support)
Risk management
If you're looking to build a position in Kaspa, this area, around $0.1 to $0.09, could provide a solid entry point based on historical support levels. Watch for how the asset responds to these price points before making moves.Cryptonary's take
Kaspa has shown strong behaviour at these key levels, holding its ground even during periods of market weakness. The area between $0.1 and $0.09 looks particularly attractive for accumulation, especially given the potential for a 2x move back to previous highs.While not an asset we're currently invested in, it remains a standout in this cycle and could continue to perform well as the market develops. Stay patient and monitor how these levels hold up before committing to any position.
Recommended from Cryptonary


