Save 23% ($351) & Get a Free 1-1 Call with our Team ⏰ : 0d 2h 59m 43s
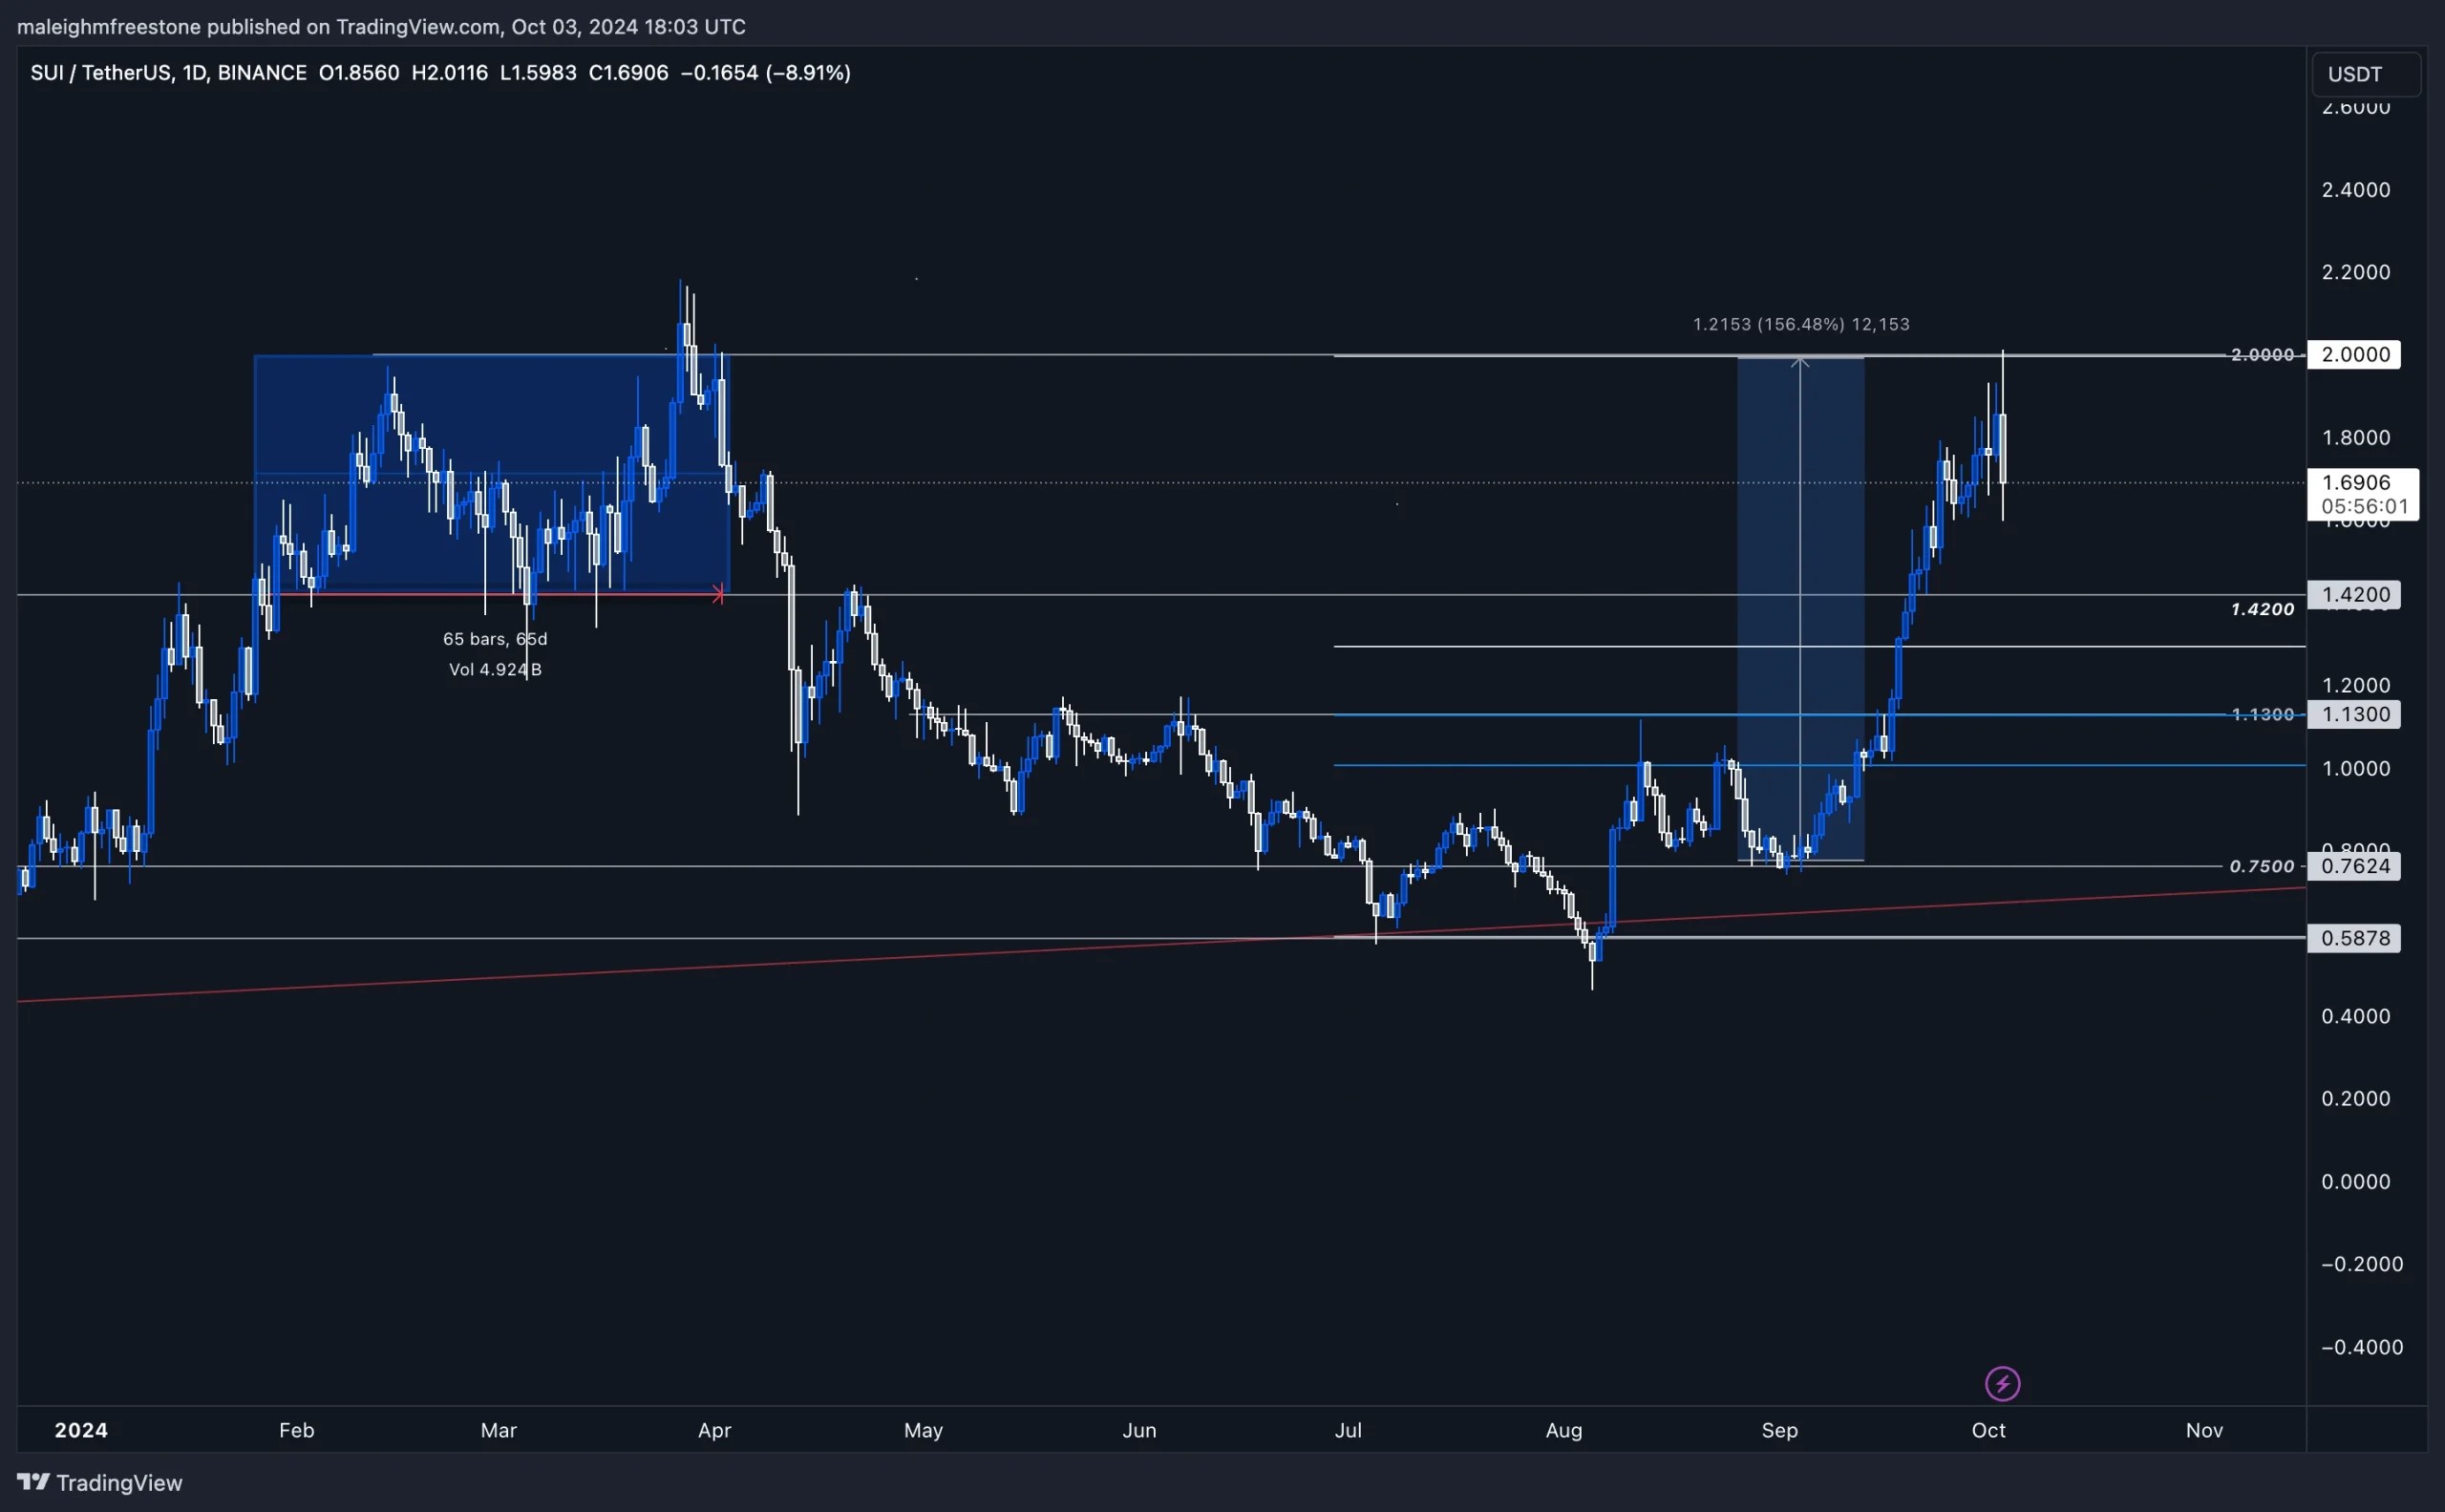
SUI technical analysis: $1.42 support and $2 target
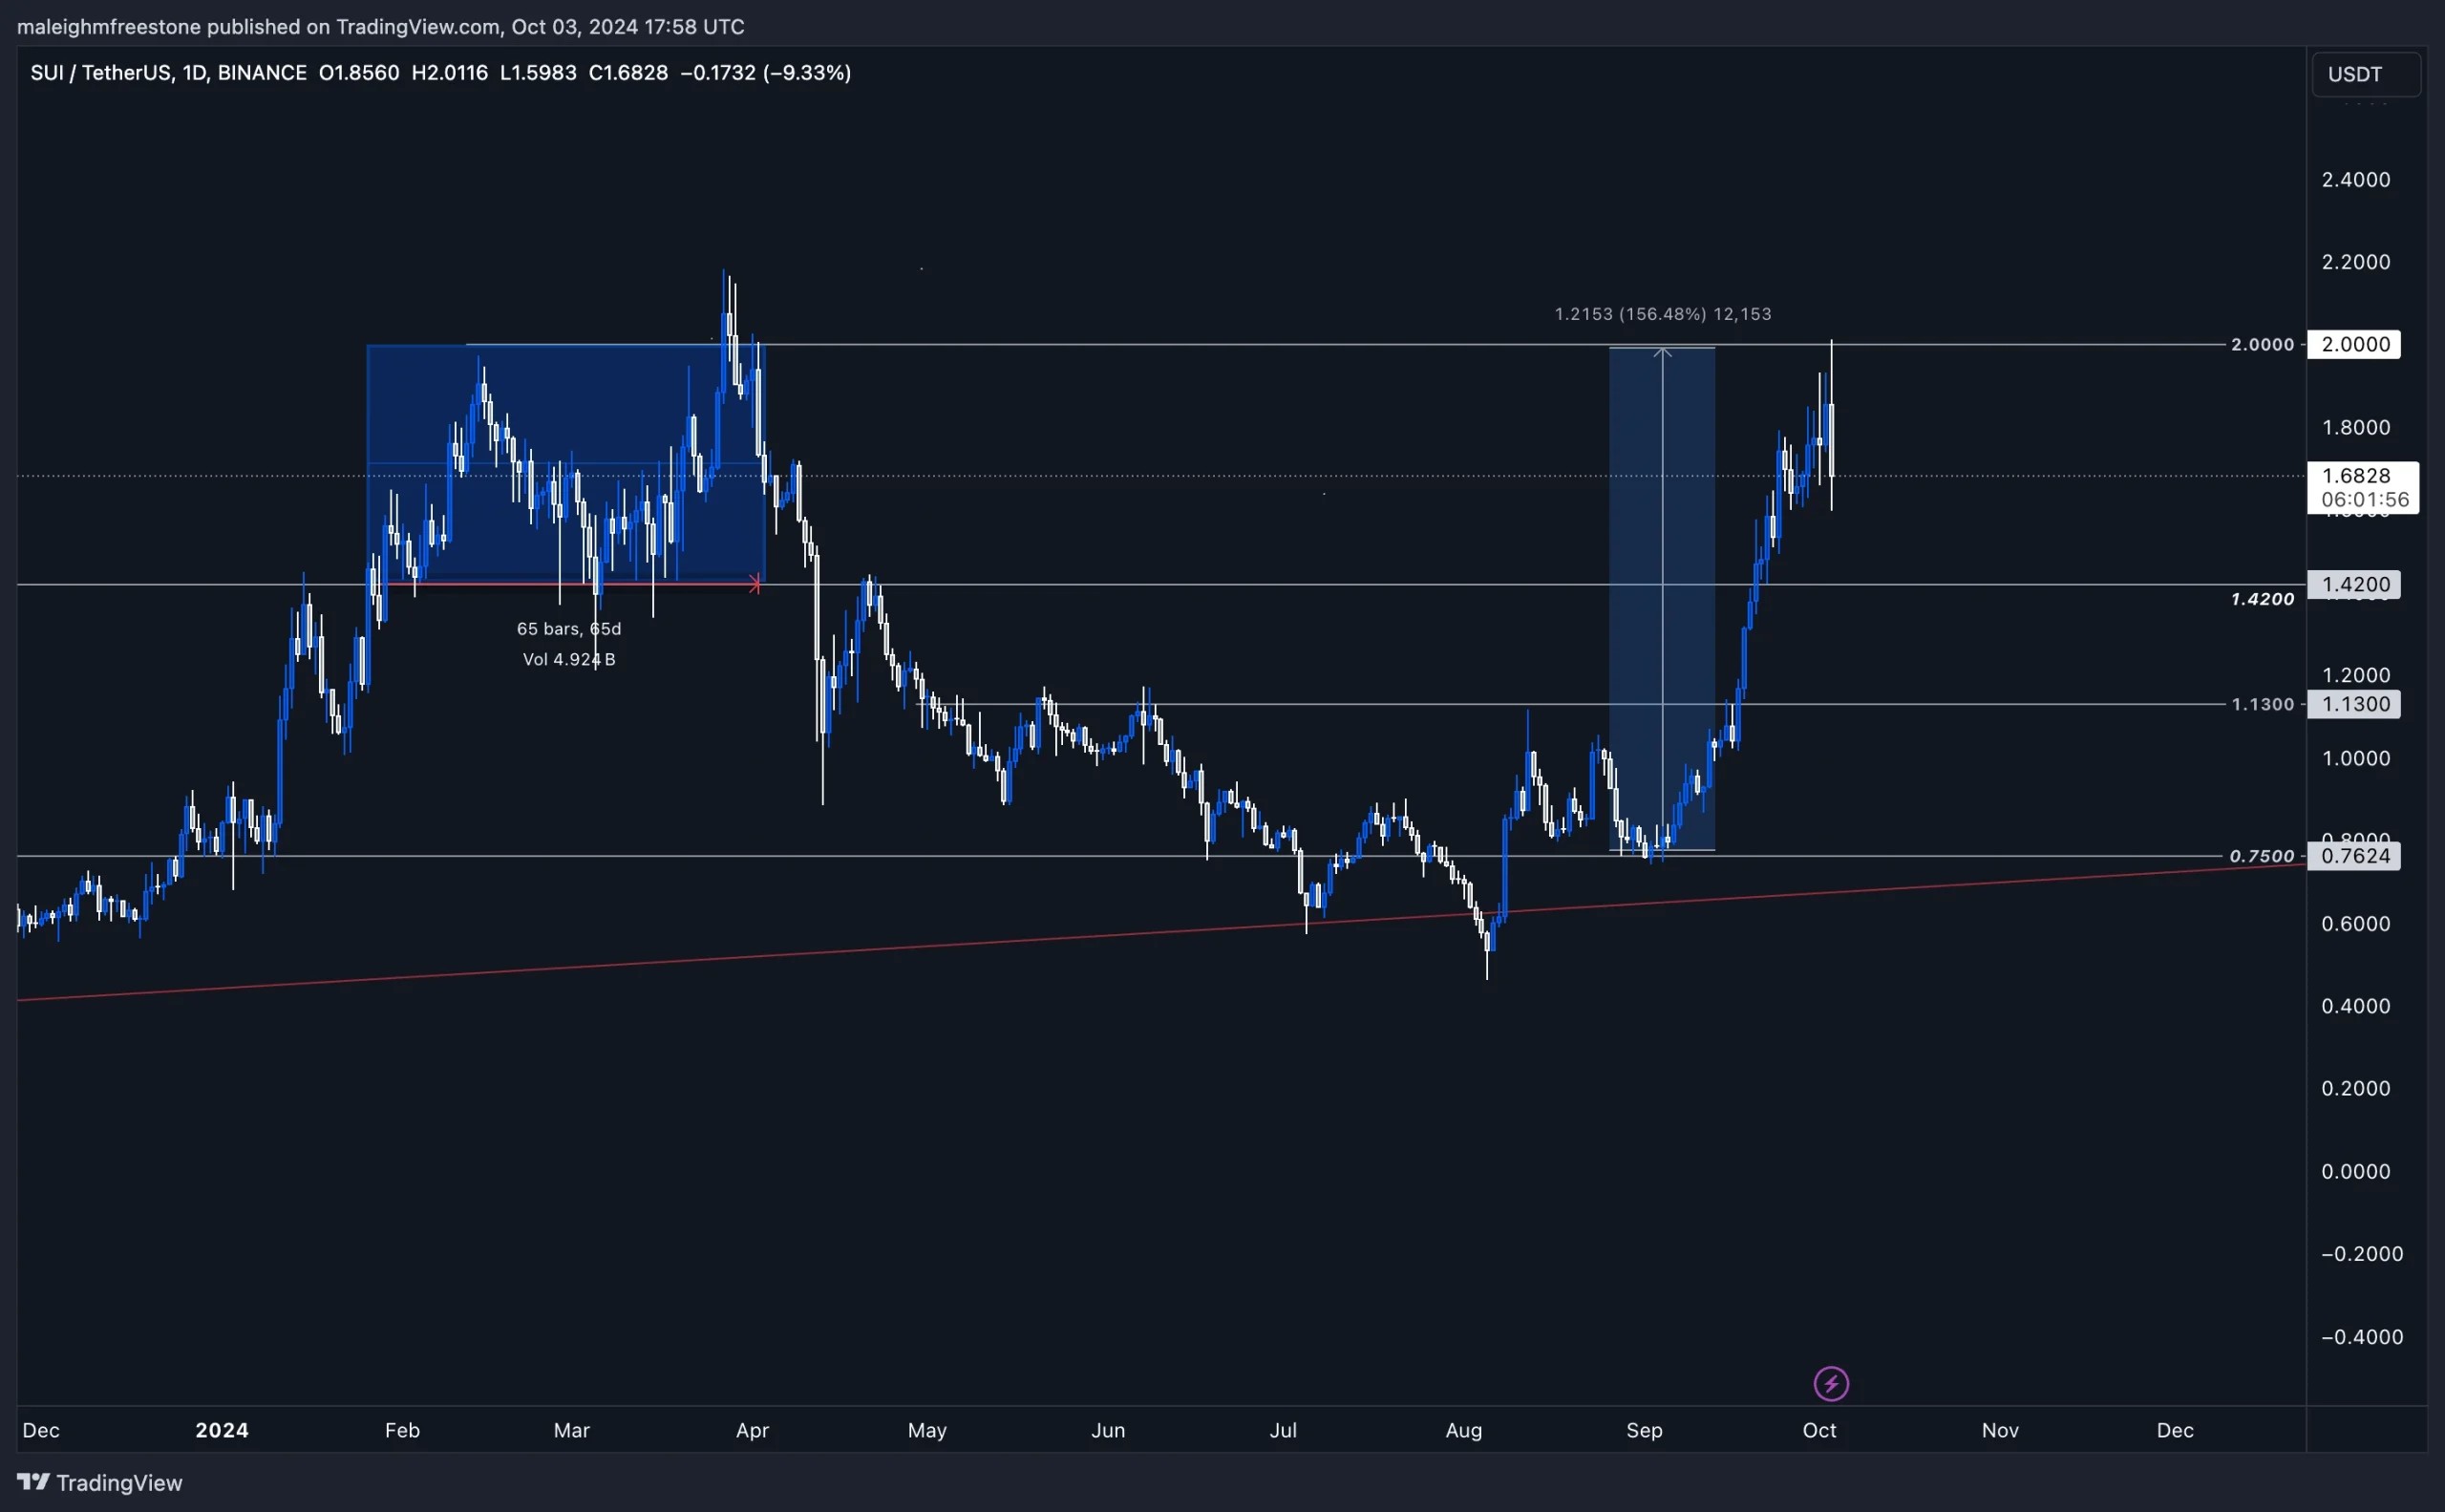
From a technical perspective, SUI saw a 163% move to the upside, rising from $0.75 to a peak of $2. This move now seems to be exhausting around the $2 price point, a level that has been tested multiple times earlier in the year (February, March, and April). The downside floor appears to be within the range of $1.42, a key area to keep in mind given its significance as support during a 68-day period earlier on in the year as well as almost the range floor for the $2 tests. Additionally, it acted as strong resistance on both January 15th and April 21st, establishing this level as a key price point.
Market context
SUI has shown exceptional strength, standing out as one of the top gainers over the past month with a notable increase of 30% in market cap. Its nearest competitor, TAO, trails behind by 20%, highlighting the dominance and momentum behind SUI.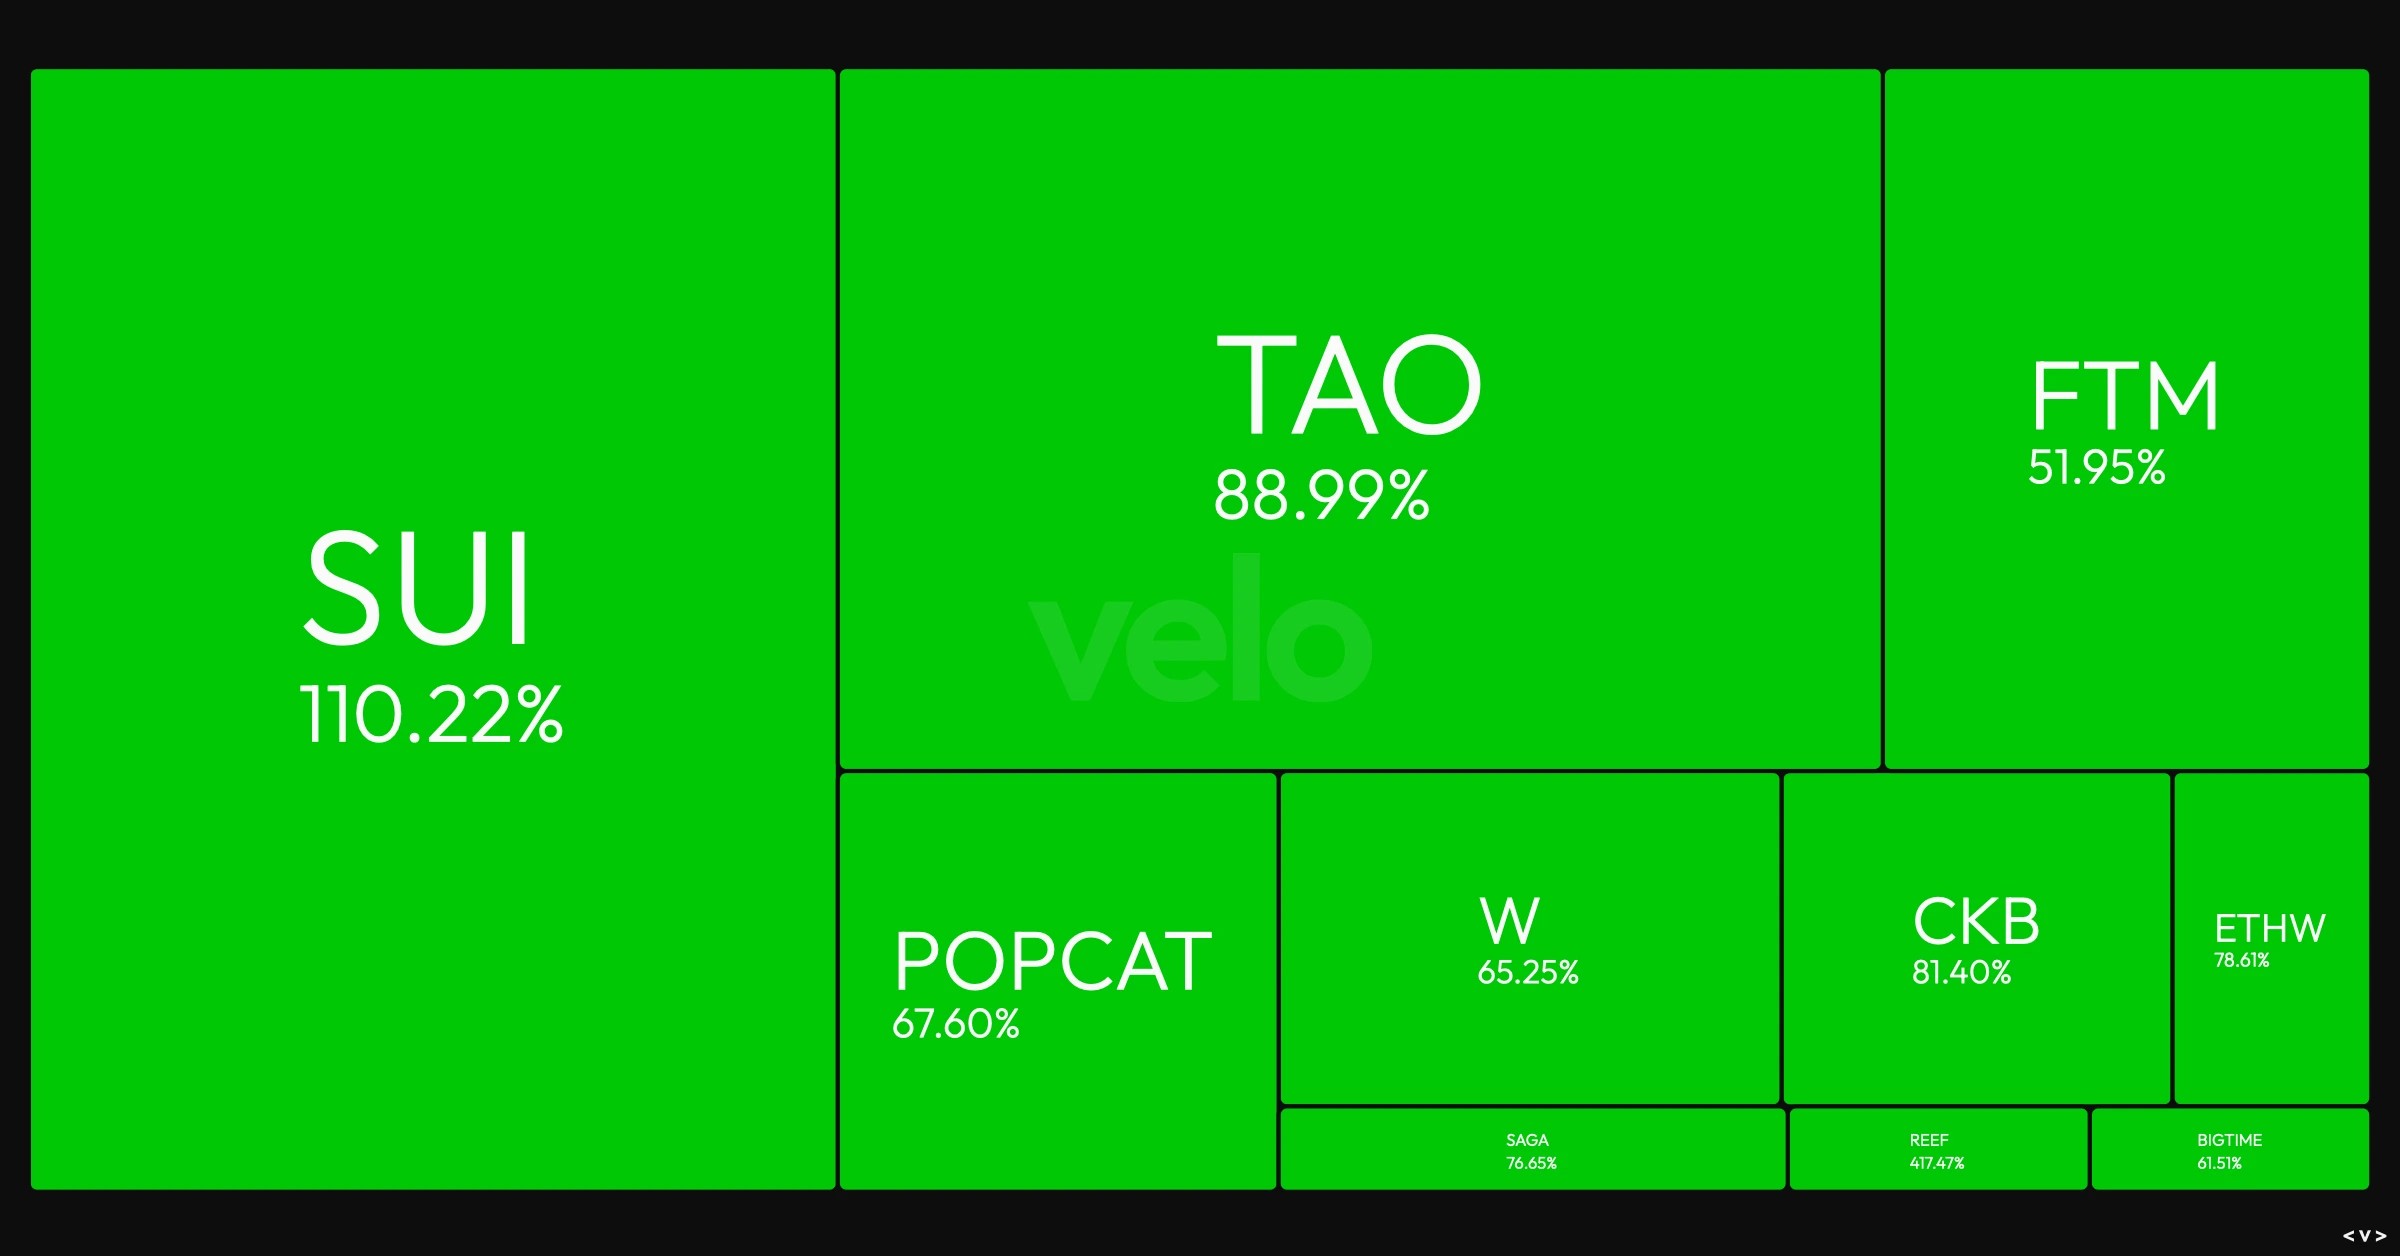
Disclaimer: This is not financial or investment advice. You are responsible for any capital-related decisions you make, and only you are accountable for the results.
Market mechanics
Liquidation Levels
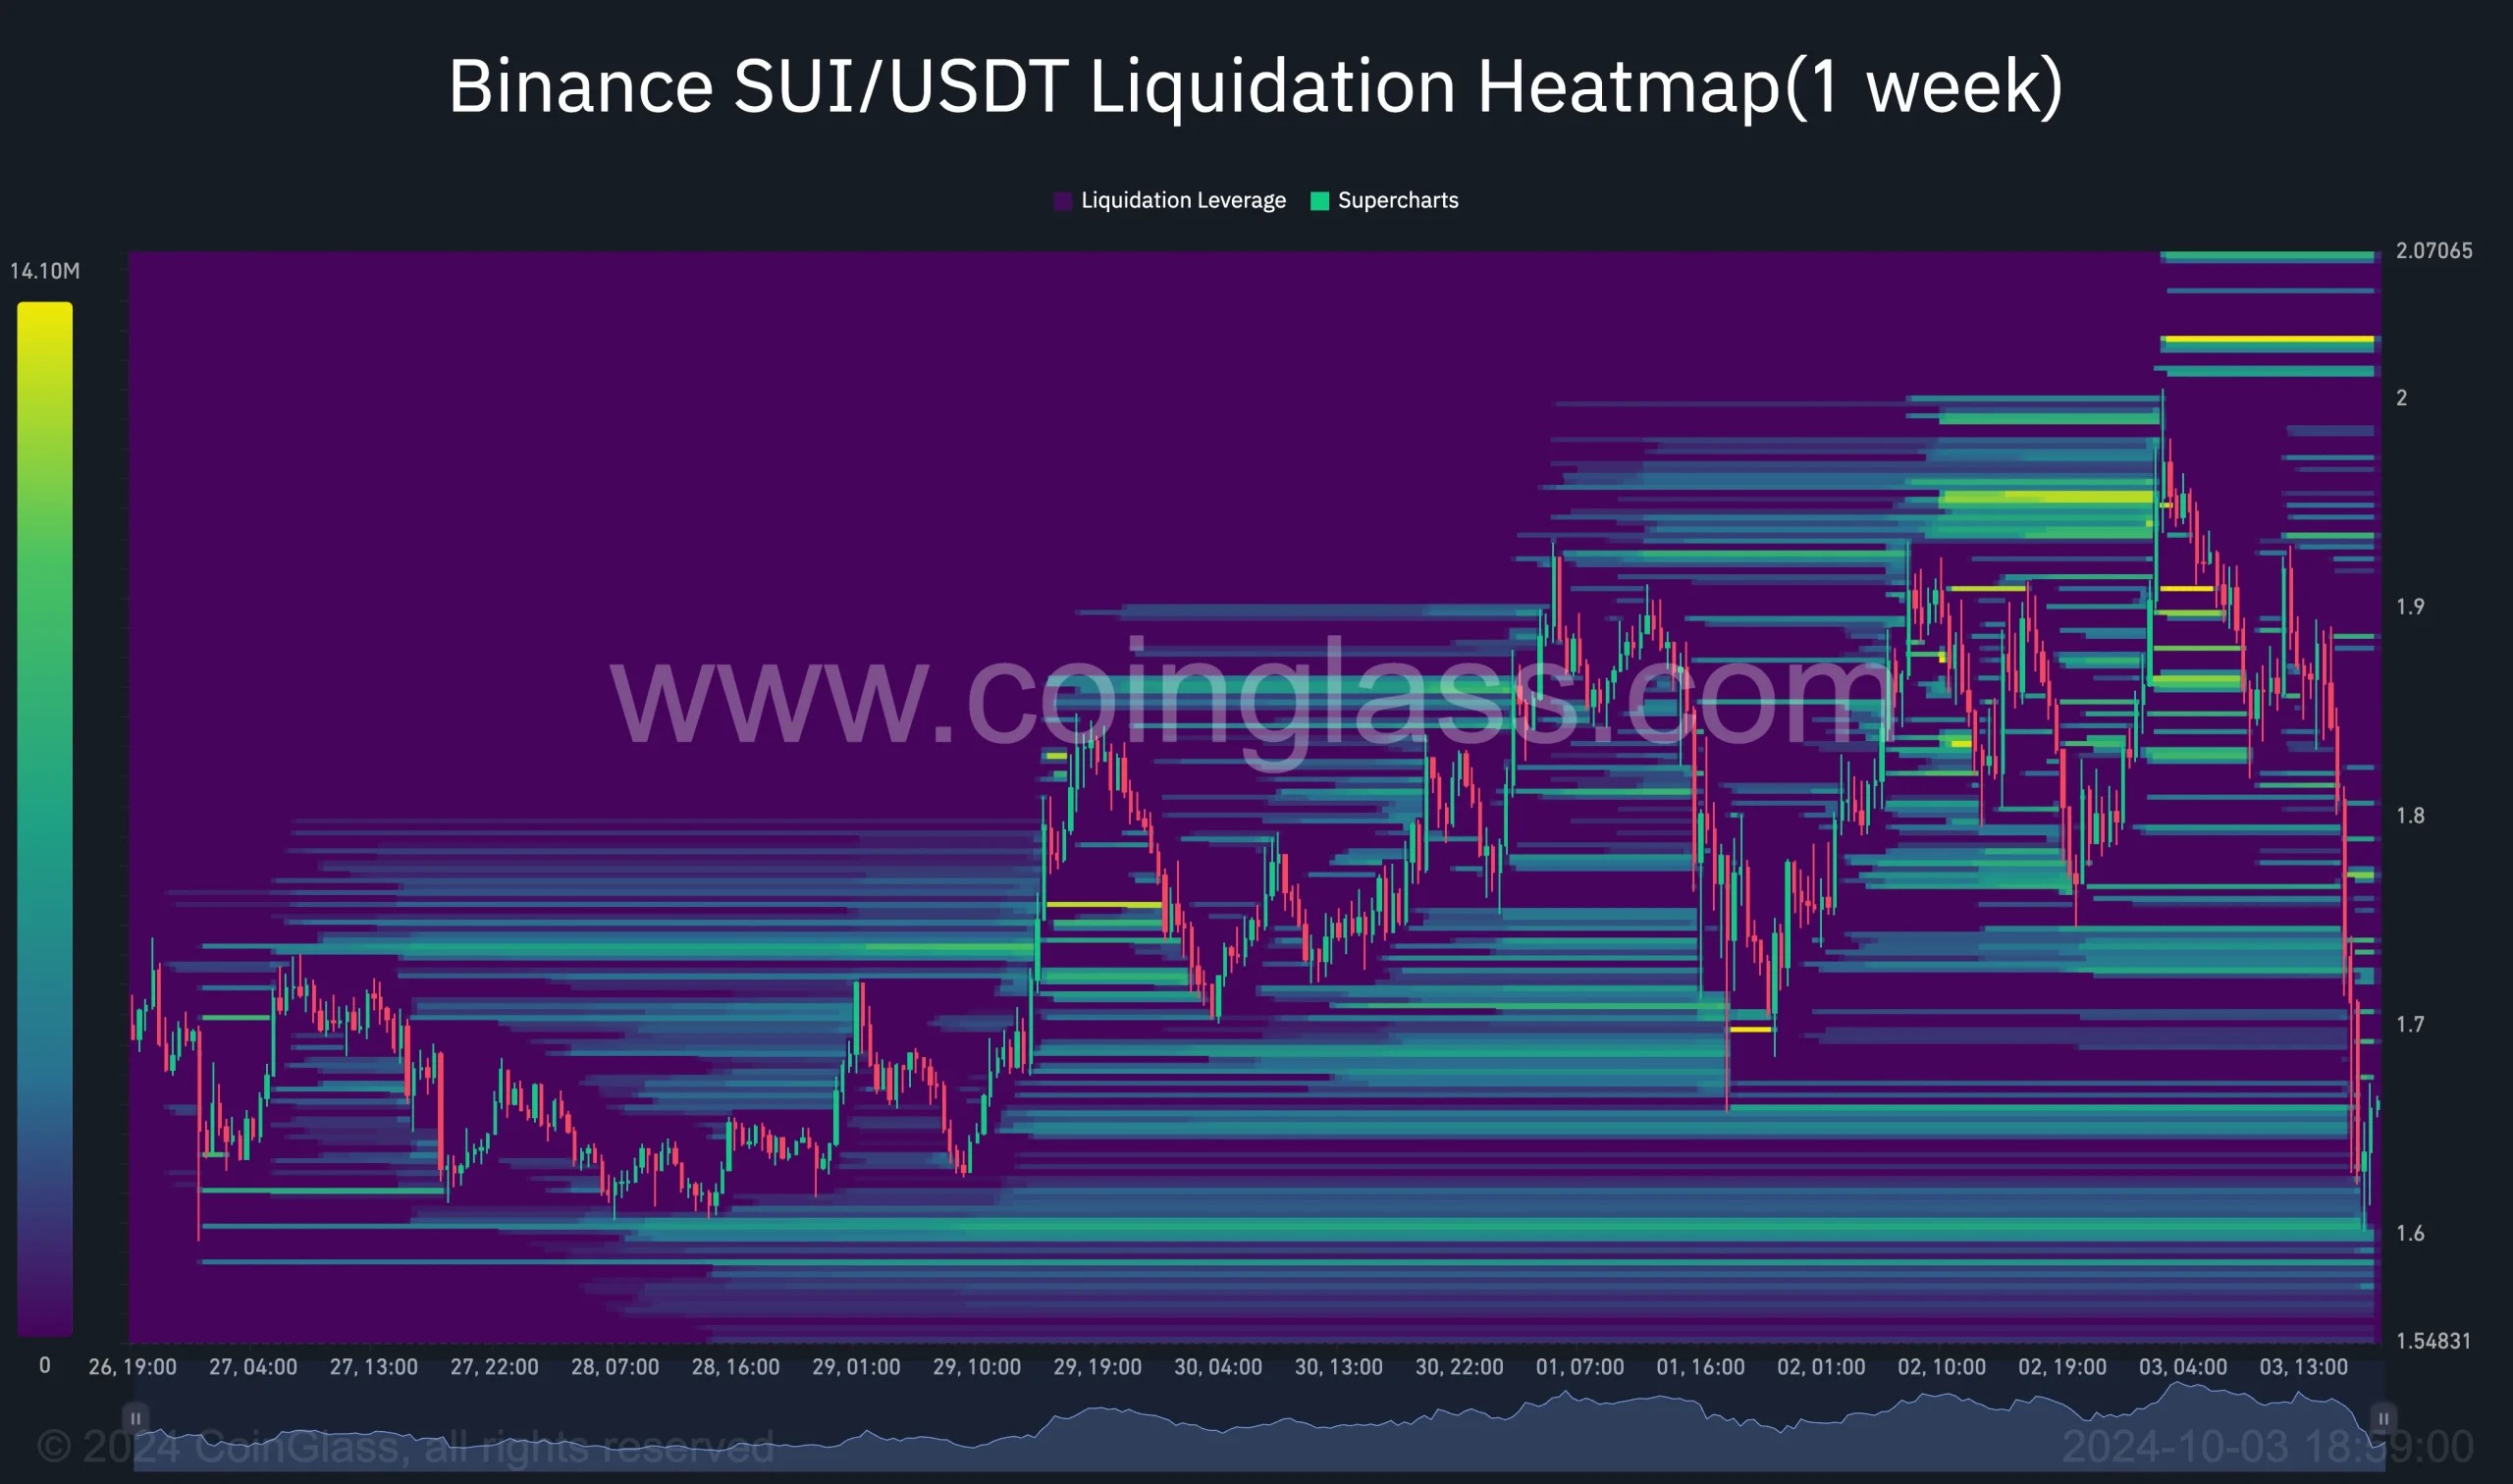
- The liquidation heat map reveals significant liquidation levels above the $2 price point, with the nature of SUI suggesting a tendency to push toward these levels. Exchanges, functioning as market makers, often drive prices towards liquidation zones to trigger these events, given the profitability of liquidations. If a bounce is found at $1.42, it could lead to a quick retest of the $2 mark as exchanges seek out these liquidation levels.
Fibonacci levels
- Should the market fail to hold the $1.42 floor, the next notable level is $1.13, which aligns with the 61.8% Fibonacci retracement, measured from the low in August to the recent high at $2 on October 3rd. This area would also be supported by the 17.5% Fibonacci level, offering another potential zone of demand.
Cryptonary's take
SUI has shown impressive market strength, leading the way in gains over the past month. The key level to watch is $1.42, which has served as a strong support and resistance zone in the past. If the price bounces here, we could see a quick recovery towards $2, fueled by liquidation dynamics.However, a breakdown below $1.42 could see the asset retest at the $1.13 level, which coincides with significant Fibonacci retracement levels. While there isn't a clear playbook here, tracking where demand comes in will be crucial for any future moves and after a strong move like this, with all eyes on an asset, profit taking will be natural. Holding fire and seeing where the next floor is a good play.
Recommended from Cryptonary


