Save 23% ($351) & Get a Free 1-1 Call with our Team ⏰ : 0d 2h 59m 44s
Surprise: The Fed holds the key to Bitcoin’s next movement
Bitcoin's quick 70% surge over the past six weeks has propelled various indicators into overbought territory, signalling an imminent reset. Leverage dynamics reached fever pitch, with longs dominating the playing field – a precarious setup ripe for flushing out.

Unsurprisingly, the market is now in a pullback, one that could reset the mechanics and pave the way for the next bullish surge.
What’s in store for crypto investors?
Let’s dive in.
TLDR
- Fed interest rate decision and dot plot projections on Wednesday are expected to impact crypto markets.
- Fed balance sheet tapering hints could provide an upside catalyst for risk assets.
- On-chain data indicates Bitcoin's rally to $73k has pushed metrics into overbought territory.
- Overleveraged long positions have created ripe conditions for flushing out of excesses.
- After leverage reset, markets positioned for the next bullish surge once fundamentals reassert
Disclaimer: This is not financial or investment advice. You are responsible for any capital-related decisions you make, and only you are accountable for the results. "One Glance" by Cryptonary sometimes uses the RR trading tool to help you quickly understand our analysis. These are not signals, and they are not financial advice.
Powell and the Fed
Tomorrow (Wednesday), we have the Fed Interest Rate decision along with a new Dot Plot (showing how many Interest Rate cuts the Fed expects this year) and the Powell Press Conference.The expectation is that there will be no rate hike or a rate cut.
The markets will therefore be focused on the Dot Plot: will the Fed show three rate cuts this year, or will they reduce that to two rate cuts? I (Tom) have been saying since January that we'll be higher for longer and probably get just 1-2 Interest rate cuts this year, which I still think will be the case. We're now seeing the Bond market begin to reprice, having been at 5-6 rate cuts this year just three months ago.
What could move the market?
Tomorrow, the markets will react to the new Dot Plot and discuss the Fed's Balance Sheet and a possible tapering or no tapering of QT—balance sheet run-off.The previous Dot Plot showed three interest rate cuts for 2024. If that stays the same, risk assets can move slightly higher. If it shows a reduction down to 2 interest rate cuts, then Bond Yields up, DXY (Dollar Index) up, risk assets slightly lower.
But remember, economic growth is still good, and corporate earnings have been positive, which is good for equities and wider risk assets in general. So, two or three rate cuts in the Dot Plot are not the be-all or end-all.
Following the Interest Rate decision and Dot Plot release, the Powell Press Conference will occur.
The market will be looking for mentions of Balance Sheet reduction. If the Fed hints that they're considering a plan for tapering the reduction, i.e., letting fewer Bonds/MBSs mature each month, this will be net positive for markets and risk assets. This is a small point for now, but something we need to be aware of going forward.
Ahead of the Fed events tomorrow, we're seeing Put buying increase, i.e., TradFi investors looking for downside protection. This is them hedging in case the event is more bearish than expected. This is perhaps another reason we see a risk-off in crypto.
Onchain analysis
Onchain data has indicated a local top for some time now.We will keep this part relatively 'short and sweet', but we have seen a 70% increase in Bitcoin's price over the last six weeks. This has pushed several on-chain metrics well into overheated territory, and therefore, a pullback can be expected, enabling these metrics to pull back and reset.
Percent addresses in profit
This is in the overheated zone but at the start of the bull/euphoria stage. It does need a slight pullback/resetting from here, though. This price back should do it.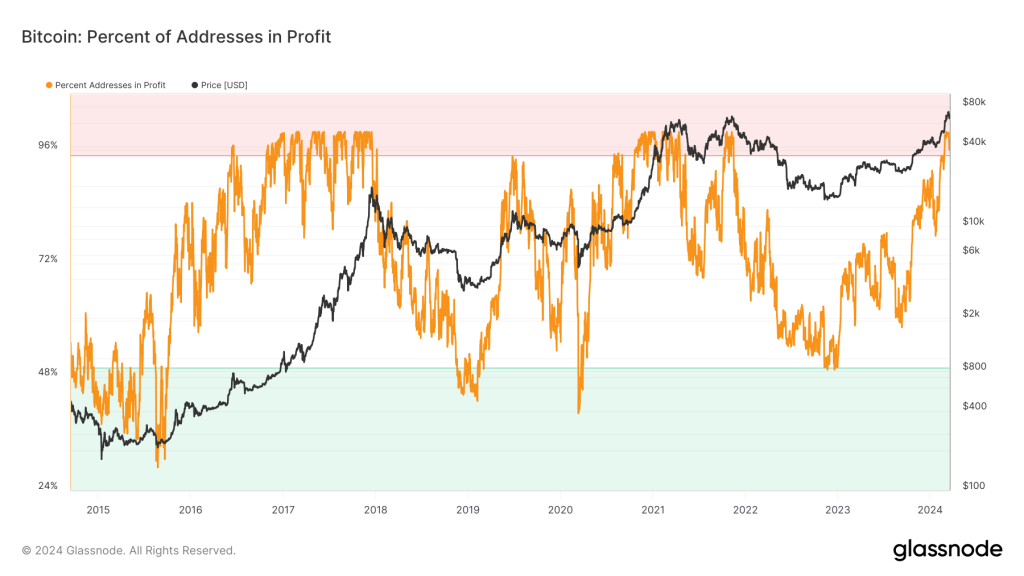
1K wallet holders
This wallet address cohort has historically been very good at knowing when to risk on and risk off. Recently, they risked off at the local top.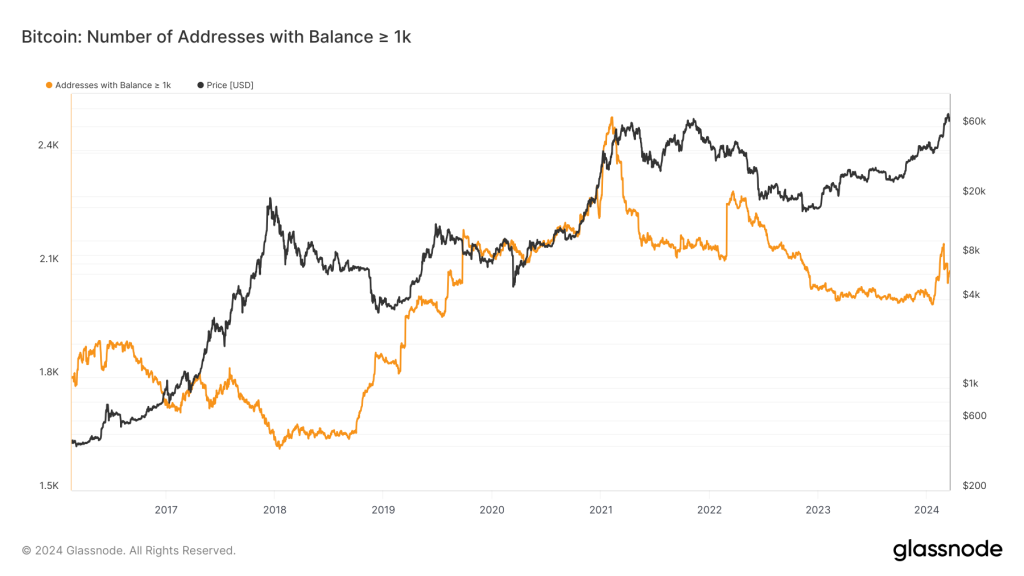
Net realised profit/loss
There was a large amount of profit-taking from older coin holders. This was a risk-off signal.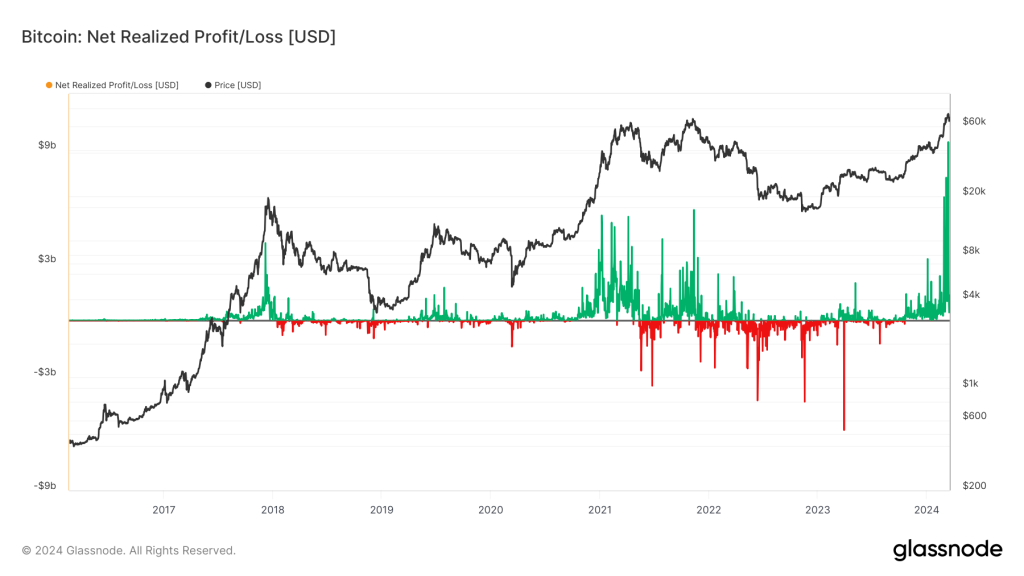
MVRV Z-Score
If we then look at the other metrics, we can see that the MVRV Z-Score and the Realised Price metric both show that we're early in this bull phase of the new cycle.
Realised price
When the market enters the euphoria phase of the cycle, this metric ramps up from the base it established in the bear market. We now look to be in the beginning of that phase.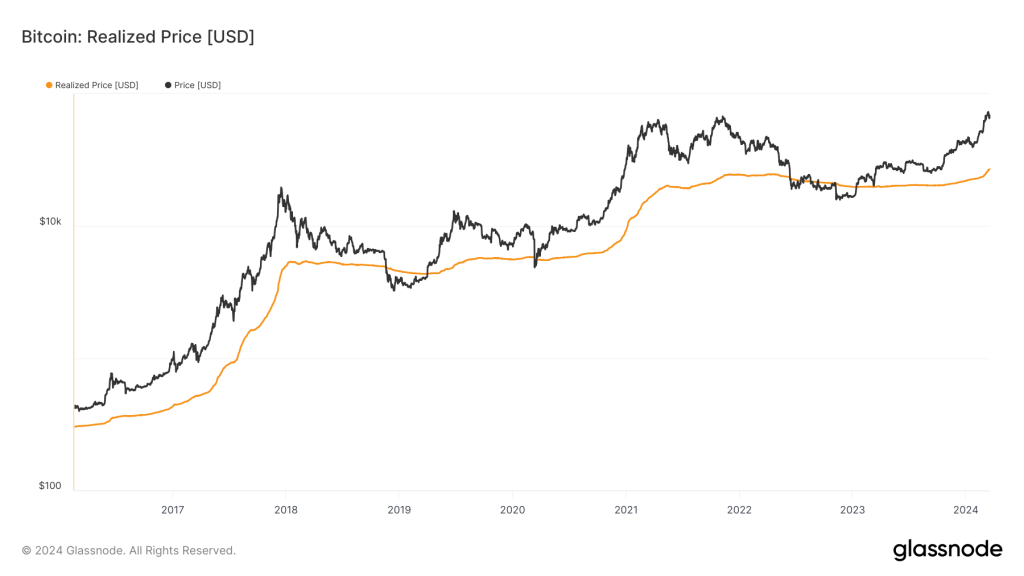
Market mechanics
We look at the mechanics of the market to assess how much excess leverage there is and if Longs or Shorts are over-positioned against each other.We've been in a period of high Open Interest (lots of leverage), and the Funding Rate has also been very positive, indicating that Longs have been the overcrowded position, with Longs paying a significant premium to Shorts to be Long. This usually ends in a flush out of Longs, meaning price goes lower.
Bitcoin open interest
To us, we'd identify a local bottom in prices as a meaningful move down in Open Interest (a flushing out of the excess leverage) and then a resetting in the Funding Rates back to 0.01%. We are currently seeing this, but we still feel there may be a bit further to go to really flush the remaining excesses out.BTC open interest

Market funding rates

Charts + opportunities
BTC
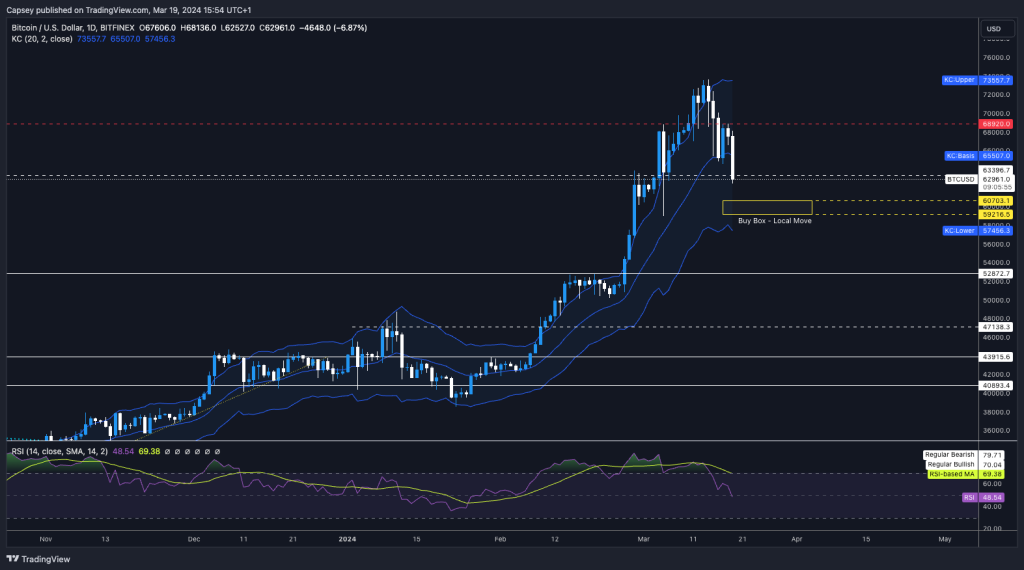
Considering the move up we've had over the last six weeks, I think this pullback is healthy and helps clear out our excess leverage.
It's possible BTC bounces from here, but we see the $59,200 to $60,700 (Yellow box) area as the more likely area for the local bottom. We think this would reset the market mechanics, the trading indicators, and the on-chain metrics more substantially.
Once we see a resetting in the above (market mechanics, the on-chain indicators, and the trading indicators), we'll be more confident in a local market bottom and add to our bags with aggressive buy orders.
ETH
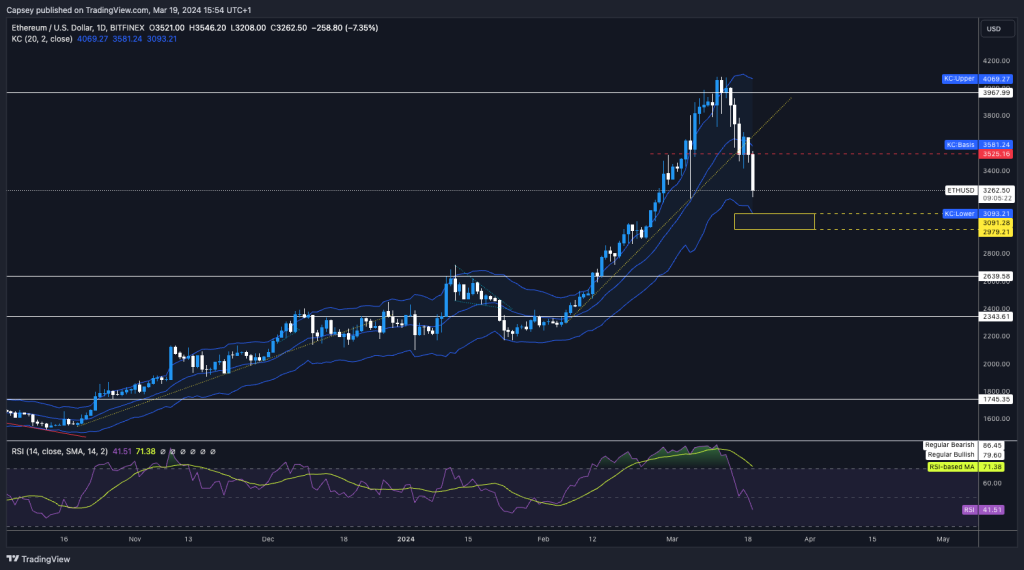
In all honesty, ETH has already seen a 21.5% pullback from the highs to the local lows. The Yellow box is between $2,980 and $3,090. We would be a buyer below $3,200, adding more aggressively to our bags in the Yellow box.
But, bear in mind, we're more bullish on BTC and other majors such as SOL in comparison to ETH, so yes, we'd suggest adding ETH between $2,980 and $3,200 say, but we would be conscious of over-allocating to ETH.
SOL
Le monster!
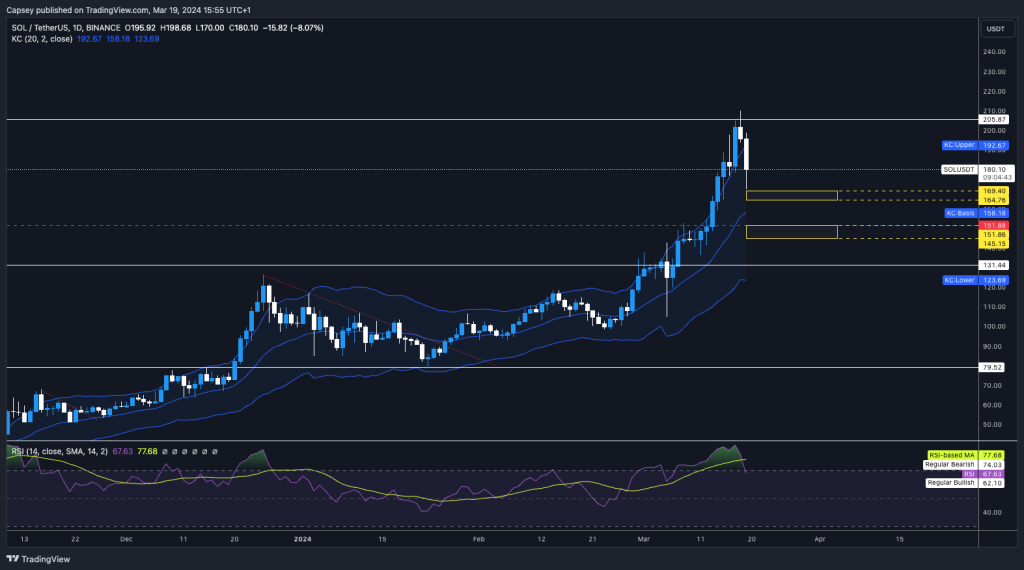
We have held a strong conviction that we see SOL as one of the major winners of this cycle. Its recent performance and how it's held up under a wider market pullback suggest that this is the play showing the most strength and will likely be the biggest winner in the bull.
But, we also note that SOL hasn't had a substantial pullback here so in terms of adding, we probably wouldn't look to add north of $180, we'd prefer to add sub $160.
So, the alternative here is to go after SOL beta opportunities, therefore, plays in the SOL eco-system: RNDR, JUP, PYTH, POPCAT.
Watch the screen recording video below for this market update for chart analysis on the SOL ecosystem plays.
Cryptonary's take
To summarise, we are seeing a de-risking ahead of the Fed and Powell tomorrow, along with the on-chain metrics being overheated for some time.
So, a pullback here looks natural and something we probably should have been calling for more clearly.
Yes, we have not added to Spot bags recently, but if prices pull back slightly further (see the above breakdowns for BTC, ETH, and SOL), then these would be the prices to add to our Spot bags.
We also saw the ETFs yesterday not have net positive inflows, although if there are these price pullbacks, we'd expect them to continue again.
The BTC target is $59,200 to $60,700, assuming the ETFs don't just ape in at current prices ($63,300).
In the video above, we cover the above in greater detail, along with more charts of more plays along with some analysis of the memes.
The market has gone up substantially in the last 1-2 months; a pullback here is healthy for the market, and yes, memes are going to be really shaken lower, as we've seen, but mostly, the major memes have held up well. POPCAT and MYRO seem to be following the WIF playbook - hundred % gains for 60-80% pullbacks.
This is expected. 100x's aren't for the faint-hearted. Maintain your nerves and have your levels for adding to positions (BTC, ETH, and SOL outlined above).
We're certainly not selling spot positions; we're just looking to add when the time is right.
Maybe very soon.
LET'S GO!!!
Recommended from Cryptonary


