Save 23% ($351) & Get a Free 1-1 Call with our Team ⏰ : 0d 2h 59m 43s

We then provide a comprehensive analysis of 6 assets on the Cryptonary Watchlist. The analysis aims to gauge the short-term outlook for each token while also considering long-term accumulation zones for the next bull market.
The question is this:
- Should you trade any of these assets in the short term?
- Would we trade any of them under the current market conditions?
Are you reading to find the path to profits? Let’s dive in!
Disclaimer: Not financial or investment advice. You are responsible for any capital-related decisions you make, and only you are accountable for the results. “One Glance” by Cryptonary sometimes uses the R:R trading tool to help you quickly understand our analysis. They are not signals, and they are not financial advice. Any capital-related decision you make is your responsibility and yours only.
Trading BTC | Bitcoin

Bitcoin is at a relatively crucial level between $26,200 and $25,700. If BTC wants to go higher, it should bounce here.
If this zone is lost, we expect further downside, with the $25,100 horizontal support likely to be tested. Our feeling is that we may see a break below.
Let's look into the individual indicators to gauge whether BTC is set up for a bullish or bearish movement; this movement may present some trading opportunities.
Technical analysis
When assessing purely from a technical analysis perspective, as mentioned already, BTC needs to bounce from this current zone of $26,200 to $25,700. The range has provided prior support for the price.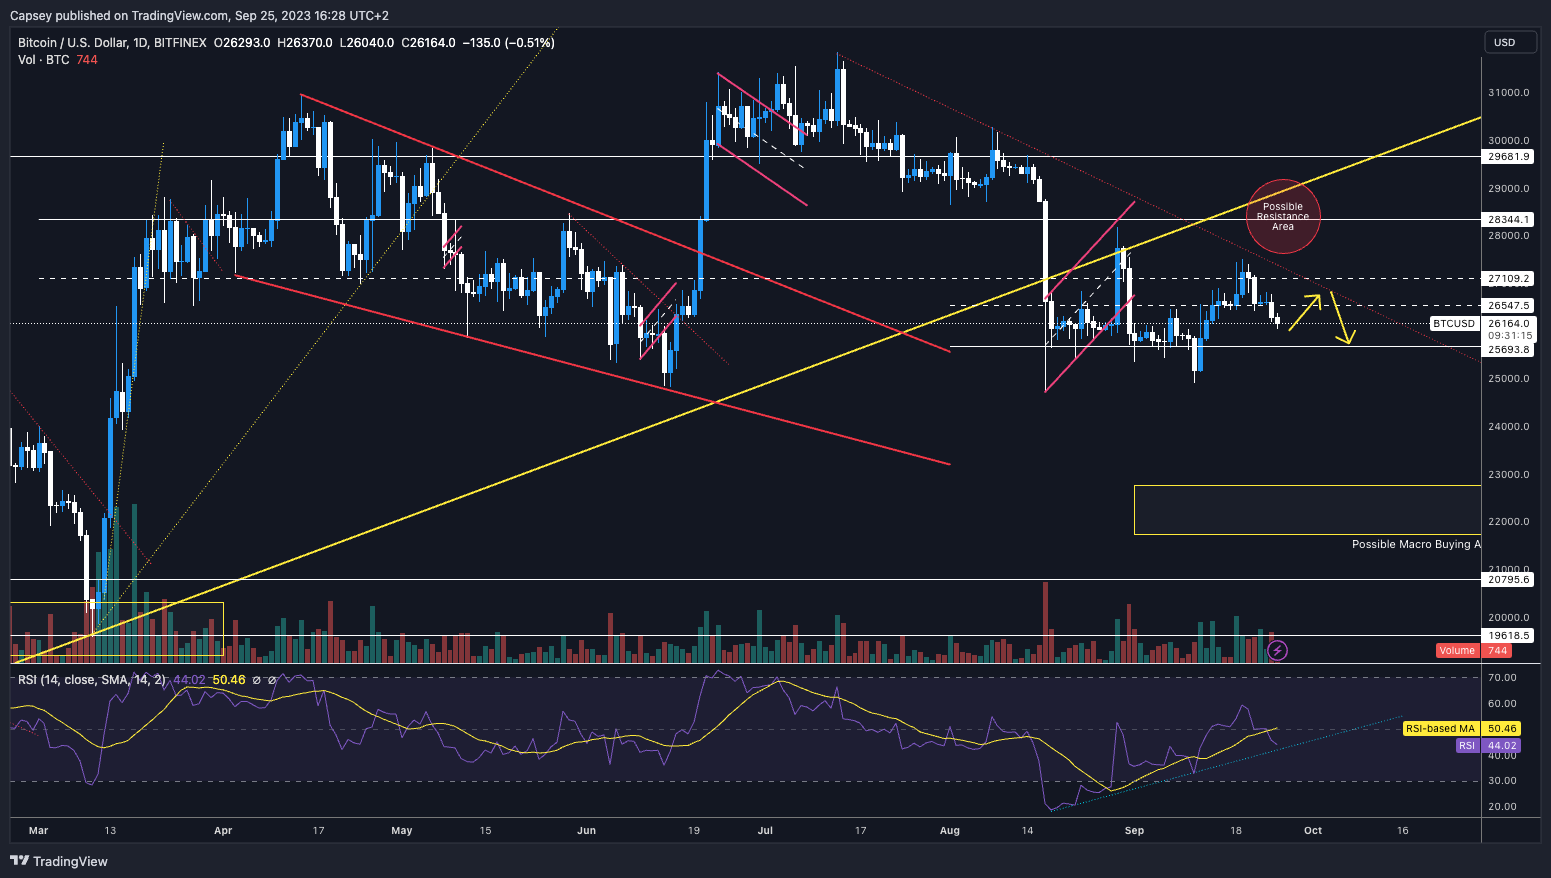
To get a more significant upside, i.e. at least a retest of the $28,300 horizontal resistance, we would need to see the price break above and comfortably close above the $27,100 local horizontal resistance.
Further, BTC is out of (beneath) the main uptrend line (the thick yellow line). This is usually not positive price-wise in terms of seeing further upside. We also have the red local downtrend line, which will act as a resistance/suppress price.
If BTC can get above $26,500 and above the local red downtrend line, this may help fuel it for further upside.
Watch Cryptonary’s head of analysis talk through why BTC is at a crucial level in this video.
Unfortunately, we're not seeing all the factors align and point to BTC going in one specific direction. Let's look into other indicators to see where BTC is more weighted directionally.
RSI
Looking at the RSI, we can see the uptrend is still intact, and we're coming off the back of a bullish divergence that was printed at $25,000 on September 11. A bullish divergence is a lower low in price and a higher low on the oscillator/RSI. This had fuelled BTC to get back up to retest $27,100.However, we've now seen a rejection at that level. But, we are touching that RSI uptrend, so it could provide a level to bounce from. Long story short, the RSI also offers mixed signals regarding BTC being bullish or bearish.
Funding rates
Looking at funding rates (key to see how market participants are positioned), we can see that the funding rate is relatively positive between 0.006% and 0.008% (depending on the exchange).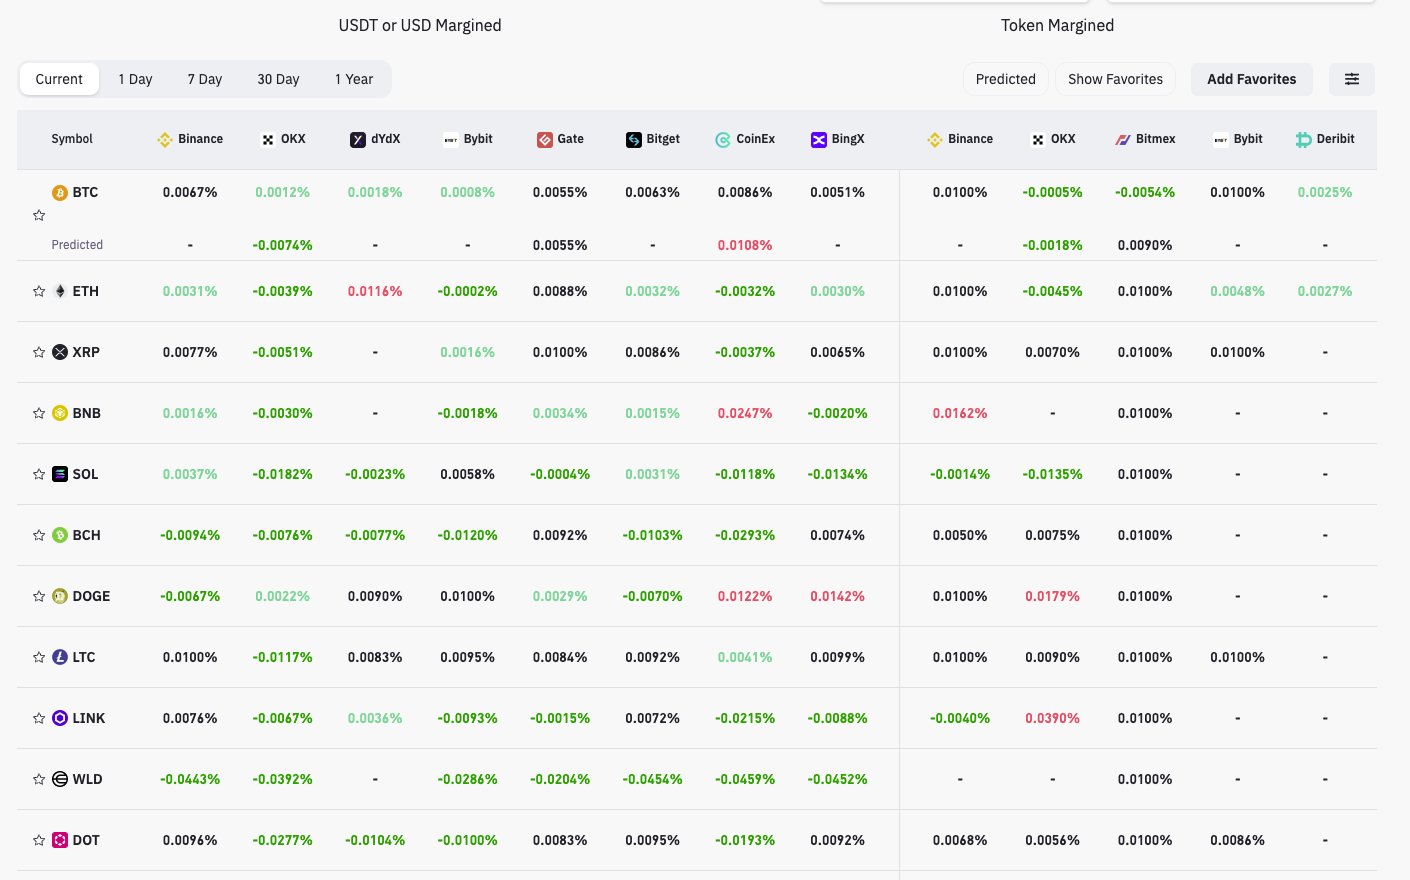
A positive funding rate means that Longs are paying Shorts for the premium to be Long. This funding rate suggests there are more Longs than Shorts, but not a dramatic difference.
What's also key is that this funding rate has been quite volatile over the past week, meaning there is significant indecision amongst market participants who keep flip-flopping. That means going from Long to Short or Short to Long - because they keep changing their minds. Indecision! There’s a slight chance that they are more bullish than bearish, though.
Liquidation levels
Lastly, we'll look at liquidation levels. In the move down from $26,600, many Longs were liquidated (the bright yellow on the chart being taken out) at about $26,300.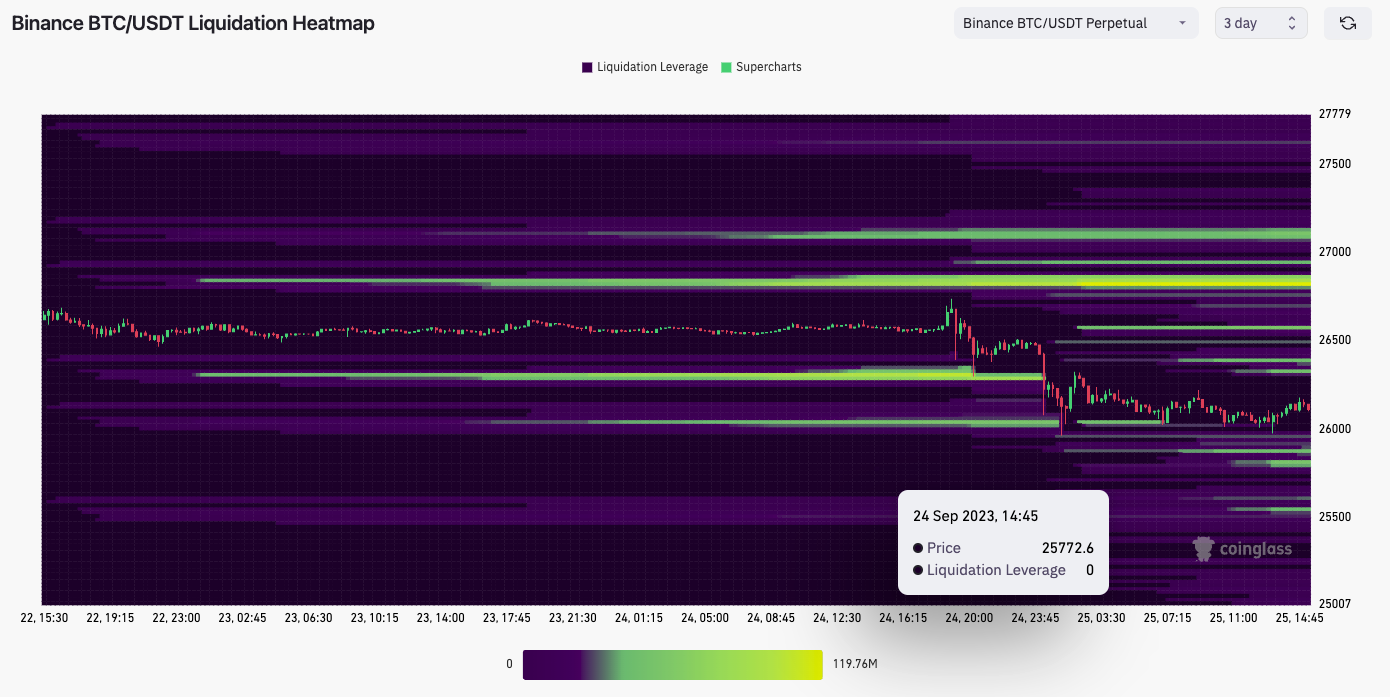
We can now see there are not a lot of Long liquidation levels or at least with any large USD size (no more bright yellow for price to dip into).
This may mean that exchanges will want the price to go higher to hunt the liquidations of the Shorts, which we can see are at the $26,800 level. Again, probably slightly more bullish than bearish.
Conclusion on trading BTC
The indicators are very mixed, with market participants constantly changing their positions. These indicators keep flip-flopping because market participants keep flip-flopping. Hence, none of the indicators really suggests a full bull or full bear movement.Overall, sentiment is bearish; these indicators don’t clearly indicate where the price might go. So, for us, this doesn't provide any good risk/reward trading opportunities.
If we had to commit, we feel we can get some upside in the next few days, but we think there’s more downside over the next few weeks.
In fact, if the $25,000 level is lost, we think the market will panic. So that’s the more reason to stay on the sidelines.
Trading ETH | Ethereum

Working ETH out here is tricky, so let's break it down and work from there.
Technical analysis
As we speak, the $1,550 and $1,625 levels are the key horizontal levels that are close to ETH’s price. The price could not hold above the $1,625 horizontal level; hence, we've broken down and now seem to be on our way to $1,550.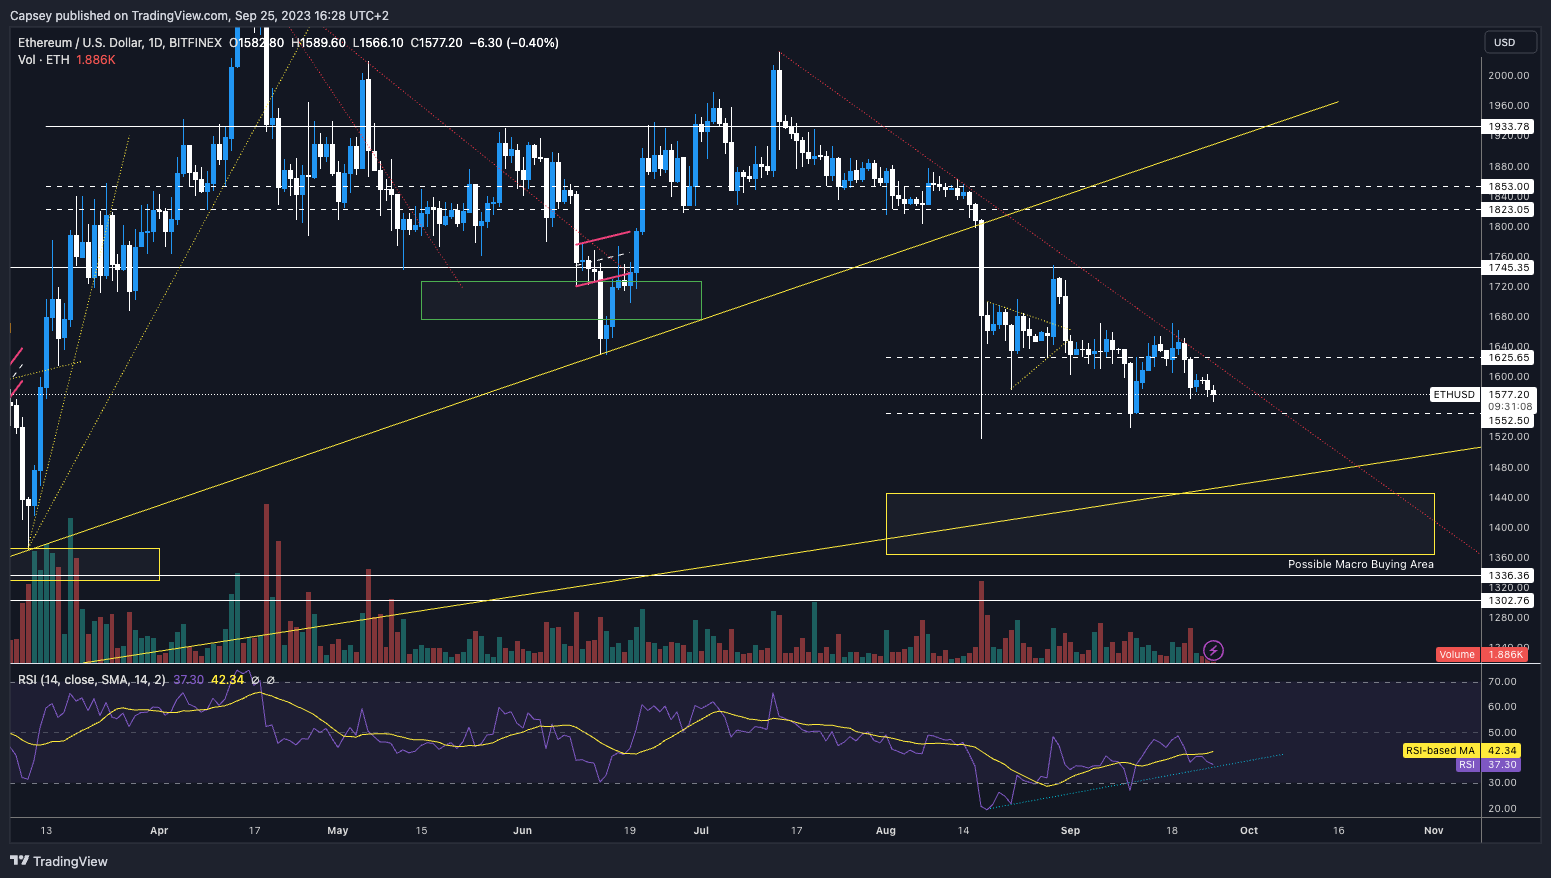
$1,550 is likely to be a key level in that if it's lost, we think the price may be well on its way to the yellow box area we’ve outlined between $1,360 and $1,450.
We also have the local downtrend line just above us. So, if the price breaks above that, we may see more upside.
However, the horizontal level of $1,625 will likely provide some resistance, so it's important to see if the price can get above that level before being confident about seeing a more significant upside.
RSI
On the RSI, we see a rough uptrend that printed a bullish divergence again on September 11. If the price can go just beneath that low of $1,552, and the RSI can remain above 28, this would give us another bullish divergence, which we might buy/Long into. Keep a close watch on this to see if this theory plays out, as this would then be tradable.Funding rates
Regarding funding rates, ETH’s funding rate has flip-flopped more than BTC’s, showing an even greater level of indecision. ETH's funding rate is hugely different depending on the exchange; again, this shows just how varied market participants are in their positioning.... It doesn’t look like something we can really take advantage of.If funding rates are really negative, for example, that means there are lots of Shorts, and if the liquidation levels are large in USD and they're close in terms of price level, then you take advantage of this by going Long and helping the market makers to induce a Short-squeeze. With funding rates for ETH being currently so mixed, there isn't a tradable opportunity to take from this.
Conclusion on trading ETH
While the indicators again don't significantly favour price moving in a specific direction, we think it's best to wait and see how this develops. If the price can move to $1,550 and create a new price low, and we get a bullish divergence form, then this might encourage us to take a Long. Other than that, we will sit tight and wait and see.Trading SOL | Solana

The direction is a bit more clear-cut here.
Technical analysis
After breaking out of the main downtrend line, the price breached some main horizontal resistance levels, where we've seen it reject at the $20.40 level.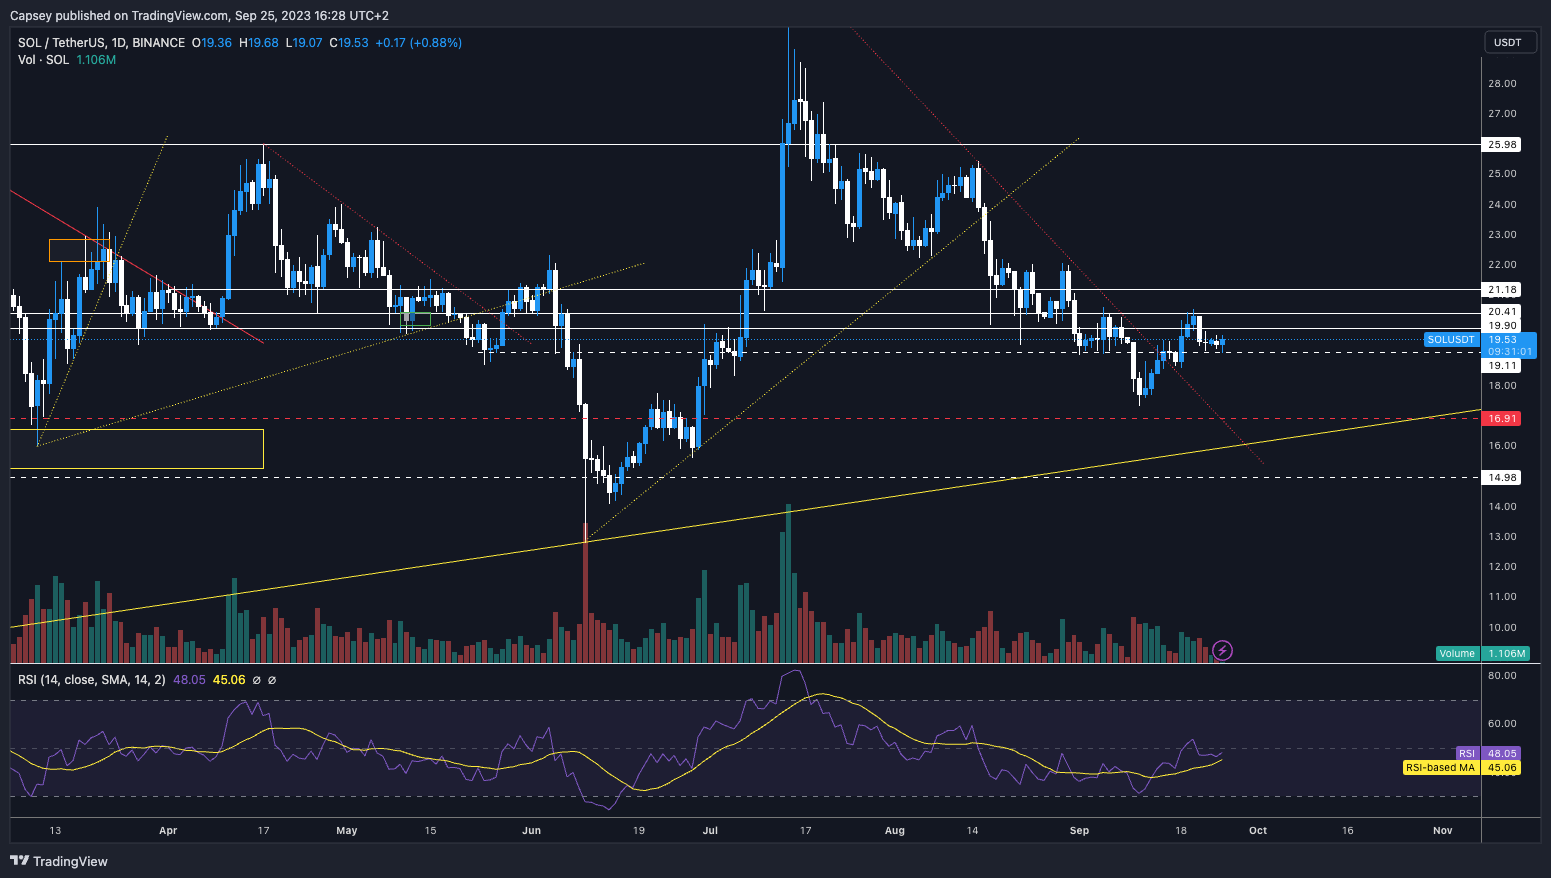
Price has now found support at the $19.11 local horizontal support, and this level needs to hold, or there will likely be a move lower to the $17.60 - $18.00 range.
RSI
On the RSI, we're in the middle territory at 48 without coming off the back of any bullish divergences. But, when the price rose to $20.40 just a few days ago, a hidden bearish divergence was formed (lower high in price, higher high on the oscillator). This could be what helps to send SOL lower.Funding rates
Regarding funding rates, they're very negative, so Shorts are paying Longs the premium to be Short. This opens the door for a short squeeze, so this is the main bullish catalyst for SOL. If SOL can get back above $20.40, then this may be where many of the Shorts’ Stop Losses are, and if hit, this would drive the Short-squeeze.Conclusion on trading SOL
With the data contrasting and not heavily weighted enough to one direction, it’s perhaps wiser to stay sat on the sides here. If SOL can breach $20.40, that would be hugely positive, and we'd consider Longing from there. But, until then, we prefer to wait for SOL to break down and test the $17 area. Depending on when we get there will depend on how we begin to DCA for the long term.
Trading DOT | Polkadot

Even though DOT has performed terribly over the last couple of months, it actually looks slightly more positive here.
Technical analysis
The standout, of course, is the downtrend line. DOT is now breaching above it. It has broken above it a few times already but not closed comfortably above the line on the daily timeframe, so this is the key thing to watch out for.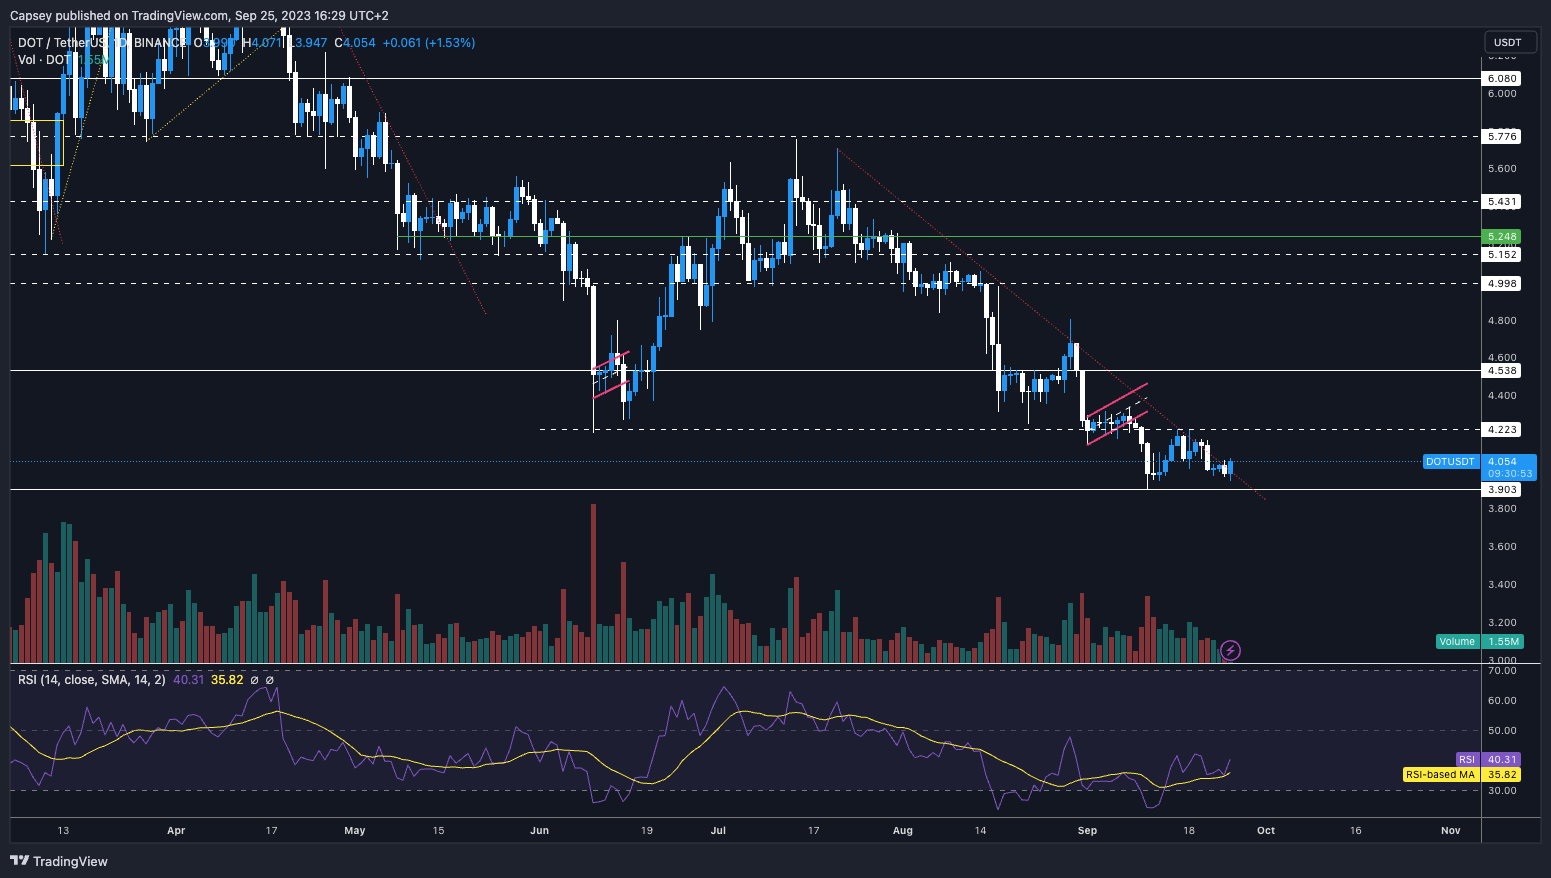
The nearest overhead horizontal resistance is the $4.22 level. We think that’ll be resistance again, but it is currently 5% away, so the price would rise 5% before reaching it.
RSI
The RSI could be better, which stops us from longing DOT here - alongside the fact that Alts generally bleed in a bear market. If the RSI was at a lower level and could print another bullish divergence, this might entice us to take a short-term Long. But unfortunately, we've not got that. We did get a bullish divergence before, which got us the bounce from $3.90.Funding rates
Funding rates are mixed here, with some exchanges having real negative funding rates. This lack of alignment (i.e. Funding rates for DOT on all the exchanges), all being different, is another thing that puts us off taking a position in DOT.Clear indecision is not tradable as it doesn't give us a decisive edge. It just shows the market is all positioned differently, and the price is not more likely to move in one direction than the other.
Conclusion on trading DOT
So, an easy conclusion here. We remain patient on this. We think this could move higher in the very short term; maybe it retests the $4.22 level or $4.53 at best, but in the mid-term (next 1-6 weeks), we see DOT break below its major support at $3.90.Trading RUNE | Thorchain

RUNE is a fantastic example of how horizontal supports/resistances and divergences on the RSIs can set up good trading opportunities. For instance, RUNE moved into the overhead horizontal resistance at $1.97, which was formed from being the last three major tops.
The RSI then created a lower high whilst the price created a higher high (candle bodies). This is a bearish divergence, and the price usually goes lower when major ones are formed. Hence, we have now seen prices come down 15% or so.
Technical analysis & RSI
Looking at the TA now, we can see that the price has come down to the local horizontal support of $1.68, while the RSI has also been reset to more neutral levels.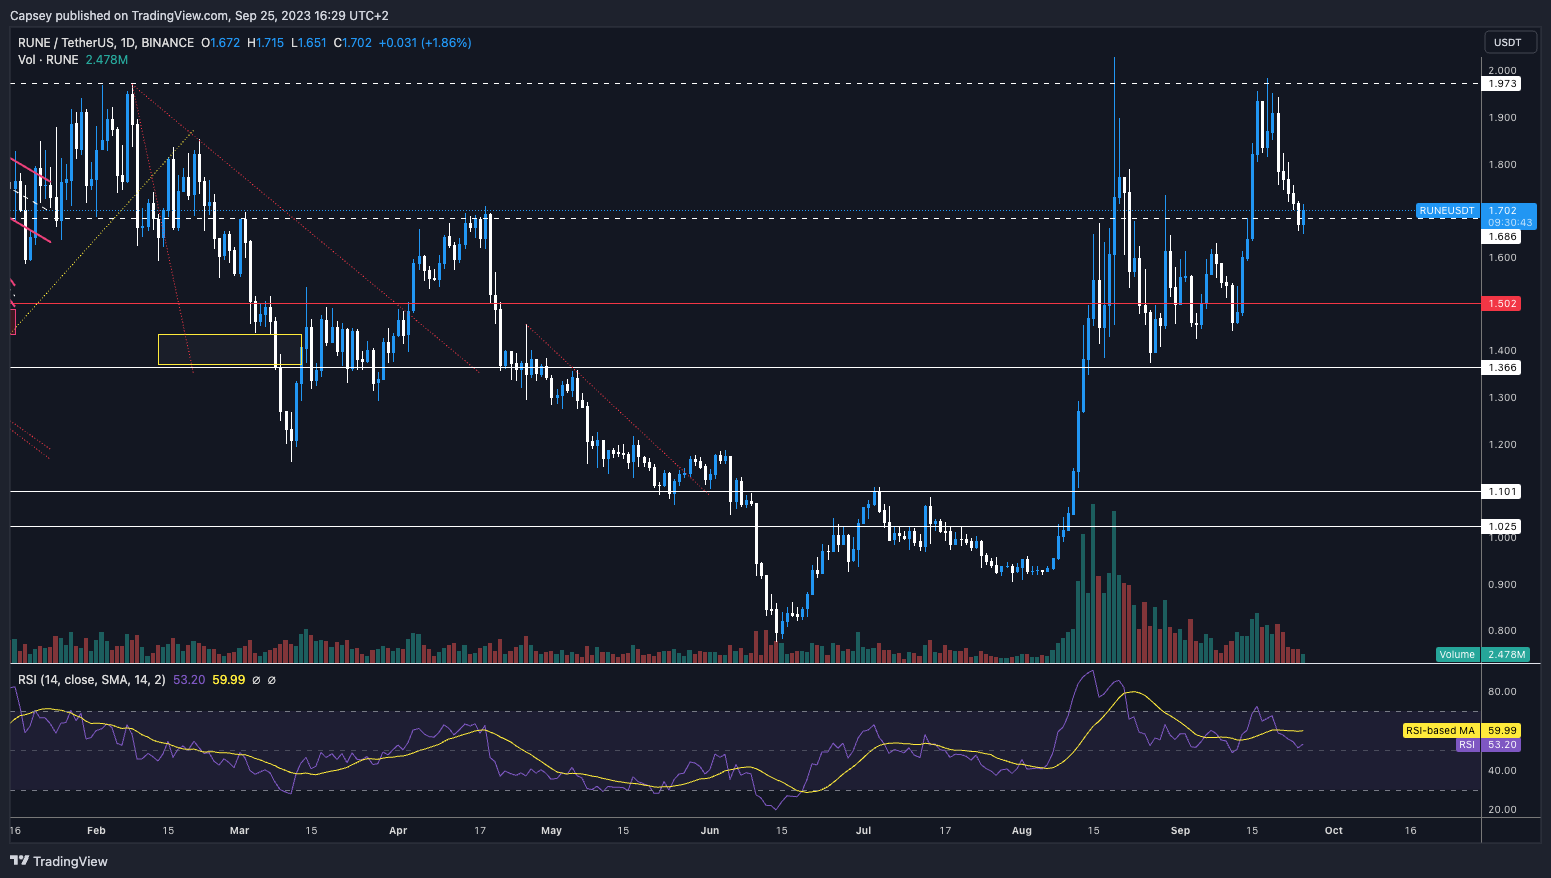
RUNE may get a bounce from here, although we'd be sceptical of how sizeable this bounce can be. We’d expect a move into approximately $1.80 and then for RUNE to come down again from there.
Conclusion on trading RUNE
In terms of price direction, we gave that above. We like RUNE for the long term, and it would be great to buy it much lower in the next 2-6 months in preparation for what we think will be the bull market in the second half of 2024 and 2025. But as we said, we see RUNE back below the major level of $1.36 in the coming months.Trading ARB | Arbitrum
We'll keep ARB relatively simple and straightforward.
Technical analysis
Purely on the TA, we think we see ARB head lower in the mid-term, likely taking out the lows. In the very near term, ARB can break out of its local downtrend line.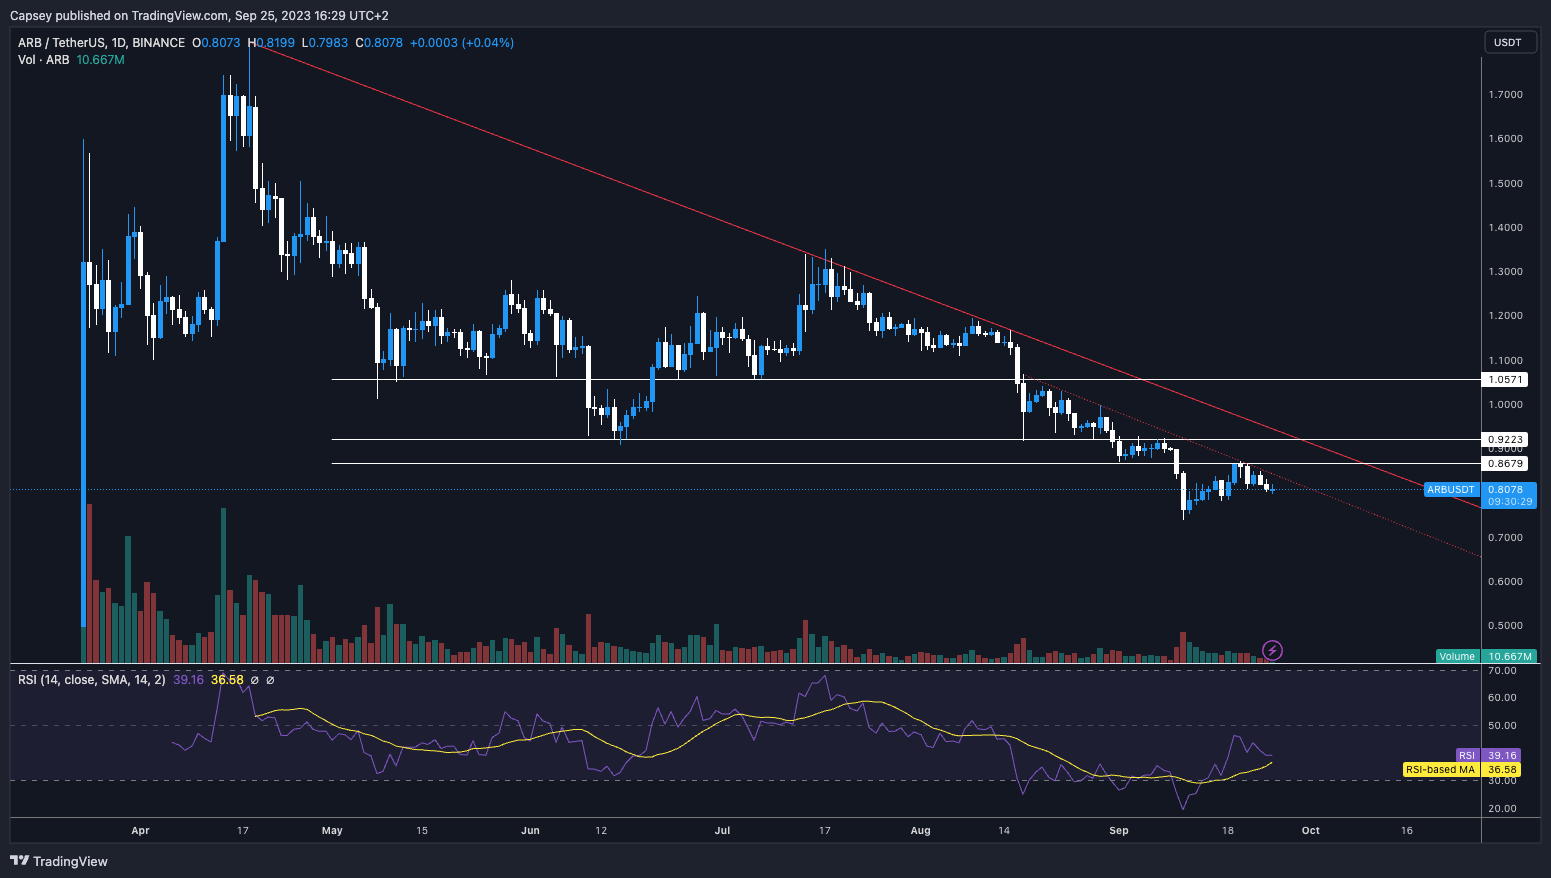
However, we think there will be phenomenal resistance at the main red downtrend line and between the two overhead horizontal resistances, the first at $0.86 and the second at $0.92. we would be very surprised if ARB got back above $0.92 in the near term.
Conclusion on trading ARB
We feel ARB will perform very well in the next bull market, but we still believe that is 6-9 months away. Therefore, in the meantime, we prefer to stay away from it as we think we will be able to accumulate it lower.... around the $0.50 - $0.60 level in the coming months before the bull market slowly begins. In the near term, ARB may break out higher, although the first significant price point we'd be watching would be $0.86. We may go higher than this and get to $0.92, but we think it is unlikely, and we think if we do get there, then this will be the horizontal resistance from where the price is rejected.Trading LDO | Lido
It’s a very interesting setup here with many different and mixed signals.
Technical analysis
Over the last month, we've seen LDO's price chop between $1.43 and $1.68 whilst forming a wedge pattern.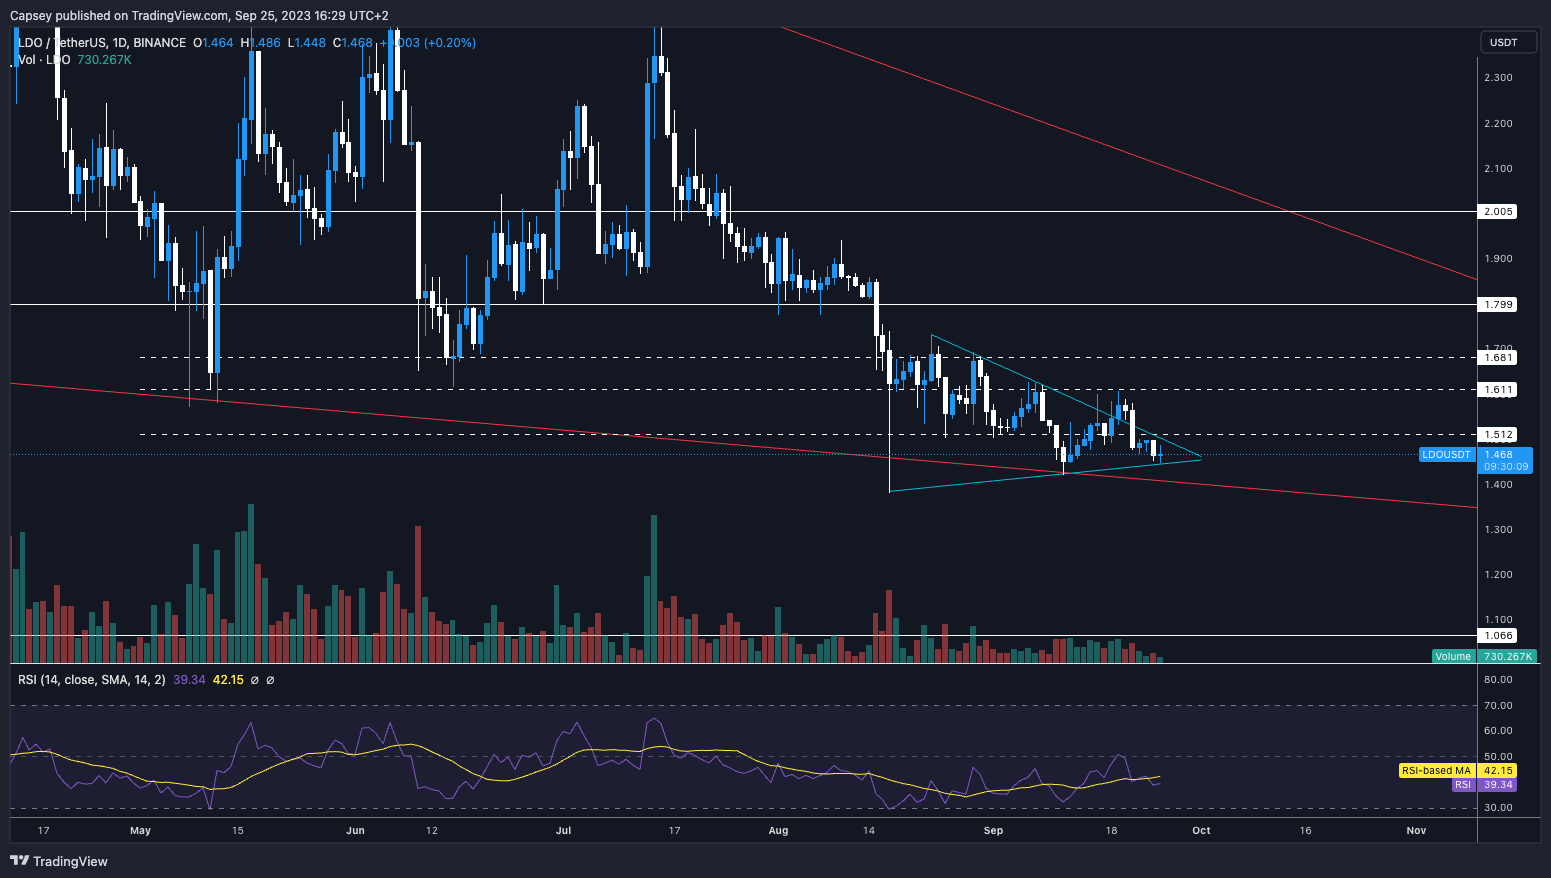
This kind of wedge pattern doesn't have a clear bias regarding the direction in which it breaks (up or down). So, let's assess other bits.
RSI
So, having rejected twice at the $1.61 level, we saw in the second attempt at breaching that level just last week that we put in a lower high price-wise and a higher high on the RSI. This is a hidden bearish divergence and is bearish for price action.Conclusion on trading LDO
Despite much of this being somewhat bearish, we think the general market can go higher soon (mostly led by BTC and the S&P). What worries us with LDO is that $1.61 and $1.68 are quite significant horizontal resistances, and in the near term, the price will struggle to breach those levels. For that reason, we'd steer clear from LDO for now.Lido is a very good project that you’ll want for the bull market (hence, we are covering it), but price action in the coming months will be lower. We are tagging a zoomed-in chart and a zoomed-out chart. Note that the zoomed-out chart shows a huge wedge pennant, which we're near the bottom border of. Let's see what the response is at $1.40.
Recommended from Cryptonary


