Save 23% ($351) & Get a Free 1-1 Call with our Team ⏰ : 0d 2h 59m 44s
Disclaimer: Not financial or investment advice. You are responsible for any capital-related decisions you make, and only you are accountable for the results.
TLDR
- A stronger rally is possible, but we are still in a bear market. Nothing will change that until market structures change.
- Q1 and potentially Q2 of 2023 will continue to see prices perform well.
- The wait is over - Bitcoin and Ether will choose a direction soon.
I'm sure the title made you feel a bit optimistic... many of you are excited for the rally to continue - so are we. However, we need to slap ourselves in the face and remember we’re still in a bear market. We still have bearish market structures all across the market, and we still have the majority of market participants who have left or given up already - it’s typical behaviour for times like such.
To be profitable in this market, you need to be real with yourself. Accept the facts; don’t embrace the “What ifs” - and the facts are: we continue to trade in a bear market, and the market requires more time to change that.
With that said, even if what we see on the charts might end up as a solid rally with good returns, it will come down eventually, and we’ll go back to range for another few months. It would be unwise not to take advantage of the opportunities you’ve been given, so taking profits is, in our opinion, the best play here. Let’s dive into the charts and see how we’re progressing:
Total Market Cap
The Total Market Cap index represents the entire evaluation of the cryptocurrency market. We track this index to understand where the market is now and where it will go. Every pack of wolves has an alpha male - this chart is the alpha male of the charts pack because where this goes, the entire market follows.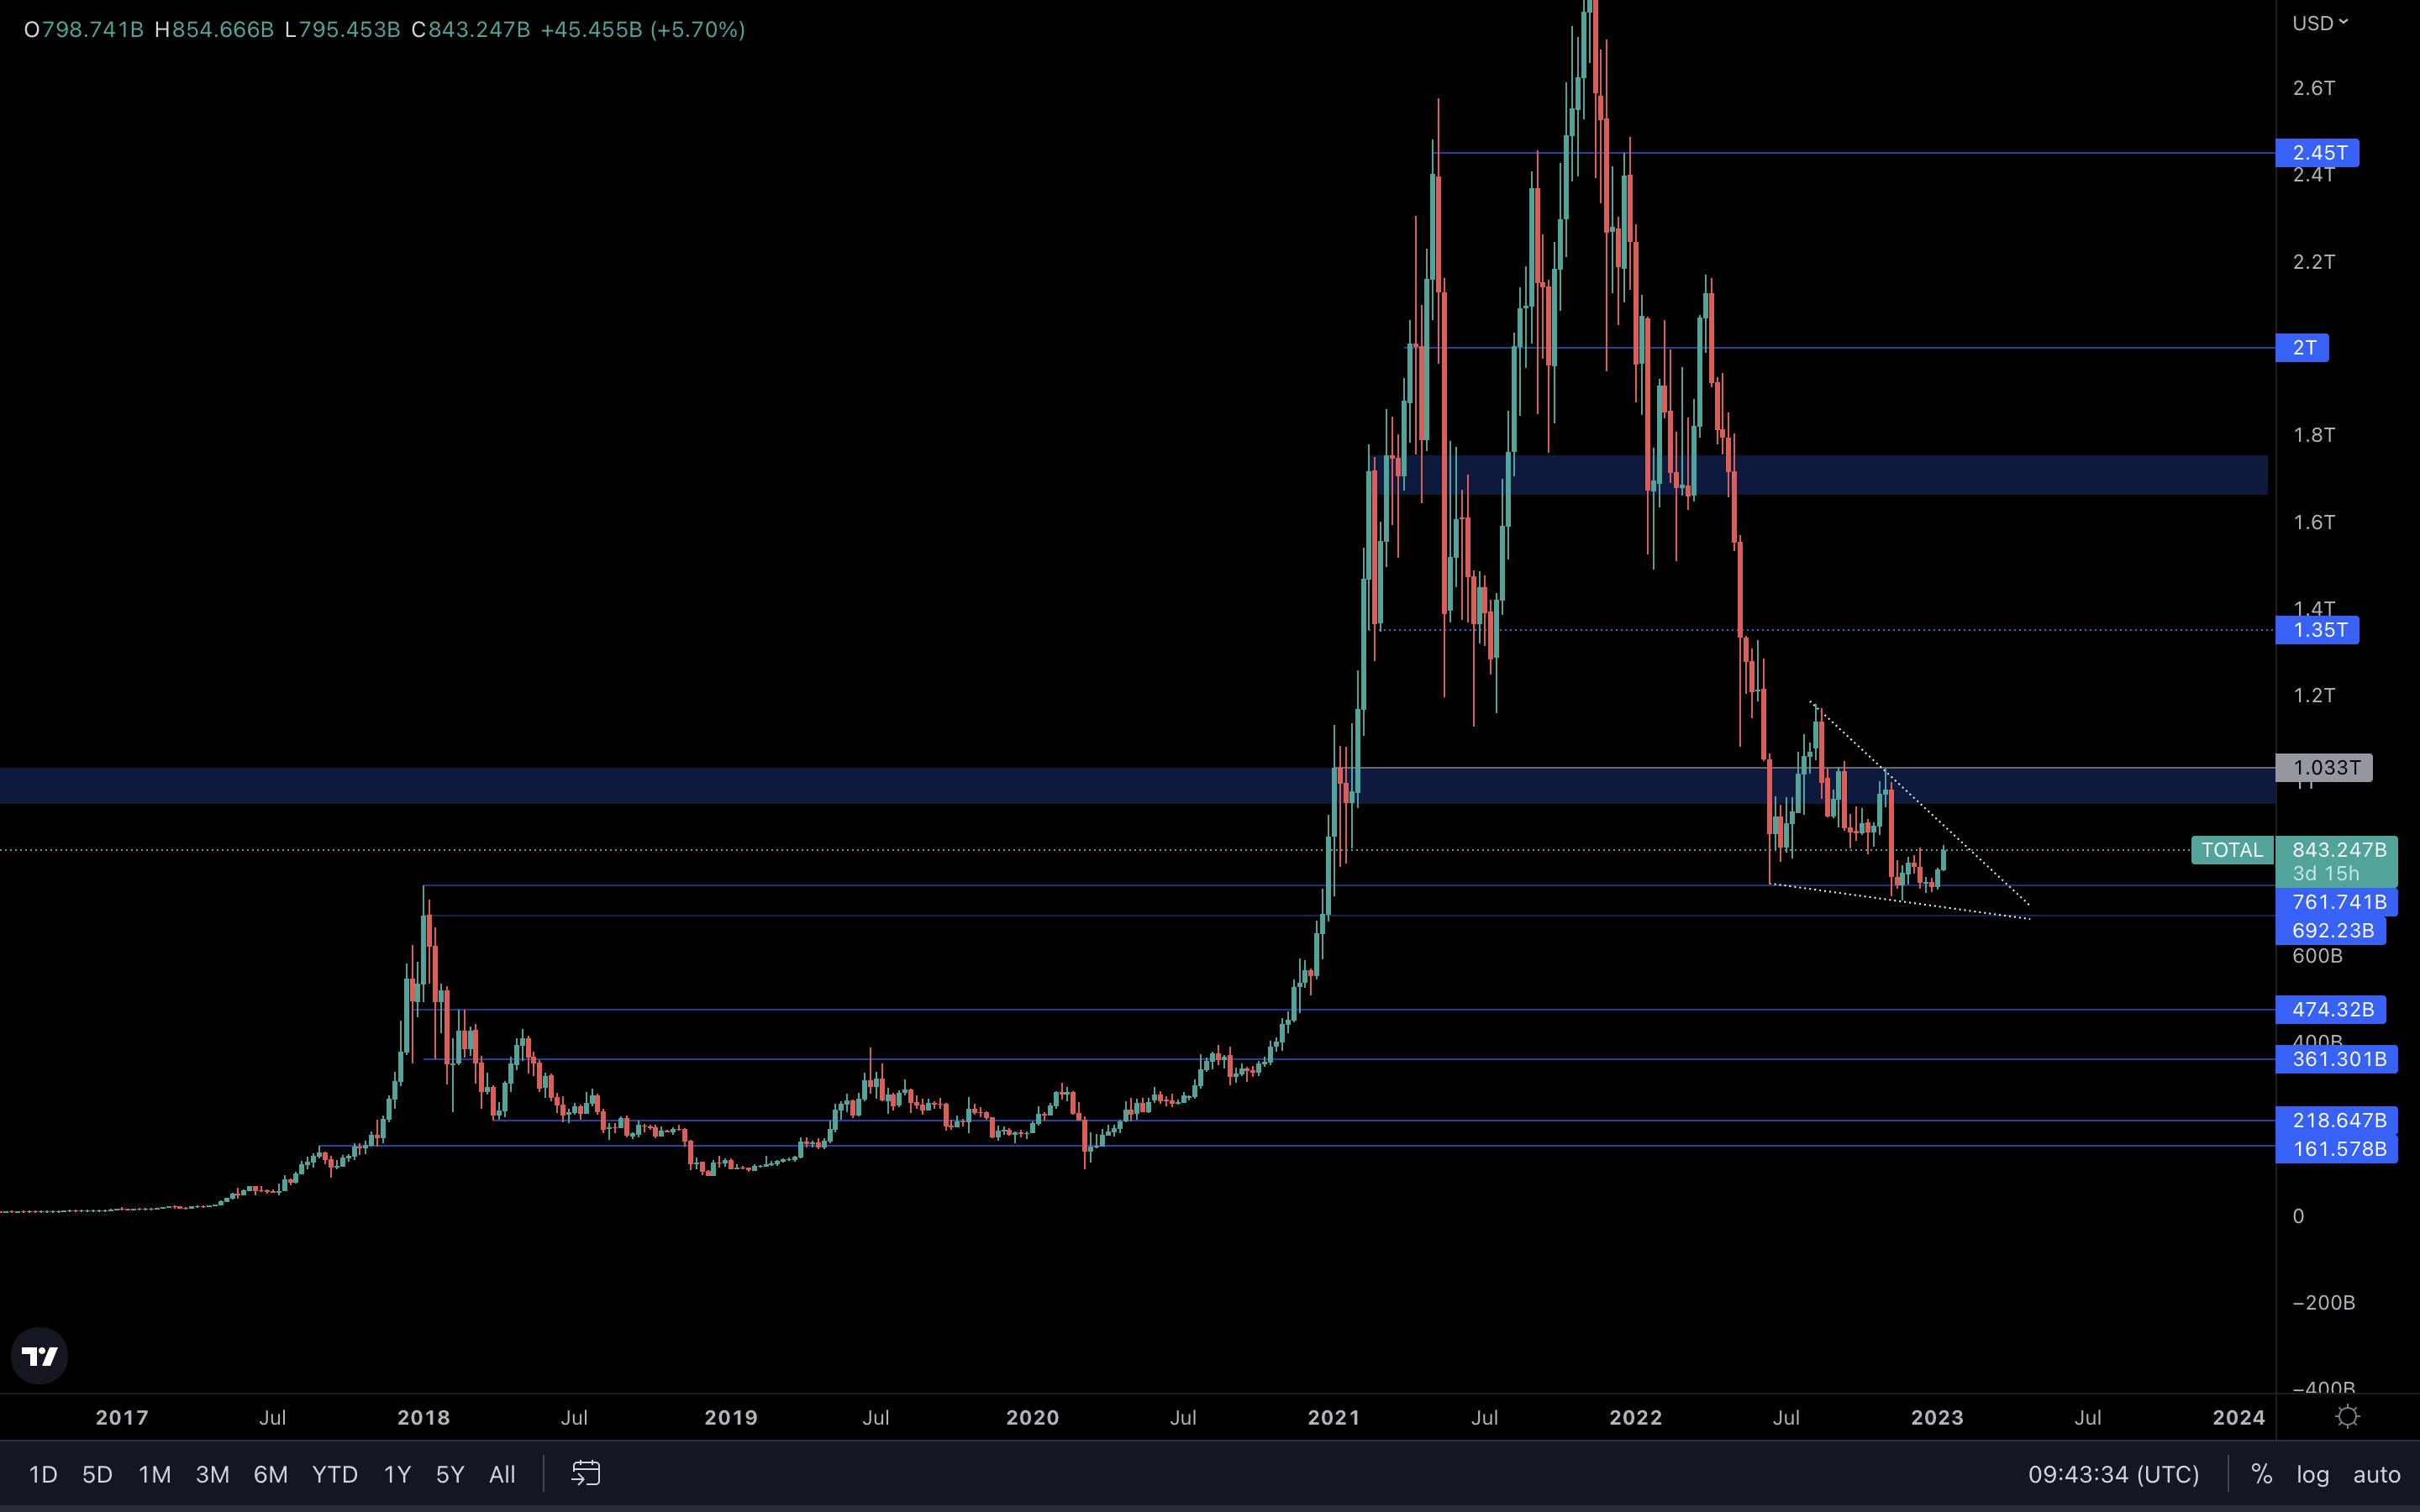
As long as we do not lose the 2018 all-time high (left side of the chart), we have already tested the bottom for this bear market. A previous all-time high as support is probably the safest bet for a bottom, which is why we keep mentioning it every time we get the chance. Sure, it could also not be the bottom, but the odds are definitely in that favour.
On another note, the Total Market Cap index is trading inside of a falling wedge. If you’re unfamiliar with it, know that a falling wedge is a reversal pattern. For example, we can see that before the wedge started forming, the trend was bearish. A break from the wedge will reverse that trend, which means we could be looking at a lot more upside here, specifically to the $1T level. Until a breakout occurs, the above remains just a probability. We must see a clear break above the wedge to validate this setup.
Altcoins Market Cap
The Altcoins Market Cap index represents the entire evaluation of the altcoins market. Imagine all altcoins in the same basket but Bitcoin in a different one - with price labels on the baskets.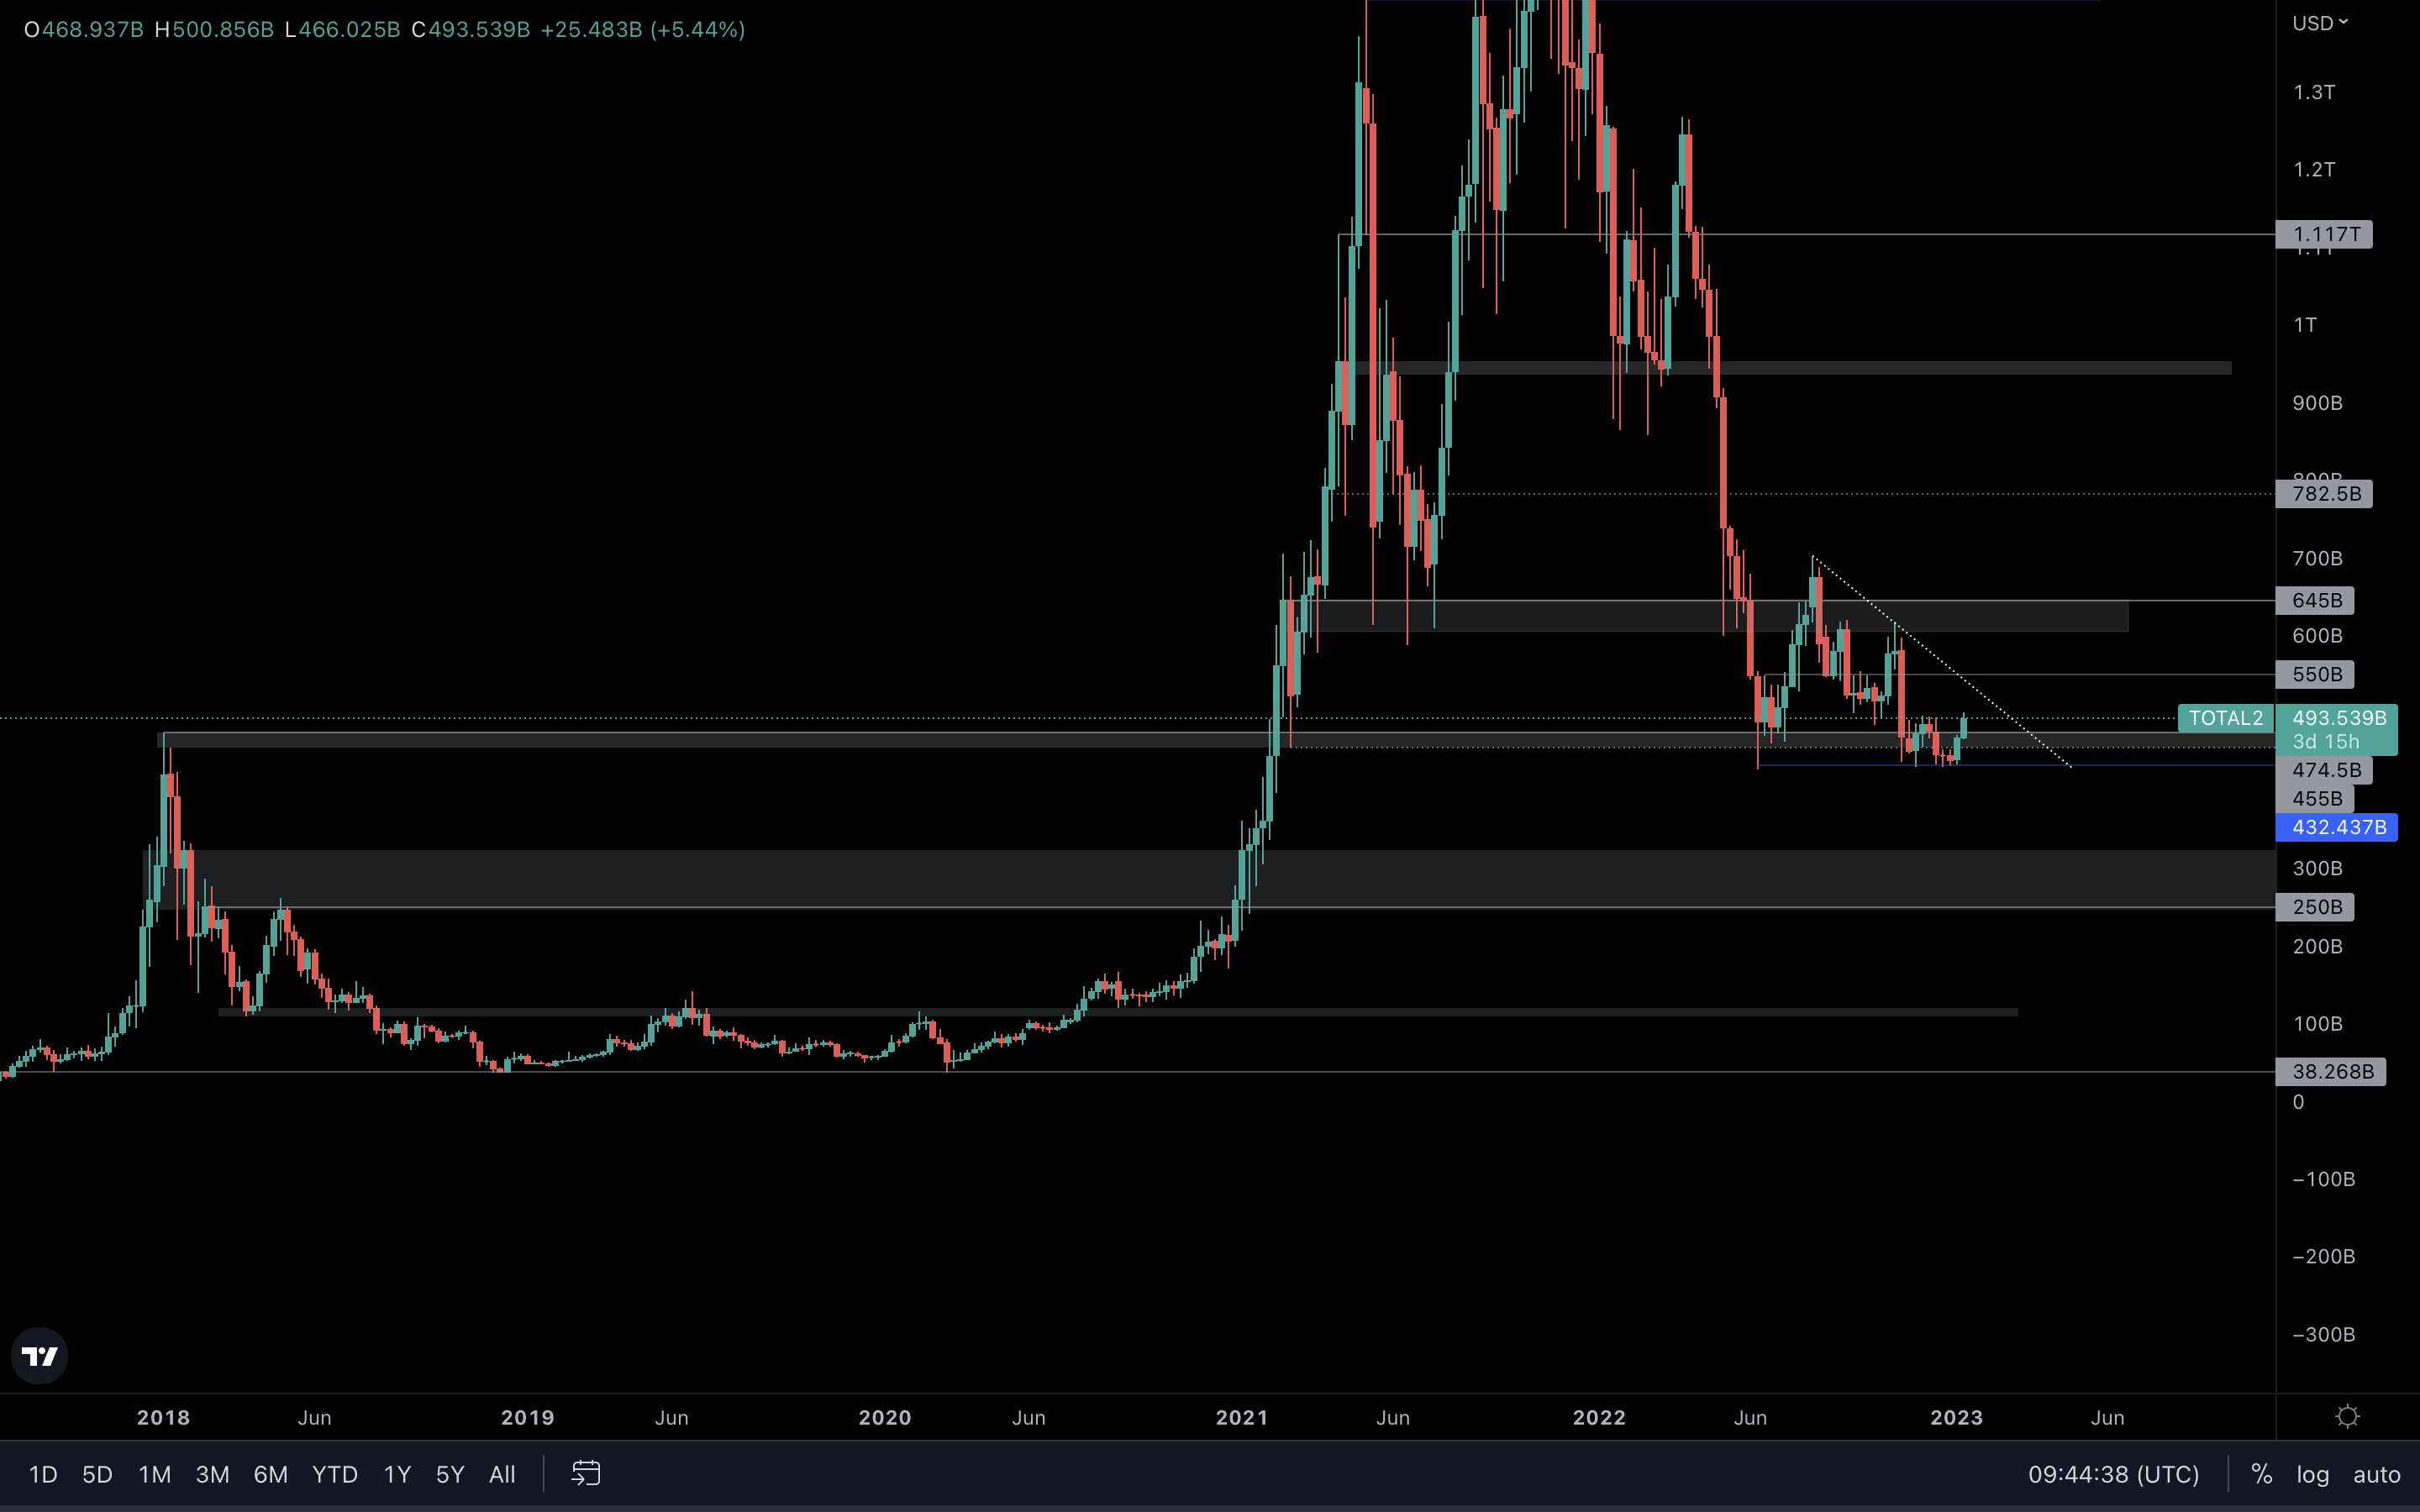 If you’ve read our previous free report, you might remember this statement:
 What we’re seeing on this chart now is that the index is above its previous all-time high. A weekly closure above this level will invalidate further downside, which we’re three days and fourteen hours away from (at the time of writing).
However, obstacles are left in the way, such as that diagonal trend line you’re seeing. If we see a break above that, then $550B and $645B respectively are our targets for this index.
If just the last two small candles we had last week and this week have given us a few solid opportunities, imagine what a push to $645B can do for most altcoins.
What we’re seeing on this chart now is that the index is above its previous all-time high. A weekly closure above this level will invalidate further downside, which we’re three days and fourteen hours away from (at the time of writing).
However, obstacles are left in the way, such as that diagonal trend line you’re seeing. If we see a break above that, then $550B and $645B respectively are our targets for this index.
If just the last two small candles we had last week and this week have given us a few solid opportunities, imagine what a push to $645B can do for most altcoins.
BTC | Bitcoin
Bitcoin is at a decision-making point - let’s see why:
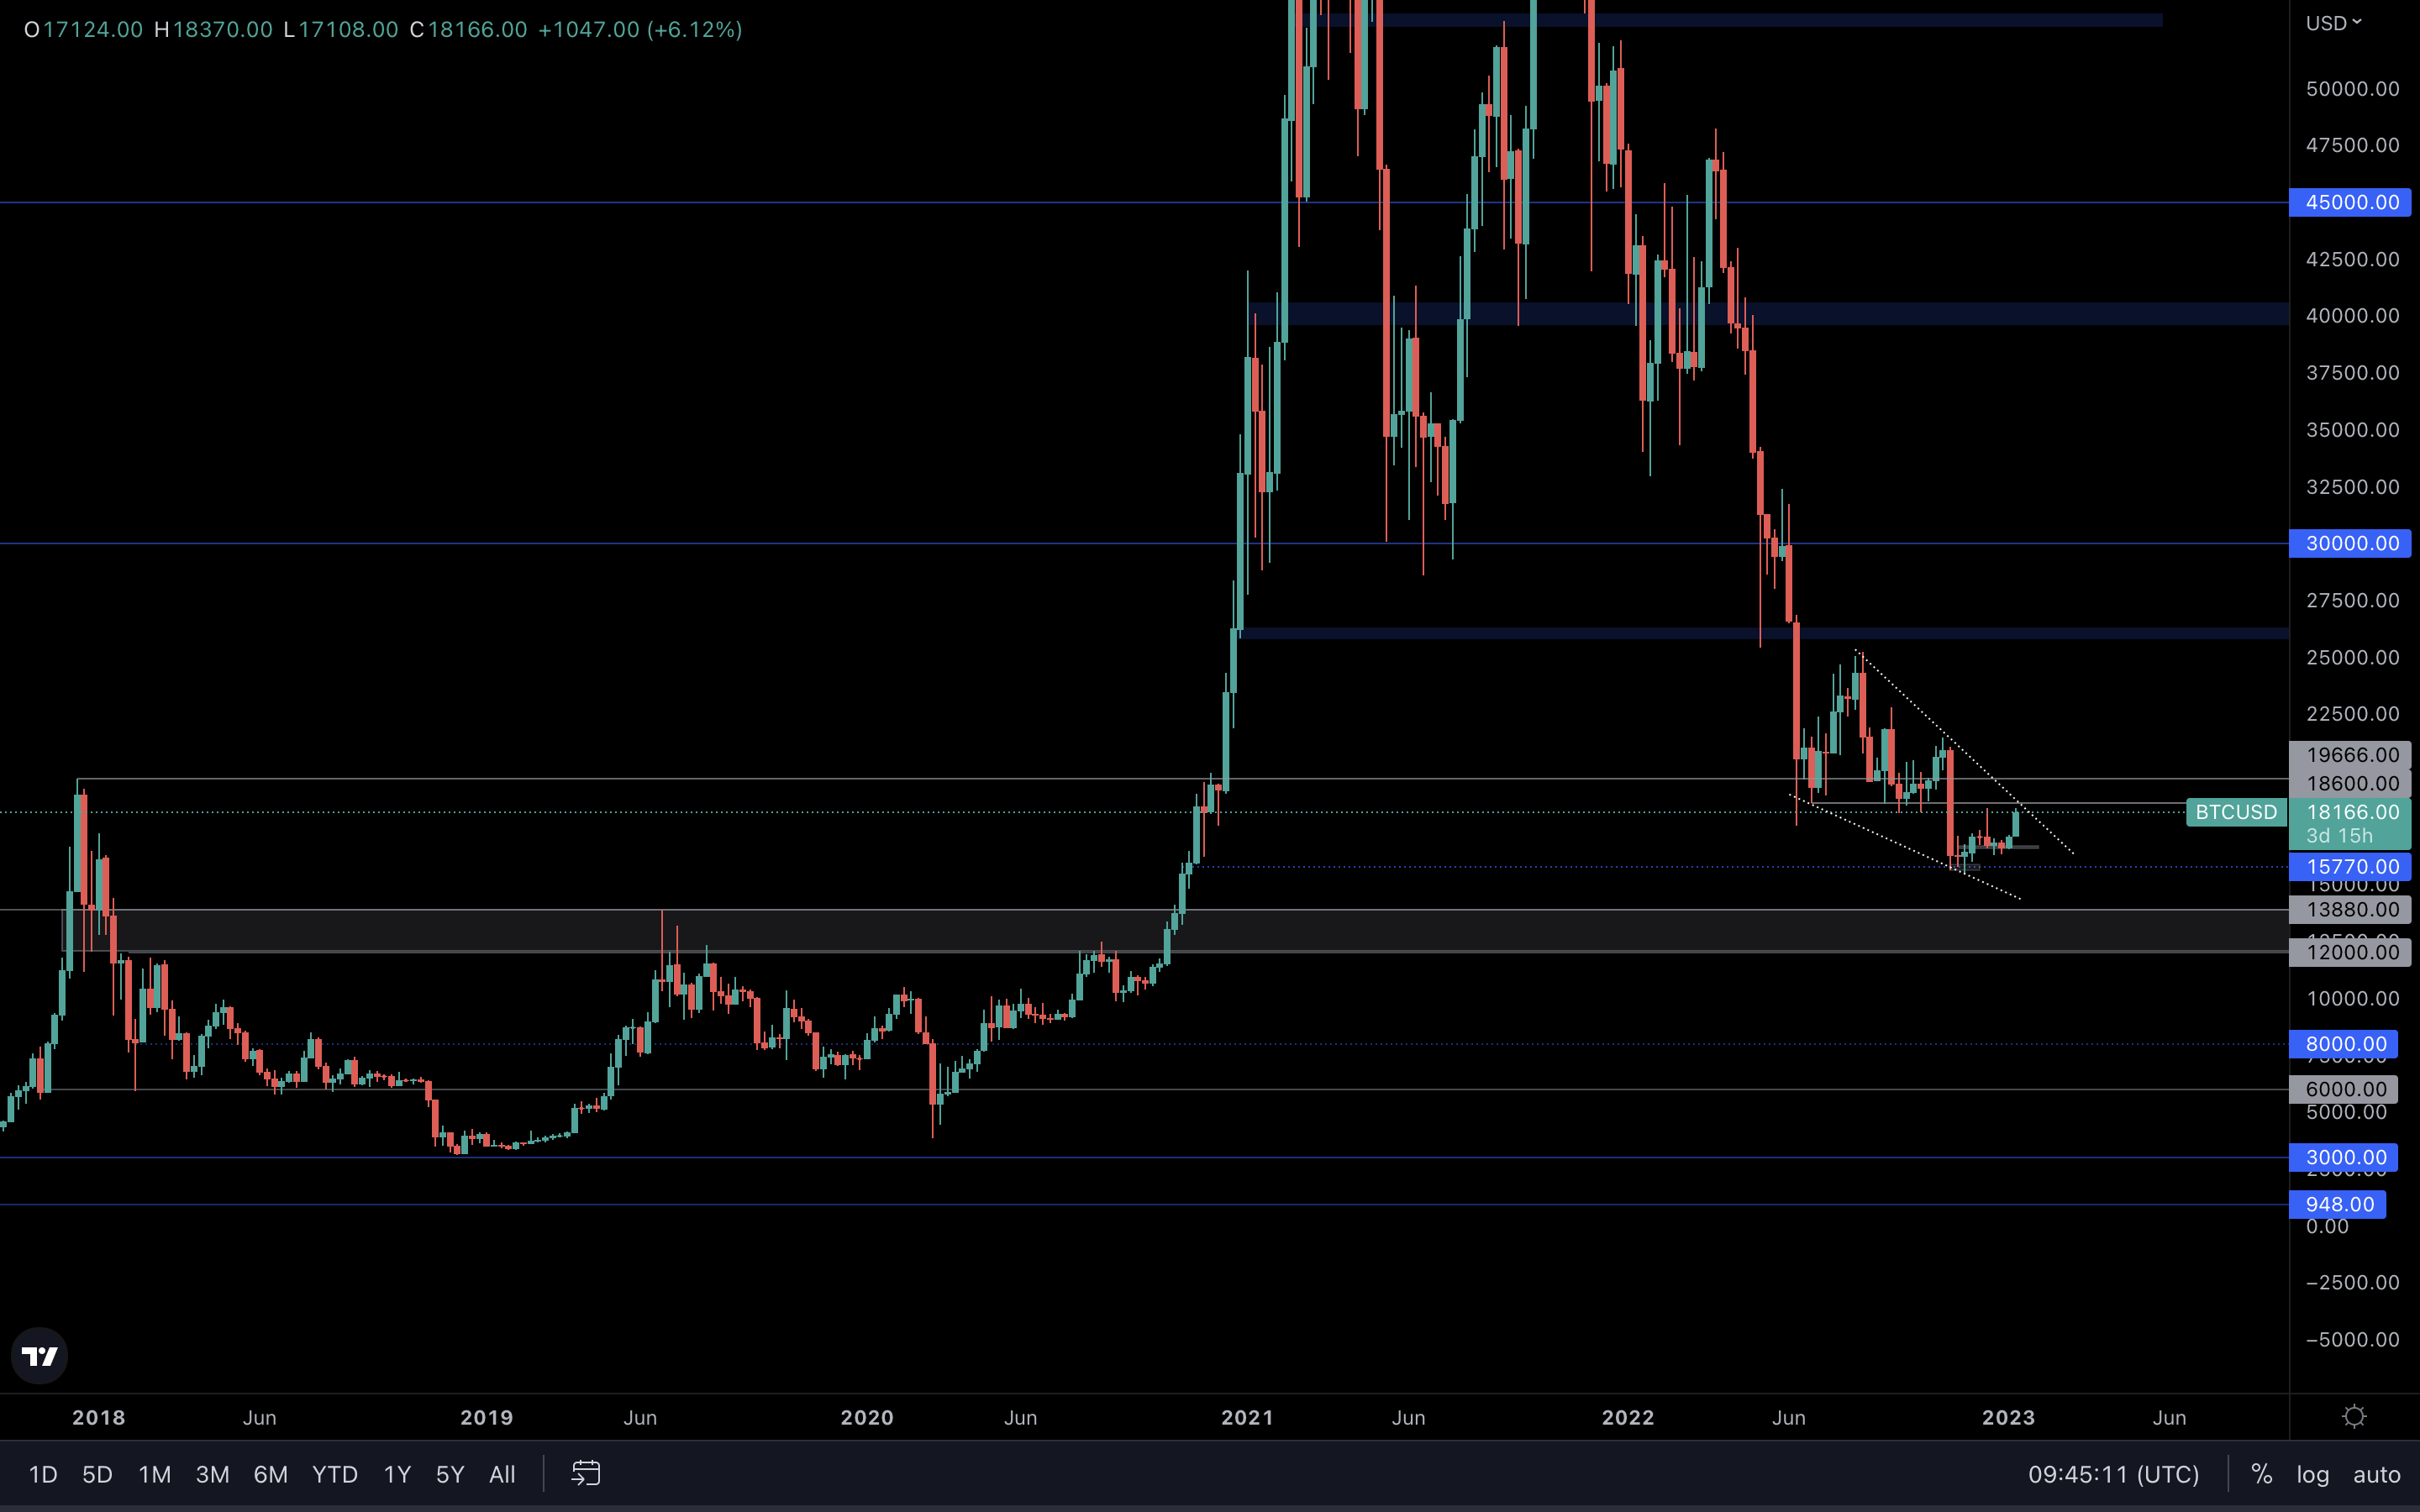 This is the weekly timeframe for BTC, and we can see that the asset is trading inside of a falling wedge. If you’ve skipped the Total Market Cap analysis above, then make sure to read it before diving into this.
Two things can happen here - either Bitcoin breaks above the upper trend line and confirms further upside, or we see a rejection here or after testing the 2018 all-time high, both which could bring the price of Bitcoin back down.
If we were to make an educated guess, we’d say that Bitcoin will break to the upside because:
• The asset is trading inside of a falling wedge. From a technical standpoint, there are higher odds of rising rather than falling.
• Price action is becoming more and more flattened, indicating a bottom is approaching.
• Volumes have been going down - typical behaviour inside a pattern formation. Volume needs to increase upon breakout.
However, it could as easily go the other way, because:
• Bitcoin is under its 2018 all-time high - strong resistance.
• Buyers might not have enough strength to push the price of Bitcoin further. Afterall, we are in a bear market.
• Bitcoin could get rejected at the trend line, which will confirm a move to $13,880.
As far as we know, this could be a 50-50 scenario. The only thing we can do is wait and act accordingly.
This is the weekly timeframe for BTC, and we can see that the asset is trading inside of a falling wedge. If you’ve skipped the Total Market Cap analysis above, then make sure to read it before diving into this.
Two things can happen here - either Bitcoin breaks above the upper trend line and confirms further upside, or we see a rejection here or after testing the 2018 all-time high, both which could bring the price of Bitcoin back down.
If we were to make an educated guess, we’d say that Bitcoin will break to the upside because:
• The asset is trading inside of a falling wedge. From a technical standpoint, there are higher odds of rising rather than falling.
• Price action is becoming more and more flattened, indicating a bottom is approaching.
• Volumes have been going down - typical behaviour inside a pattern formation. Volume needs to increase upon breakout.
However, it could as easily go the other way, because:
• Bitcoin is under its 2018 all-time high - strong resistance.
• Buyers might not have enough strength to push the price of Bitcoin further. Afterall, we are in a bear market.
• Bitcoin could get rejected at the trend line, which will confirm a move to $13,880.
As far as we know, this could be a 50-50 scenario. The only thing we can do is wait and act accordingly.
ETH | Ethereum
Ether is also at a decision-making point, let’s see why: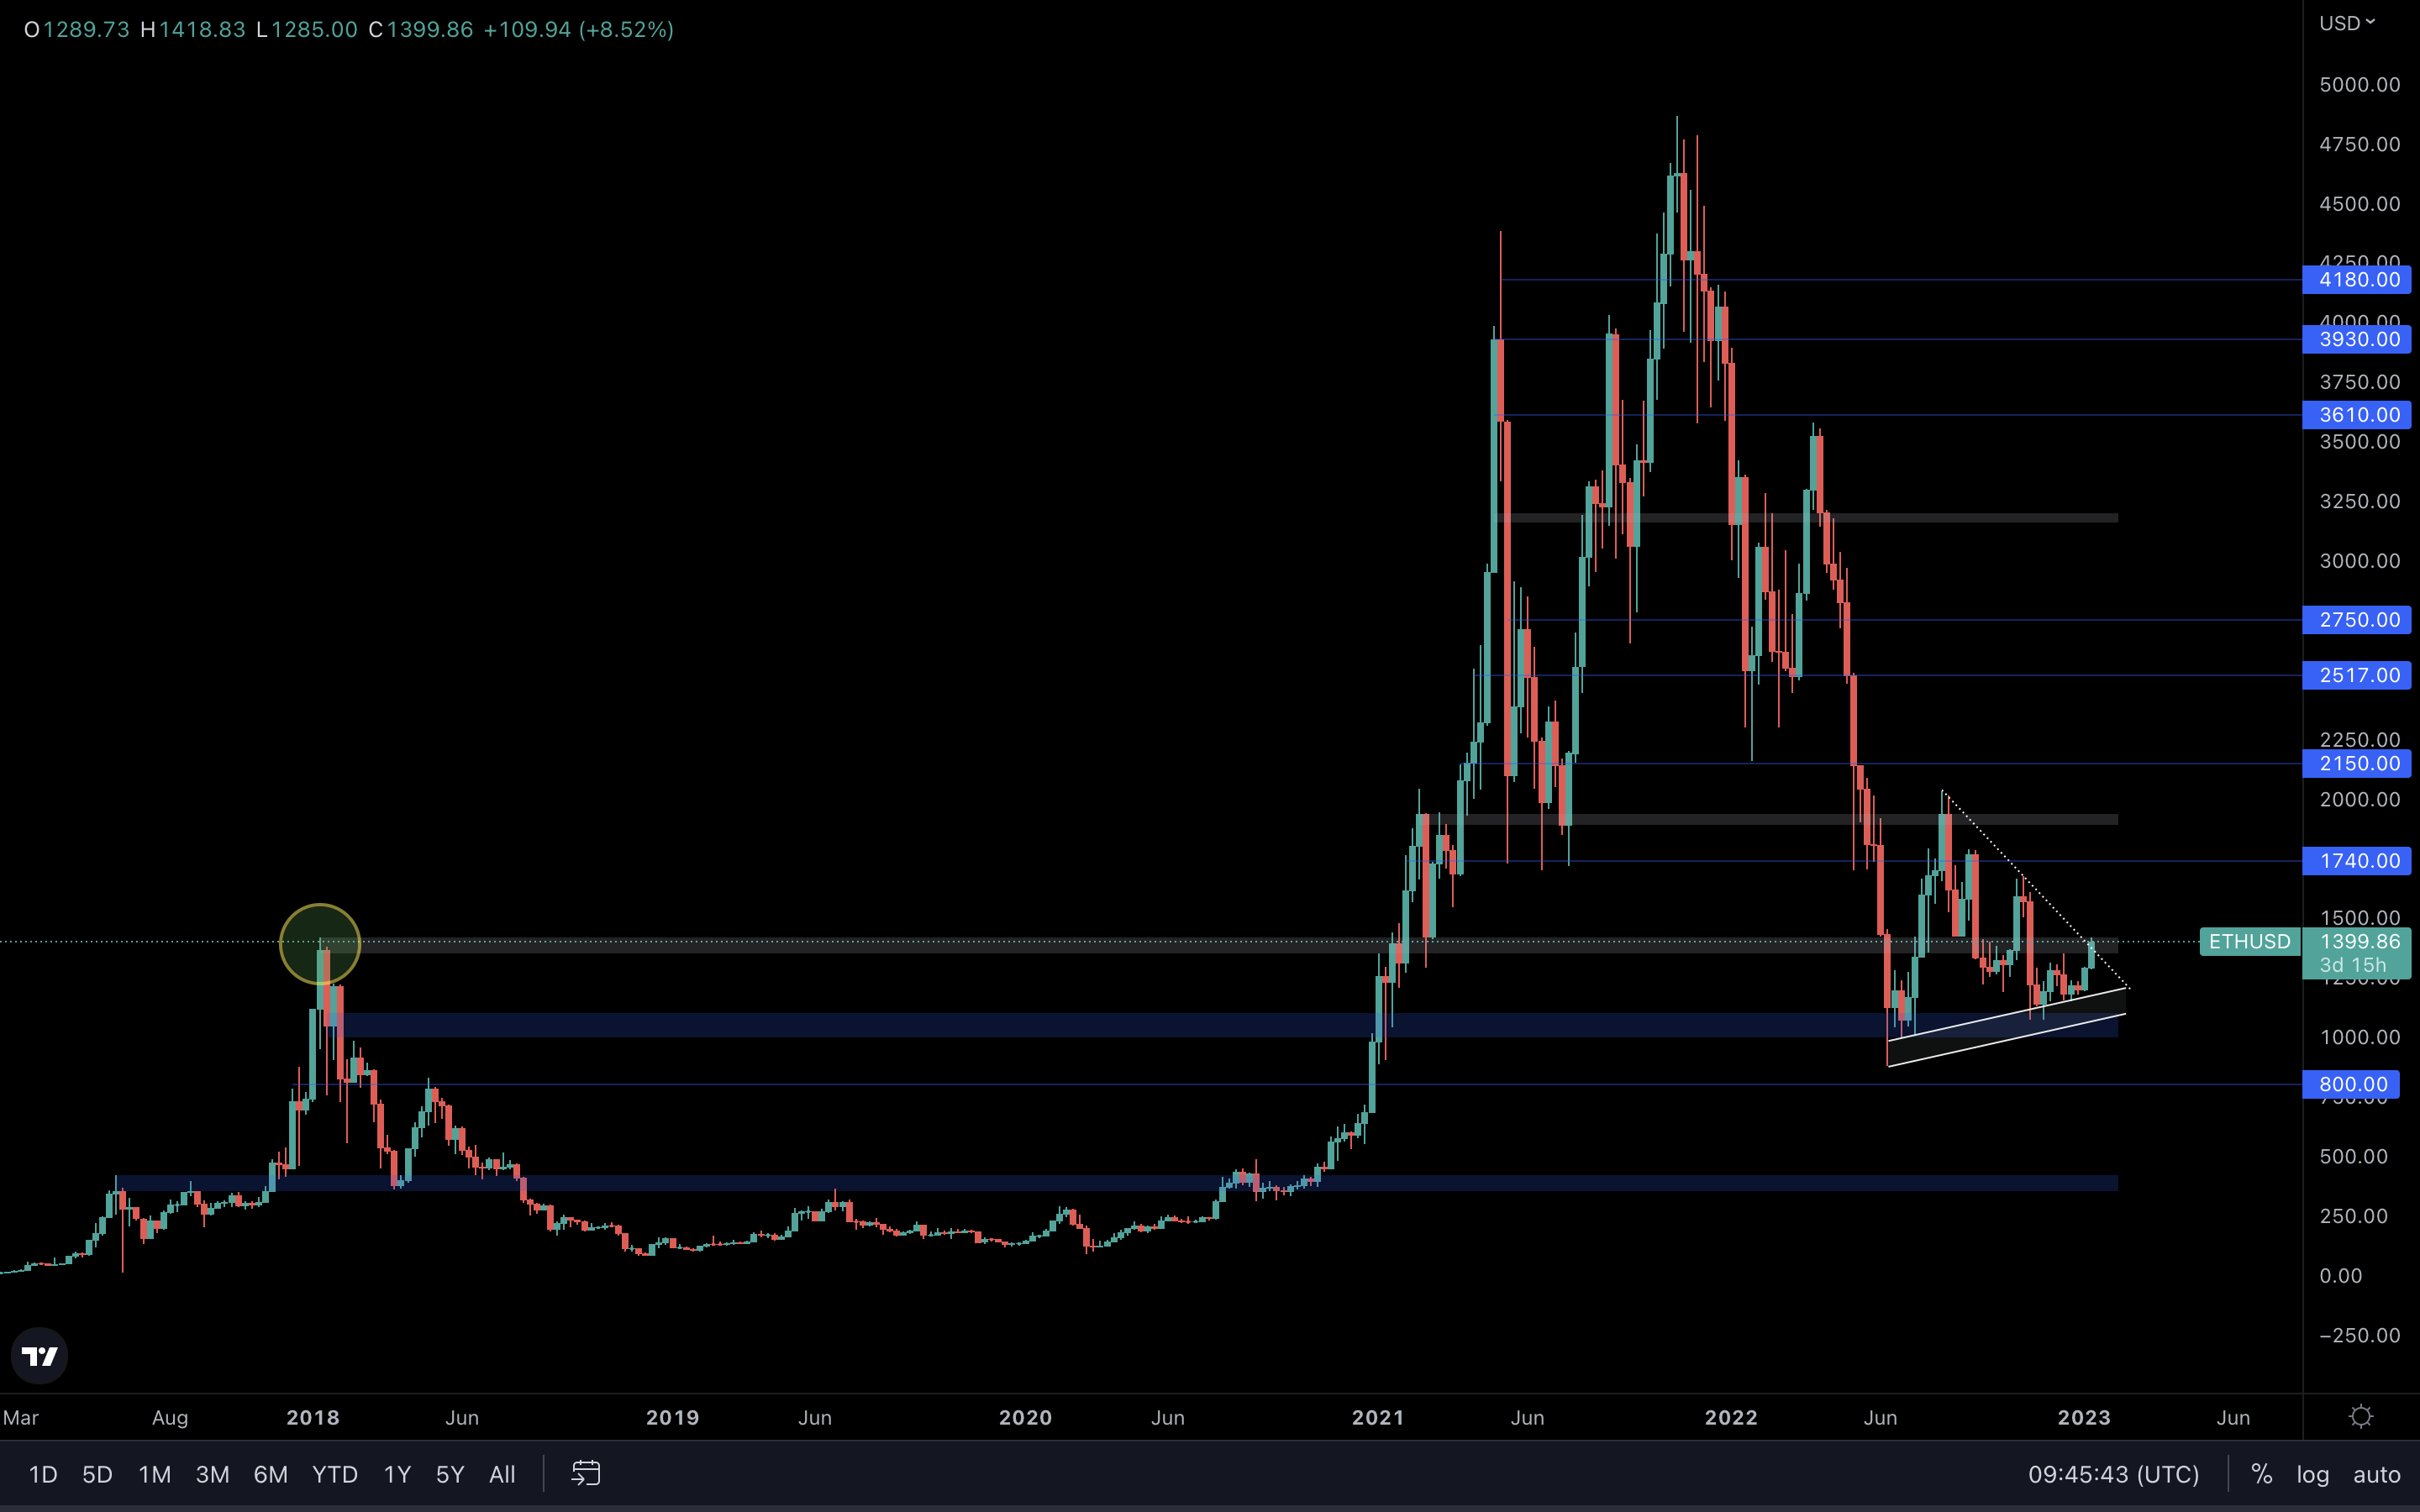
We’ve identified a symmetrical triangle on the weekly ETH chart. If you’re unfamiliar with this pattern, please check the ETH analysis from our previous free report here.
There is one major issue on this chart - Ether is testing resistance at the 2018 all-time high level. A break above $1420 is absolutely necessary to keep the upside scenario on float, otherwise we could see a nasty rejection which willl bring Ether back to $1000. However, if we see a break to the upside, both the 2018 all-time high and the diagonal trend line from the triangle will be broken, leaving only $1740 and $1900 as the next targets for ETH. This week is crucial for ETH, so definitely make sure to keep an eye on this chart at all times.
ETH/BTC
We monitor this chart to understand who is outpeforming - Ether or Bitcoin. As you can see, we also have a symmetrical triangle on this chart which has broken out and is heading to the upside.What does that mean, you might ask? In simple terms, a rising ETH/BTC - ETH outperforms.
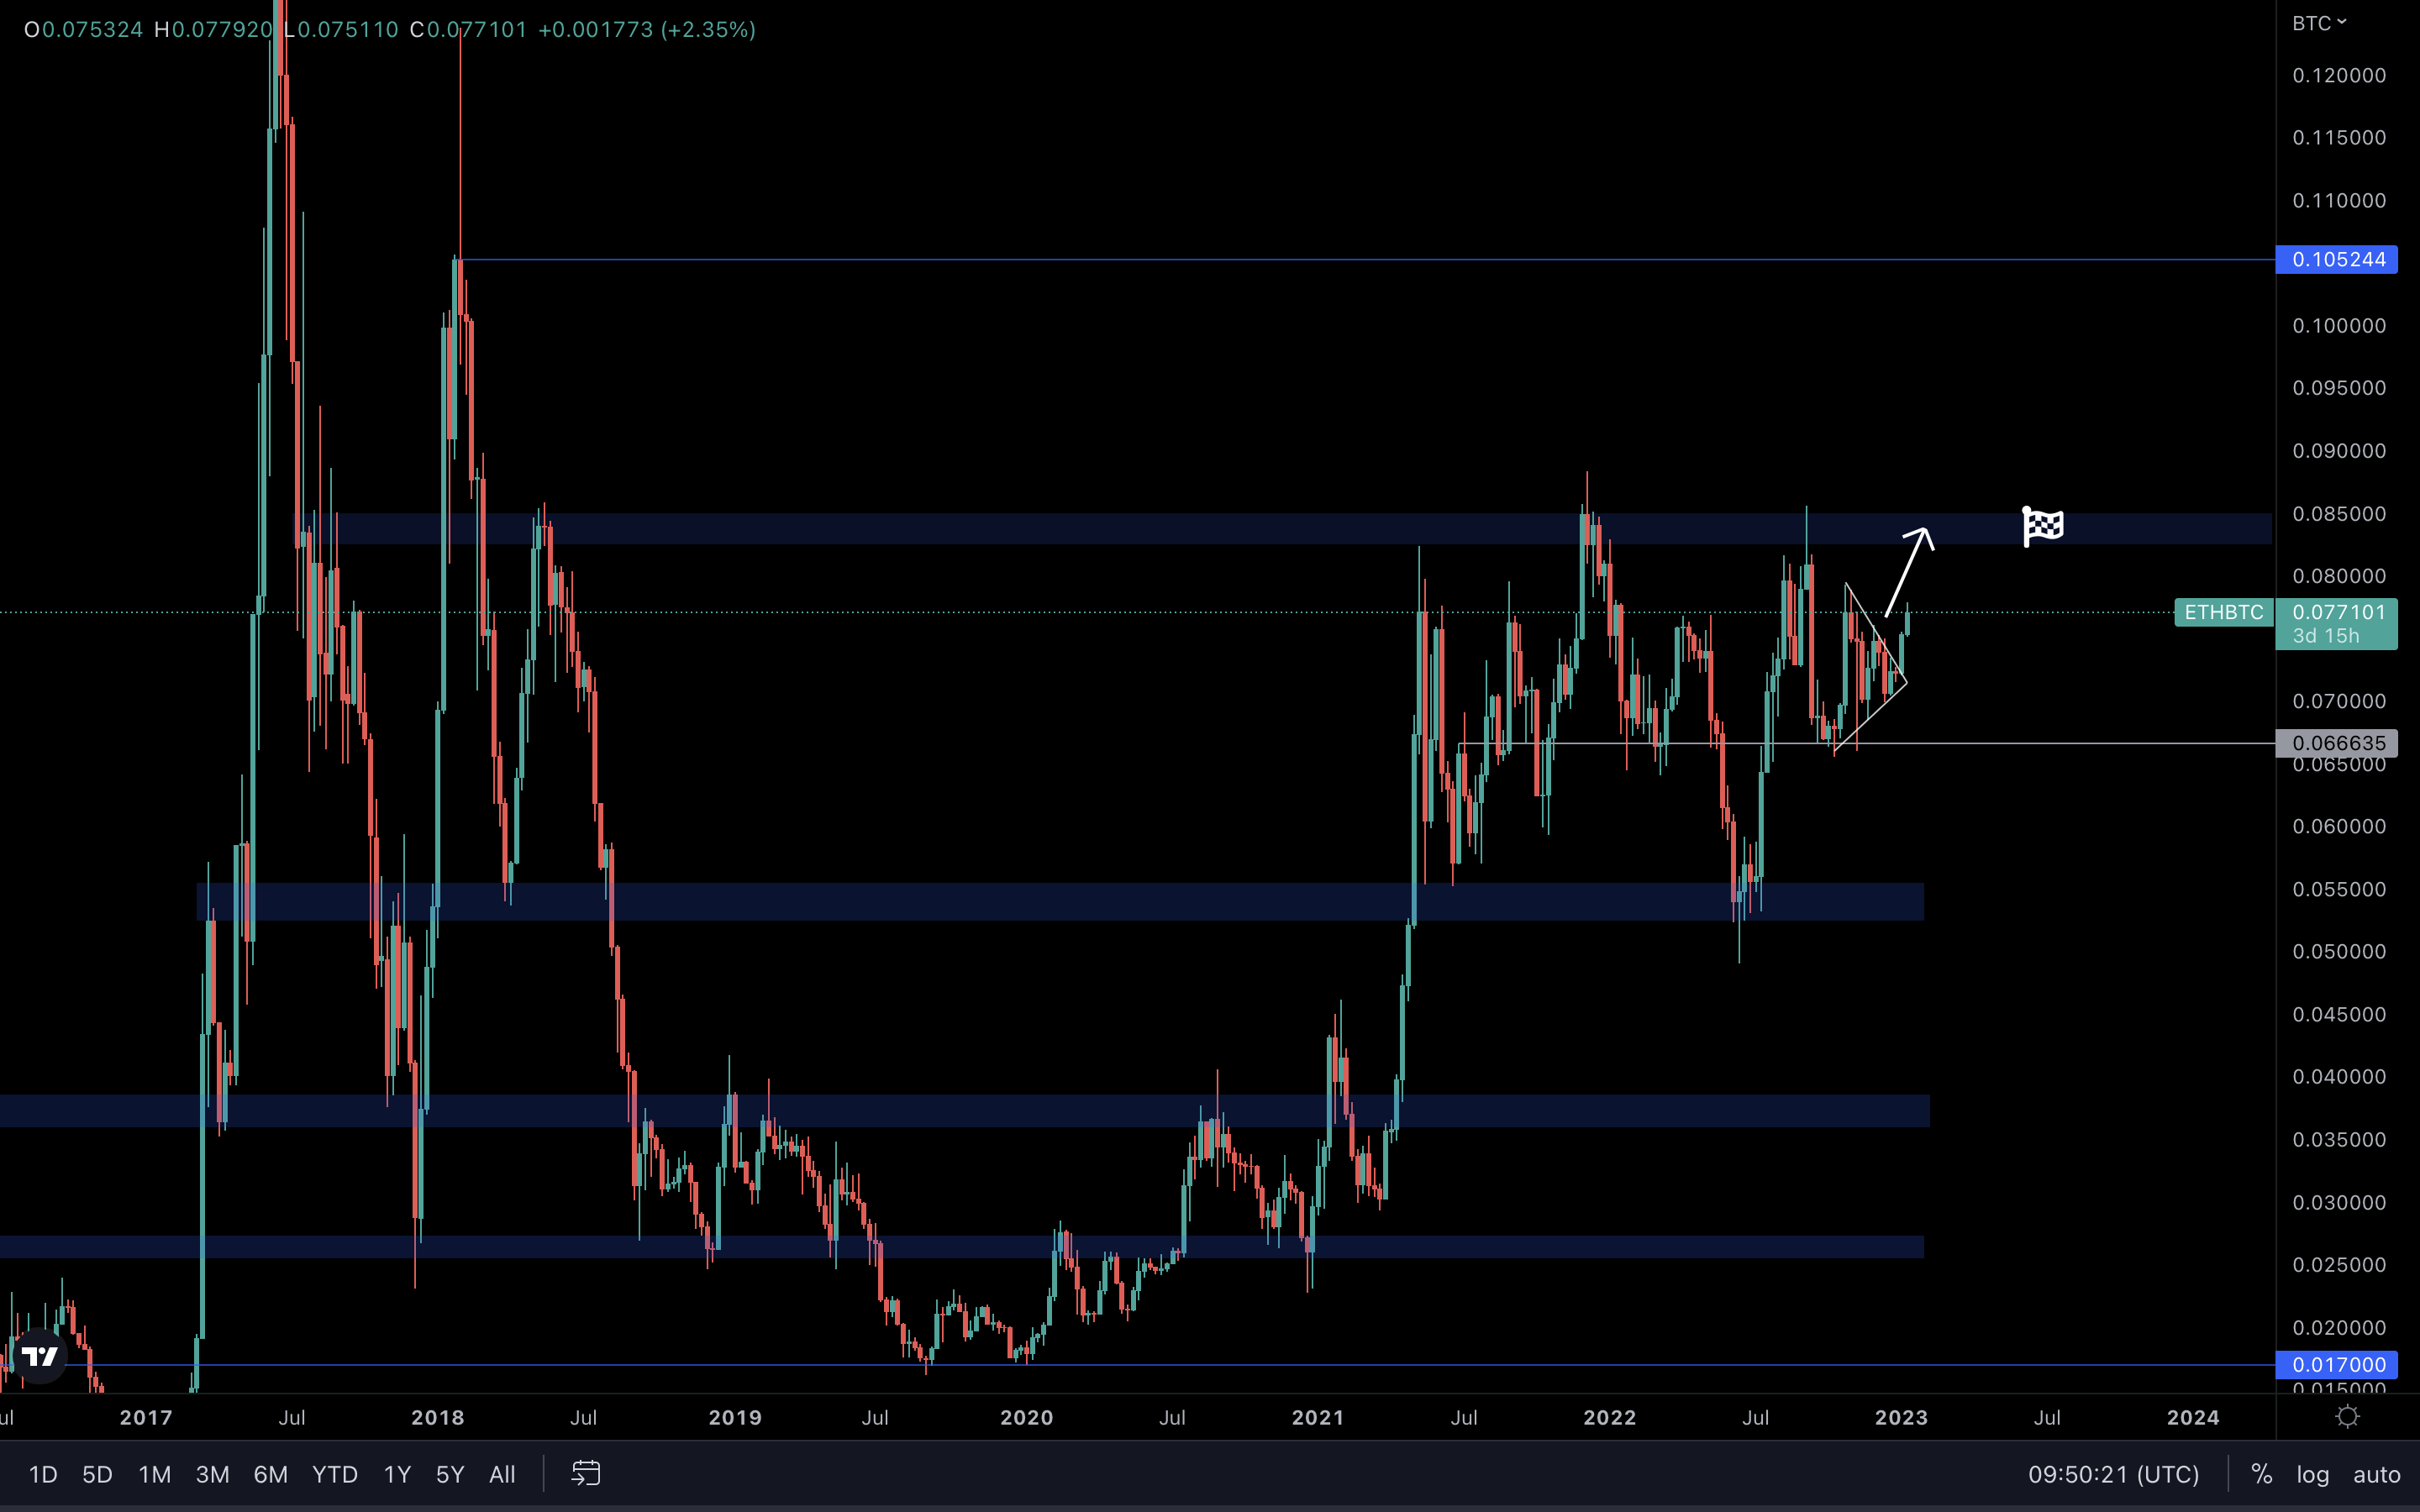
Since last week, ETH/BTC has been performing really well, which has had a direct impact on ETH and the rest of the altcoins market. If this performance continues to rise to our target (the blue box), then ETH might have a chance at breaking above its 2018 all-time high and head a lot higher. As a result, most altcoins will perform extremely well. If it’s not obvious already, moving your attention to altcoins might be your best choice.
SOL | Solana
This is a logarithmic chart for SOL - we’re using this chart specifically because the standard chart for SOL is harder to read + it hurts our feelings. Just joking. It doesn’t hurt our feelings, it hurts our wallets.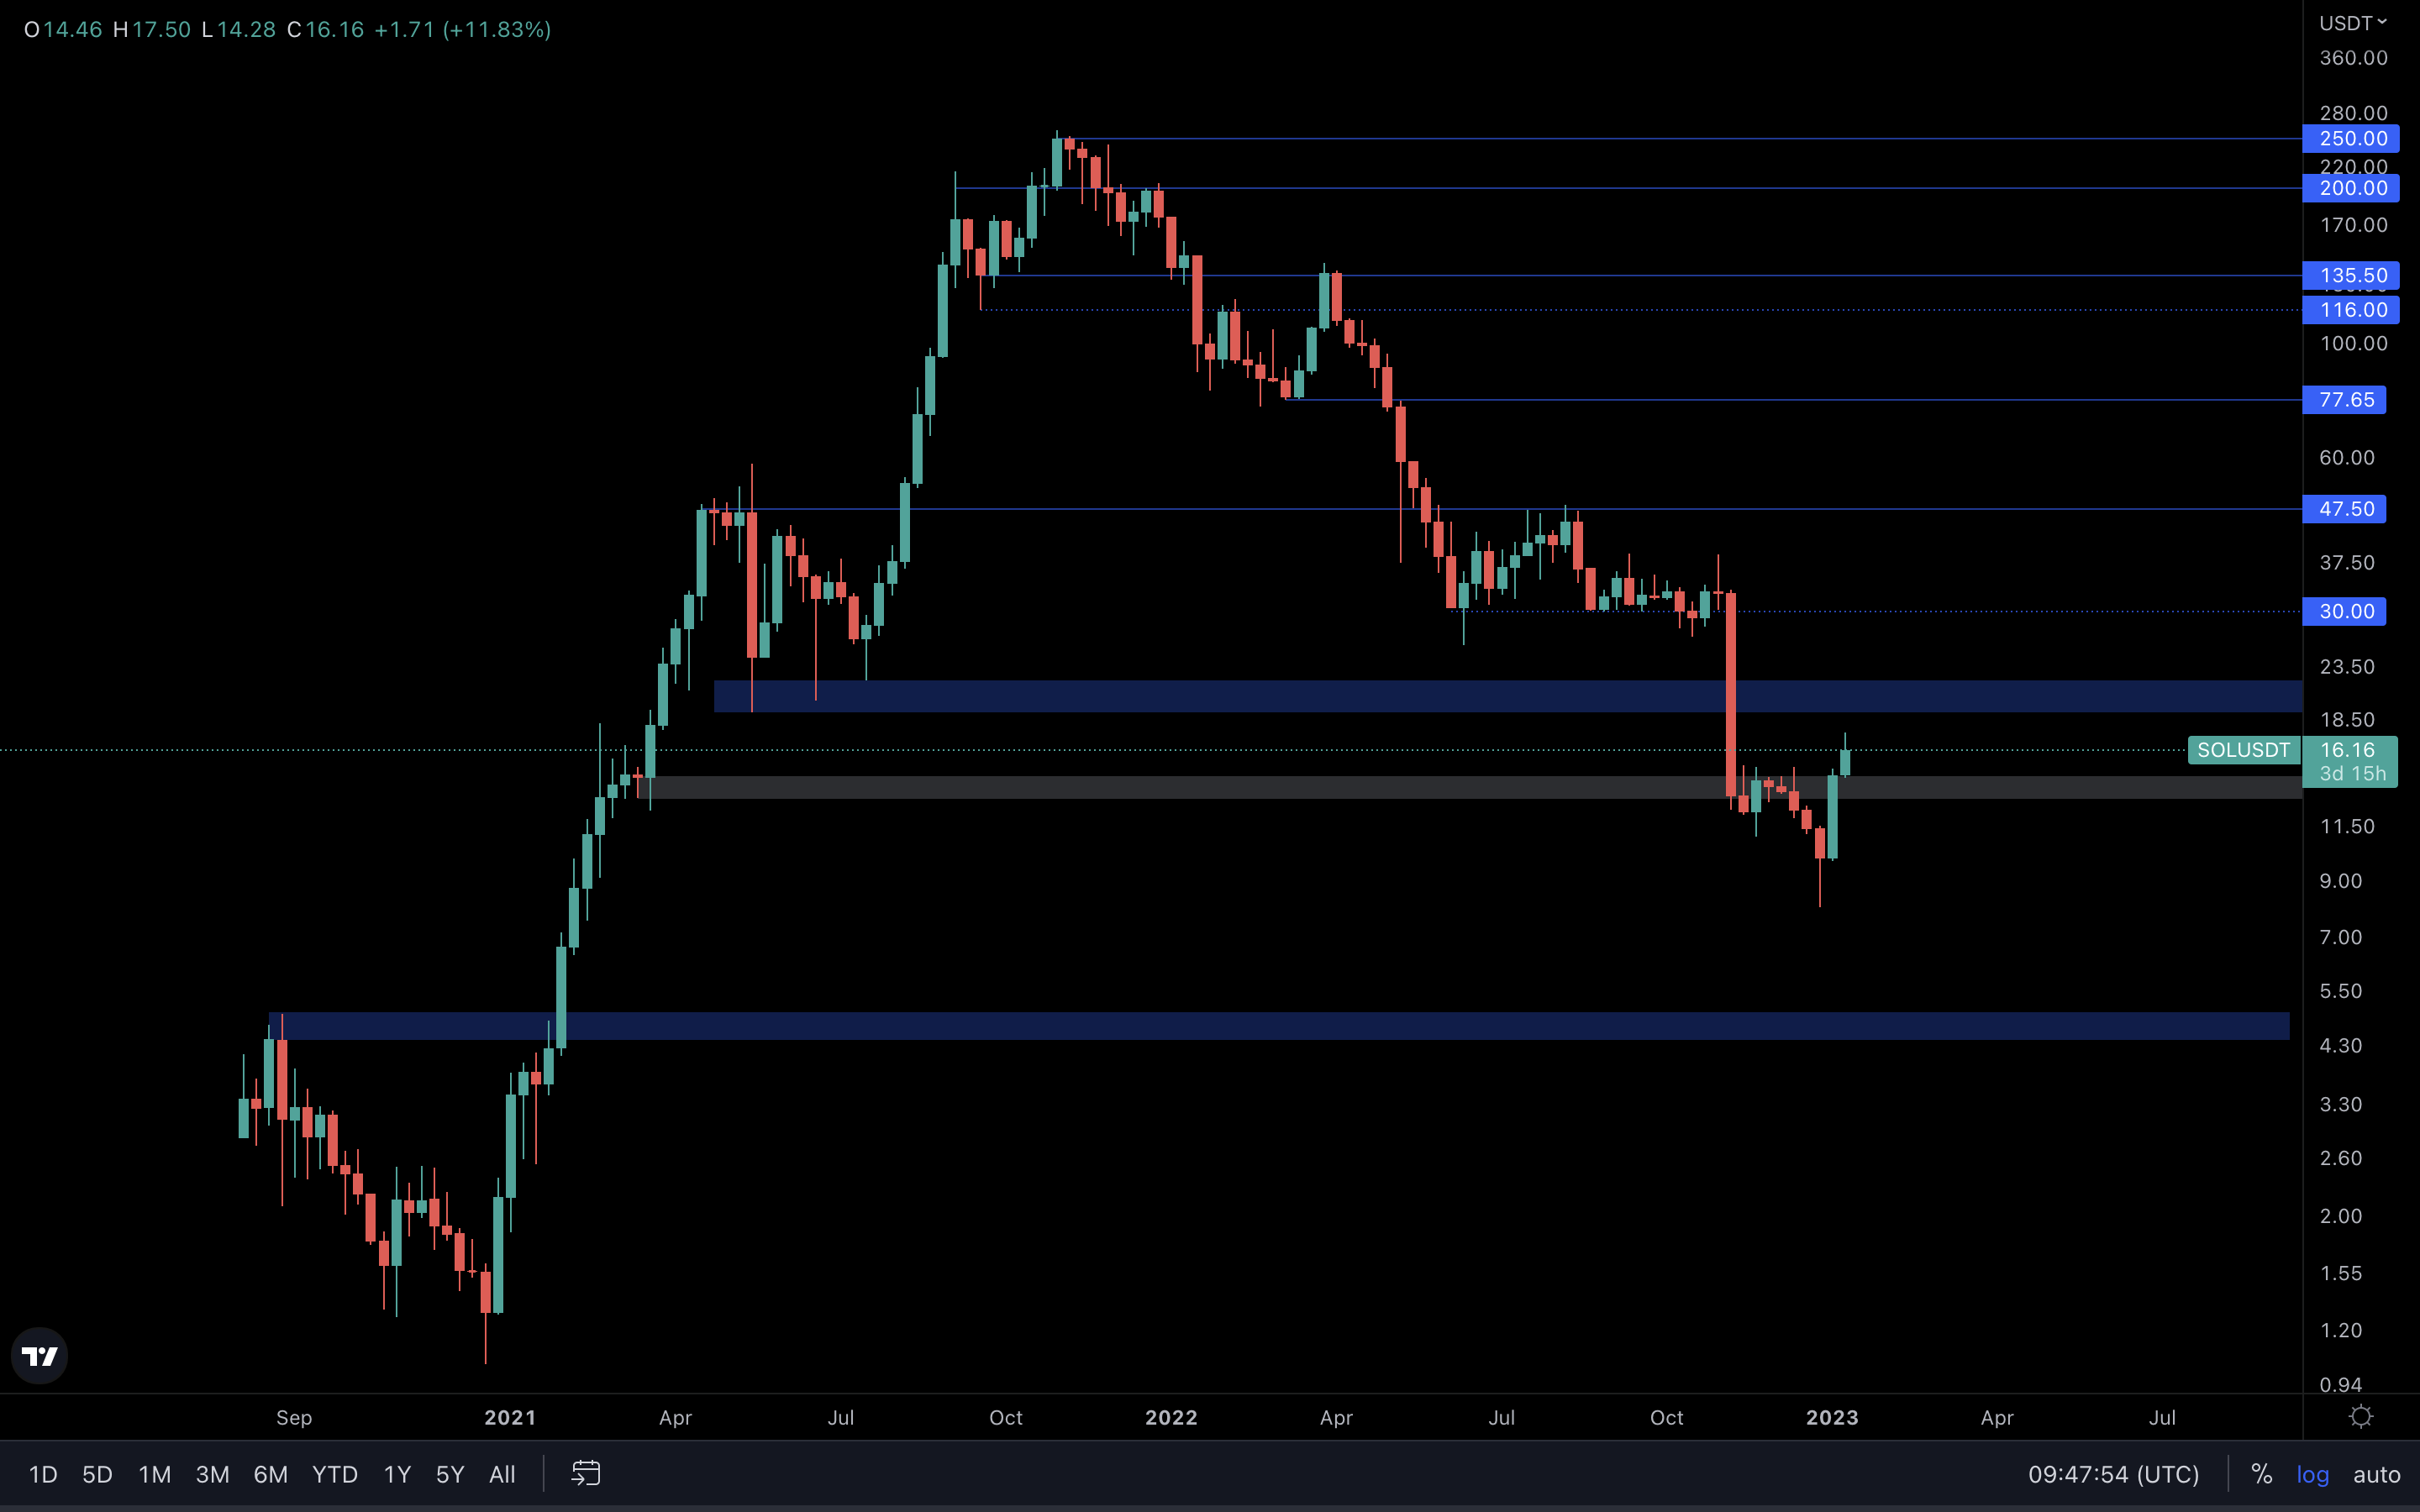
SOL has seen some interesting development since our previous report - the asset has risen ~48% in the last week alone, a performance that is influenced by multiple factors, such as selling pressure reaching unsustainable levels, the Alameda situation calming down, and even Bitcoin & Ether performing well. Leaving that aside, SOL has reclaimed $14 and we should now be expecting a test of the blue box ($19 - $22). At least for now, a $5 SOL has been invalidated because previous resistance has been flipped into support. However, we still believe a $5 SOL is likely in 2023.
BNB | Binance
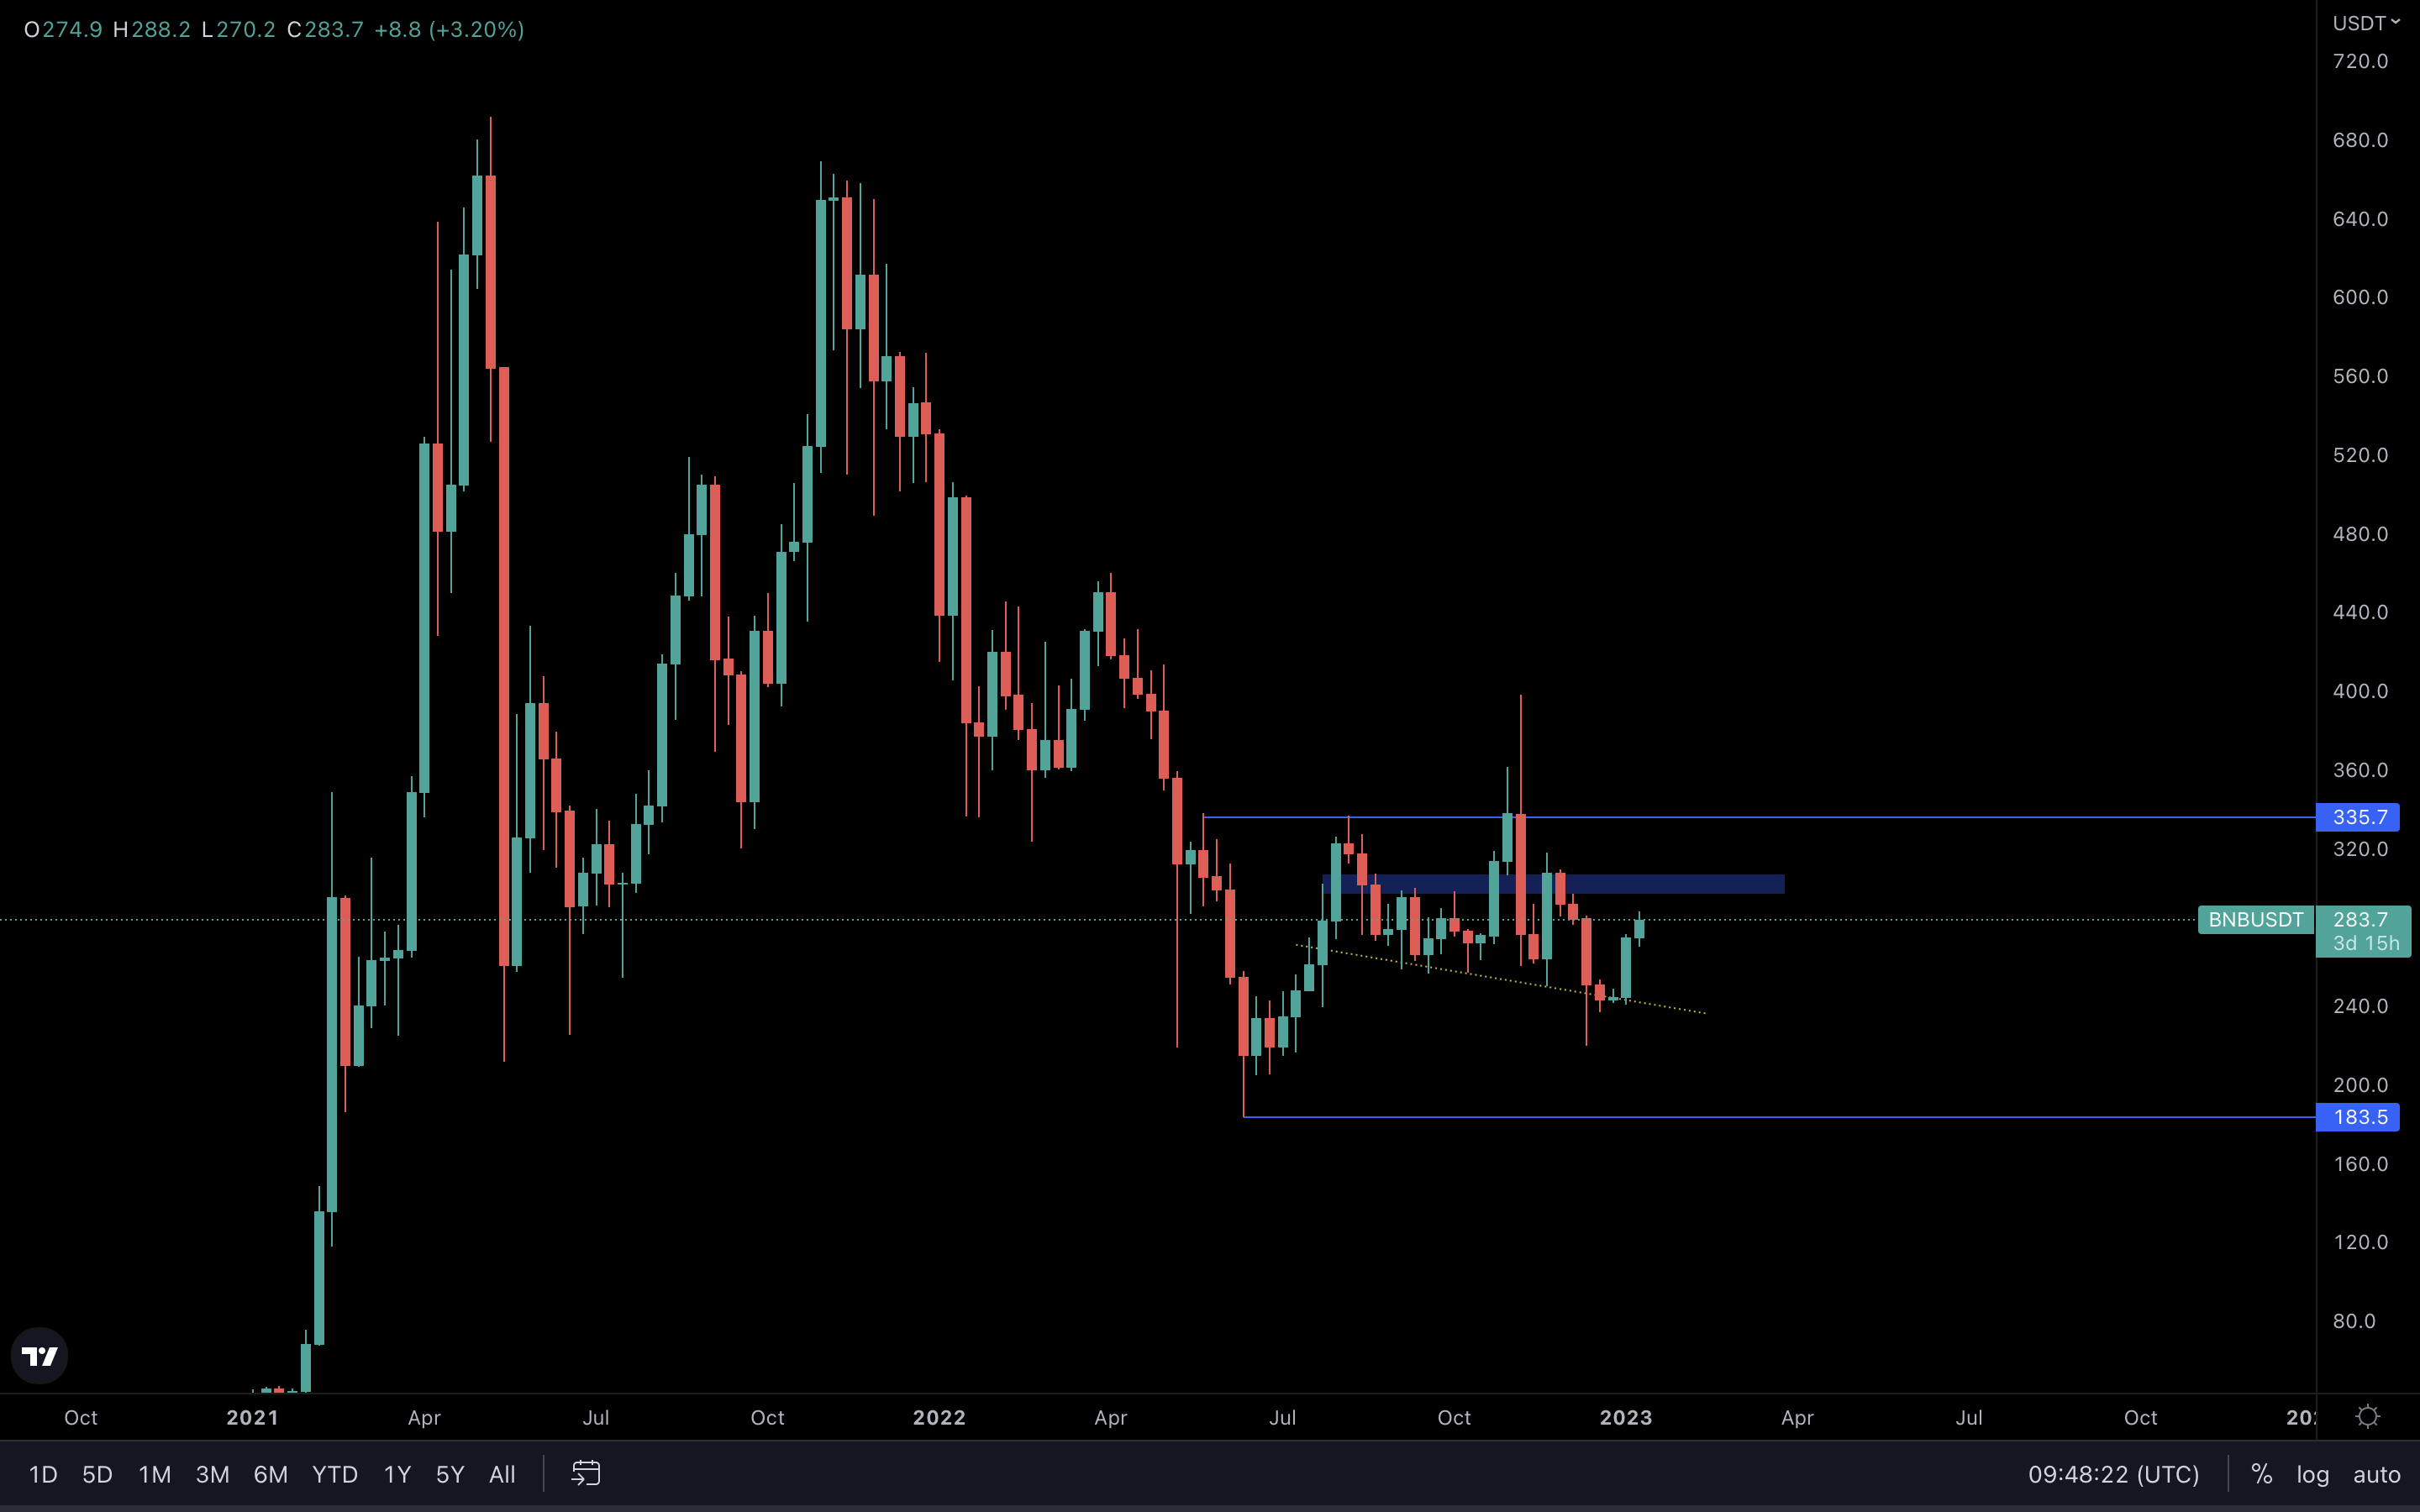
Easiest chart to read in this entire report - after taking the yellow trend line as support again, BNB has risen ~13% last week. We could say $300 is almost guaranteed, but anything above that level is left in the hands of Bitcoin and Ether, as they’re close to picking a direction.
UNI | Uniswap
A breakout is approaching…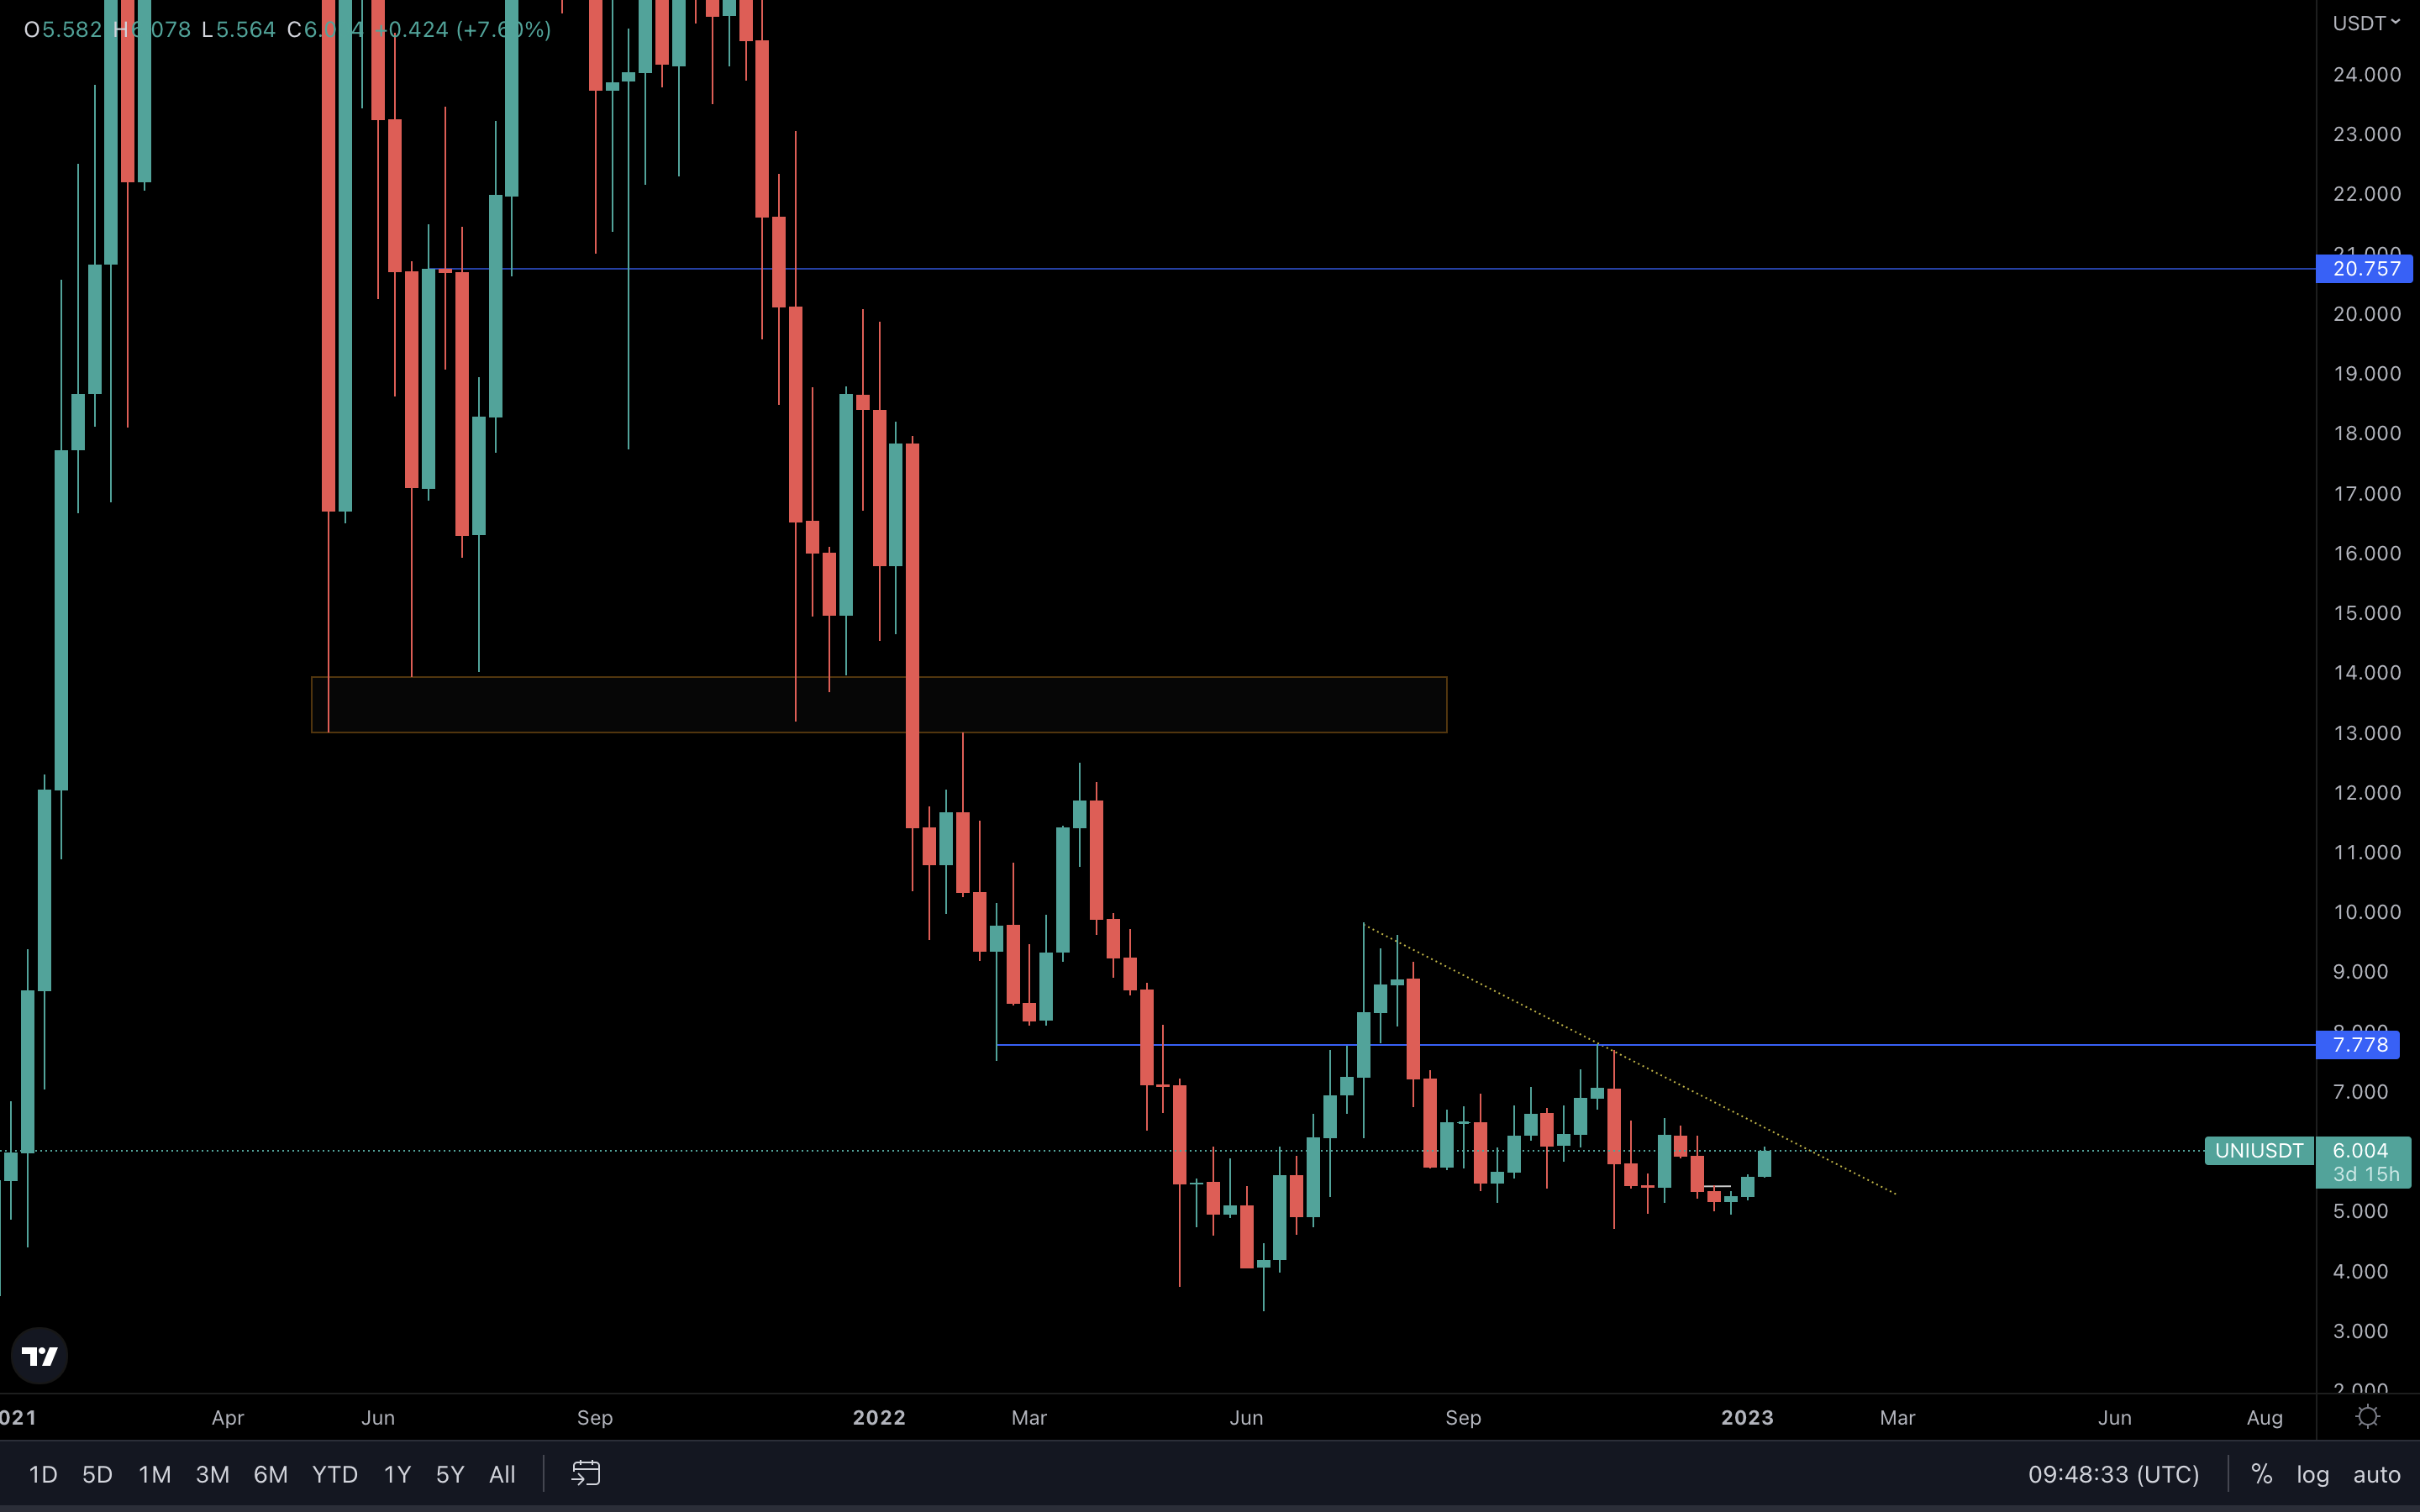
UNI is approaching this diagonal trend line that has acted as resistance a few times in the past. There’s still a bit more room to go, but a decision-making point is on the horizon. If UNI breaks to the upside, then $7.77 is our first target. A reclaim of that level will start a potential change in market structures, as the previous high of $7.77 will be invalidated by a higher high - this is definitely something we’ll be watching in the next weeks.
Summary
The wait could finally be over. Most assets are at decision-making points, which will help us understand where the market is going in the next weeks. Although things are looking good for further upside, you always need to be prepared for both scenarios, just in case.
Recommended from Cryptonary


