Save 23% ($351) & Get a Free 1-1 Call with our Team ⏰ : 0d 2h 59m 44s
New Year, New Lows? | January 2023
2022 has been the first bearish year since 2019, which opened its doors into a new bear market, one people we're definitely in need of. In this report, we dive into the charts to give you our expectations on how the market is going to perform in 2023, and whether it will be bullish or not.

Disclaimer: Not financial or investment advice. You are responsible for any capital-related decisions you make, and only you are accountable for the results.
2022 Summary
- Total Market Cap: -65.39%
- Altcoins Market Cap: -66.59%
- Bitcoin: -64.23%
- Ether: -67.48%
- Solana: -94.14%
TLDR
- 2022 was a year of severe collapses: FTX, BlockFi, Voyager, Celsius, LUNA and Three Arrows Capital.
- The collapses distressed the markets further than anticipated and further than all expectations.
- Markets function like an elastic band, if you push it too far one way it will go back to the mean. In this case, have we seen a big undershoot which leads to a large relief rally?
- The Total Market Cap reached what we like to call a "bottom-making region". We believe a relief rally is on the cards.
Total Market Cap

The Total MCap has entered what we believe to be the "Bottom-Making" region. This area spans from ~$600B to ~$750B, meaning the remaining potential downside is another 20% - not something we're waiting for to "start" buying.
We're monitoring this index closely because once the market structure changes with a higher low and a higher high, a 100%+ rally is on the cards.
Altcoins' Market Cap
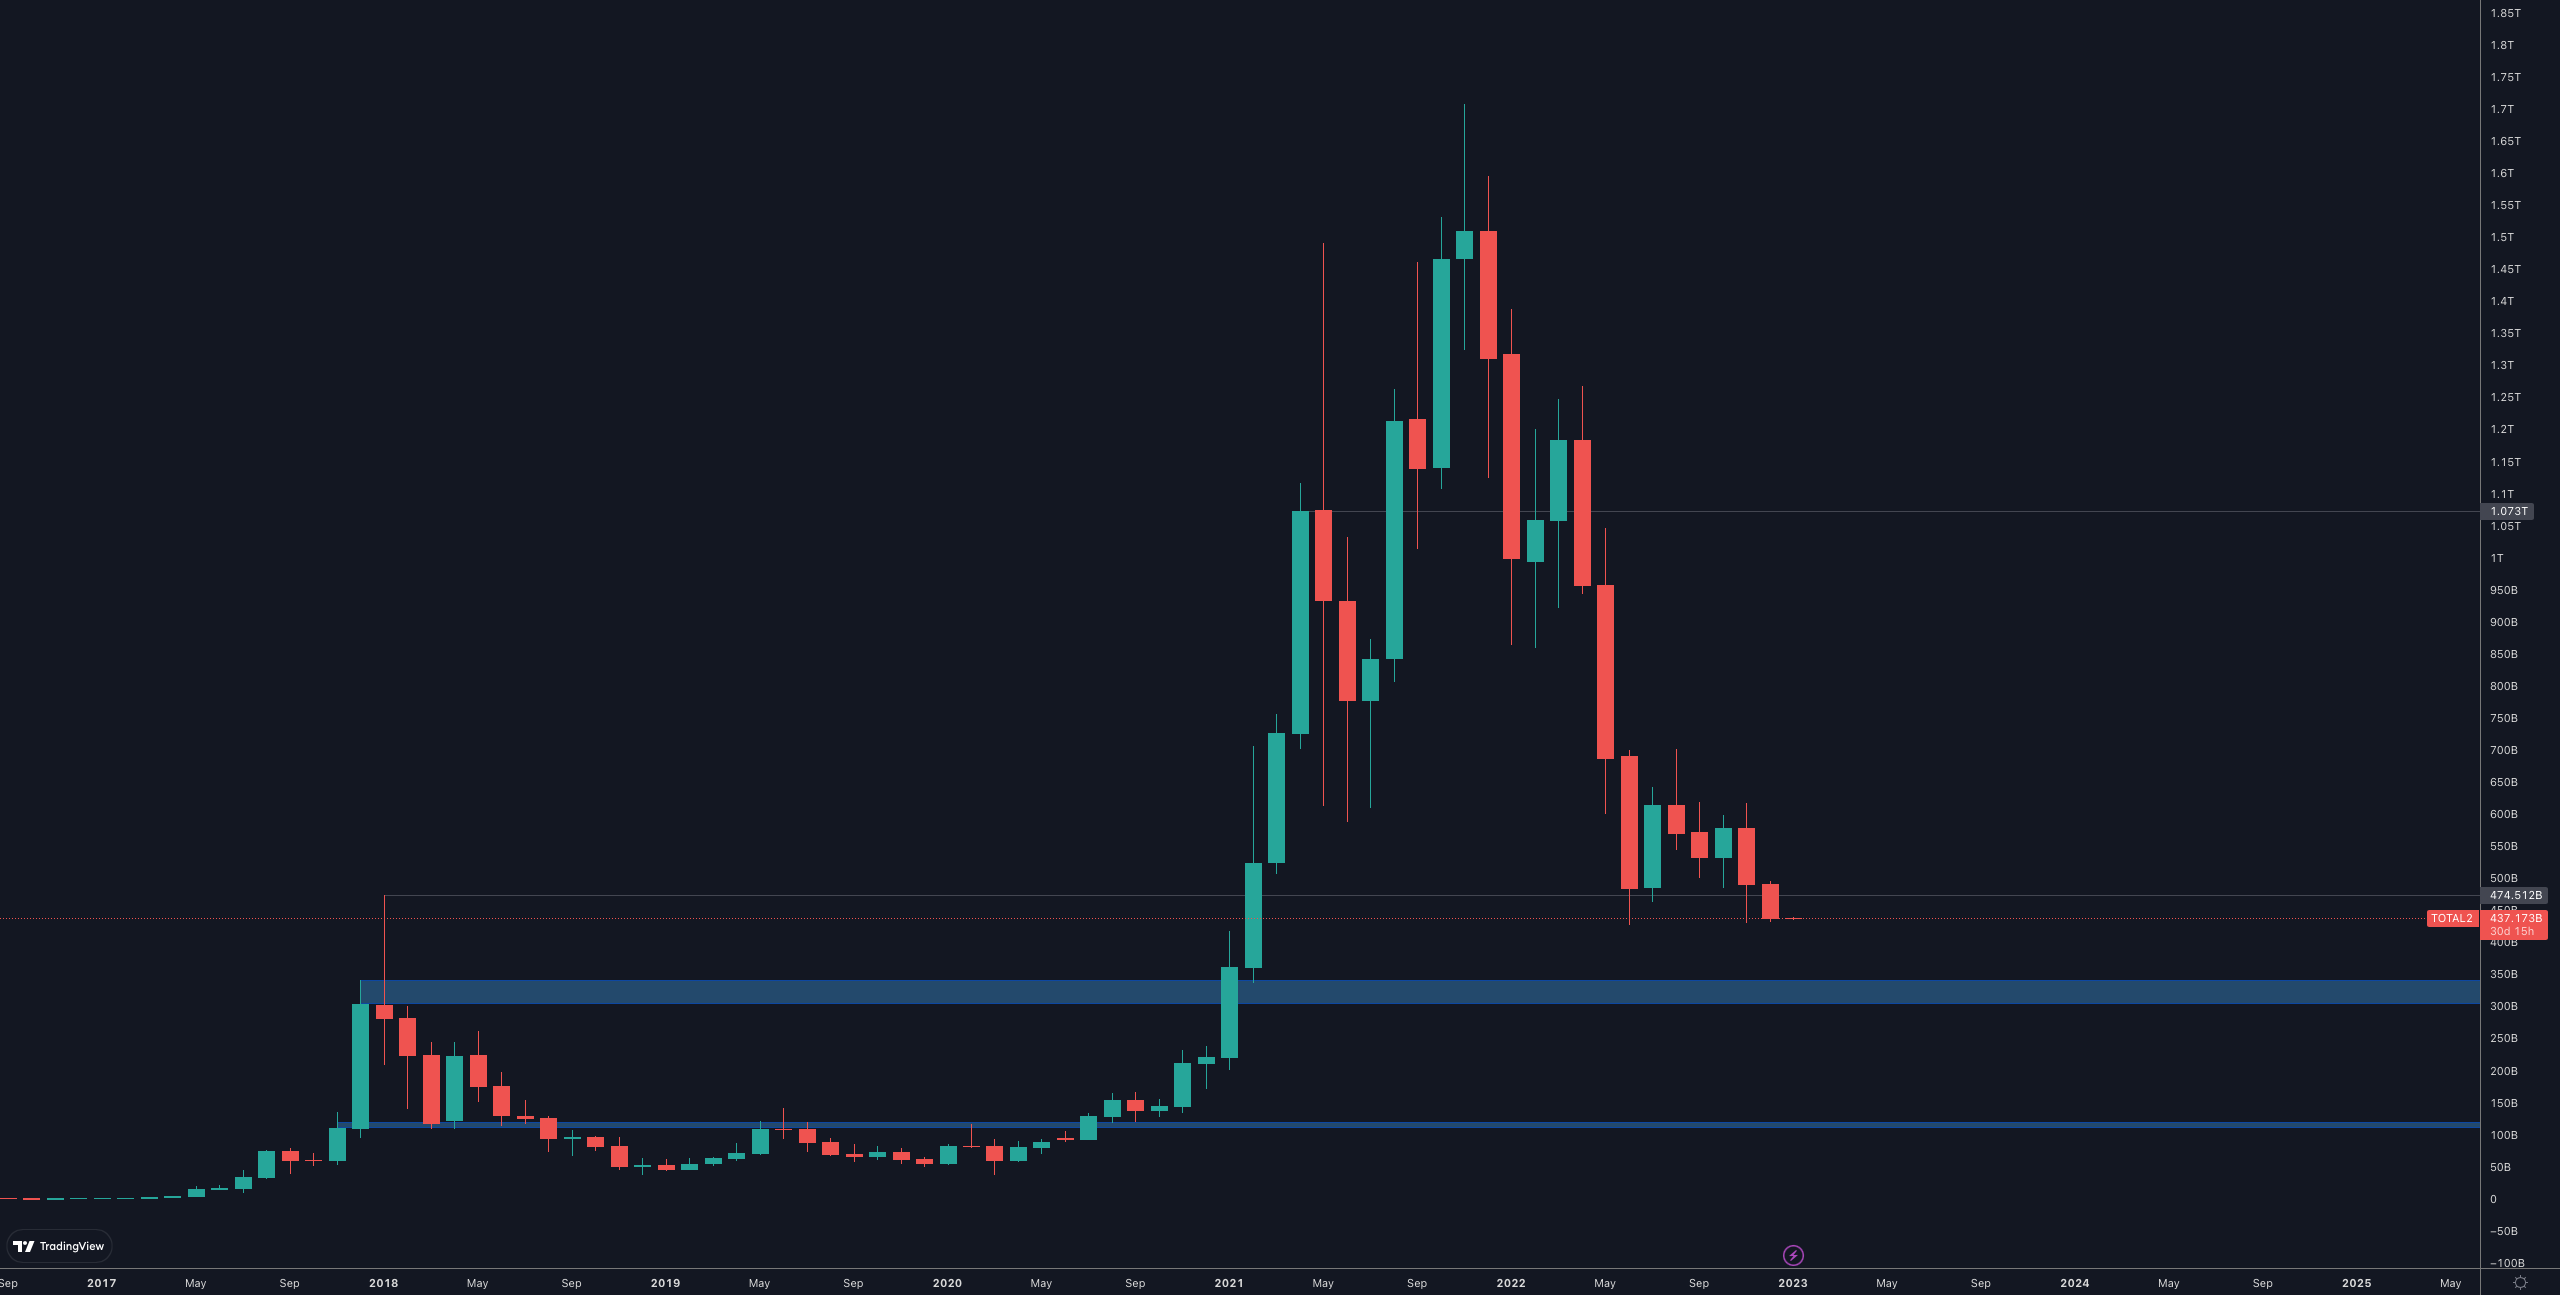
The Alts MCap has broken through the $475B high set in 2017 while setting a new low on the monthly candle closures. This coincides with the same ~20/25% further downside that's on the cards across the market which leads this index to $350B.
This scenario would be invalidated and a rally will be incoming if we see a reclaim of $475B.
Bitcoin | BTC
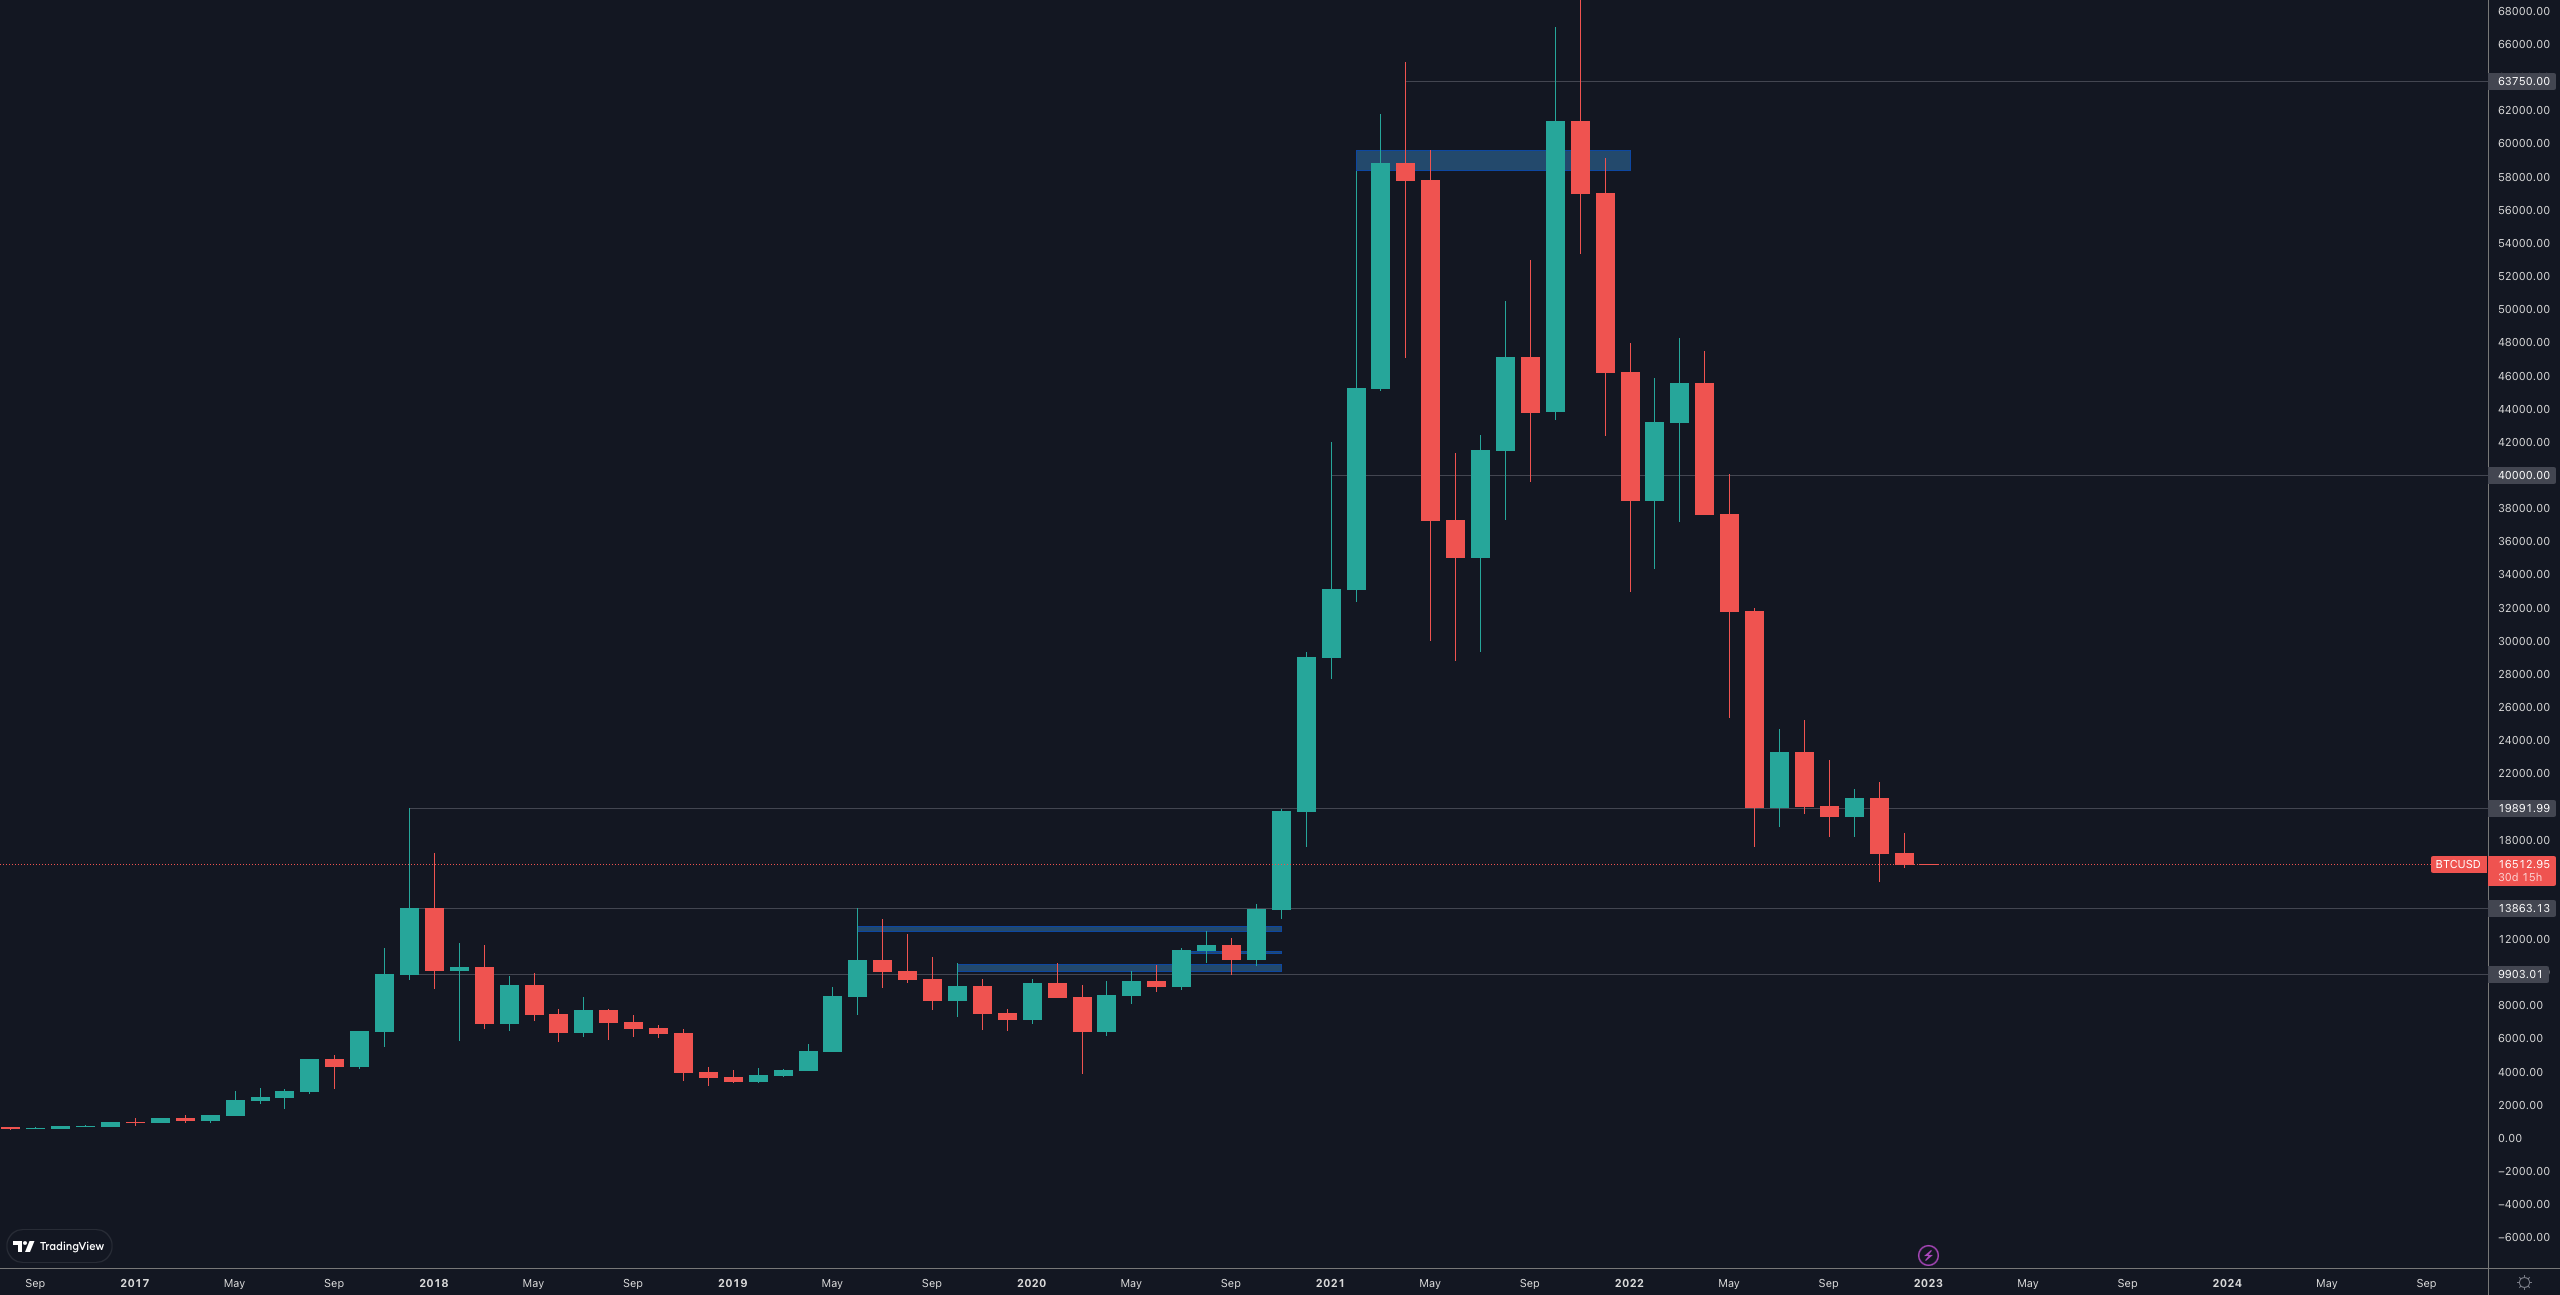
Bitcoin has broken through the 2017 high since summer, then we saw a new low being set which sets the stage for $14,000.
Once again, we are closely monitoring charts for any market structure change as that would lead to a decent rally and it's not promised that the full -20% downside is fulfilled - we must remain flexible.
Ethereum | ETH
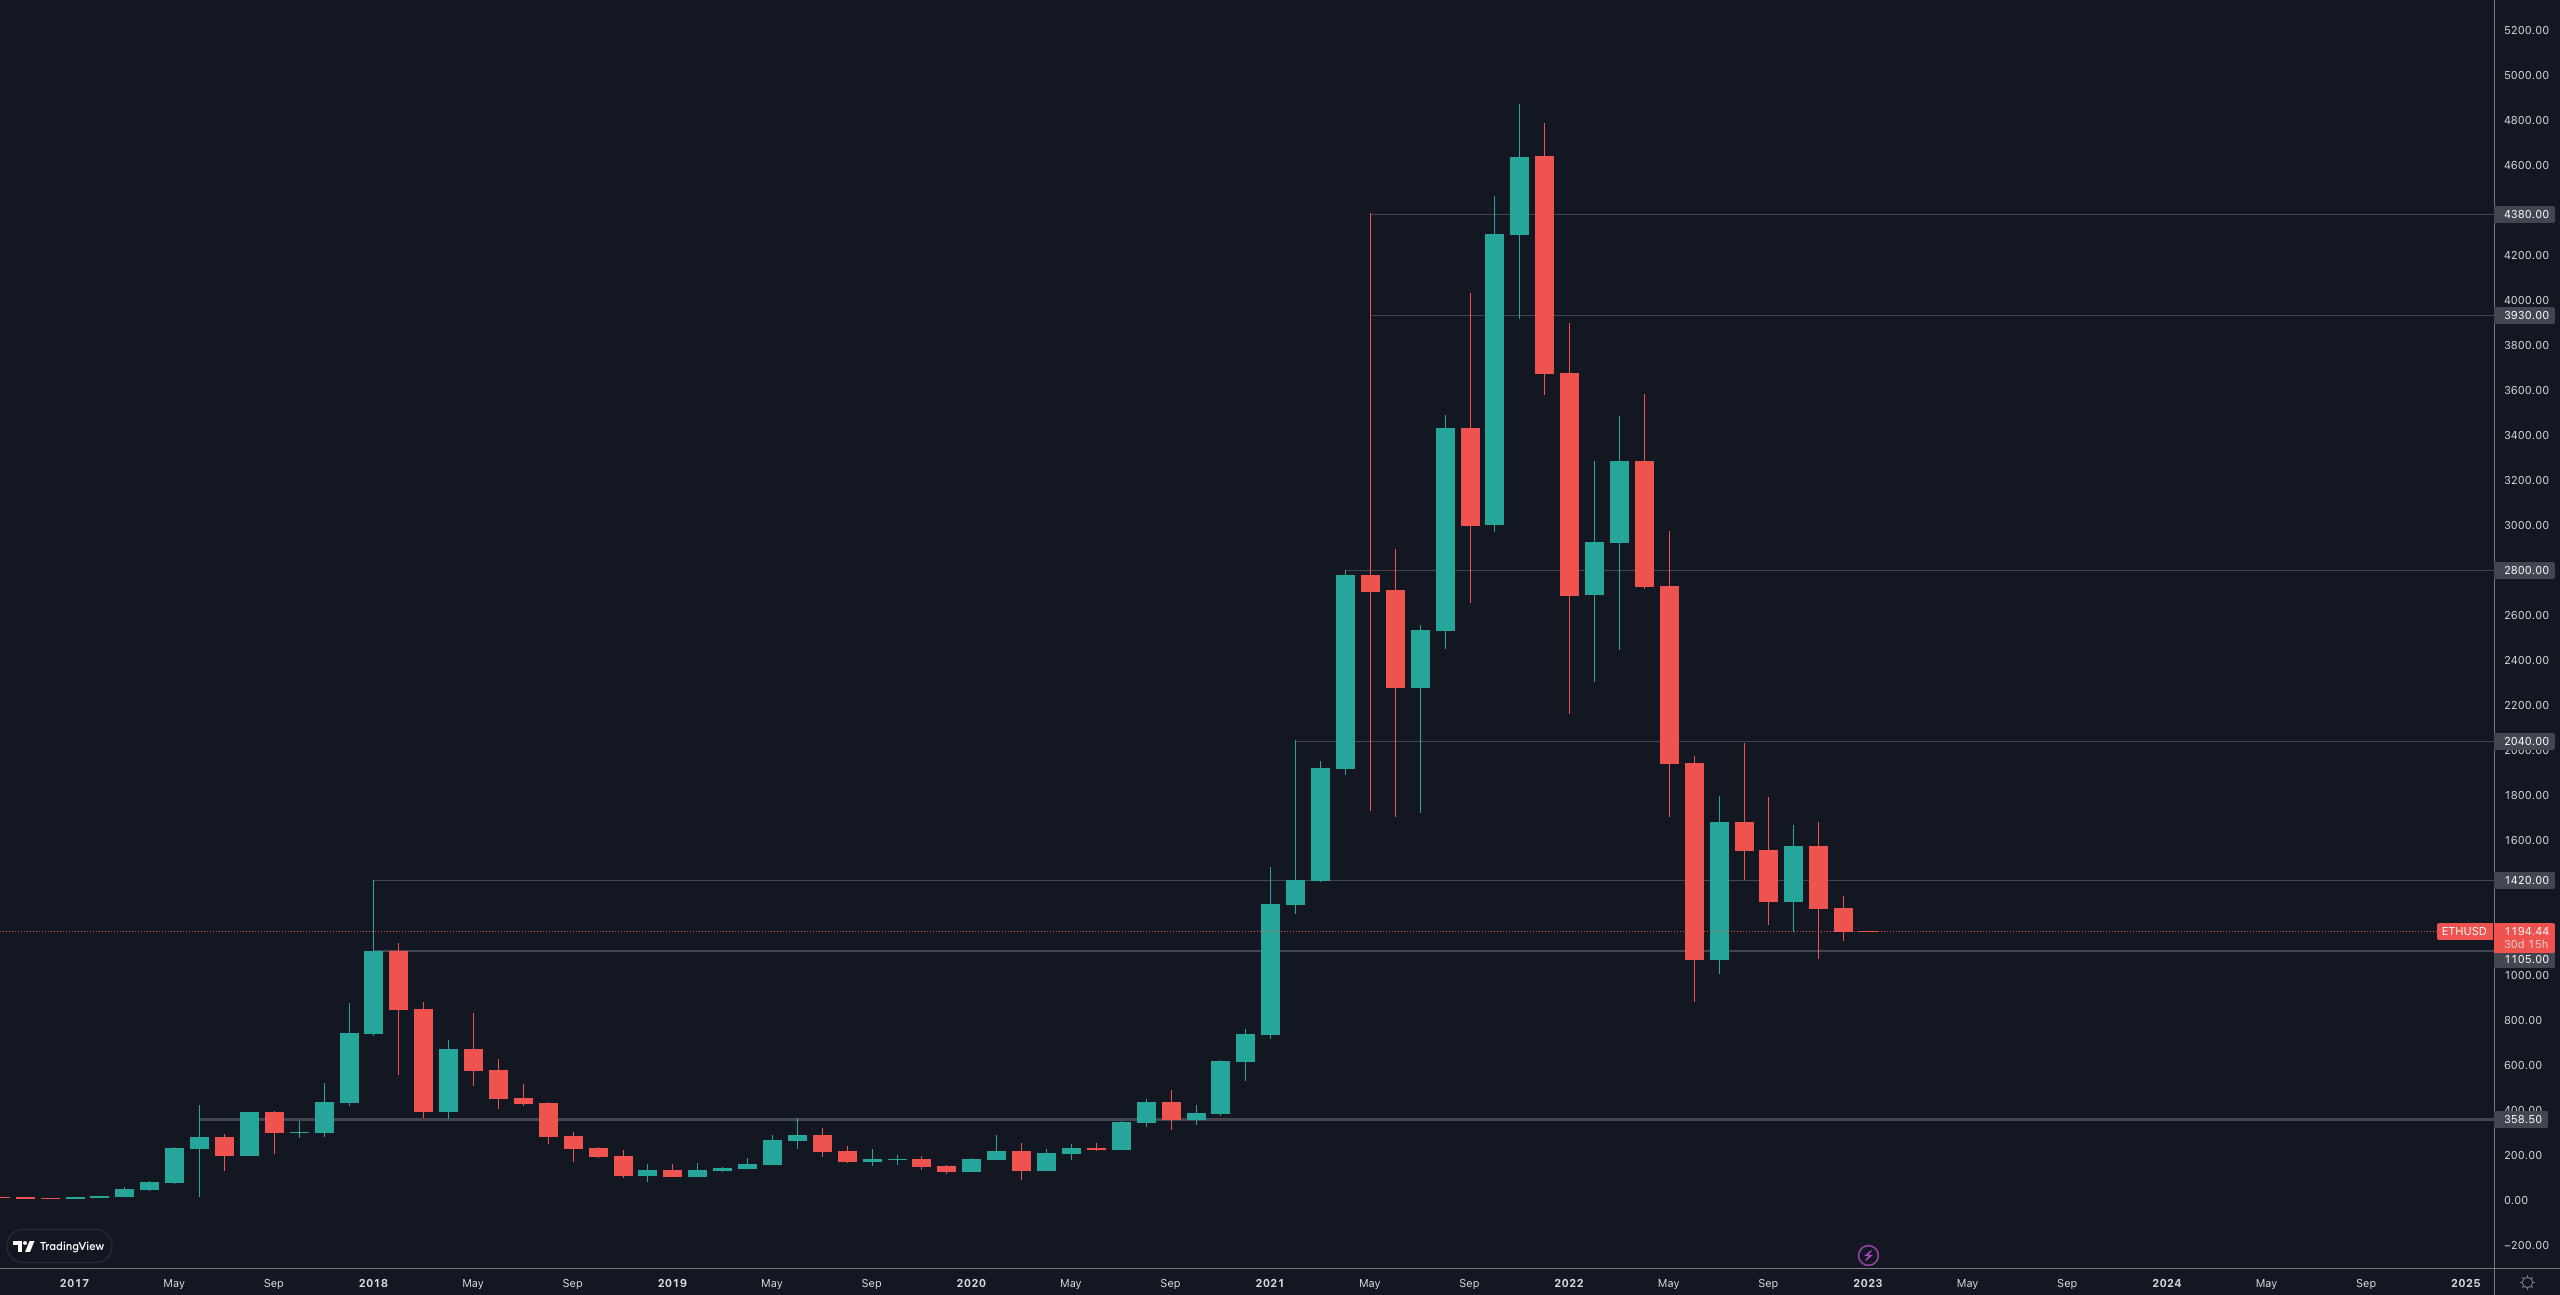
Out of all charts, ETH is the only one looking decent as it has managed to not set new lows. We reckon another test of $900-$1,000 is on the cards - in line with the indexes - but we're not going to negotiate cents for tens of dollars. We already started buying ETH.
Solana | SOL
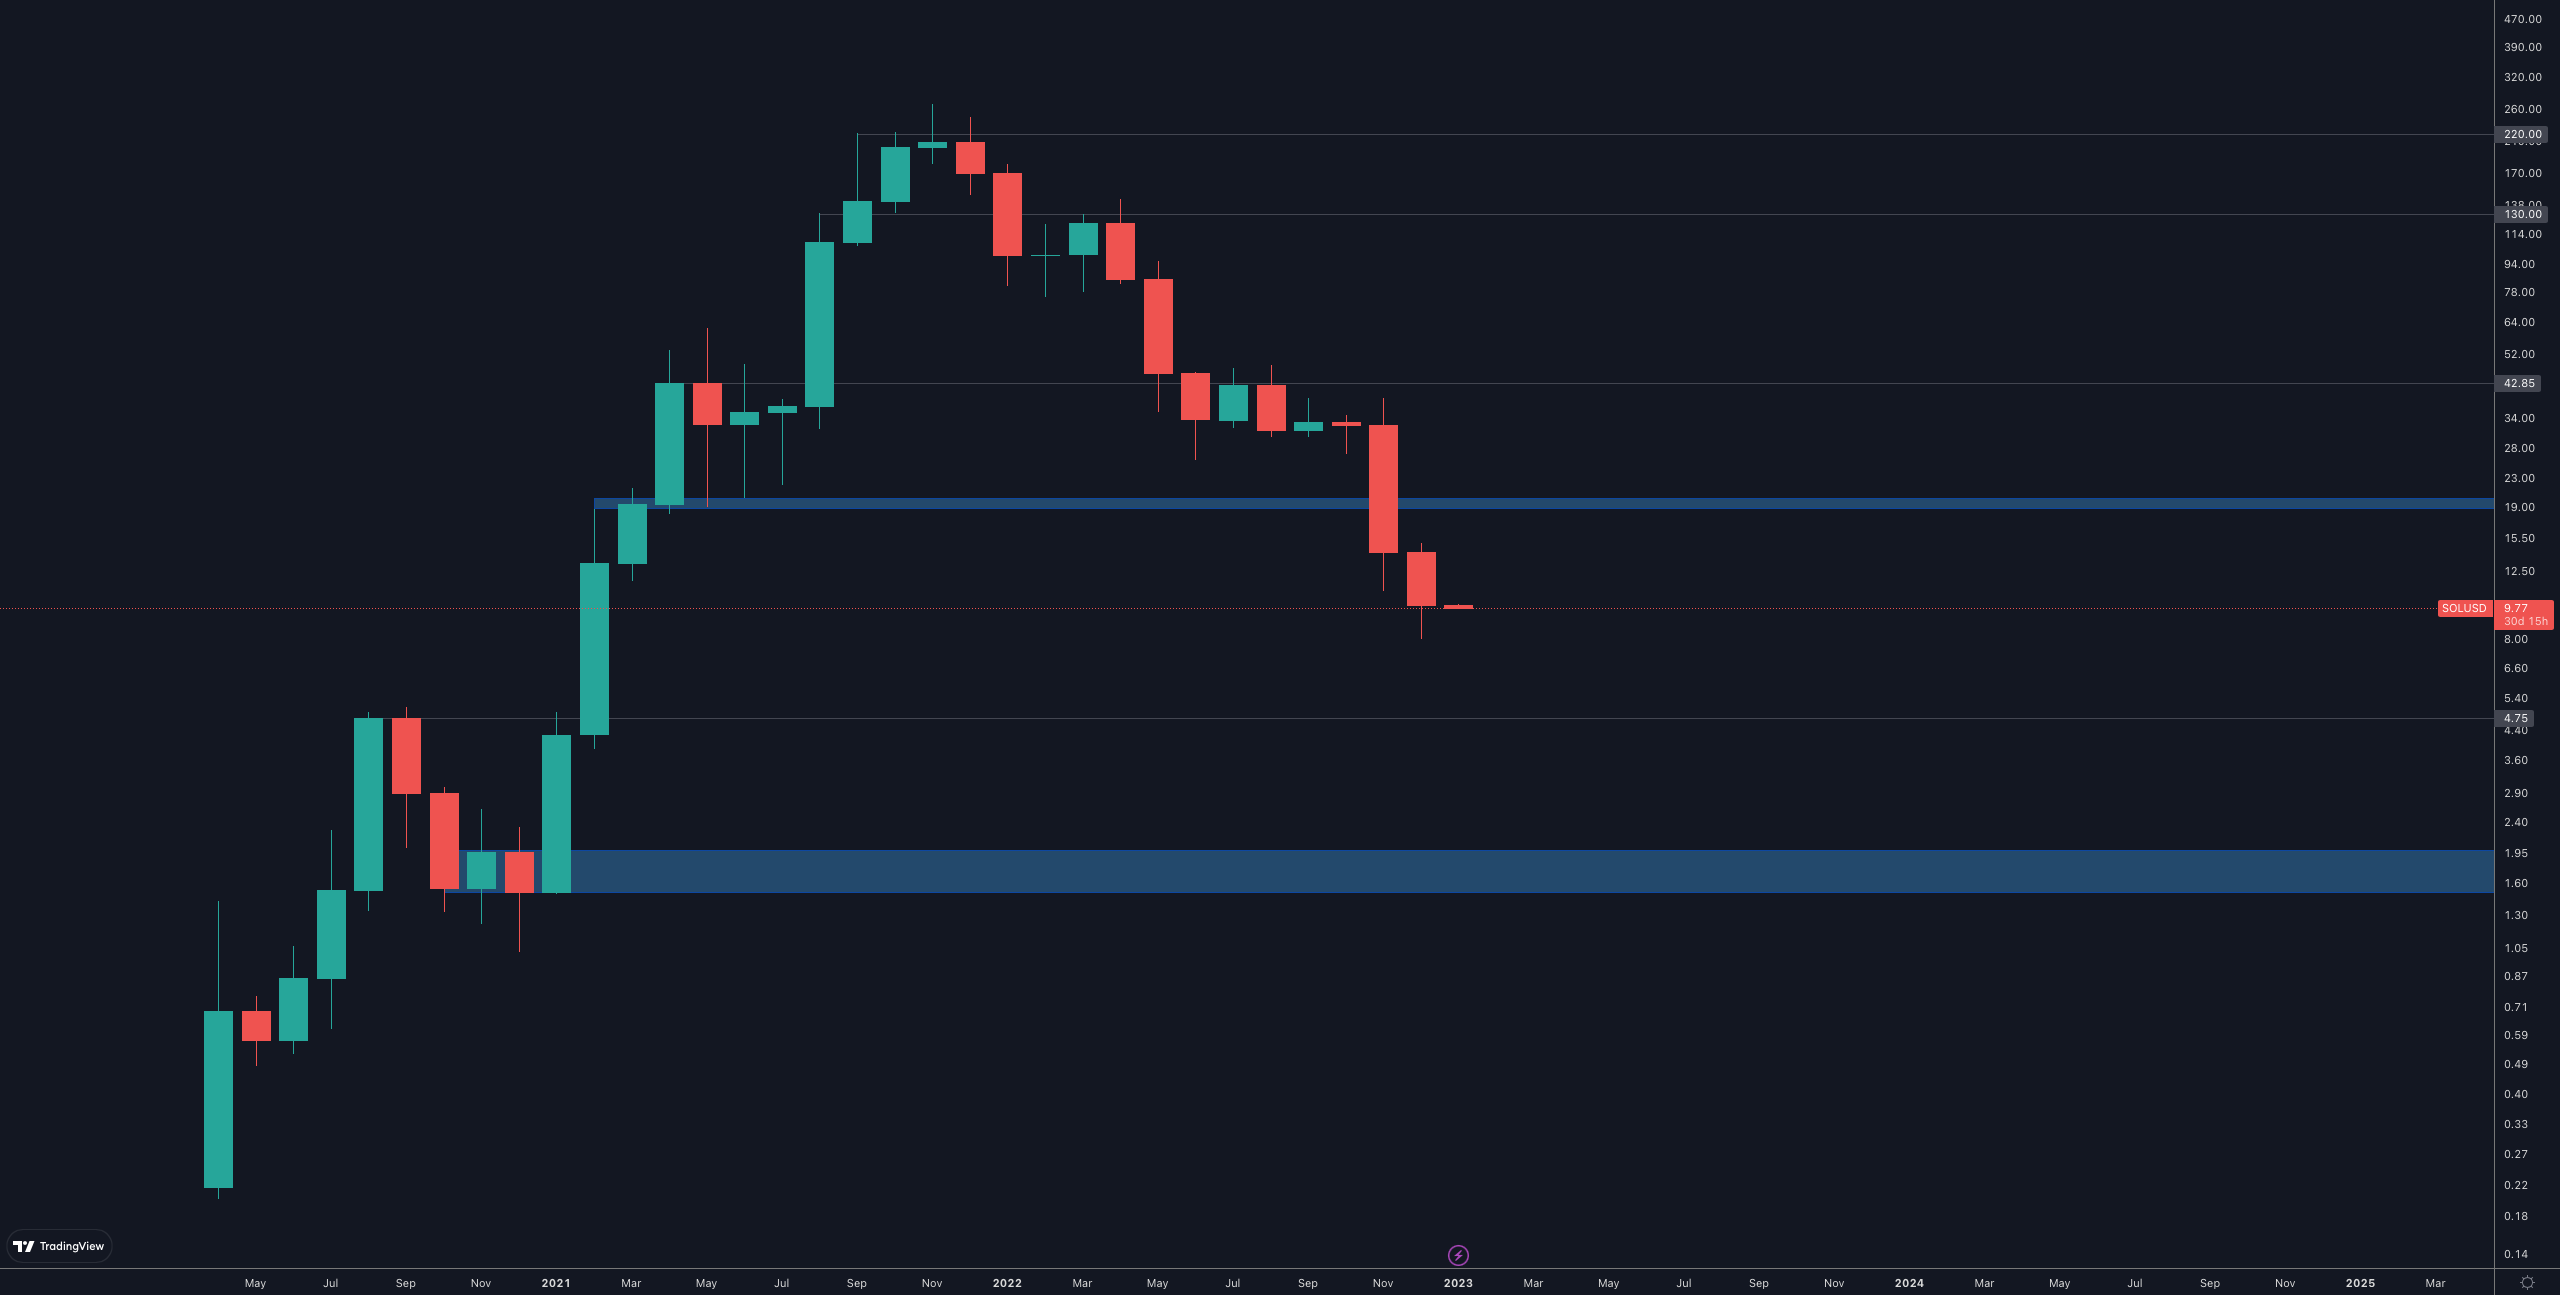
Had to use the logarithmic chart to properly showcase what's happening. SOL is one of the few assets that seems has another -50% with the next target at $4.75.
Synthetix | SNX
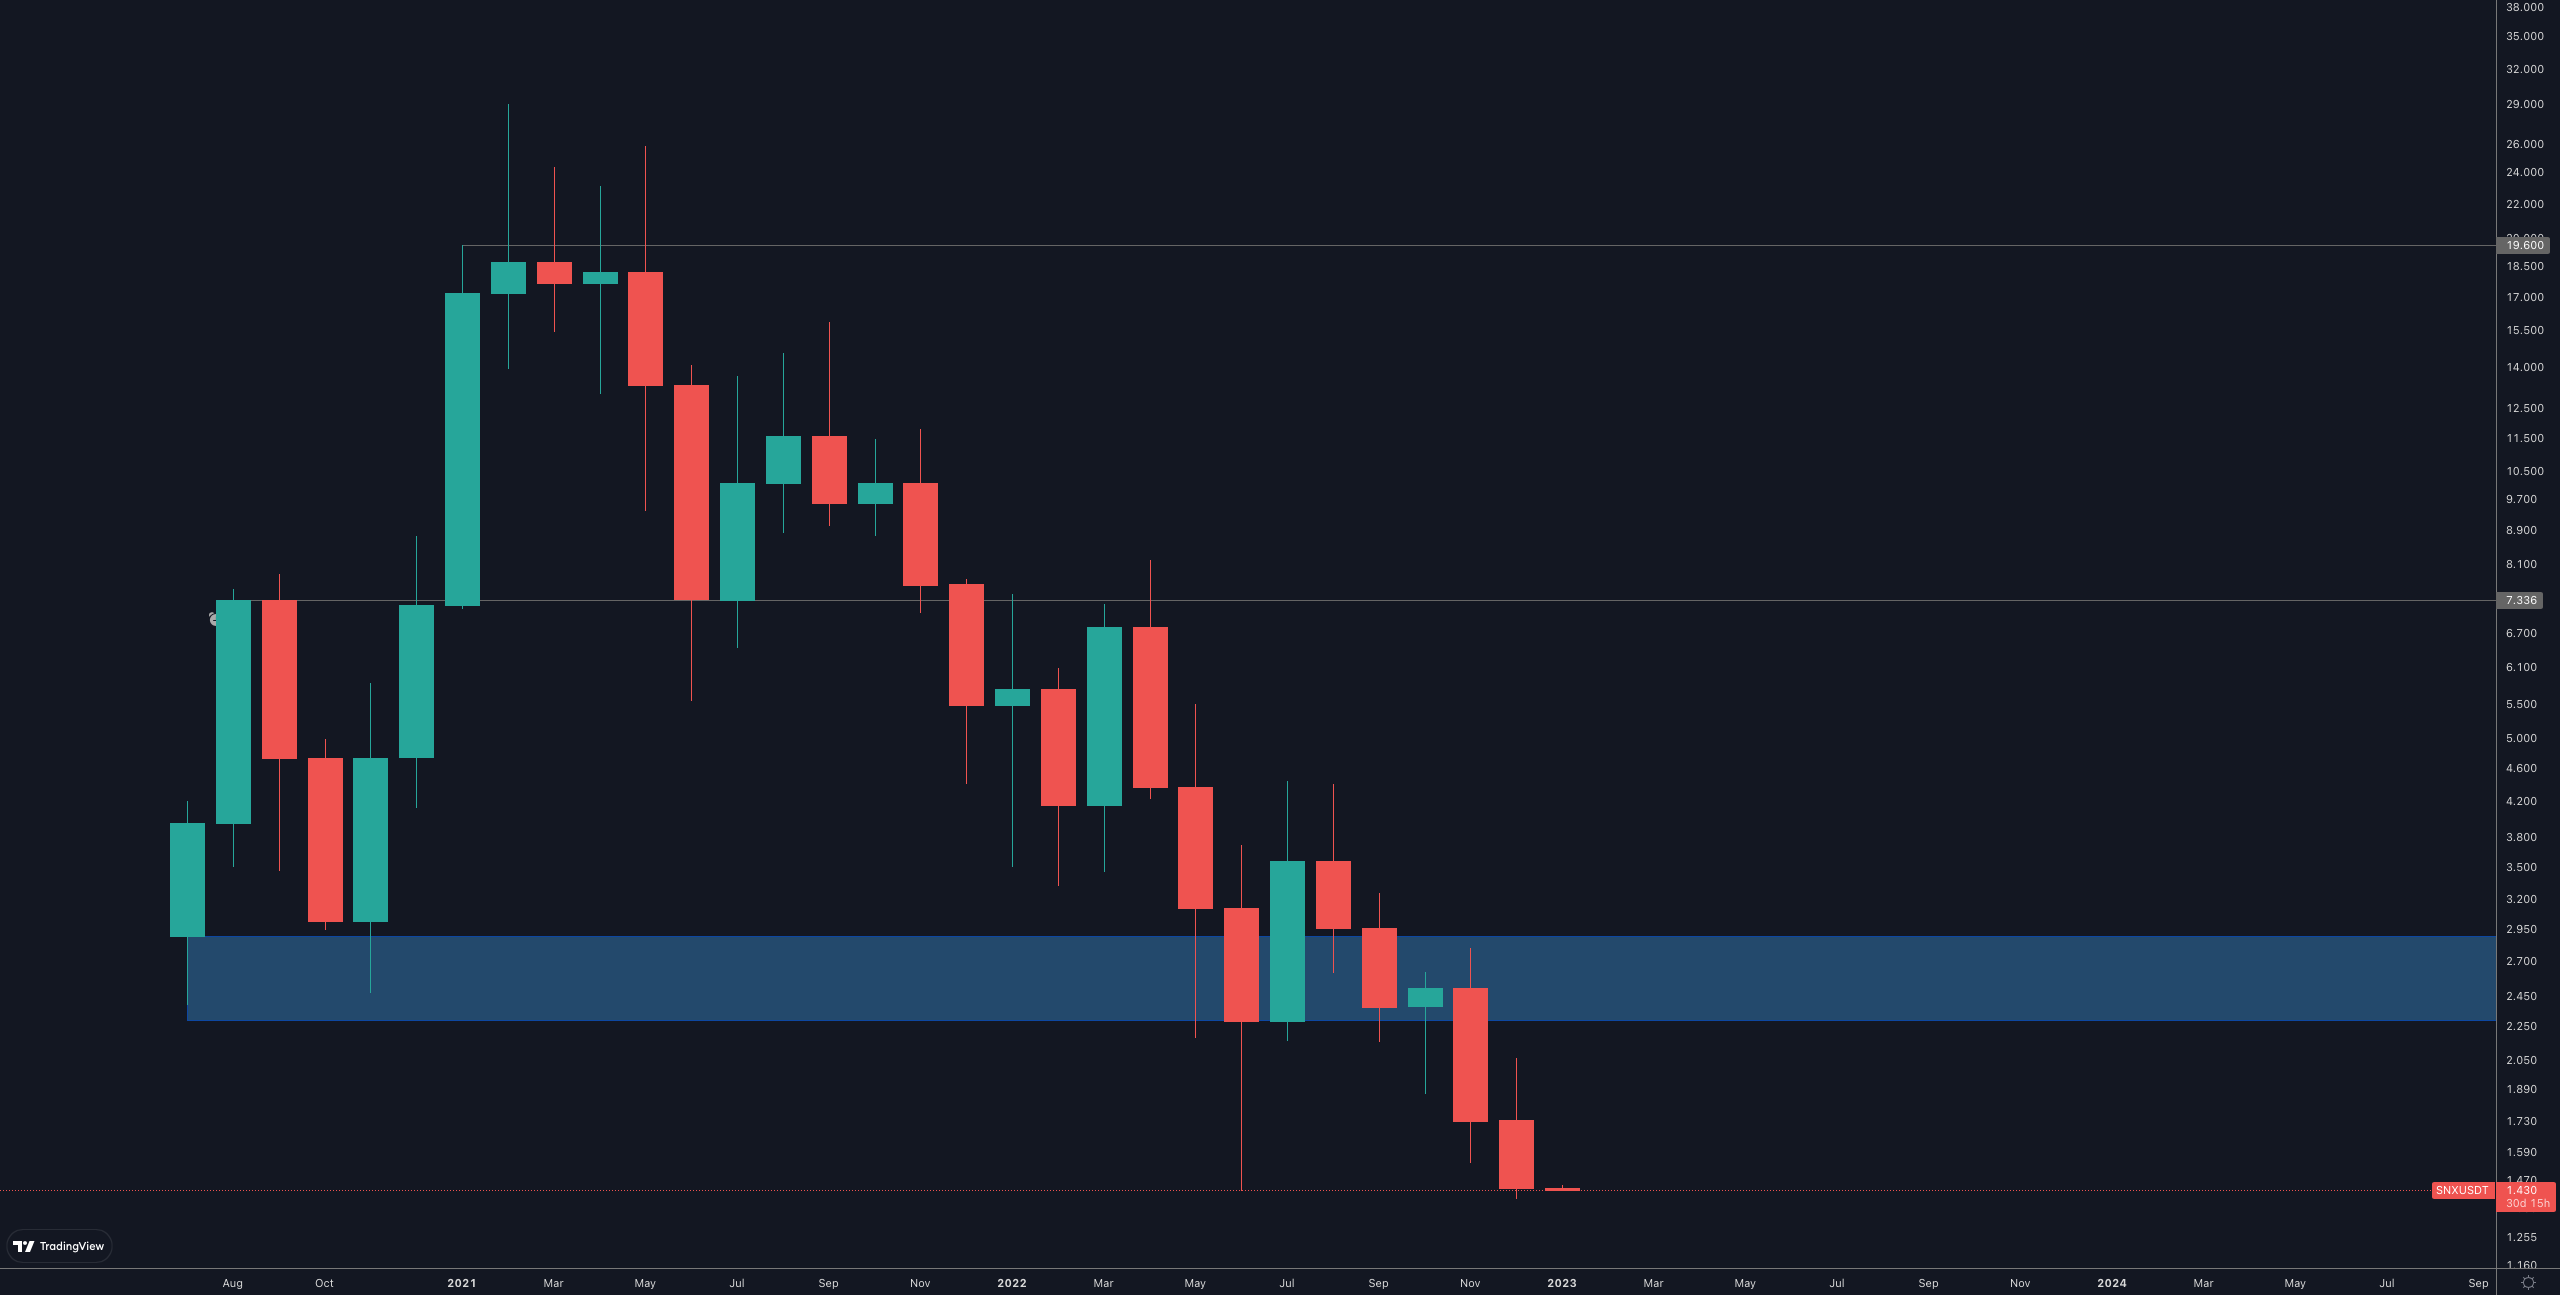
Another log chart.
SNX is in downside price discovery, we would not touch it until we see clear reversal on the indexes.
dYdX | DYDX

Another log chart.
DYDX is in downside price discovery, we would not touch it until we see clear reversal on the indexes. If we had to guess, we'd say we may see a $0.5 DYDX but there's a weekly break of $1 necessary for that to happen.
THORChain | RUNE
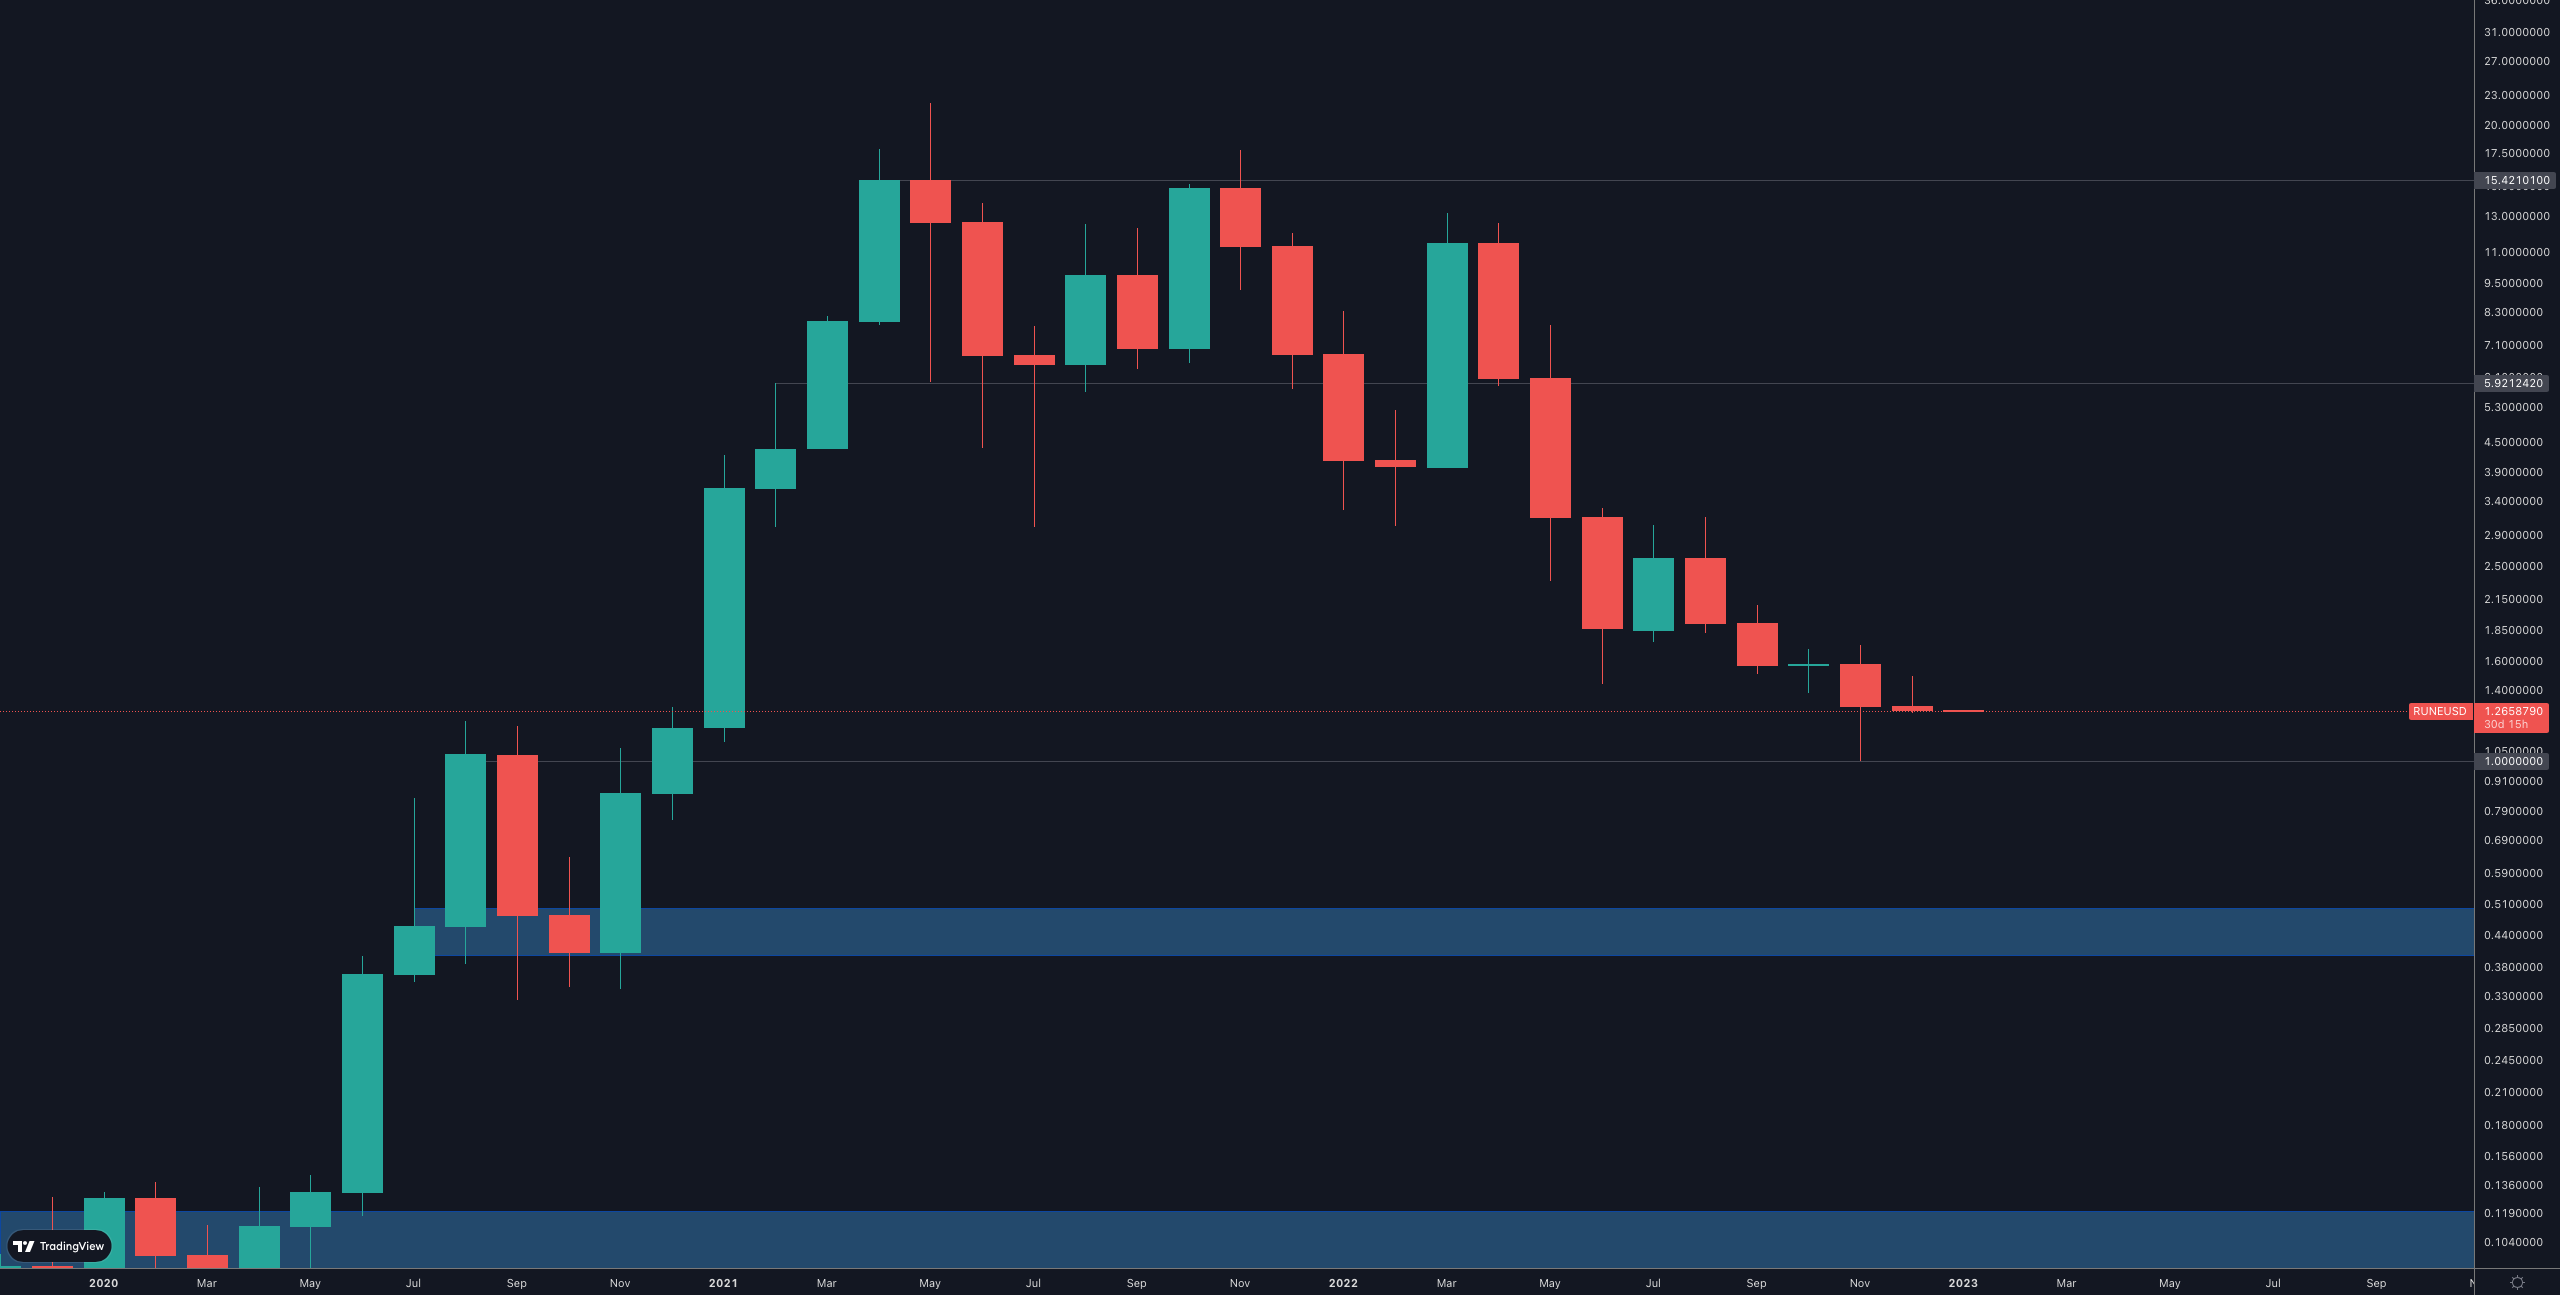
Another log chart.
RUNE has tested the previous high at $1, which thus far is holding. We wouldn't touch altcoins overall (in large buying) until we see a reversal from the indexes. In our opinion, RUNE may undershoot towards $0.80 but $1 will hold on the monthly timeframe.
Synapse | SYN
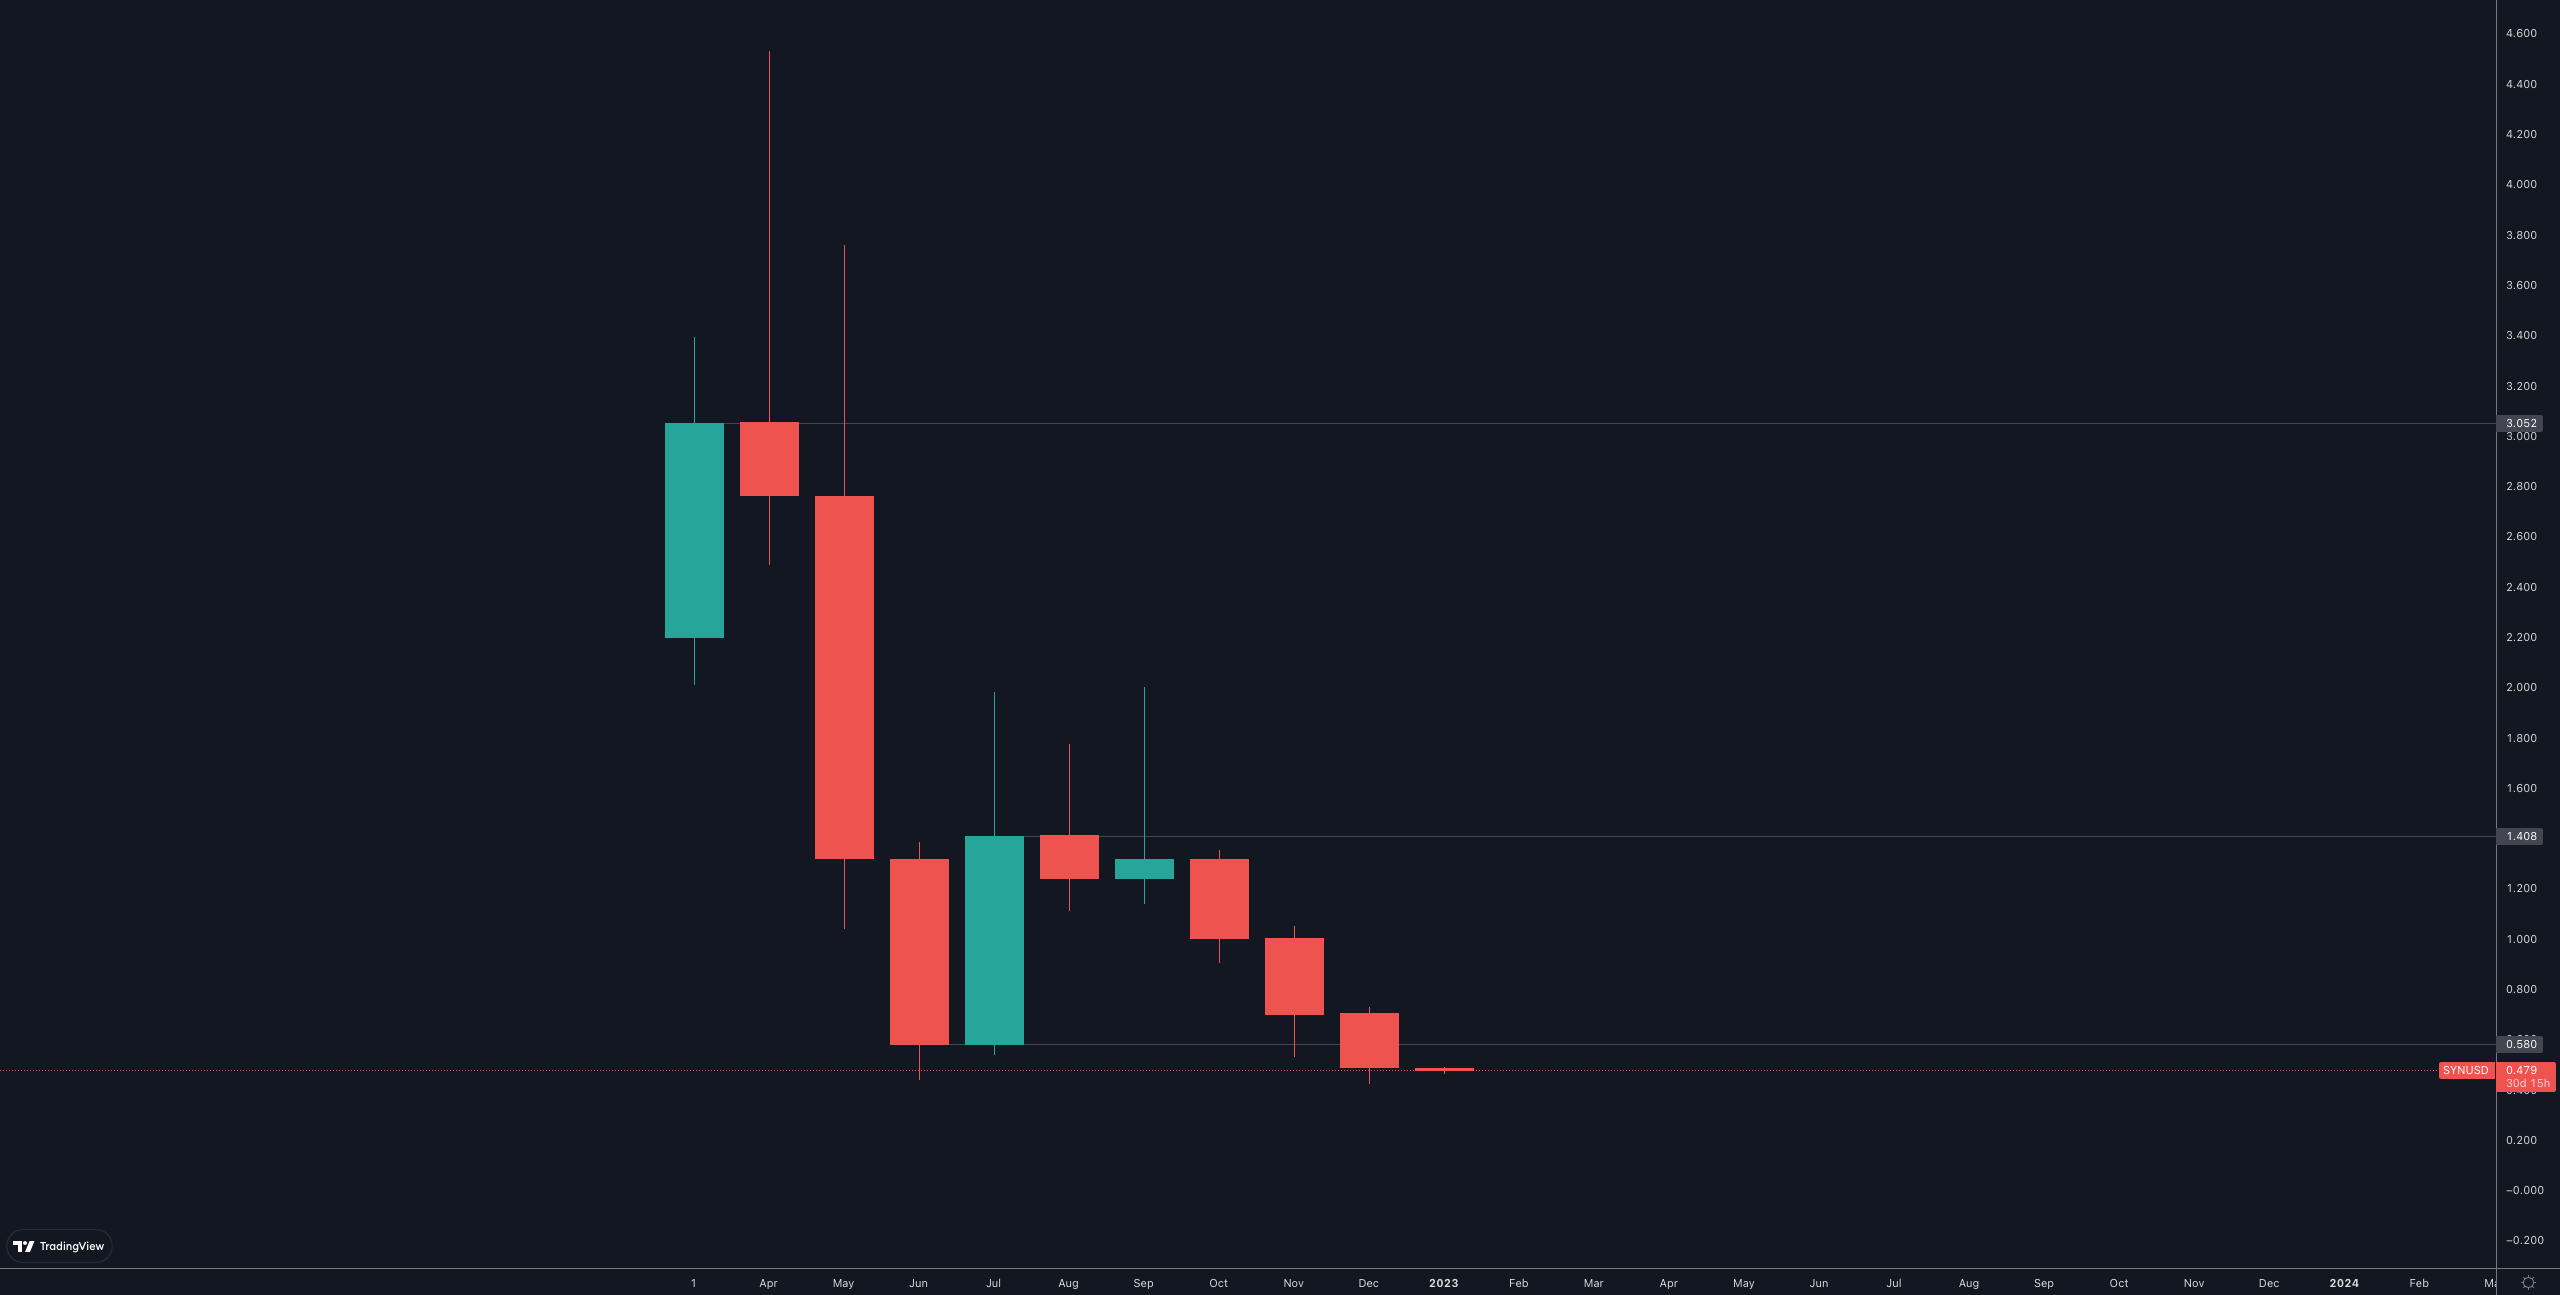
Another log chart.
SYN is in downside price discovery, we would not touch it until we see clear reversal on the indexes. We are yet to see the same break happen on the weekly timeframe, however it seems very plausible that it does.
A reclaim of $0.58 invalidates the downside scenario.
Recommended from Cryptonary


