Save 23% ($351) & Get a Free 1-1 Call with our Team ⏰ : 0d 2h 59m 44s

- Total Market Cap: -6.61%
- Altcoins' Market Cap: -6.39%
Now let's delve into a technical analysis on the monthly timeframe, starting with the indexes.
Total Market Cap
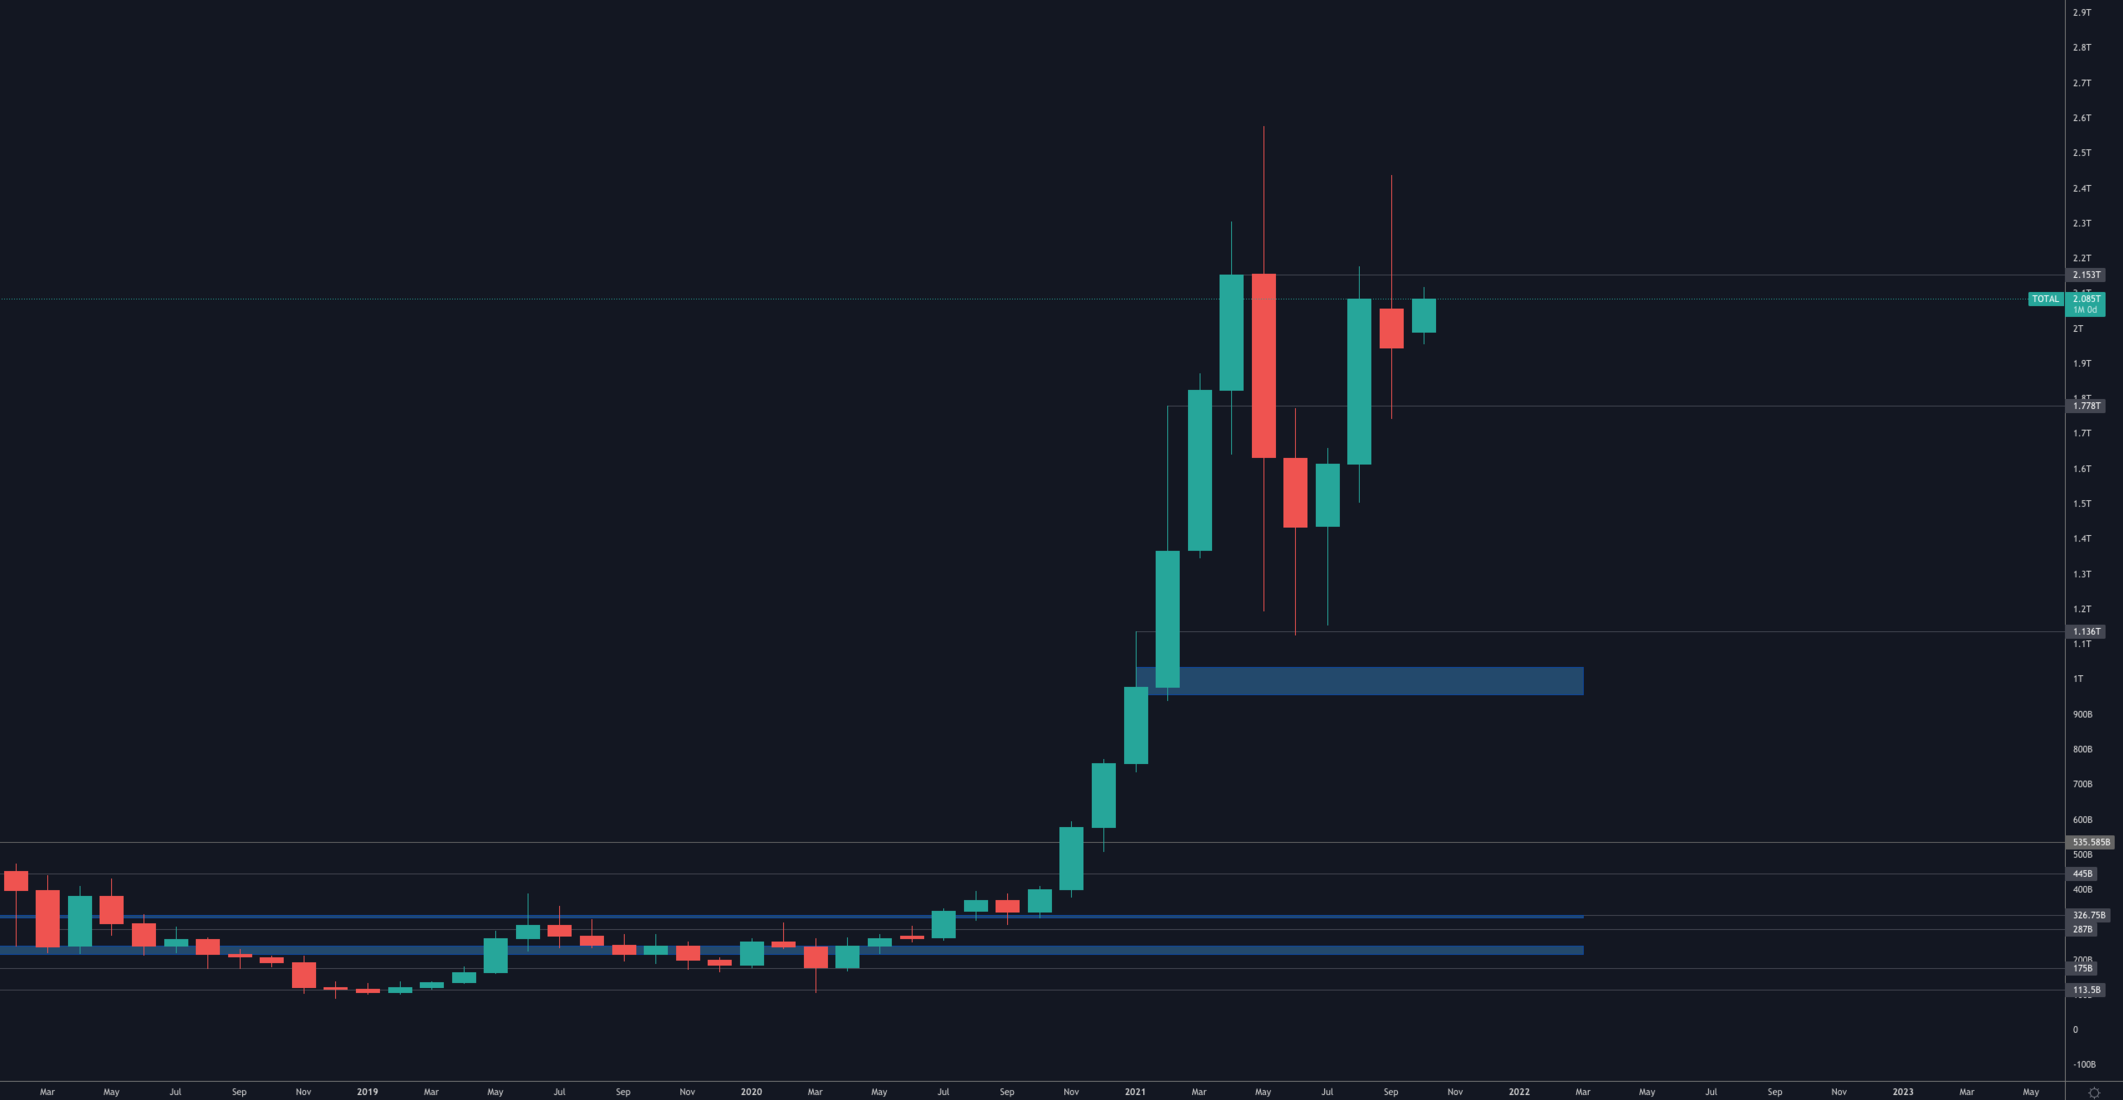
The Total MCap has a monthly resistance at $2.15T, the pattern that seems to be emerging is a cup & handle. What we need to see is a breakout from $2.15T for further price exploration.
Altcoins' Market Cap
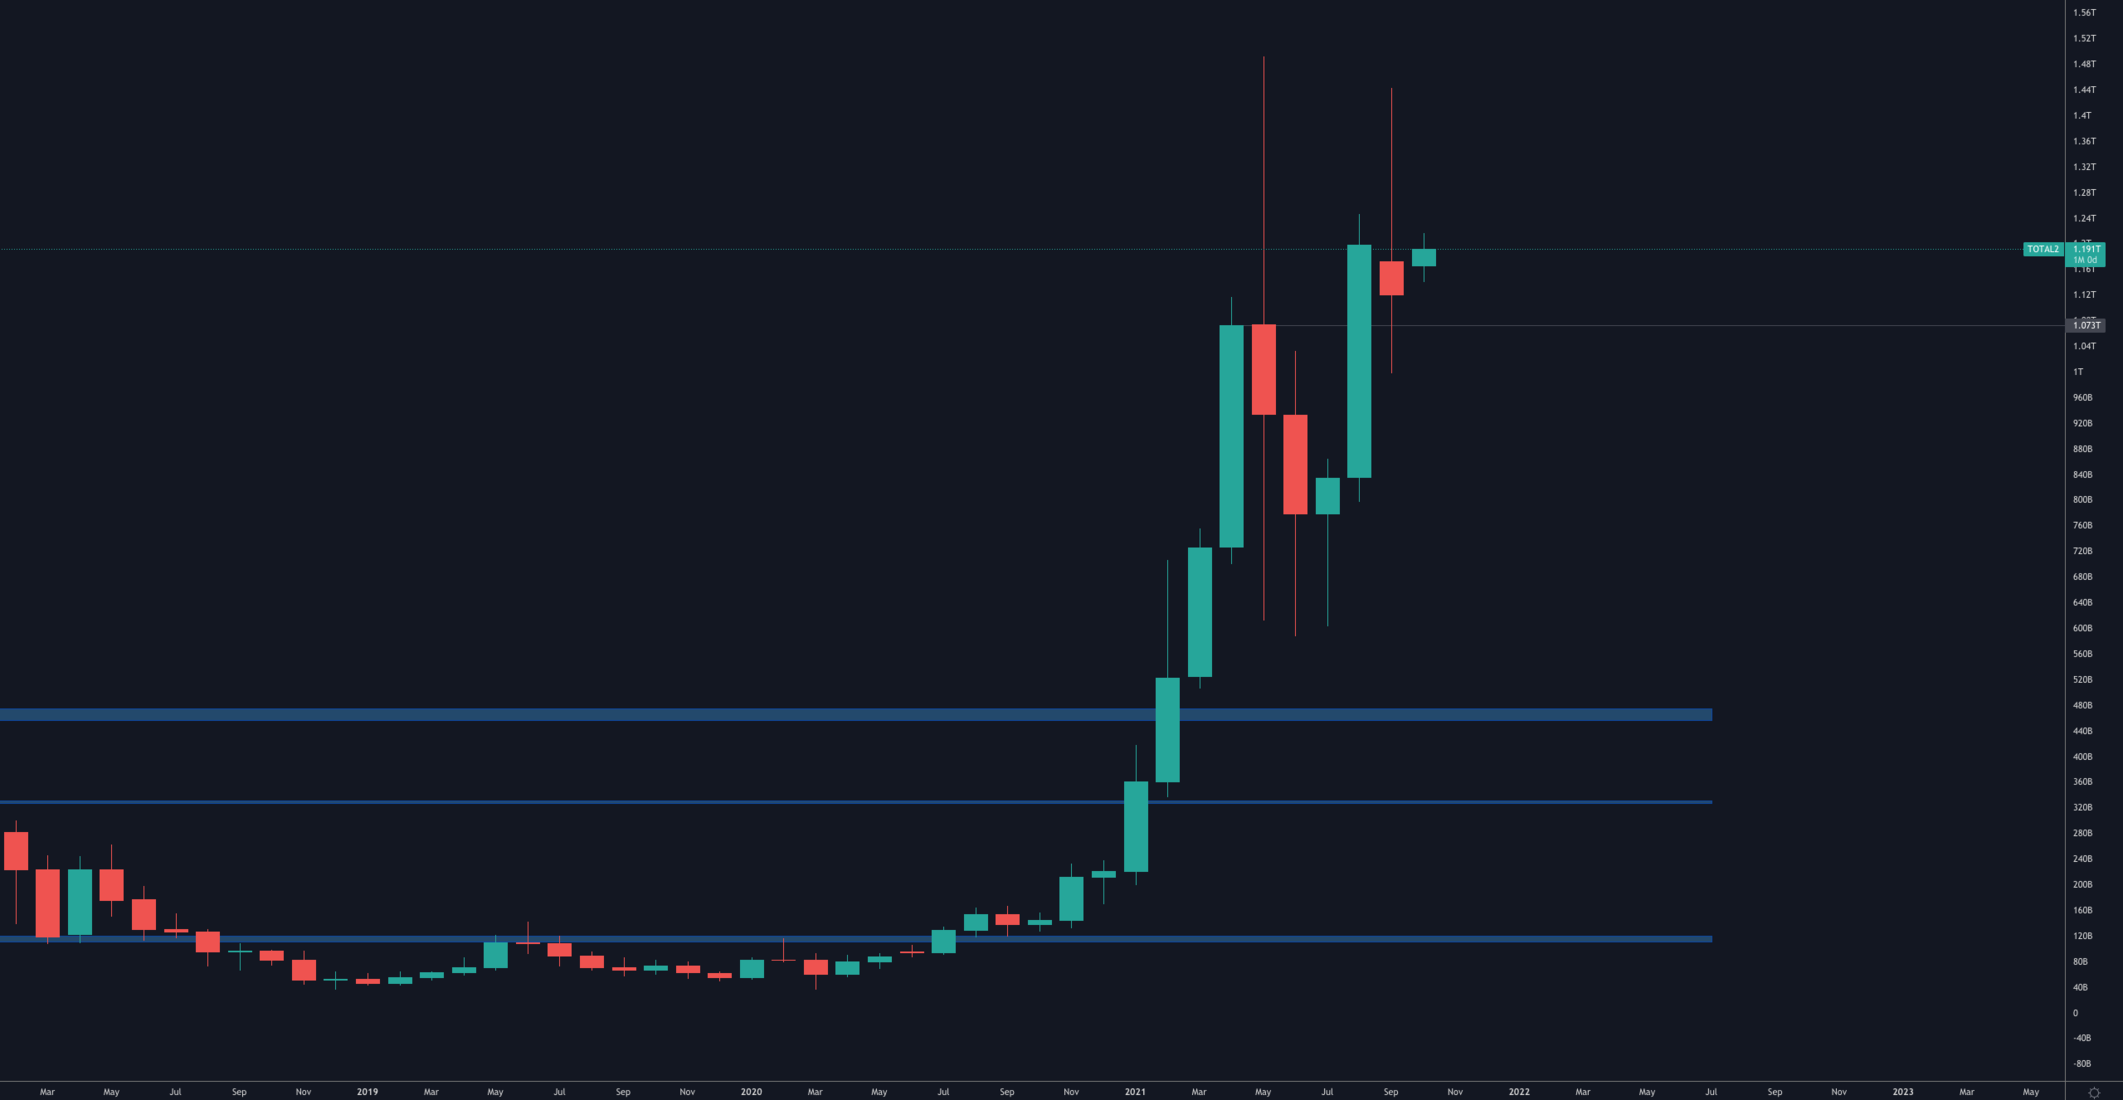
The Alts MCap performed better with respect of the latest resistance turned support at $1T, the bullish market structure remains intact.
Bitcoin
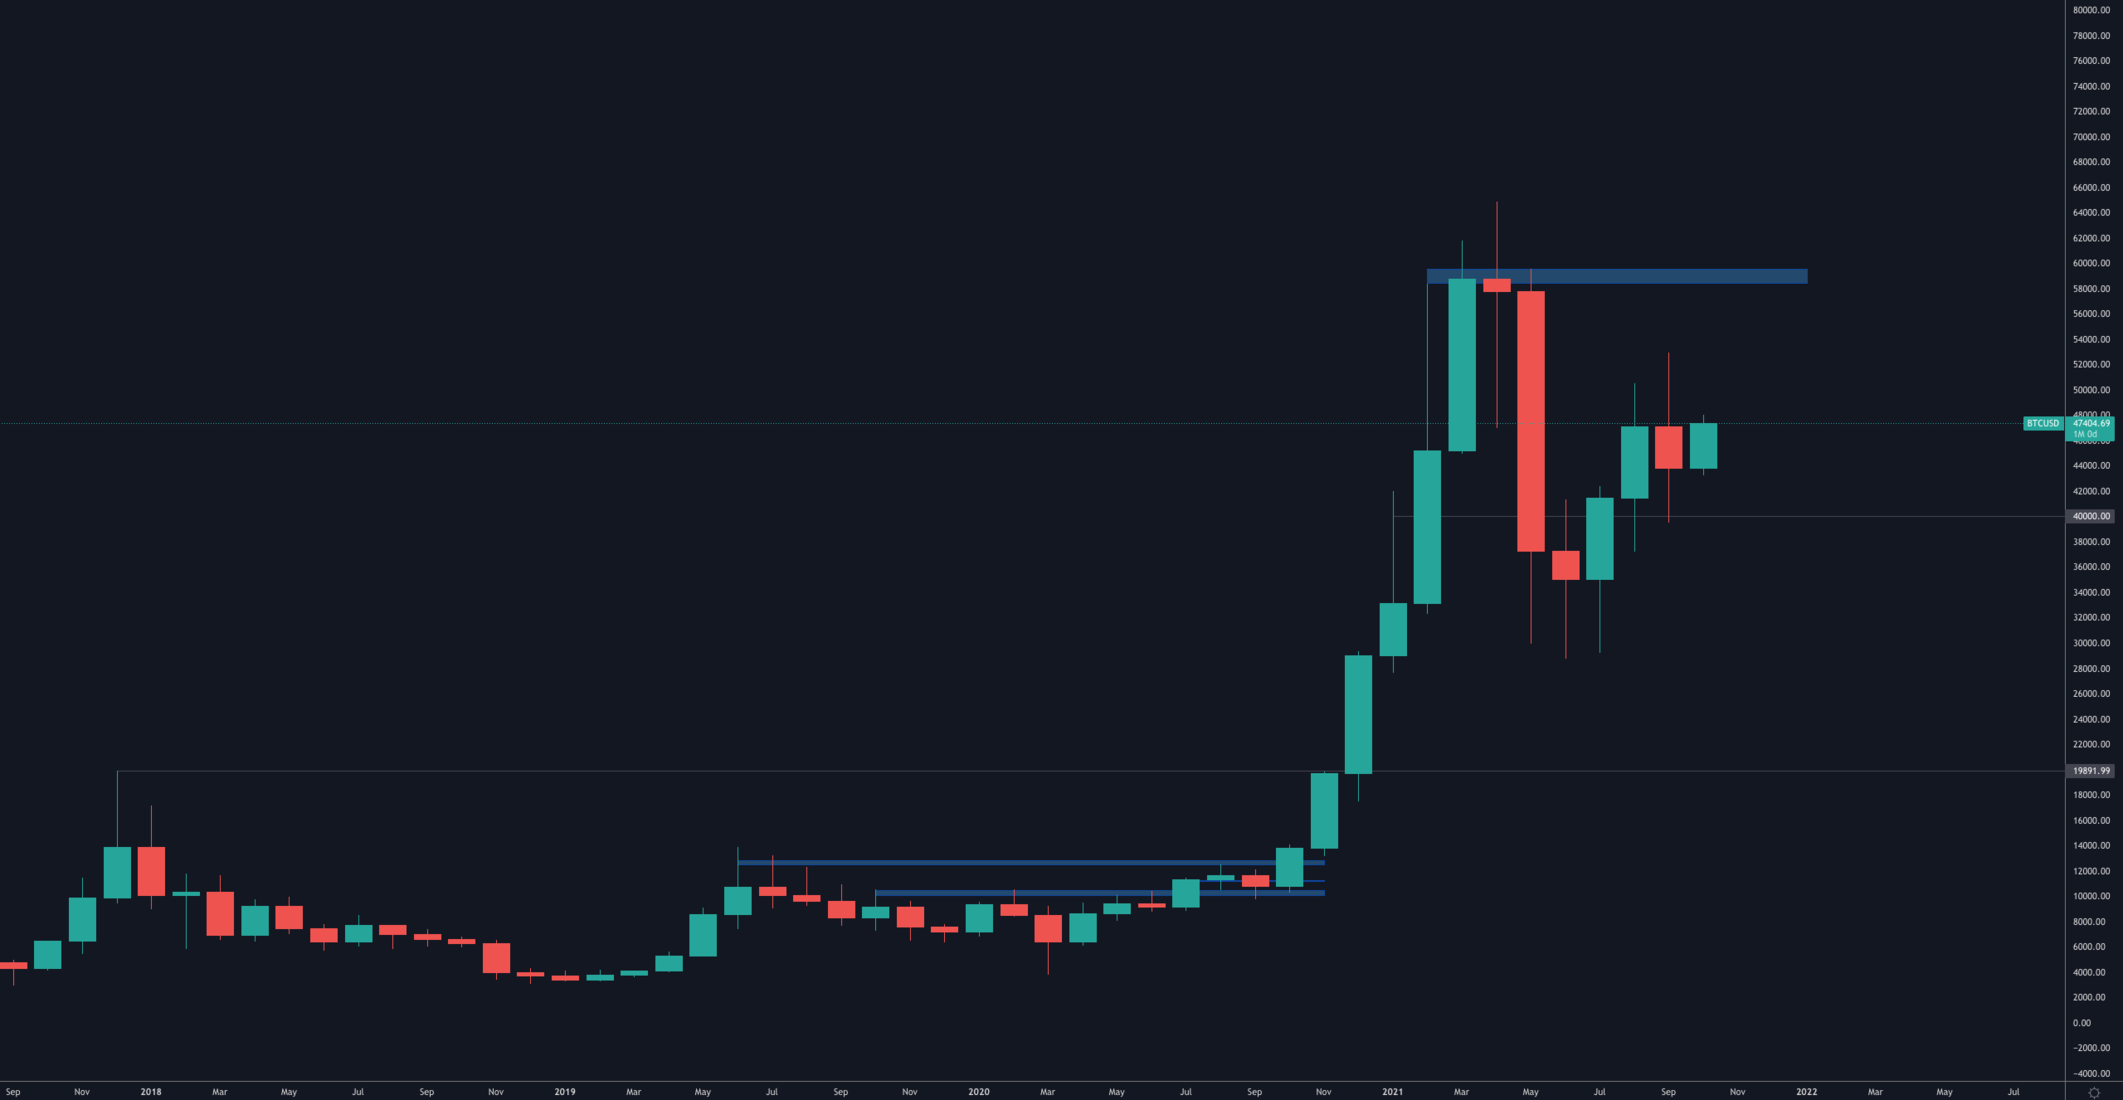
The emergence of $40,000 on the monthly timeframe as a key level has become much clearer and all September did was retest it for support. The next area of interest for Bitcoin is near $57,000.
Ether
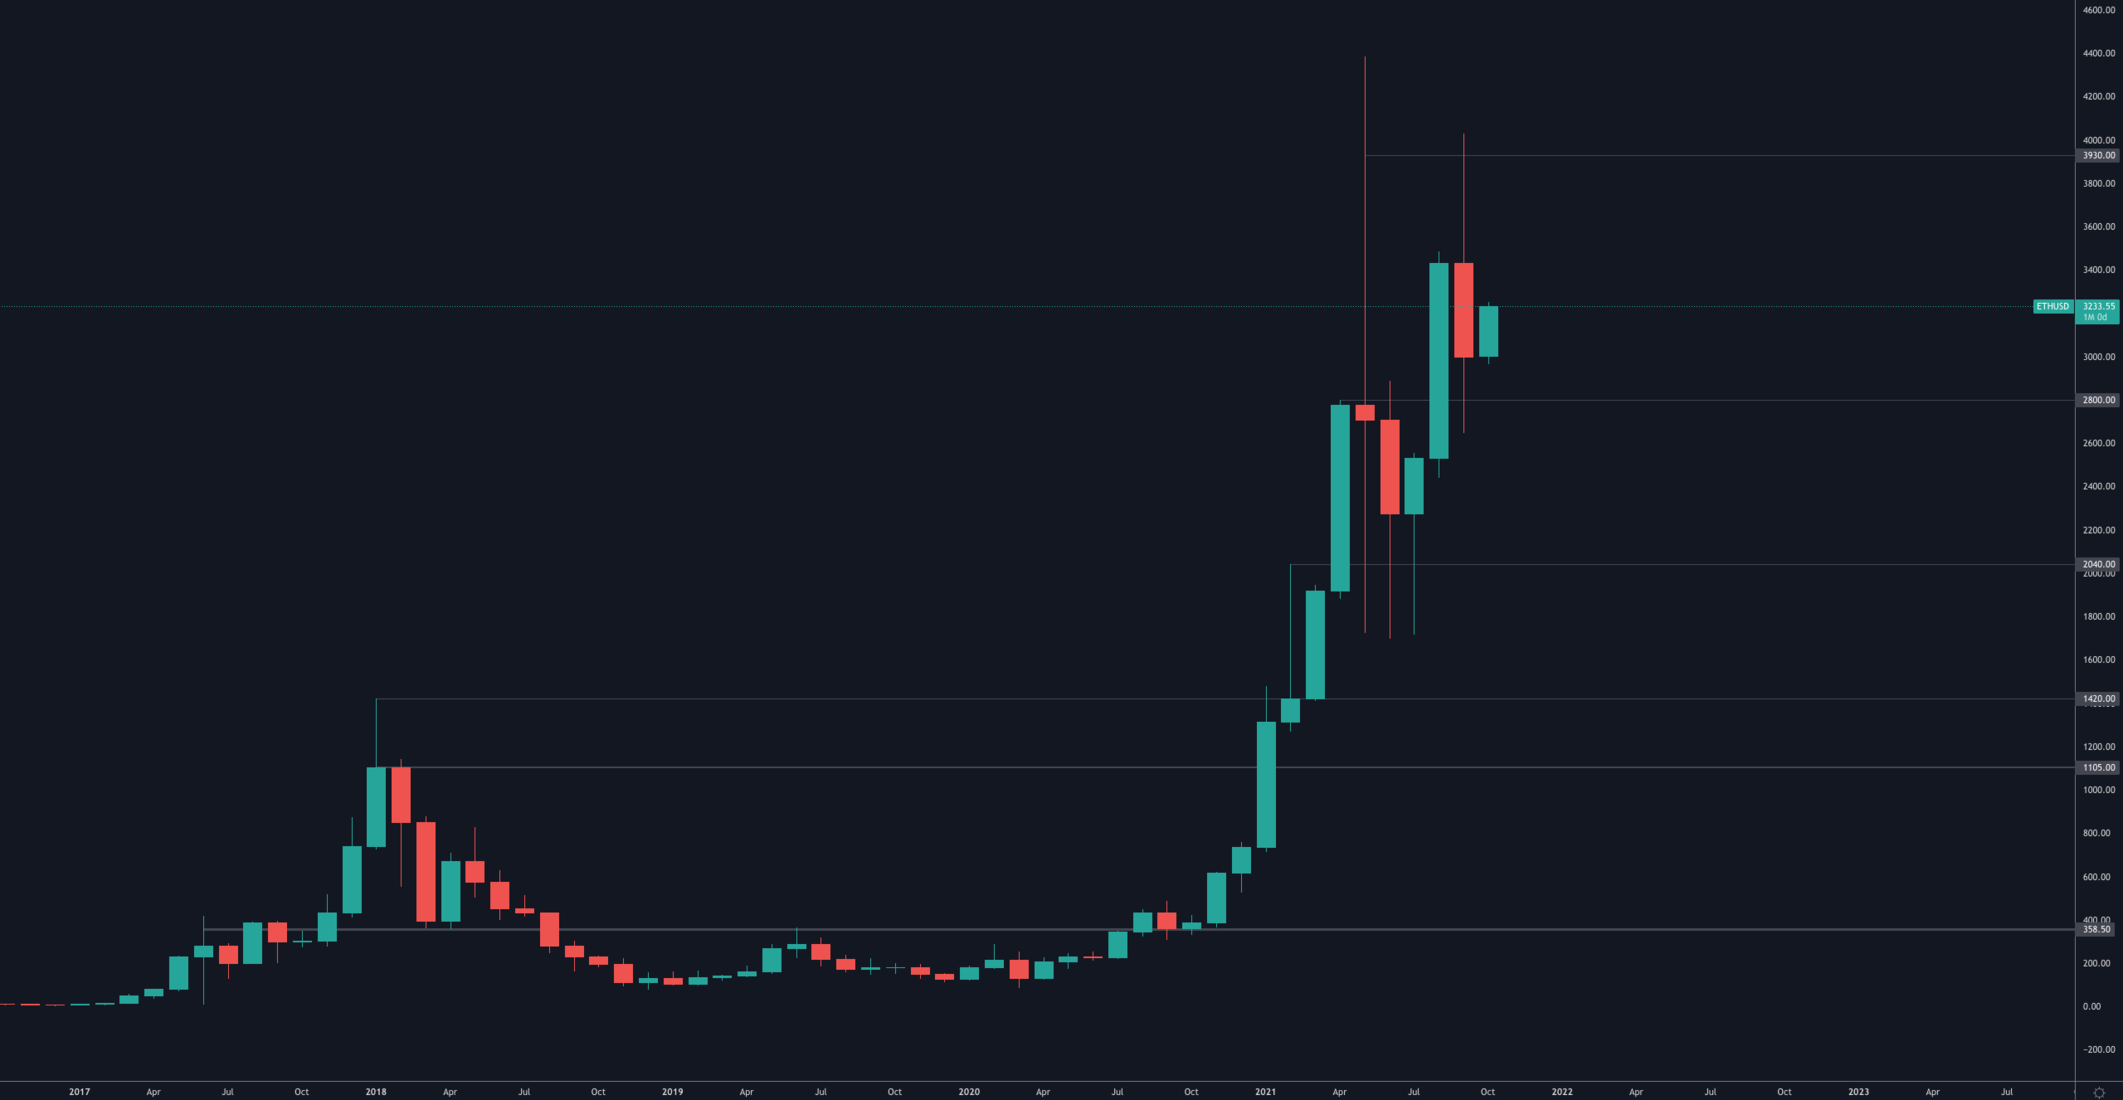
Another chart that is continuously created higher highs and higher lows, this is what denominates a bullish market structure and exactly what anyone bullish on ETH would want to see.
DOT
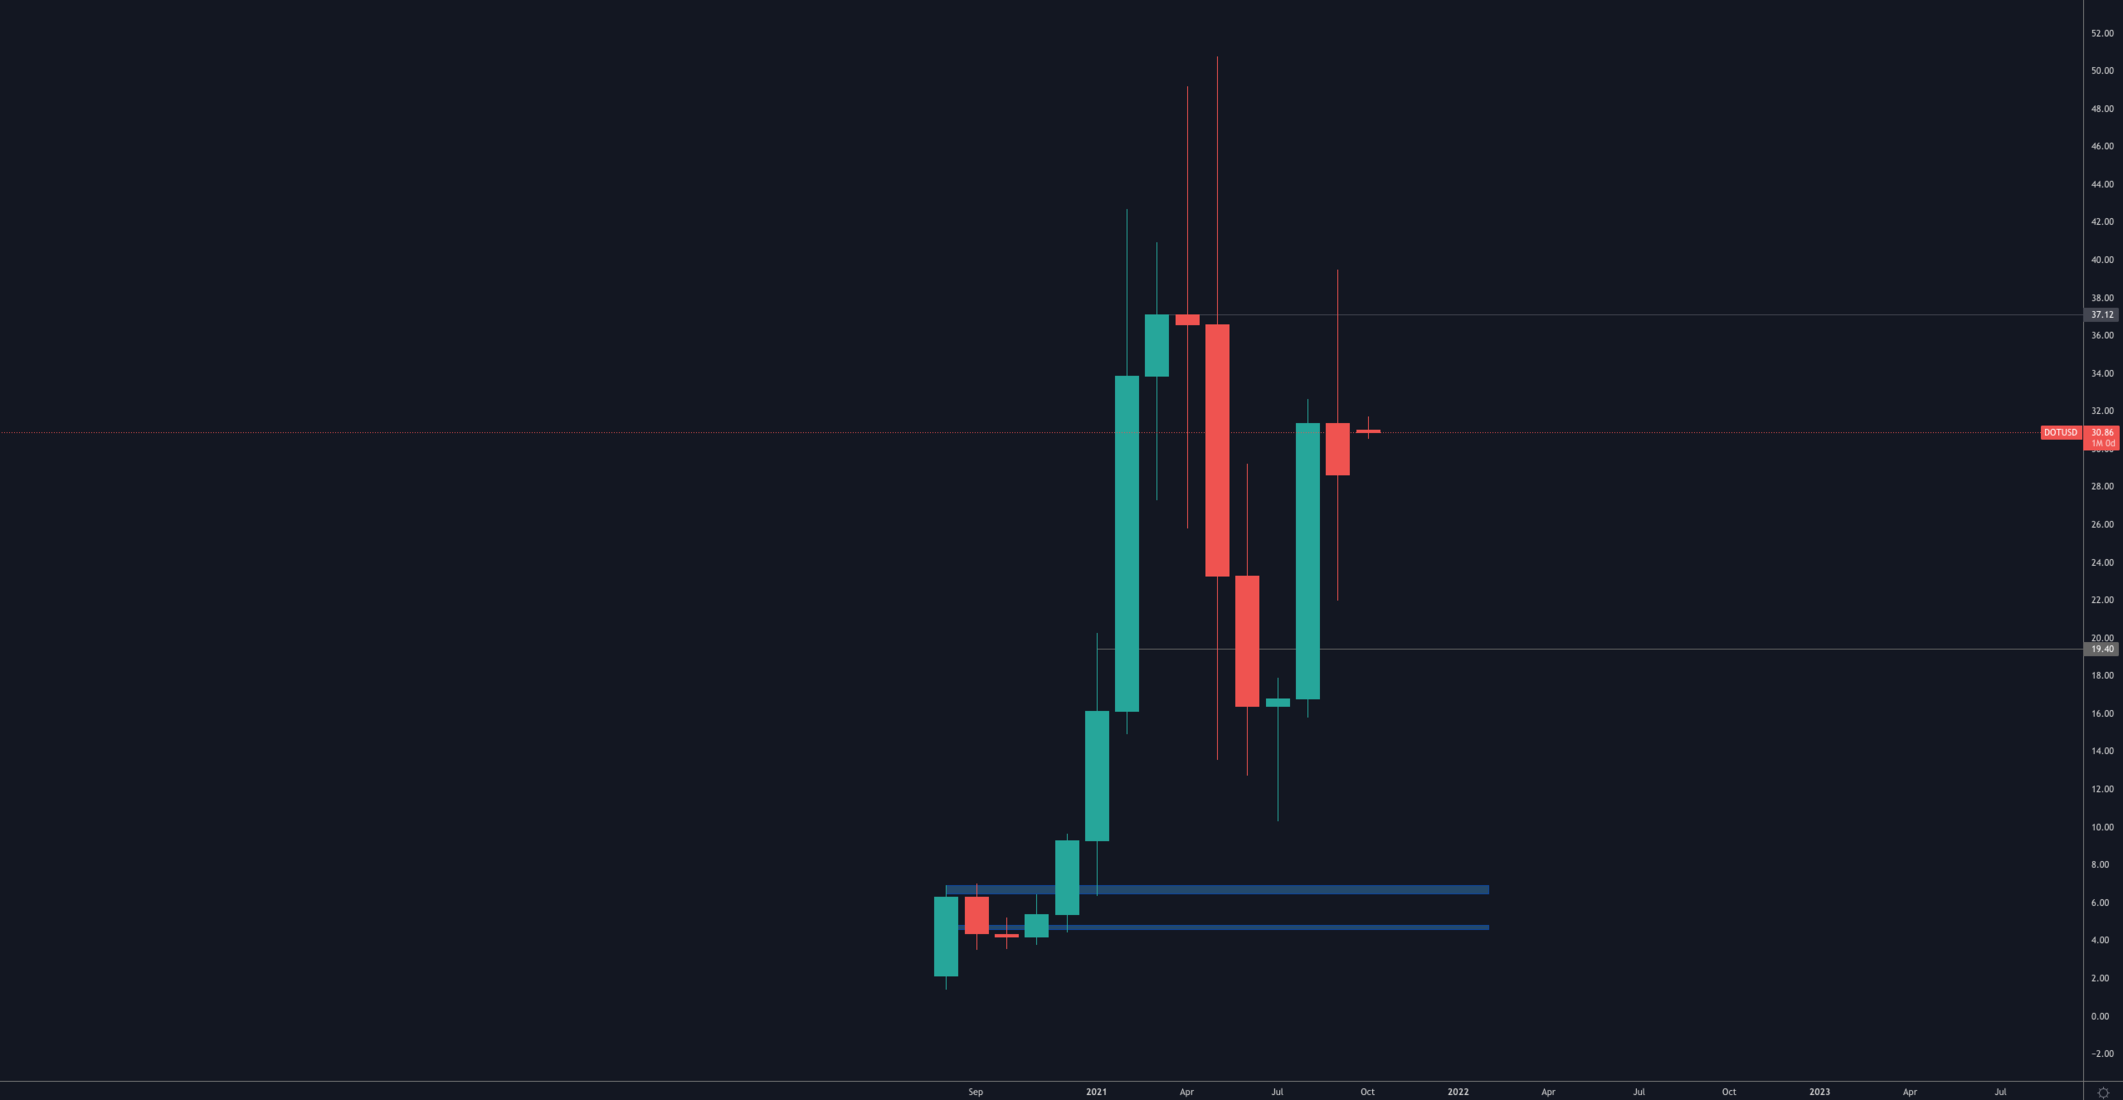
DOT had a stable month. We did see price fail to breach $37 which was the monthly high set in April 2021. This is close to what we are awaiting to see on the daily timeframe and that is a break of $40.
SNX
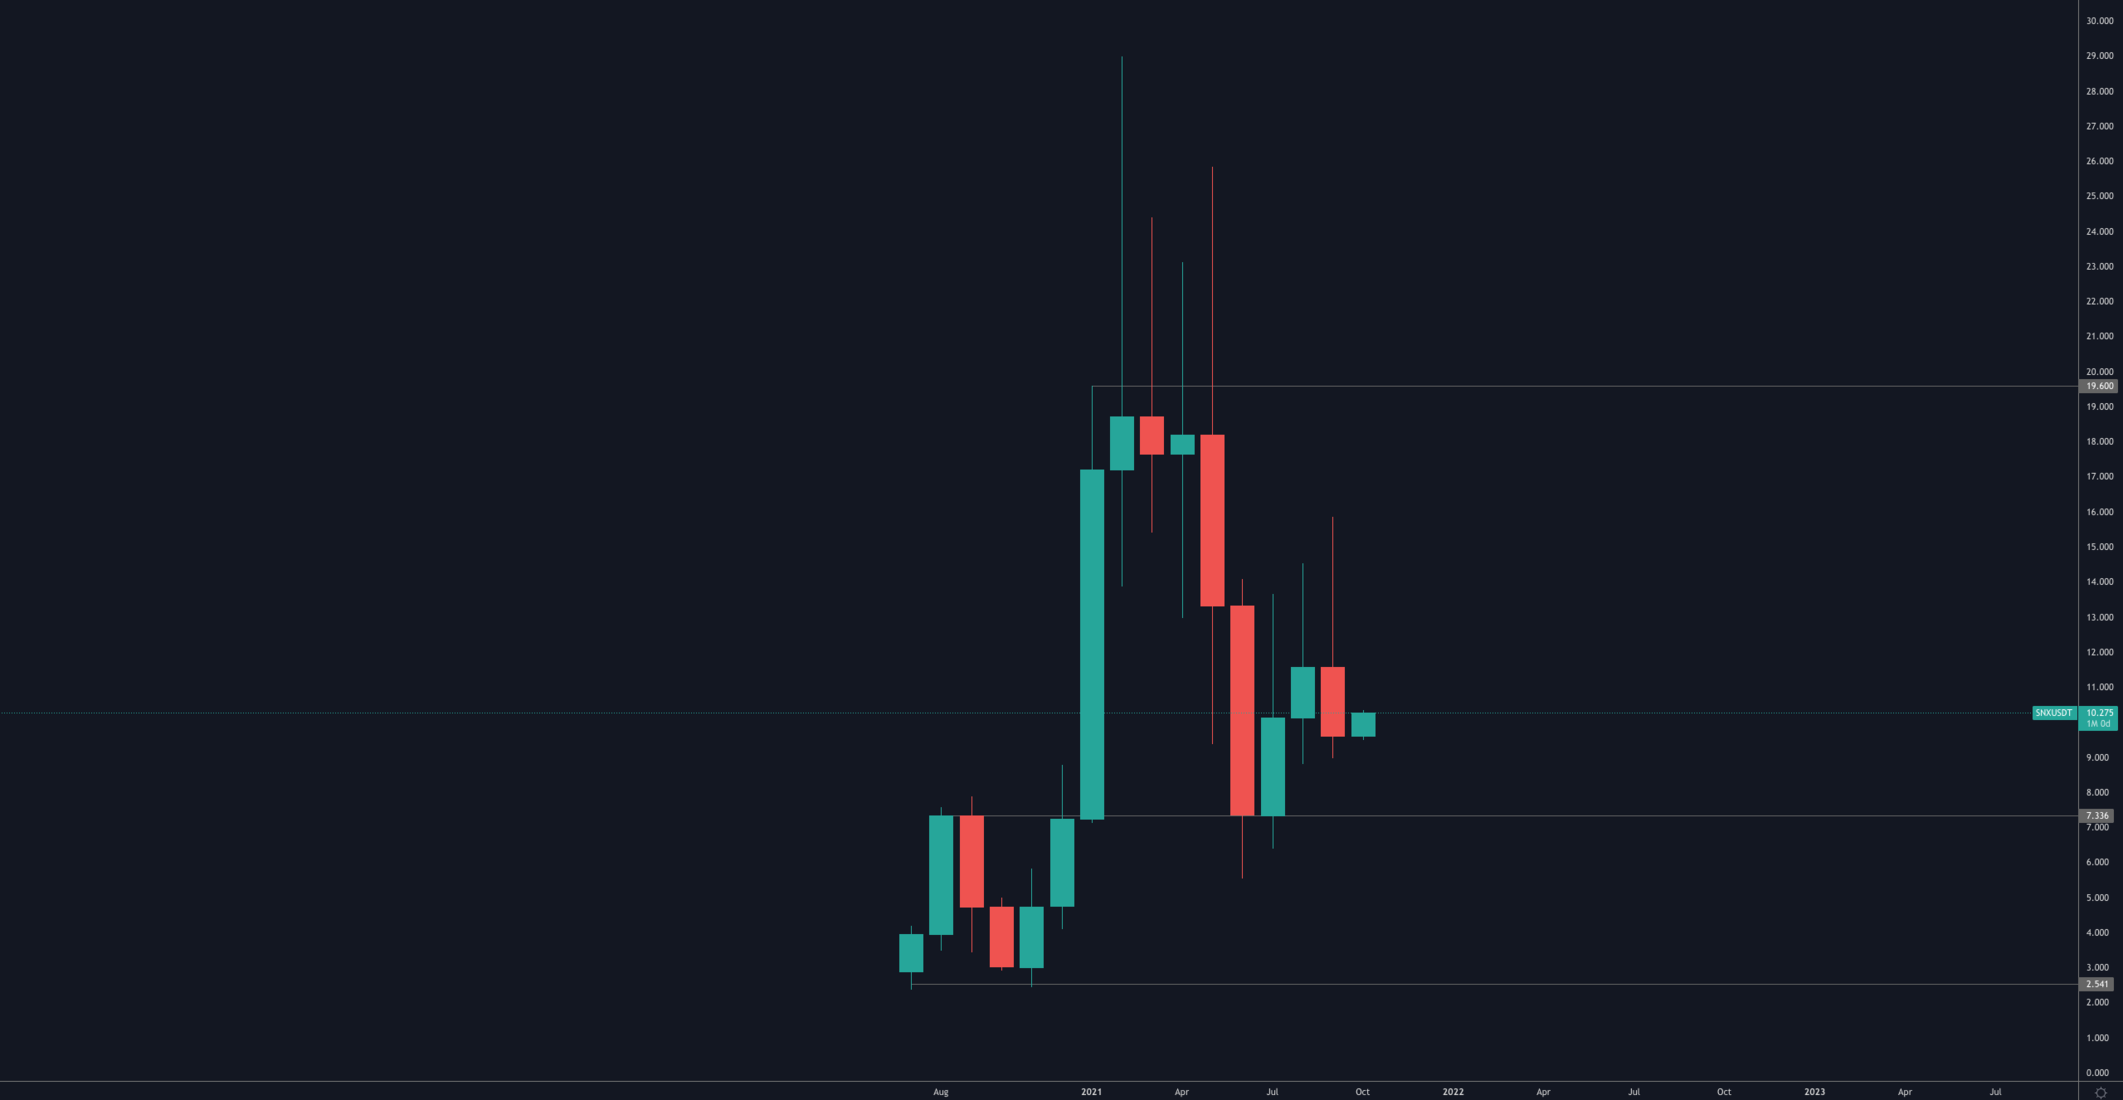
The monthly candle set in September is a bearish engulfing one which communicates a likely drop towards support which sits at $7.50. Should the latter happen, it would present a good opportunity for SNX as the next monthly key level sits at $19.60 (+360%).
RUNE
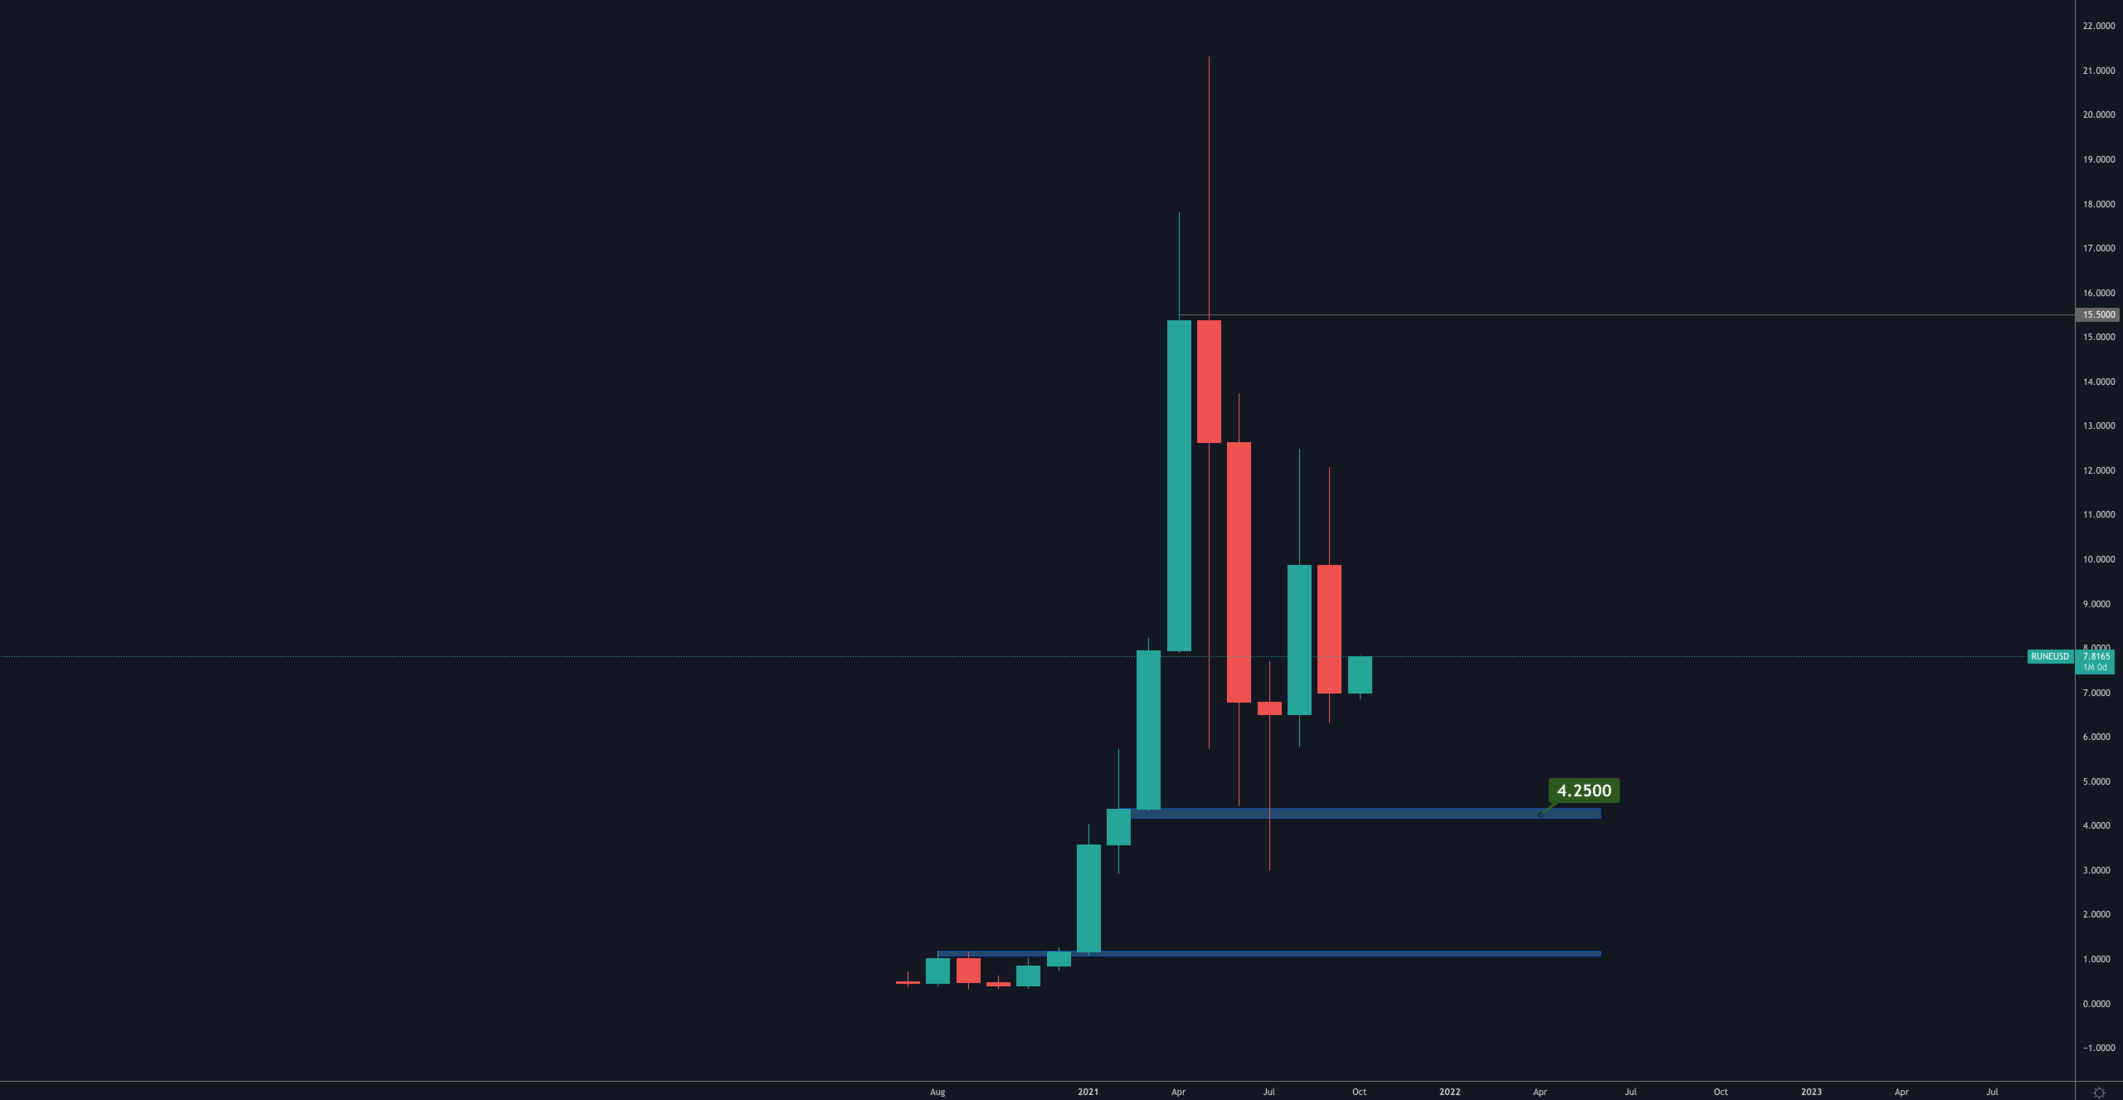
Relatively weak month with -29.21% recorded for RUNE in September. The line in the sand on high timeframes remains $11.50 for RUNE, as this is what separates bullish from bearish territory.
SOL
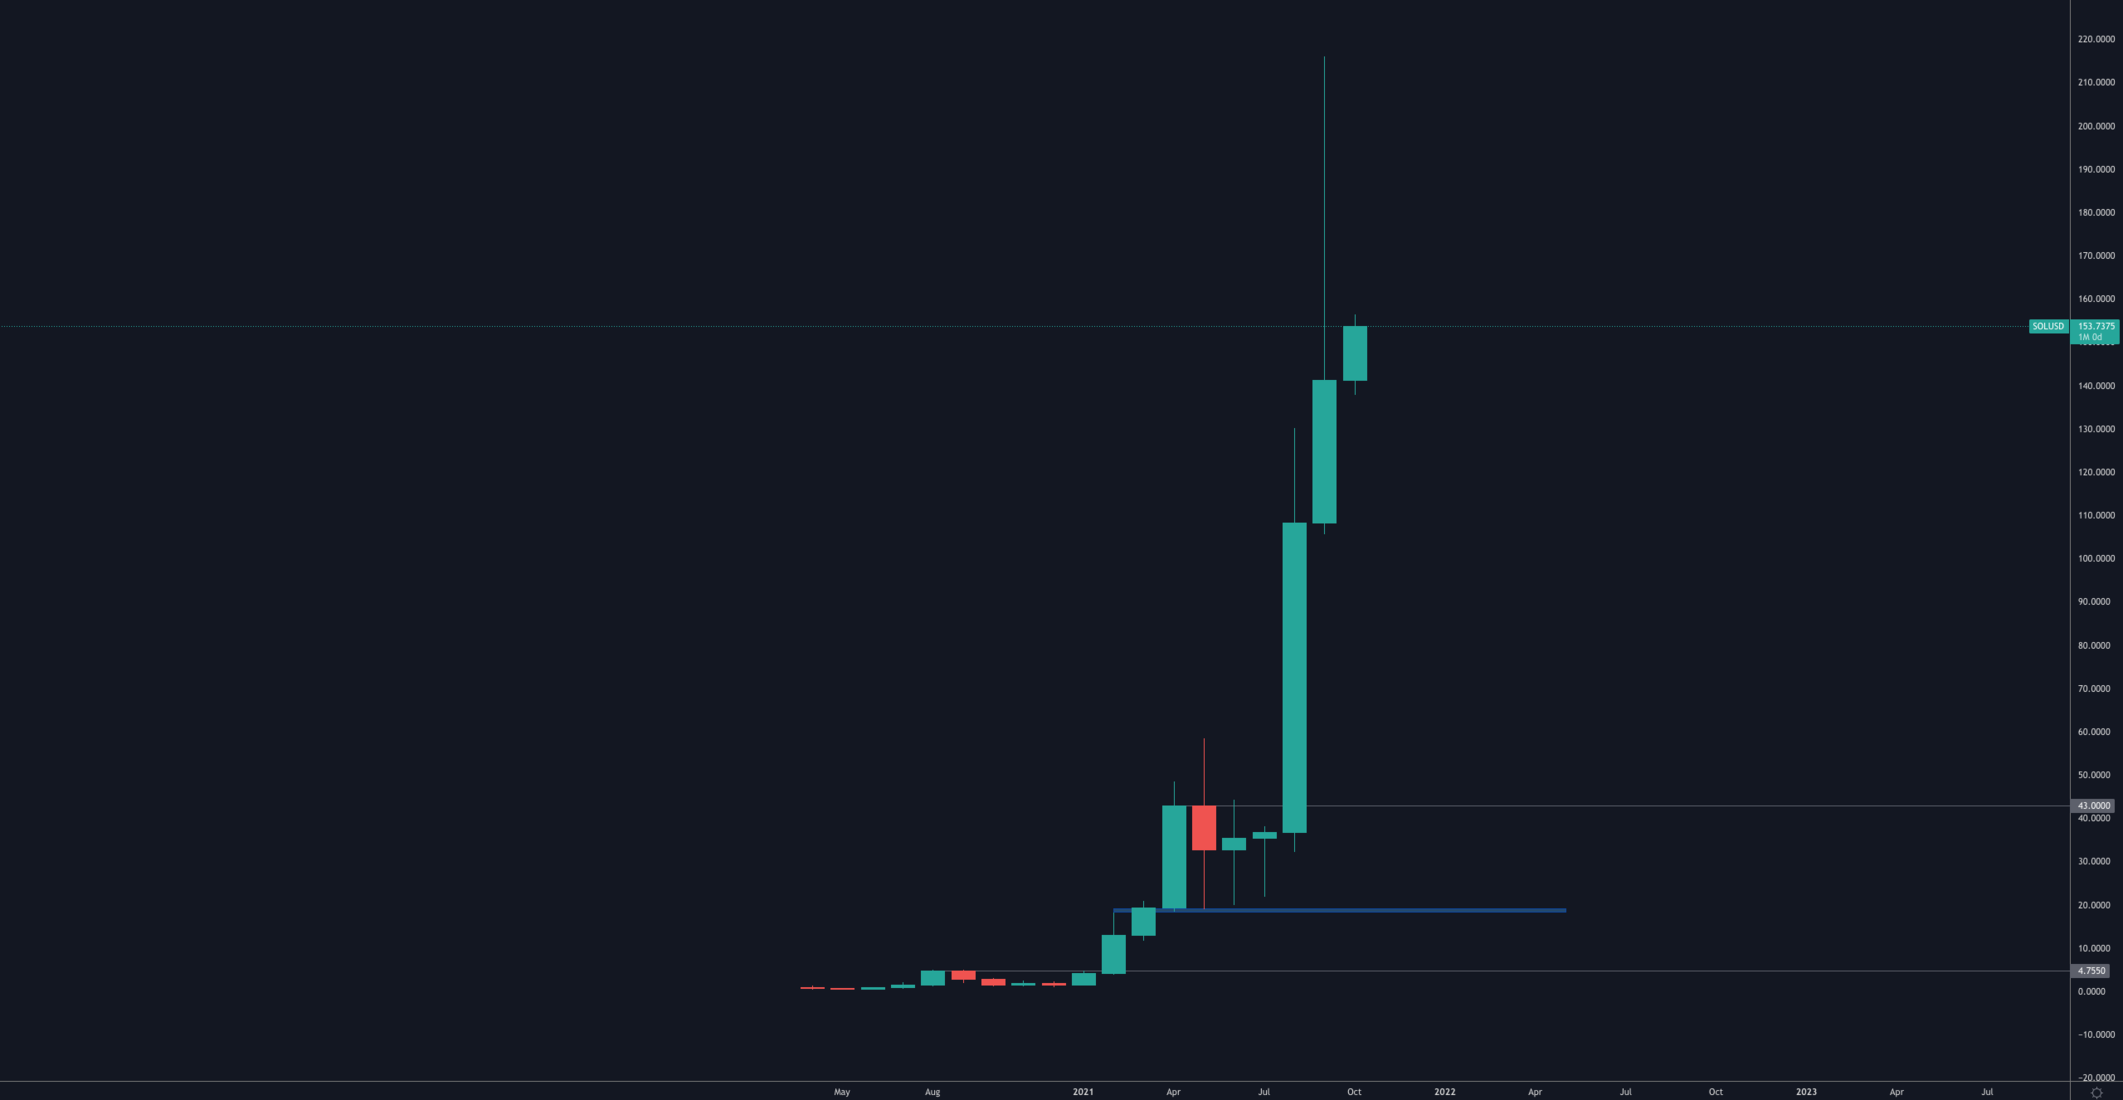
Given SOL's gigantic performance since August, it is not possible to analyse pure "Up Only". What the chart does communicate to us, is resistance at $200 which is what we've seen on lower timeframes as well.
SRM
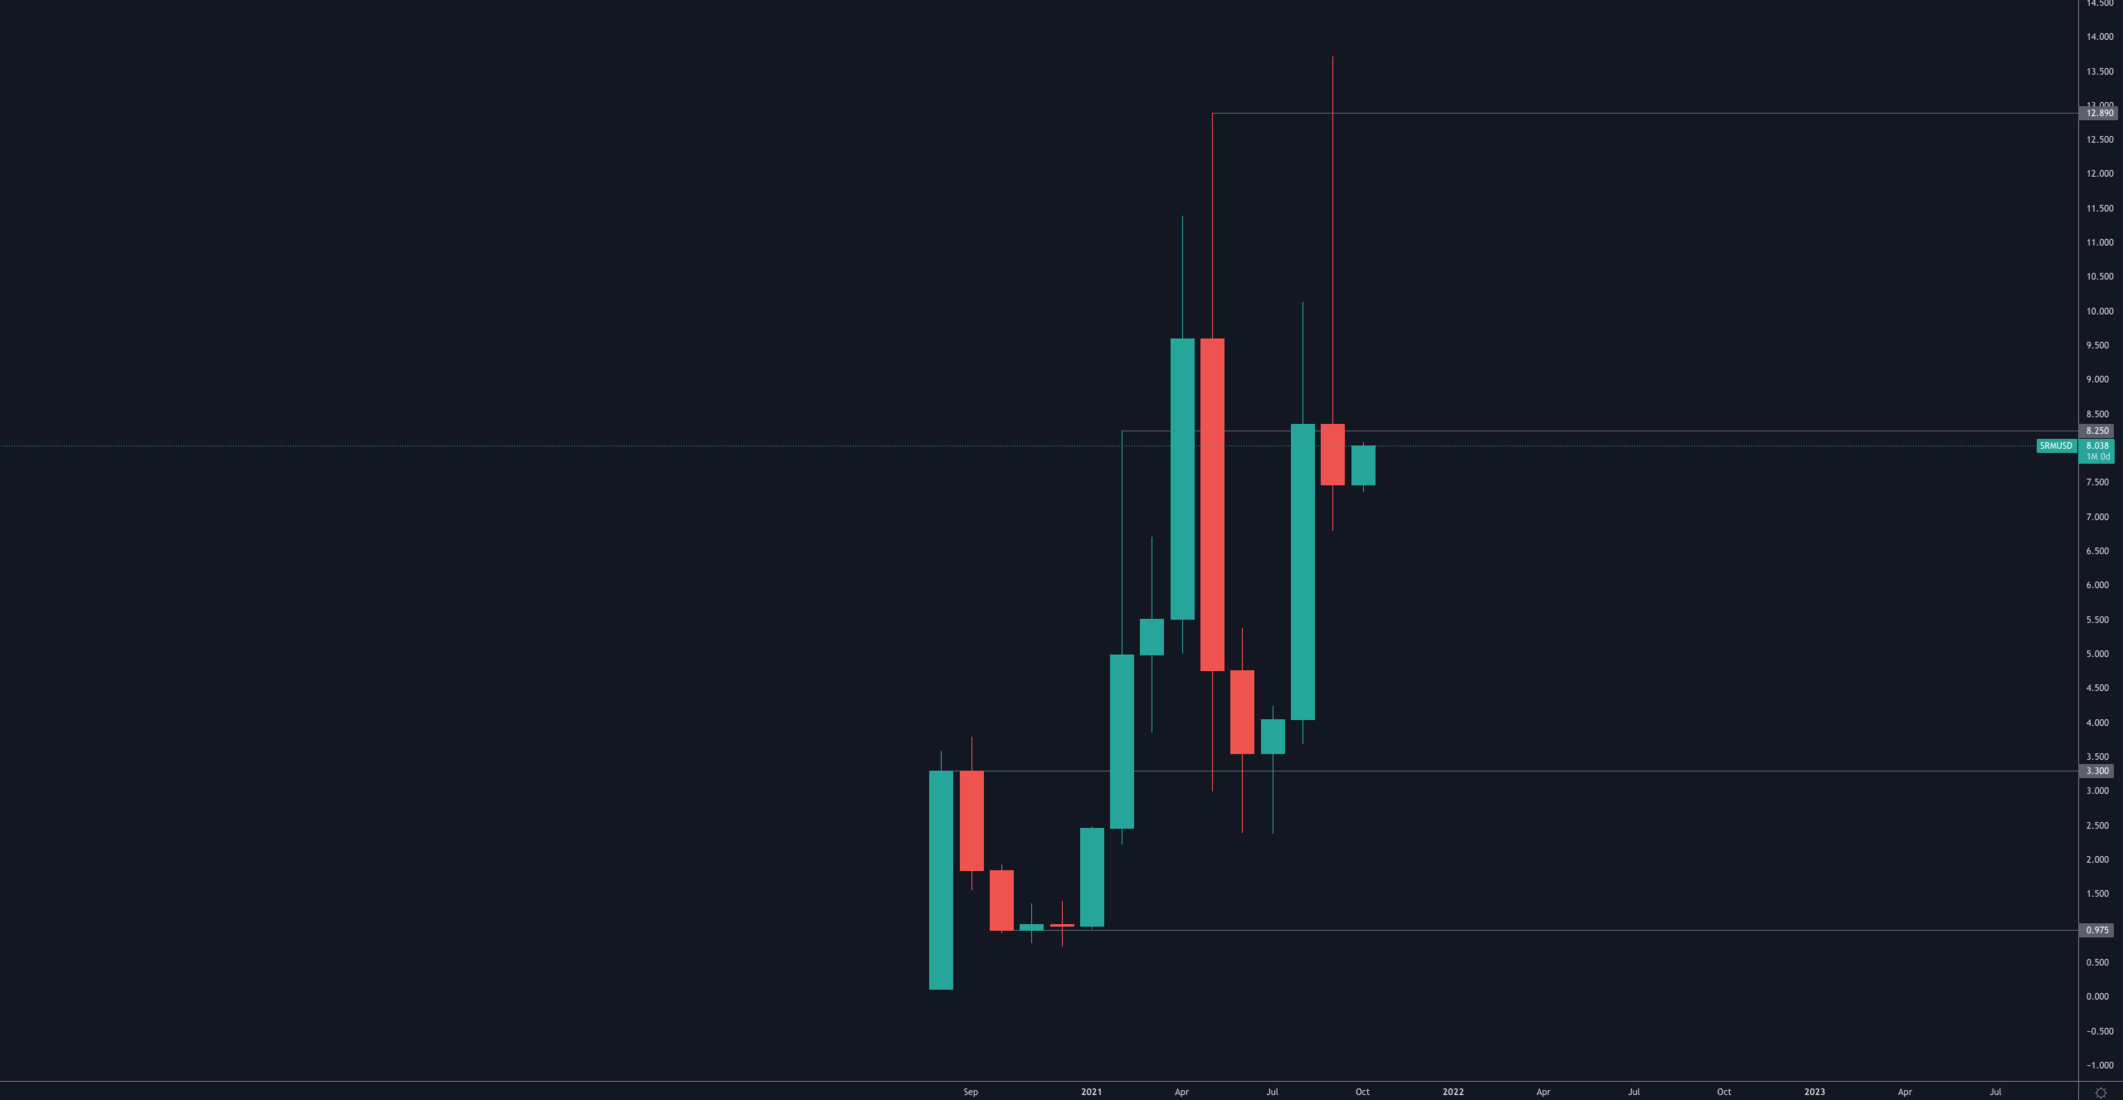
SRM was not able to maintain a closure above $8.25, let alone create a new high on the monthly timeframe. Nonetheless, the rejections were not strong and redemption can still occur.
FTT
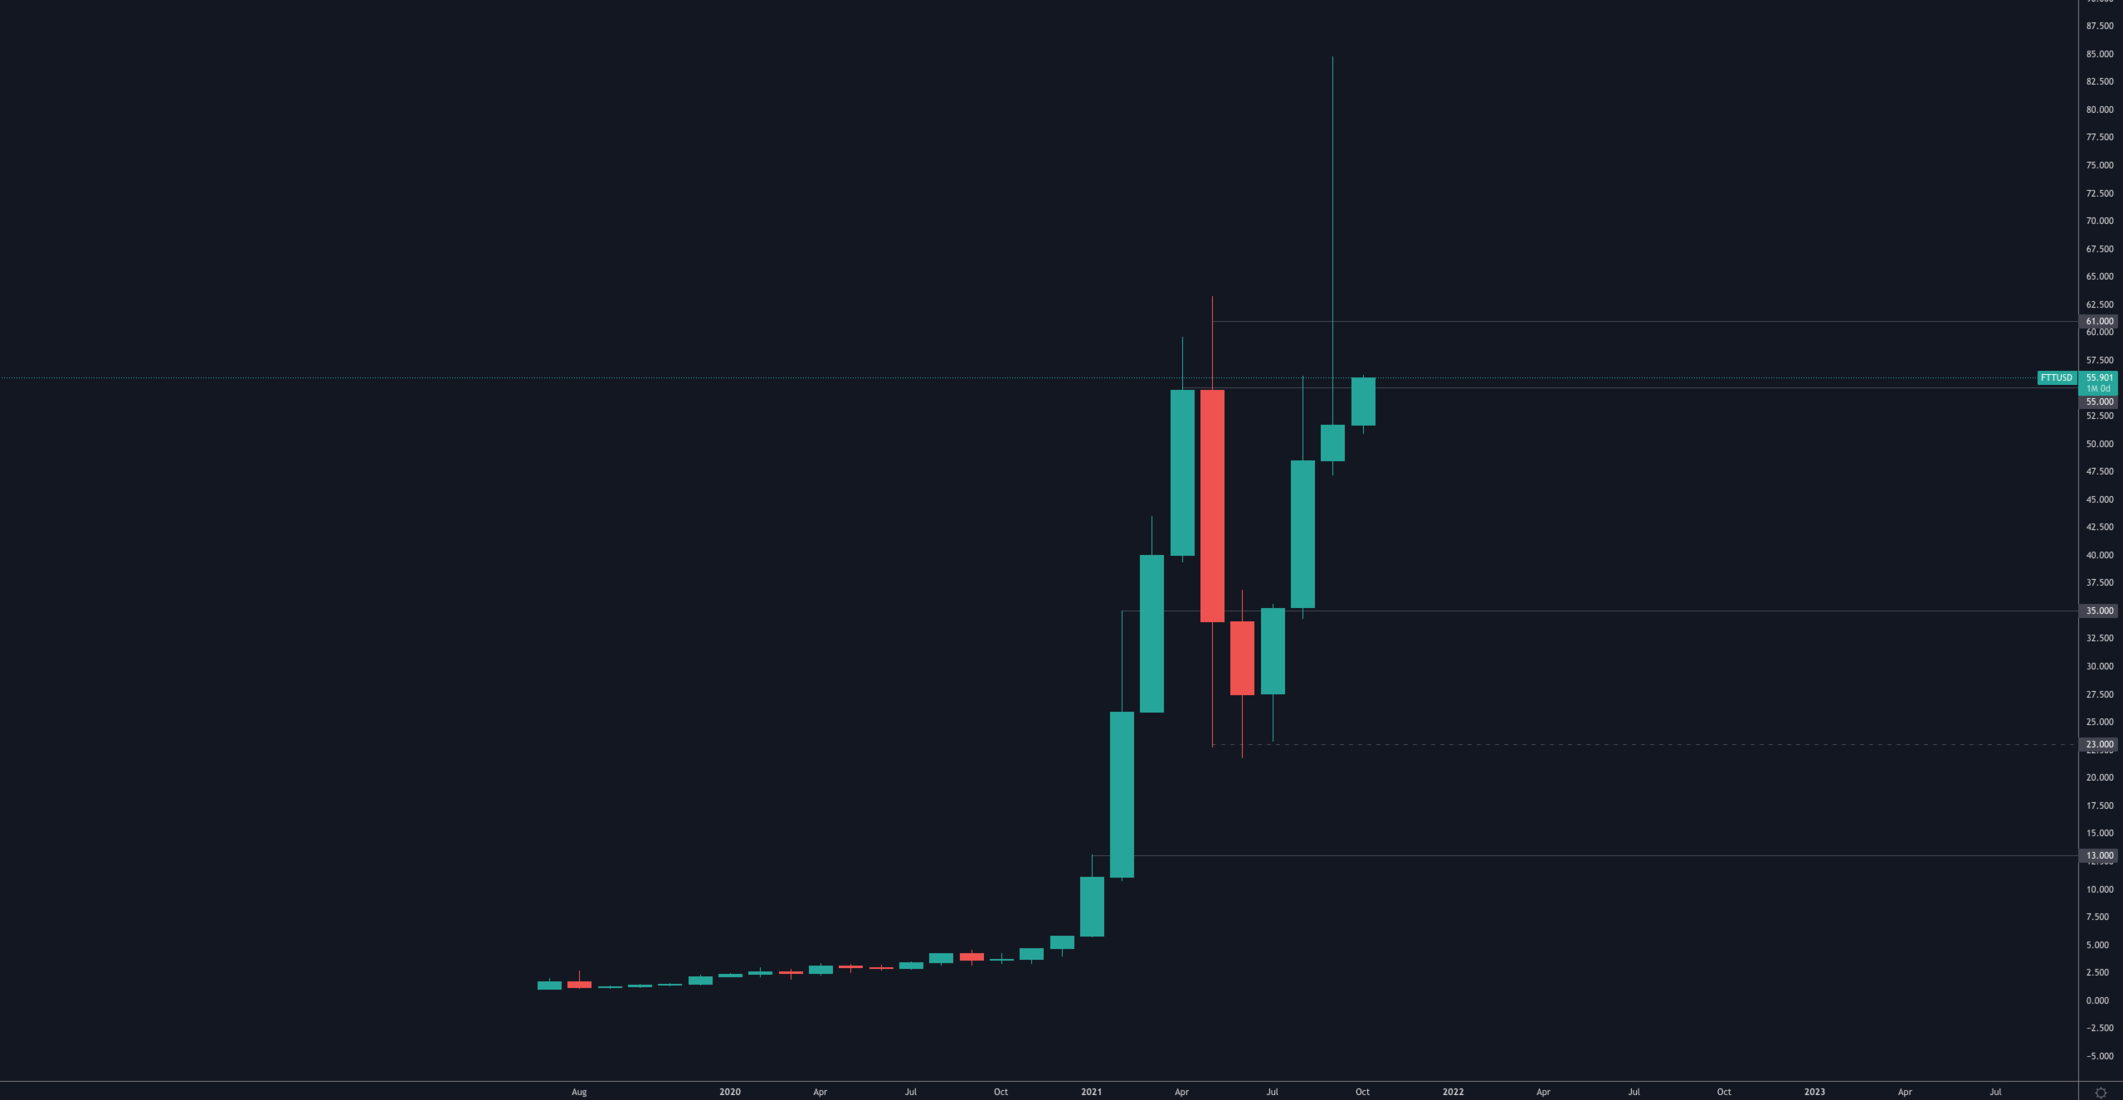
FTT rallied hard during September but failed to hold onto the gains made. What we need to see is a new monthly high to enter price discovery. This will communicated first on the daily timeframe through a breakout from the [$50-$60] range.
Recommended from Cryptonary


