Save 23% ($351) & Get a Free 1-1 Call with our Team ⏰ : 0d 2h 59m 44s
The next big move, or just an illusion? | March 16th
What a whirlwind this week has been! Interesting things have been happening in the crypto market. Bitcoin rose over 20% in just two days, and altcoins are making us happy by pumping like there’s no tomorrow. And there’s even more to come, so let’s dive in!

Disclaimer: Not financial or investment advice. Any capital-related decisions you make are your full responsibility.
TLDR
- The Total Market Cap marked a weekly higher high this week. All that’s needed for the market to rally is a weekly closure above $1.03T.
- The Altcoins Market Cap remains above support ($550B). As long as it holds this level, altcoins will boom in the coming weeks.
- Although Bitcoin marked a weekly higher high this week, it will need to close a weekly candle above $25,150 for the market to go up.
- Ether finally reached $1740. However, closing above this level is necessary for further upside.
- BNB marked a weekly higher low last week. From a technical standpoint, a higher high would confirm a market structure change.
- A breakout for XRP’s symmetrical triangle will be seen in the next 30 days.
Total Market Cap (Weekly)
The Total Market Cap index represents the entire valuation of the cryptocurrency market. We track this index to understand where the market is now and predict where it will go.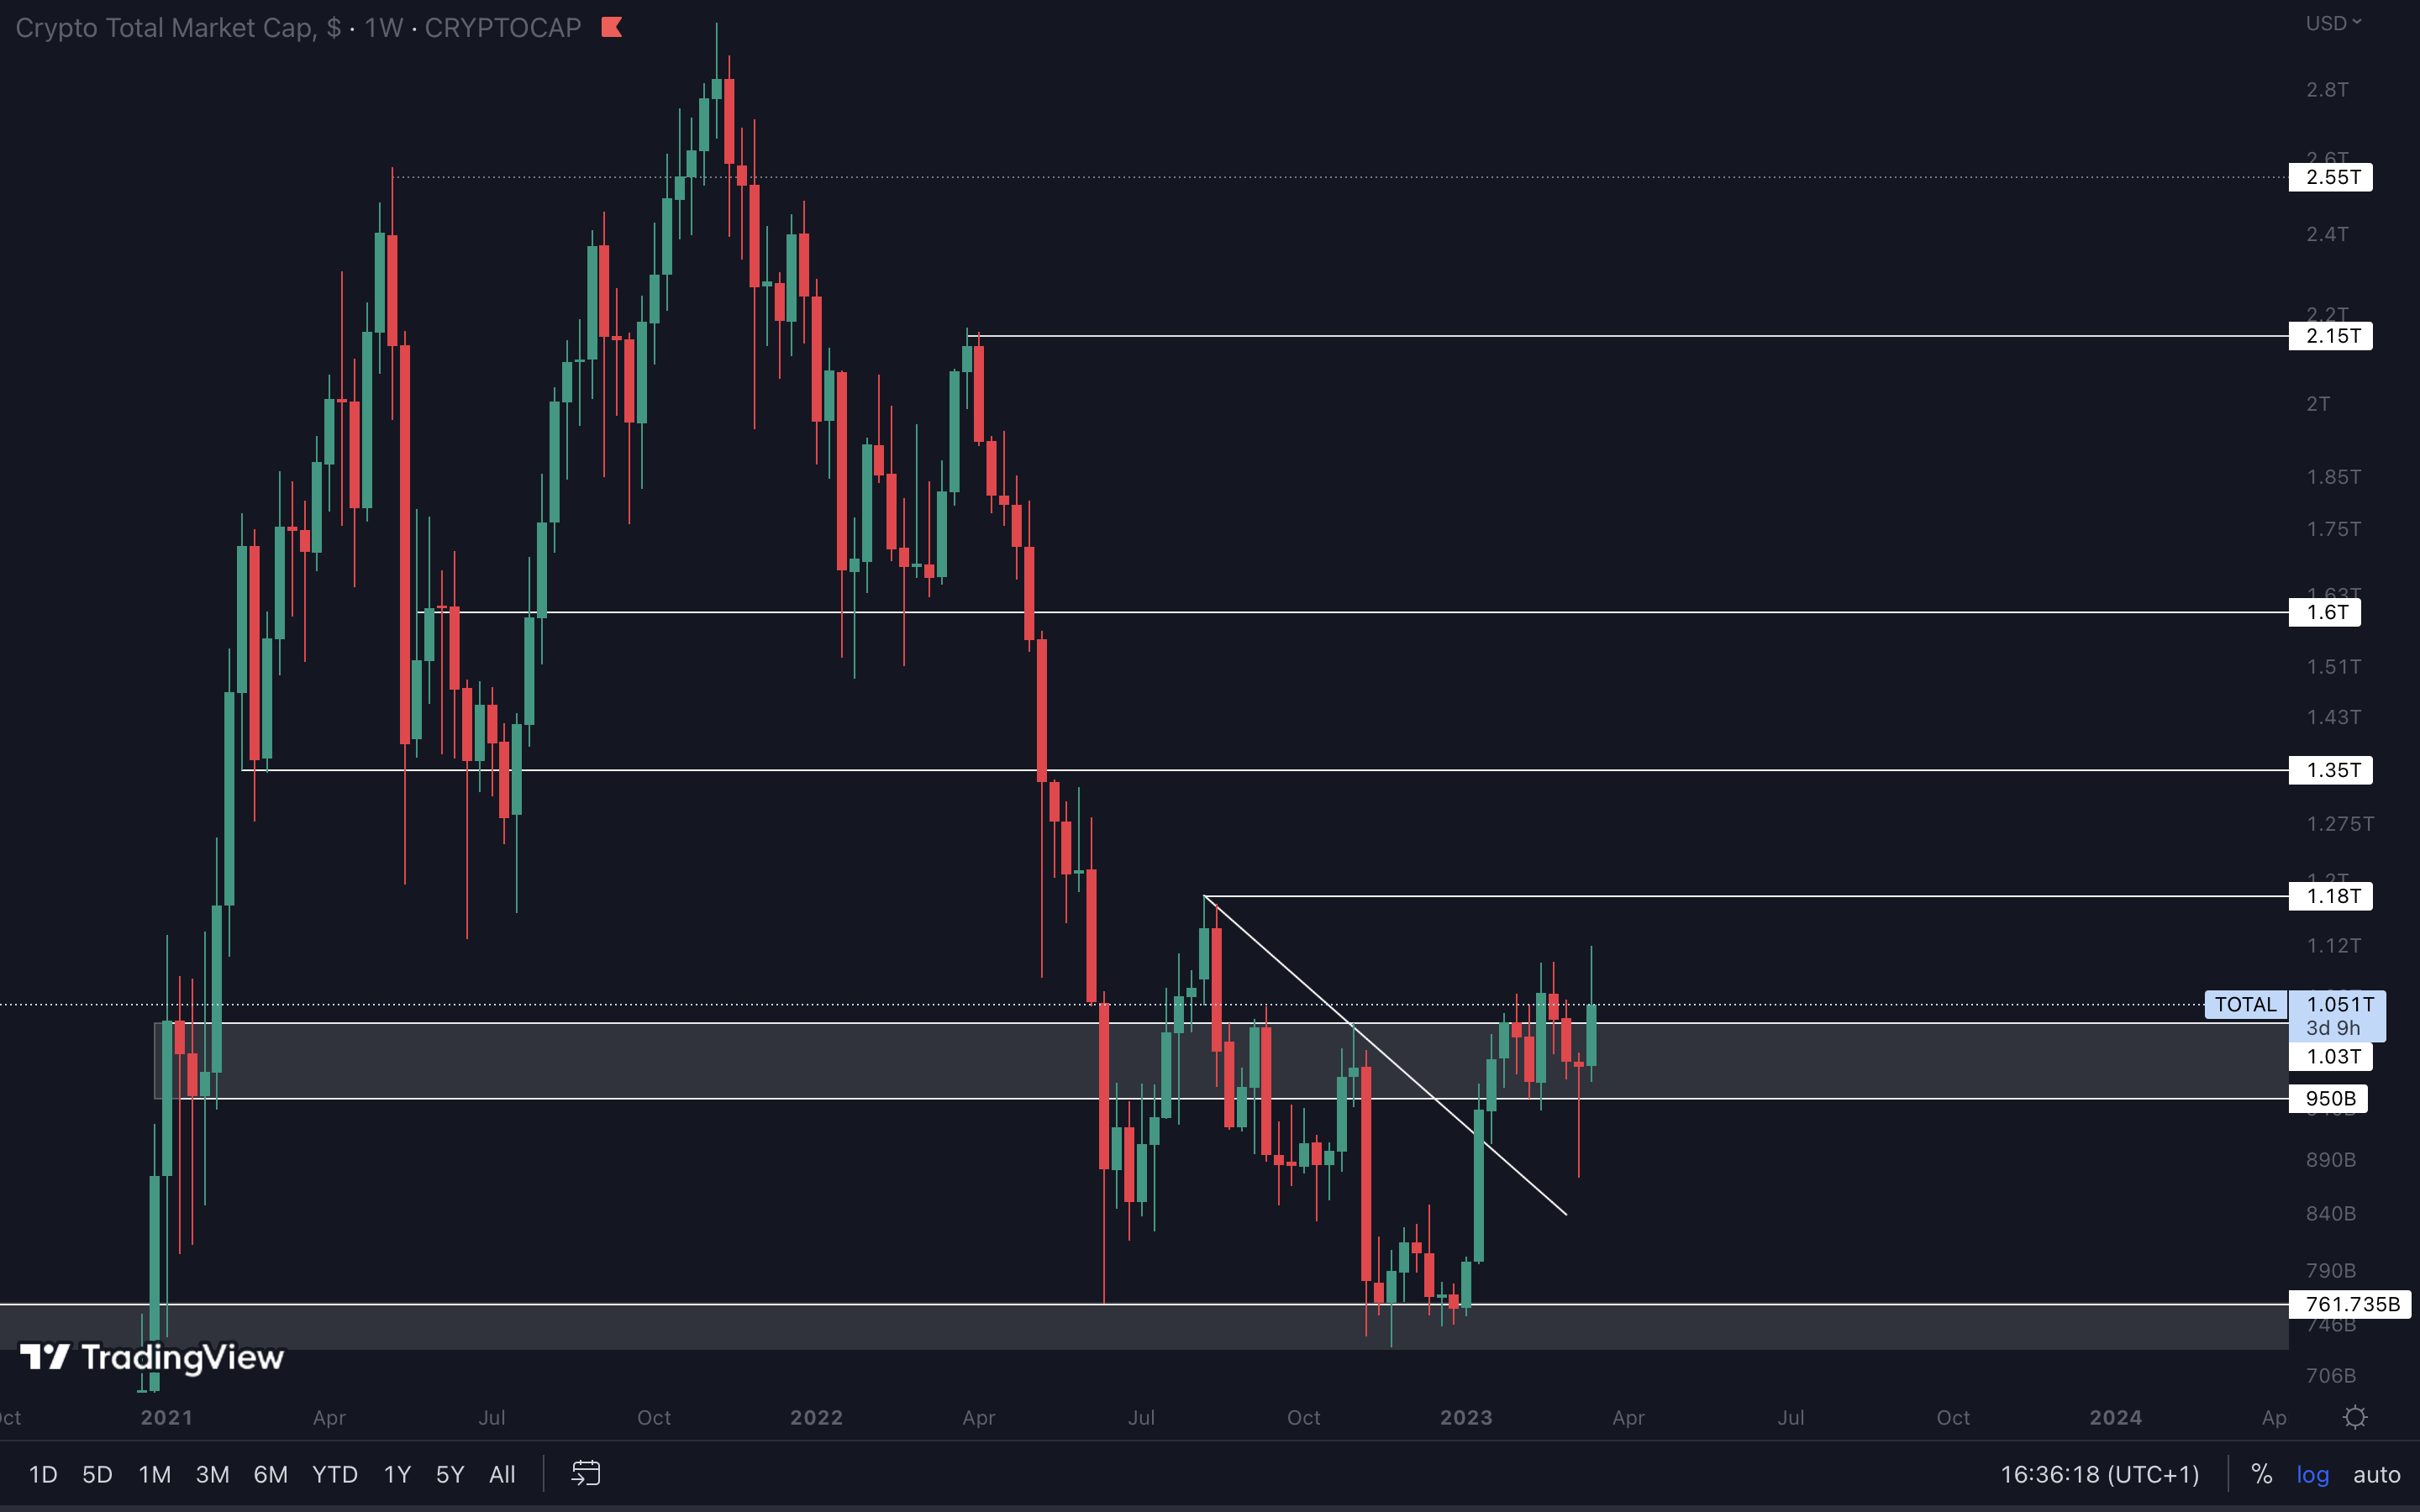
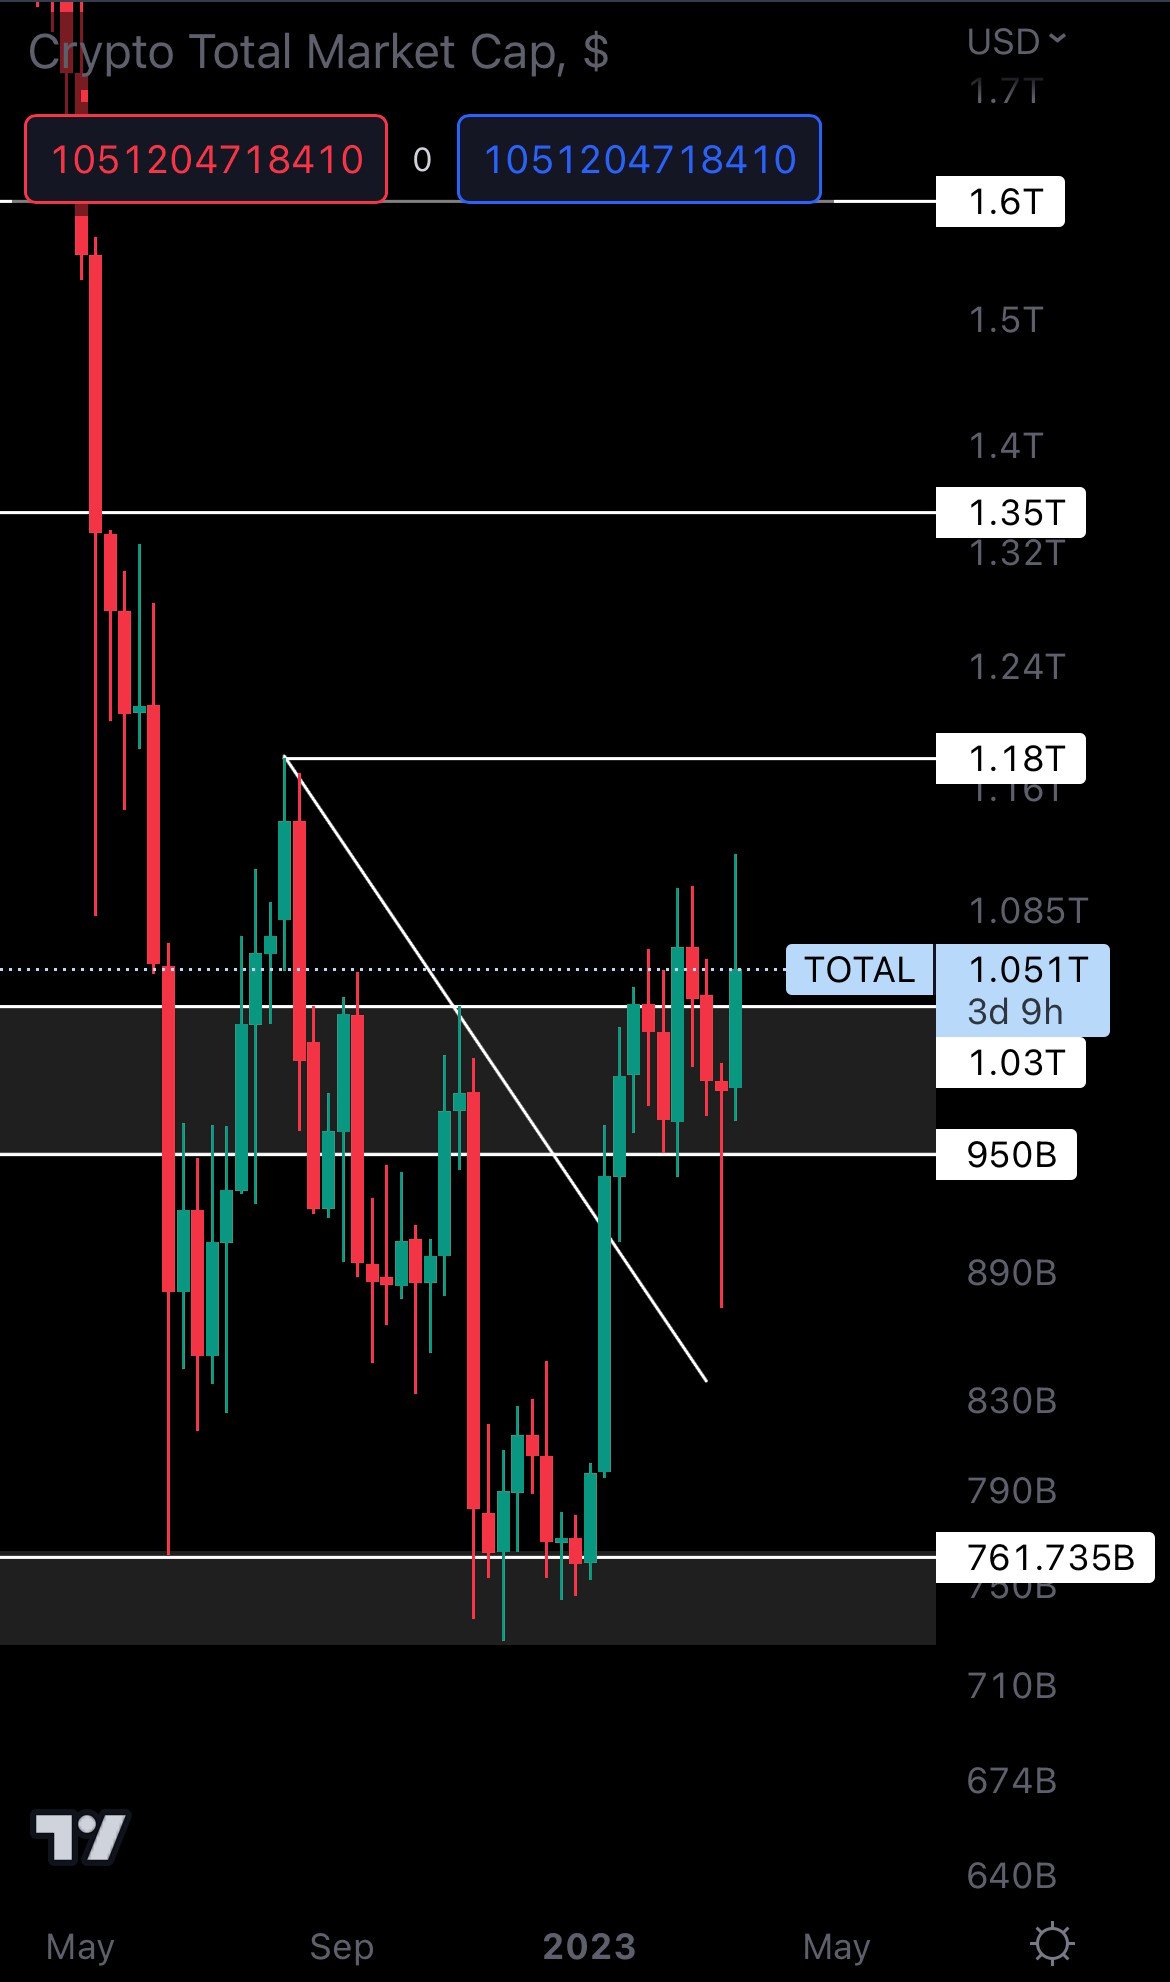 The crypto market saw an insane increase this week, marking a weekly higher high and altering the market structure once again. For upside to continue, the Total Market Cap needs to close a weekly candle above $1.03T. This would open the road for $1.18T and $1.35T respectively.
If that doesn’t happen, we’ll likely see the Total Market Cap index range until $1.03T is reclaimed or $950B is lost as support.
Altcoins Market Cap (Weekly)
The Altcoins Market Cap index represents the entire valuation of the altcoins market (all coins other than BTC).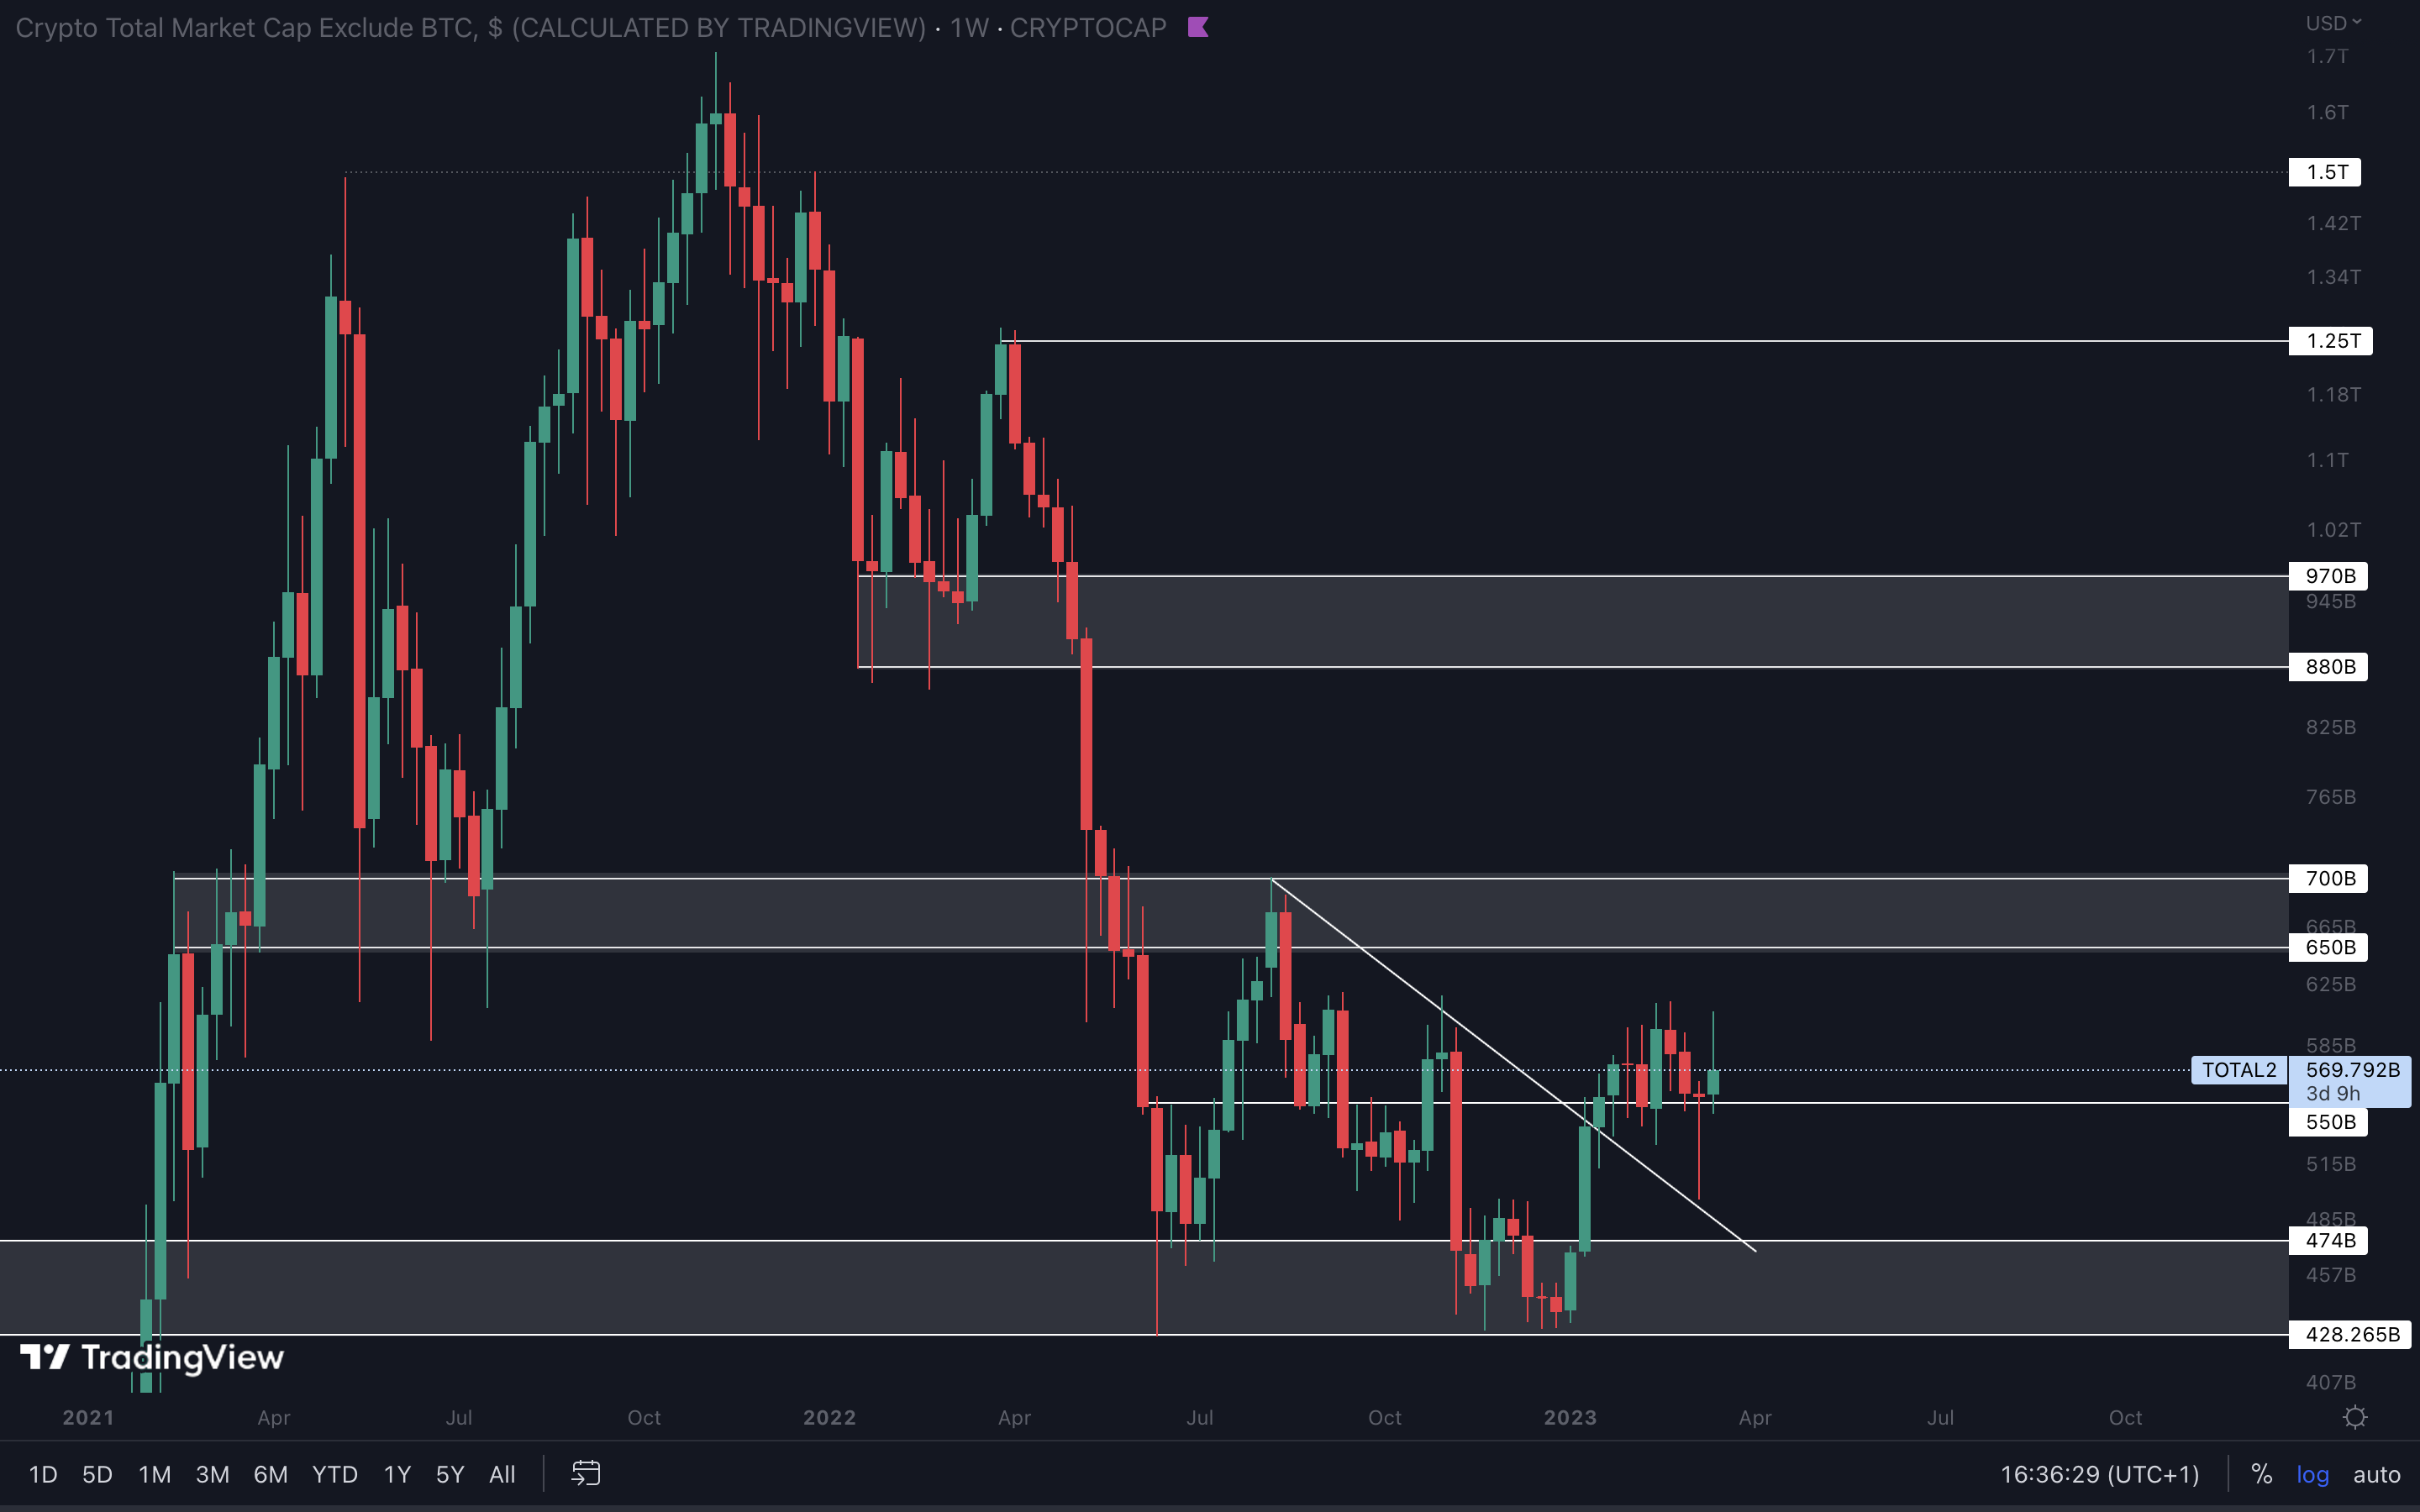
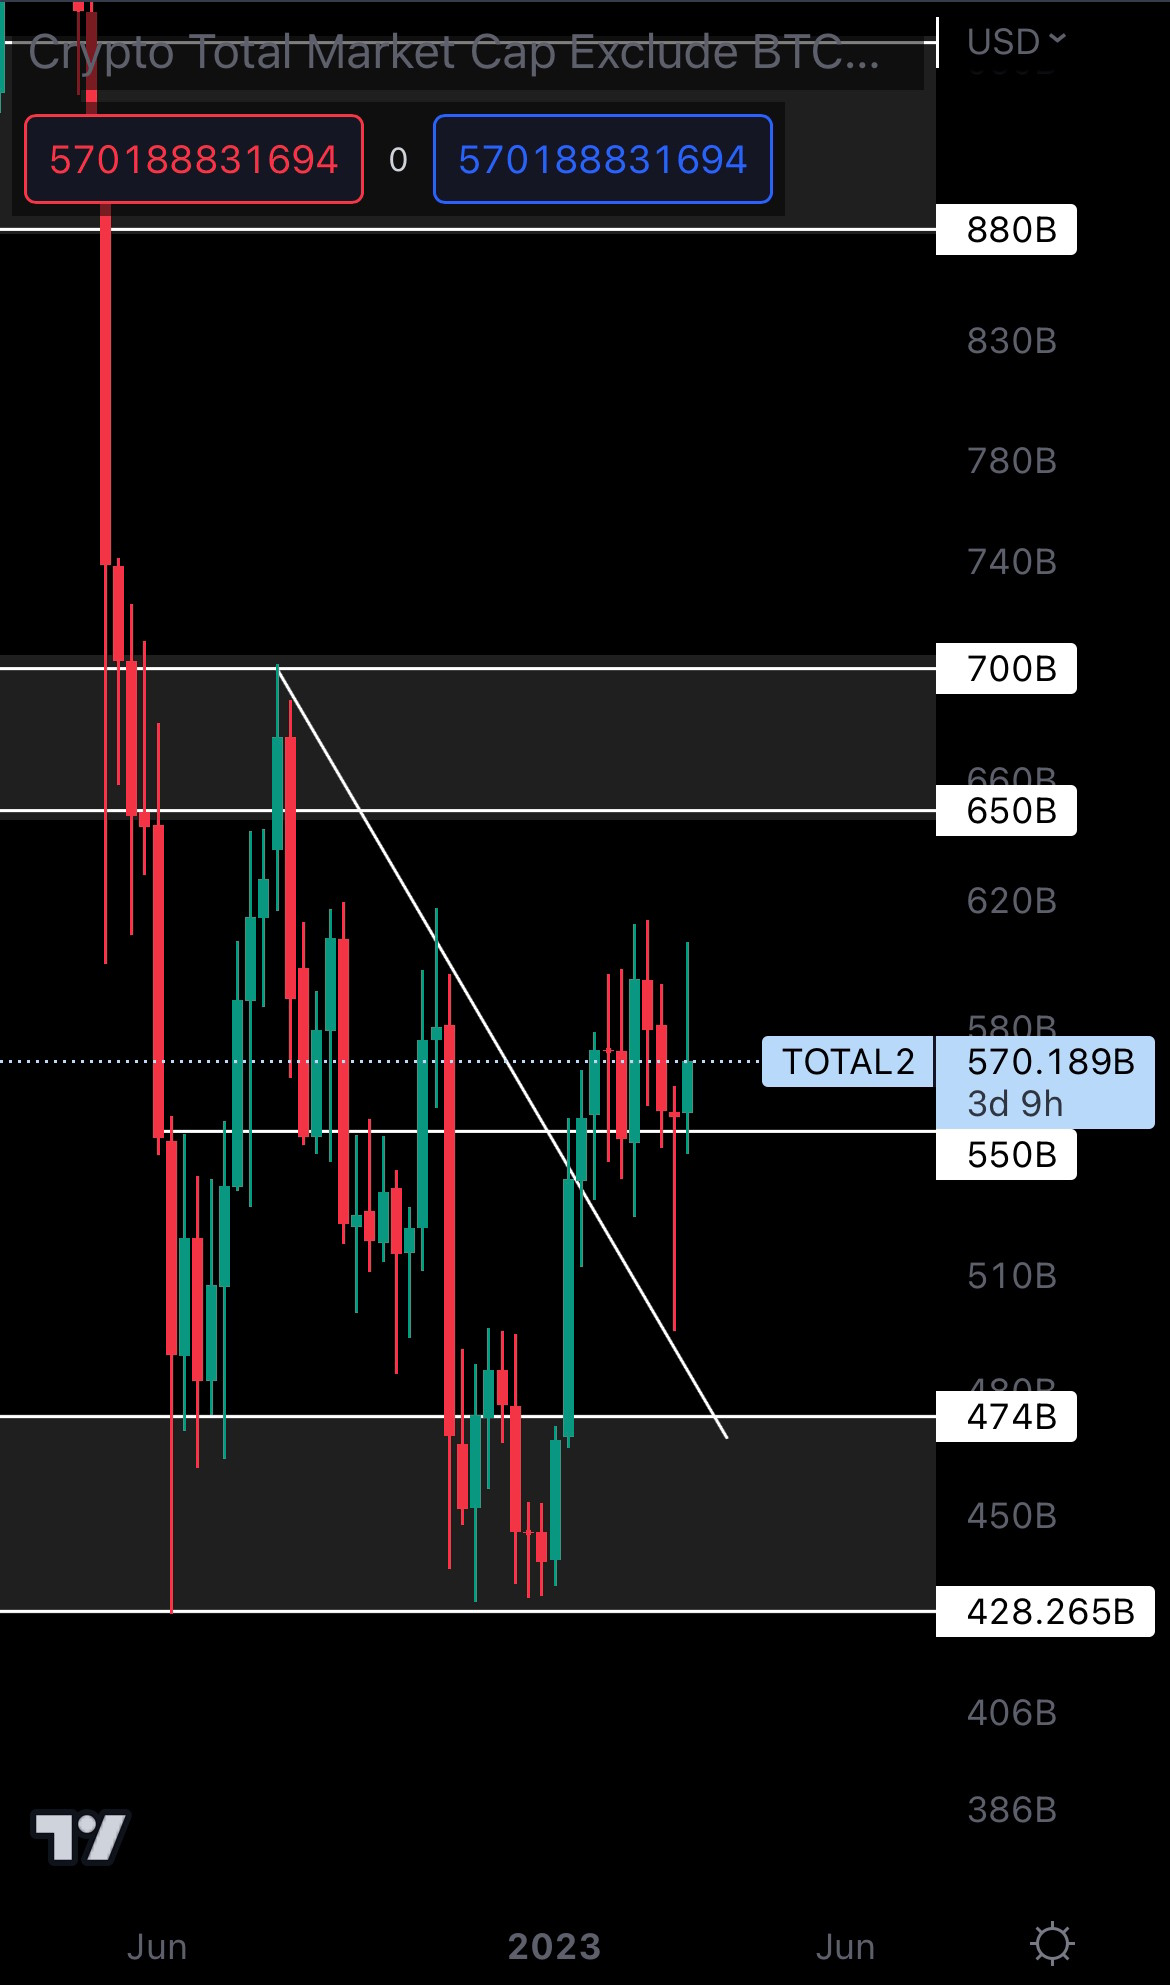 Our take here is simple: as long as the Altcoins Market Cap holds $550B as support, altcoins will continue to perform well.
If you opened the charts this week, you probably saw extreme volatility in the altcoins market. If you’re not a trained investor or trader, we recommend staying away from this type of volatility because you will lose money.
A weekly closure above $25,150 for BTC would bring insane results in the altcoins market. The Altcoins Market Cap index could then head to its $650B - $700B resistance area.
BTC | Bitcoin (Weekly)
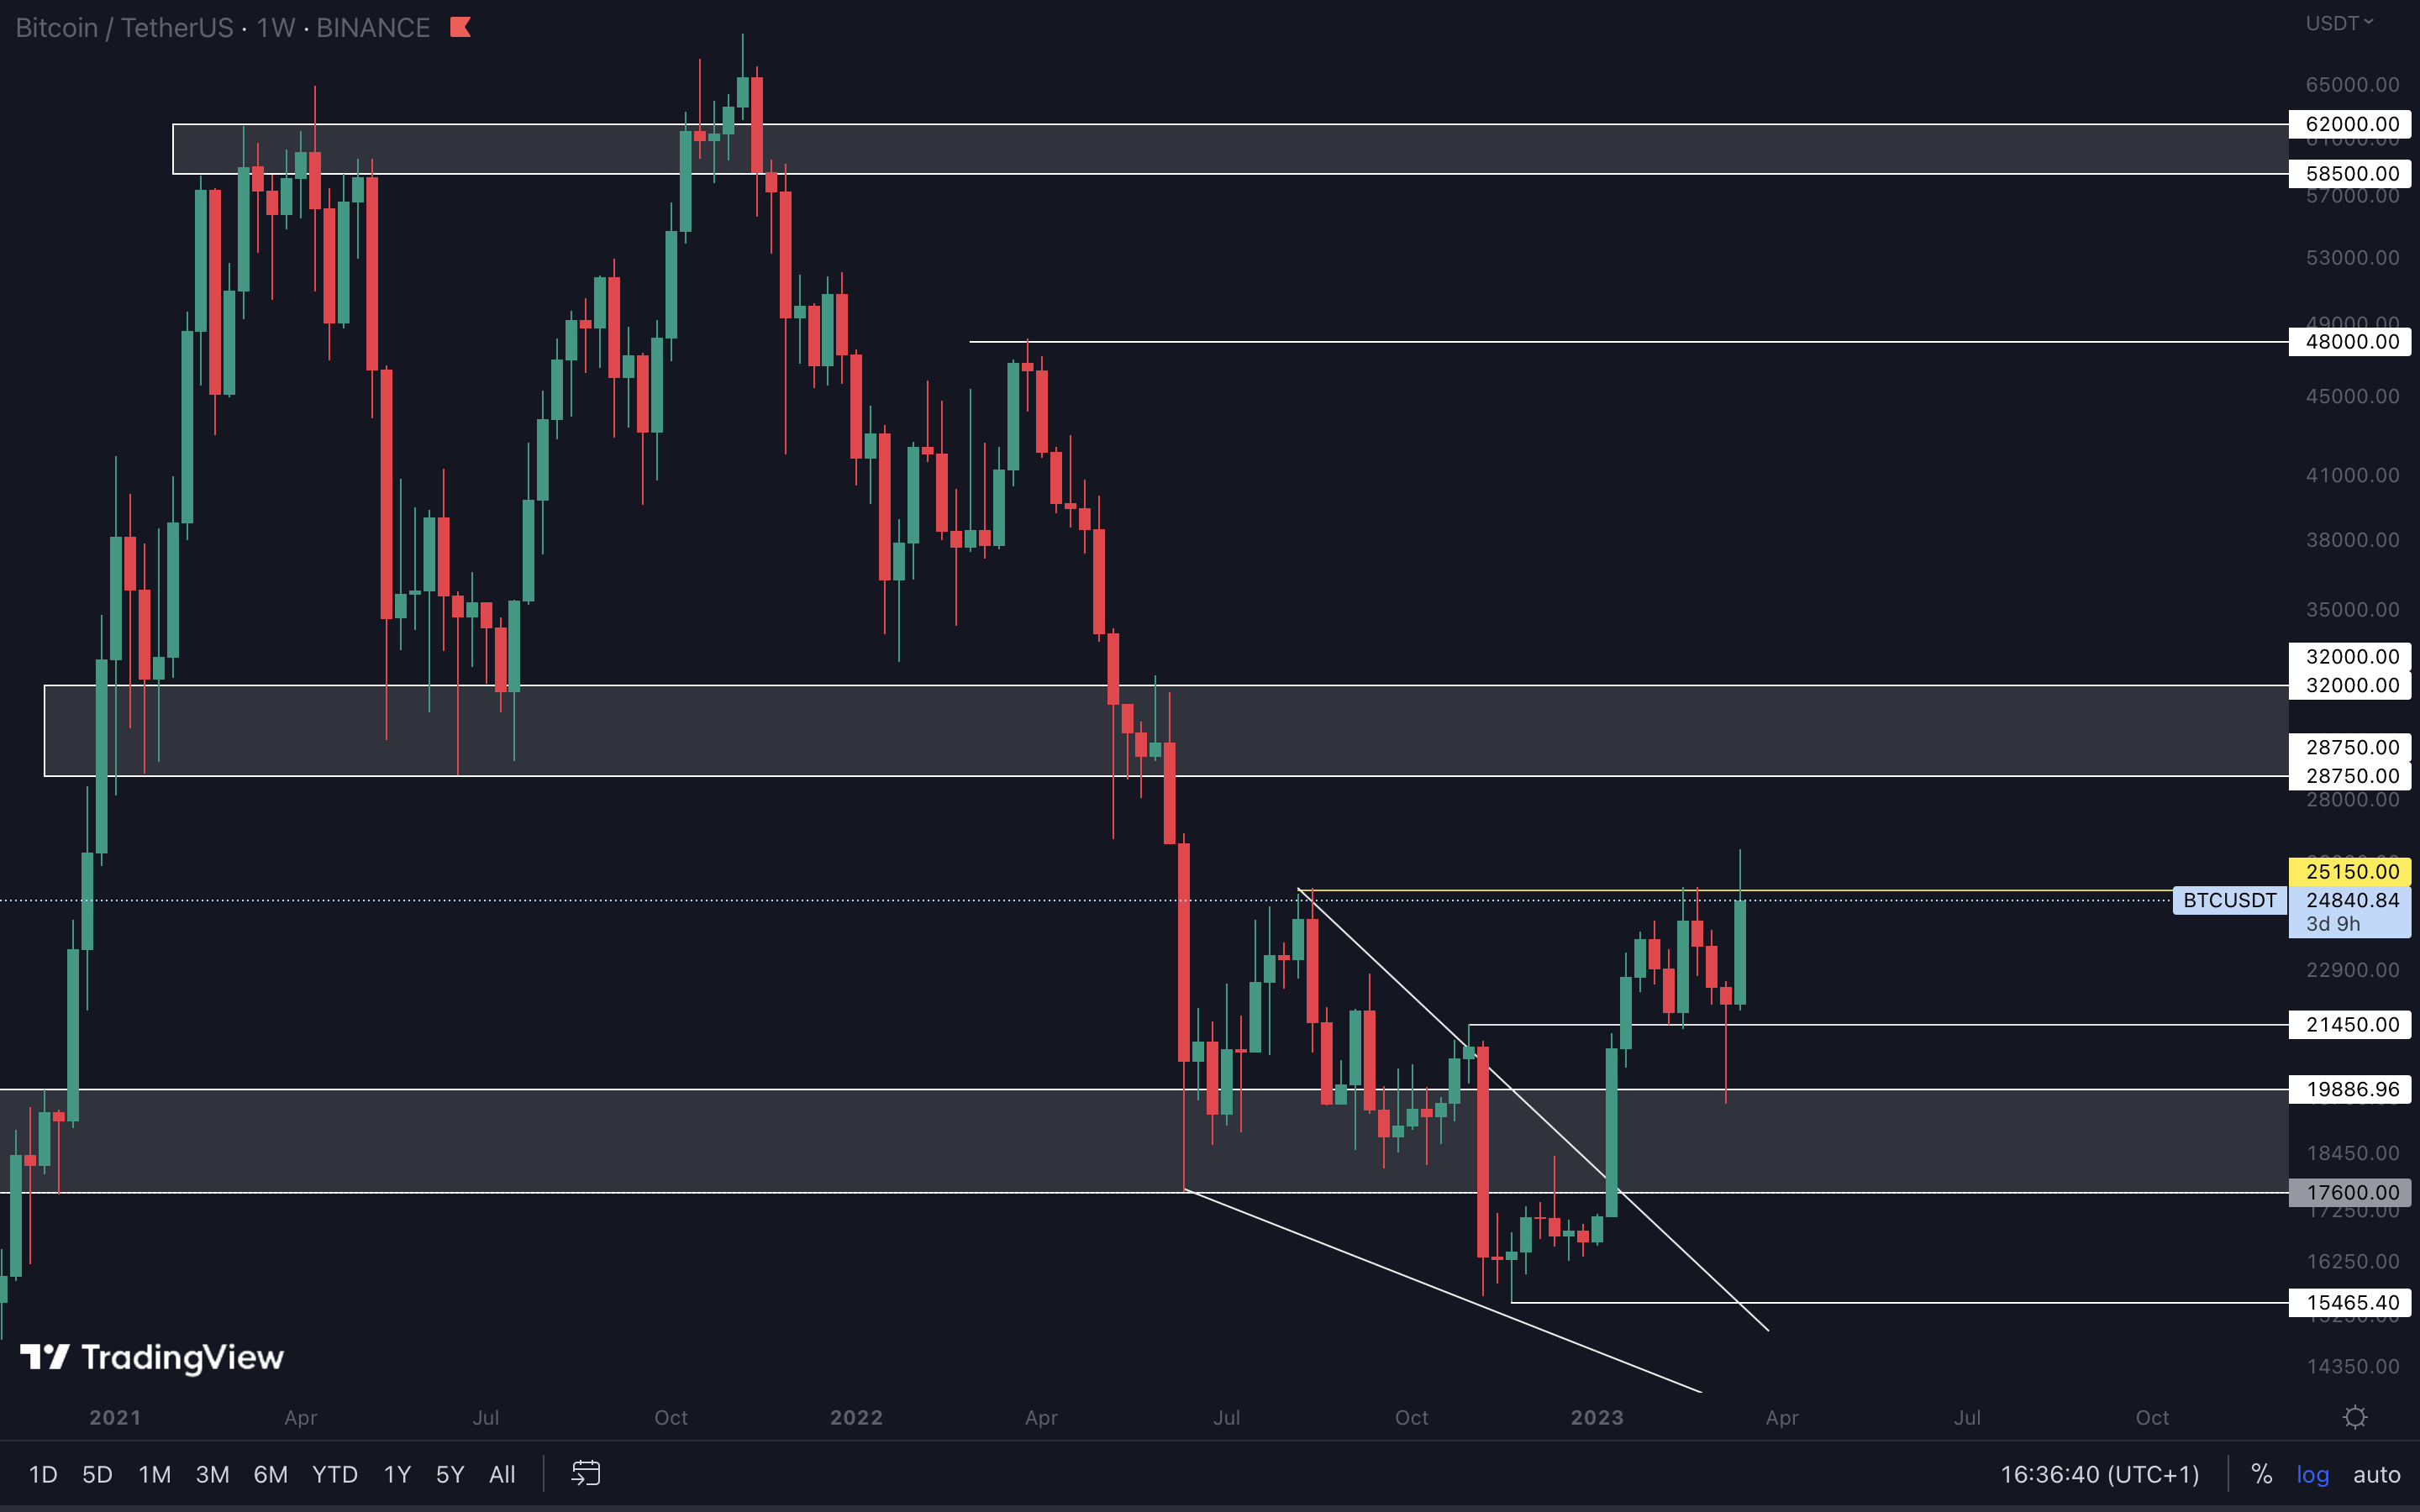
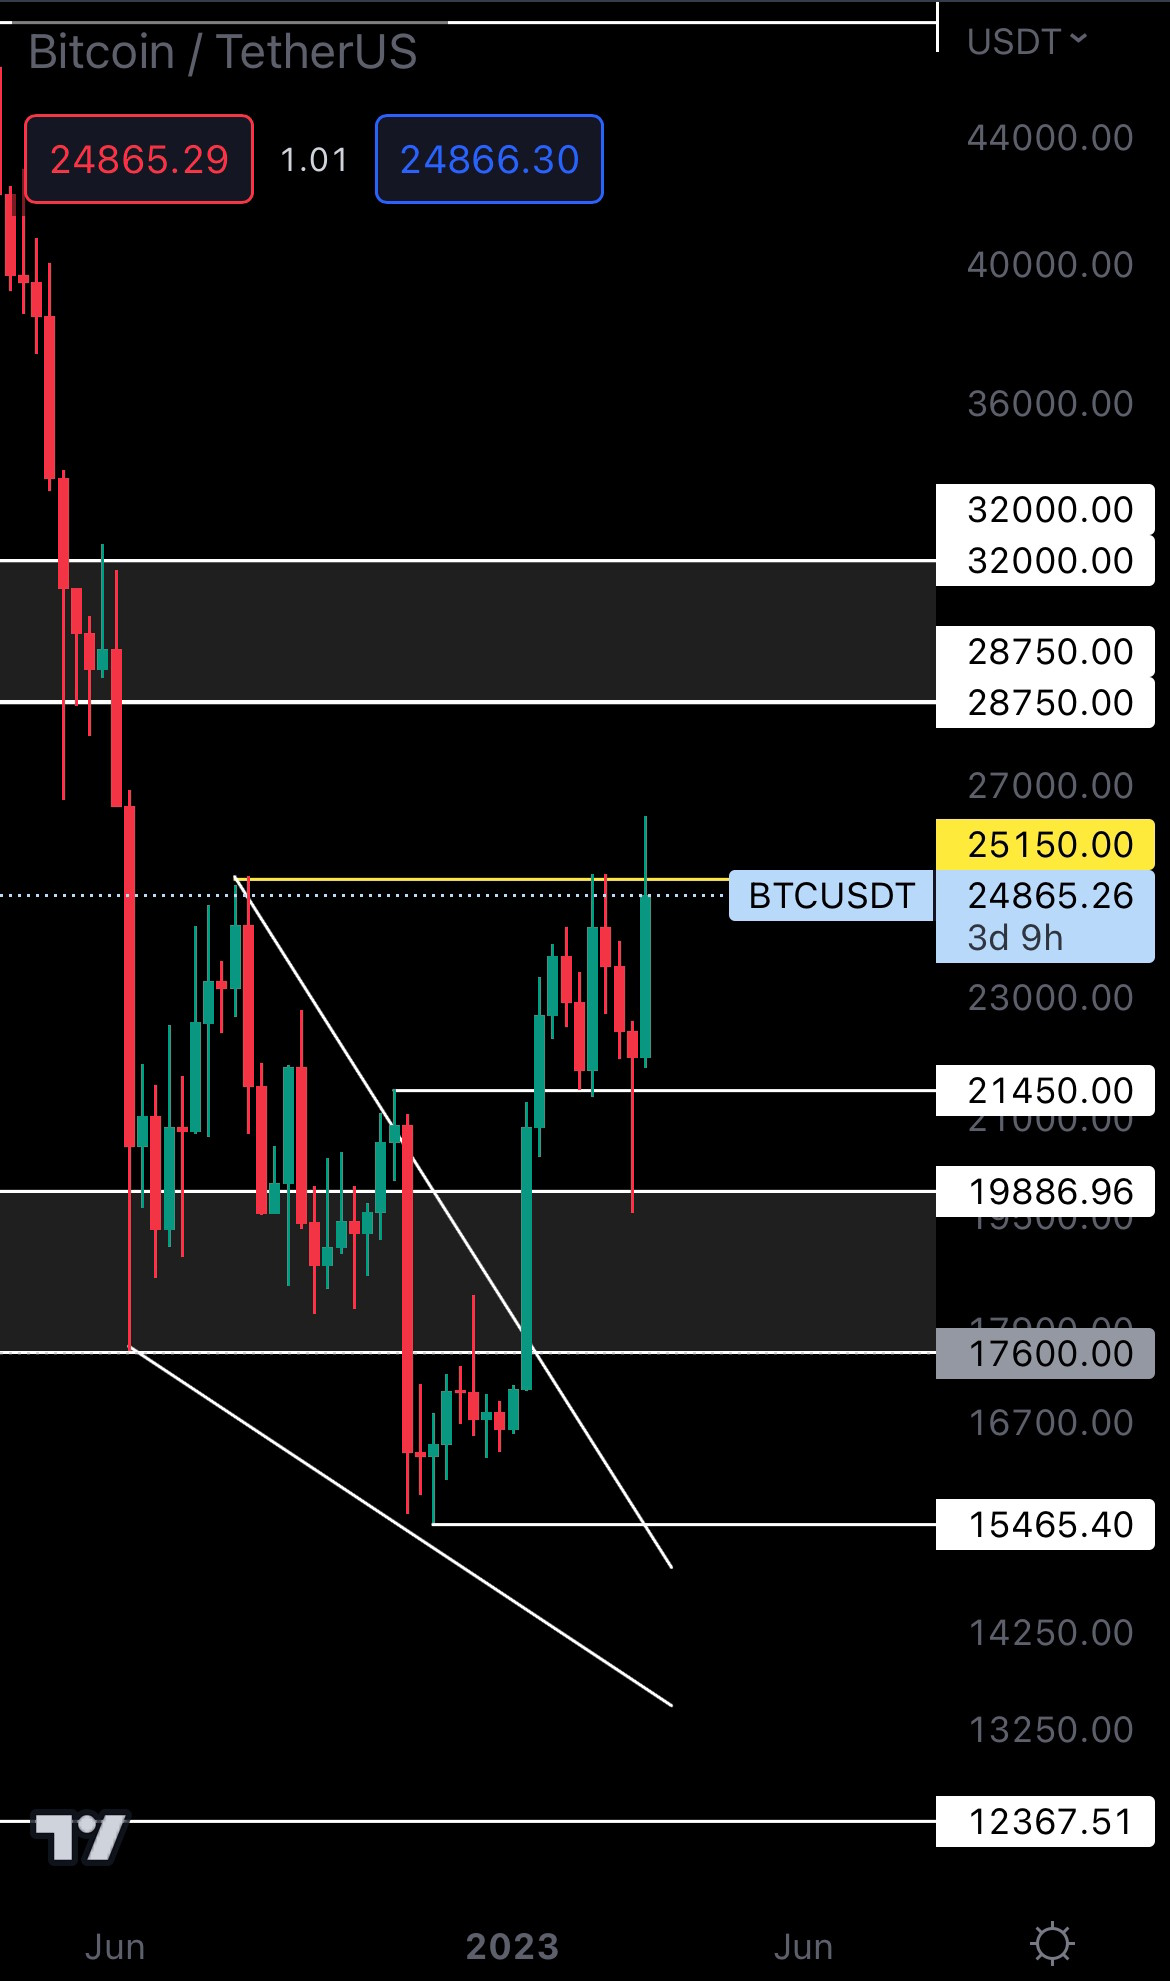 We’re just over 3 days away from this week’s candle closure, and Bitcoin is handling itself pretty well, all things considered.
Our main priority here is a weekly closure above $25,150. This would offer Bitcoin the chance to rally to $28,750 - $32,000. Alternatively, staying under $25,150 would result in Bitcoin ranging for some time until either $25,150 or $21,450 is broken.
We’re just over 3 days away from this week’s candle closure, and Bitcoin is handling itself pretty well, all things considered.
Our main priority here is a weekly closure above $25,150. This would offer Bitcoin the chance to rally to $28,750 - $32,000. Alternatively, staying under $25,150 would result in Bitcoin ranging for some time until either $25,150 or $21,450 is broken.
ETH | Ethereum (Weekly)
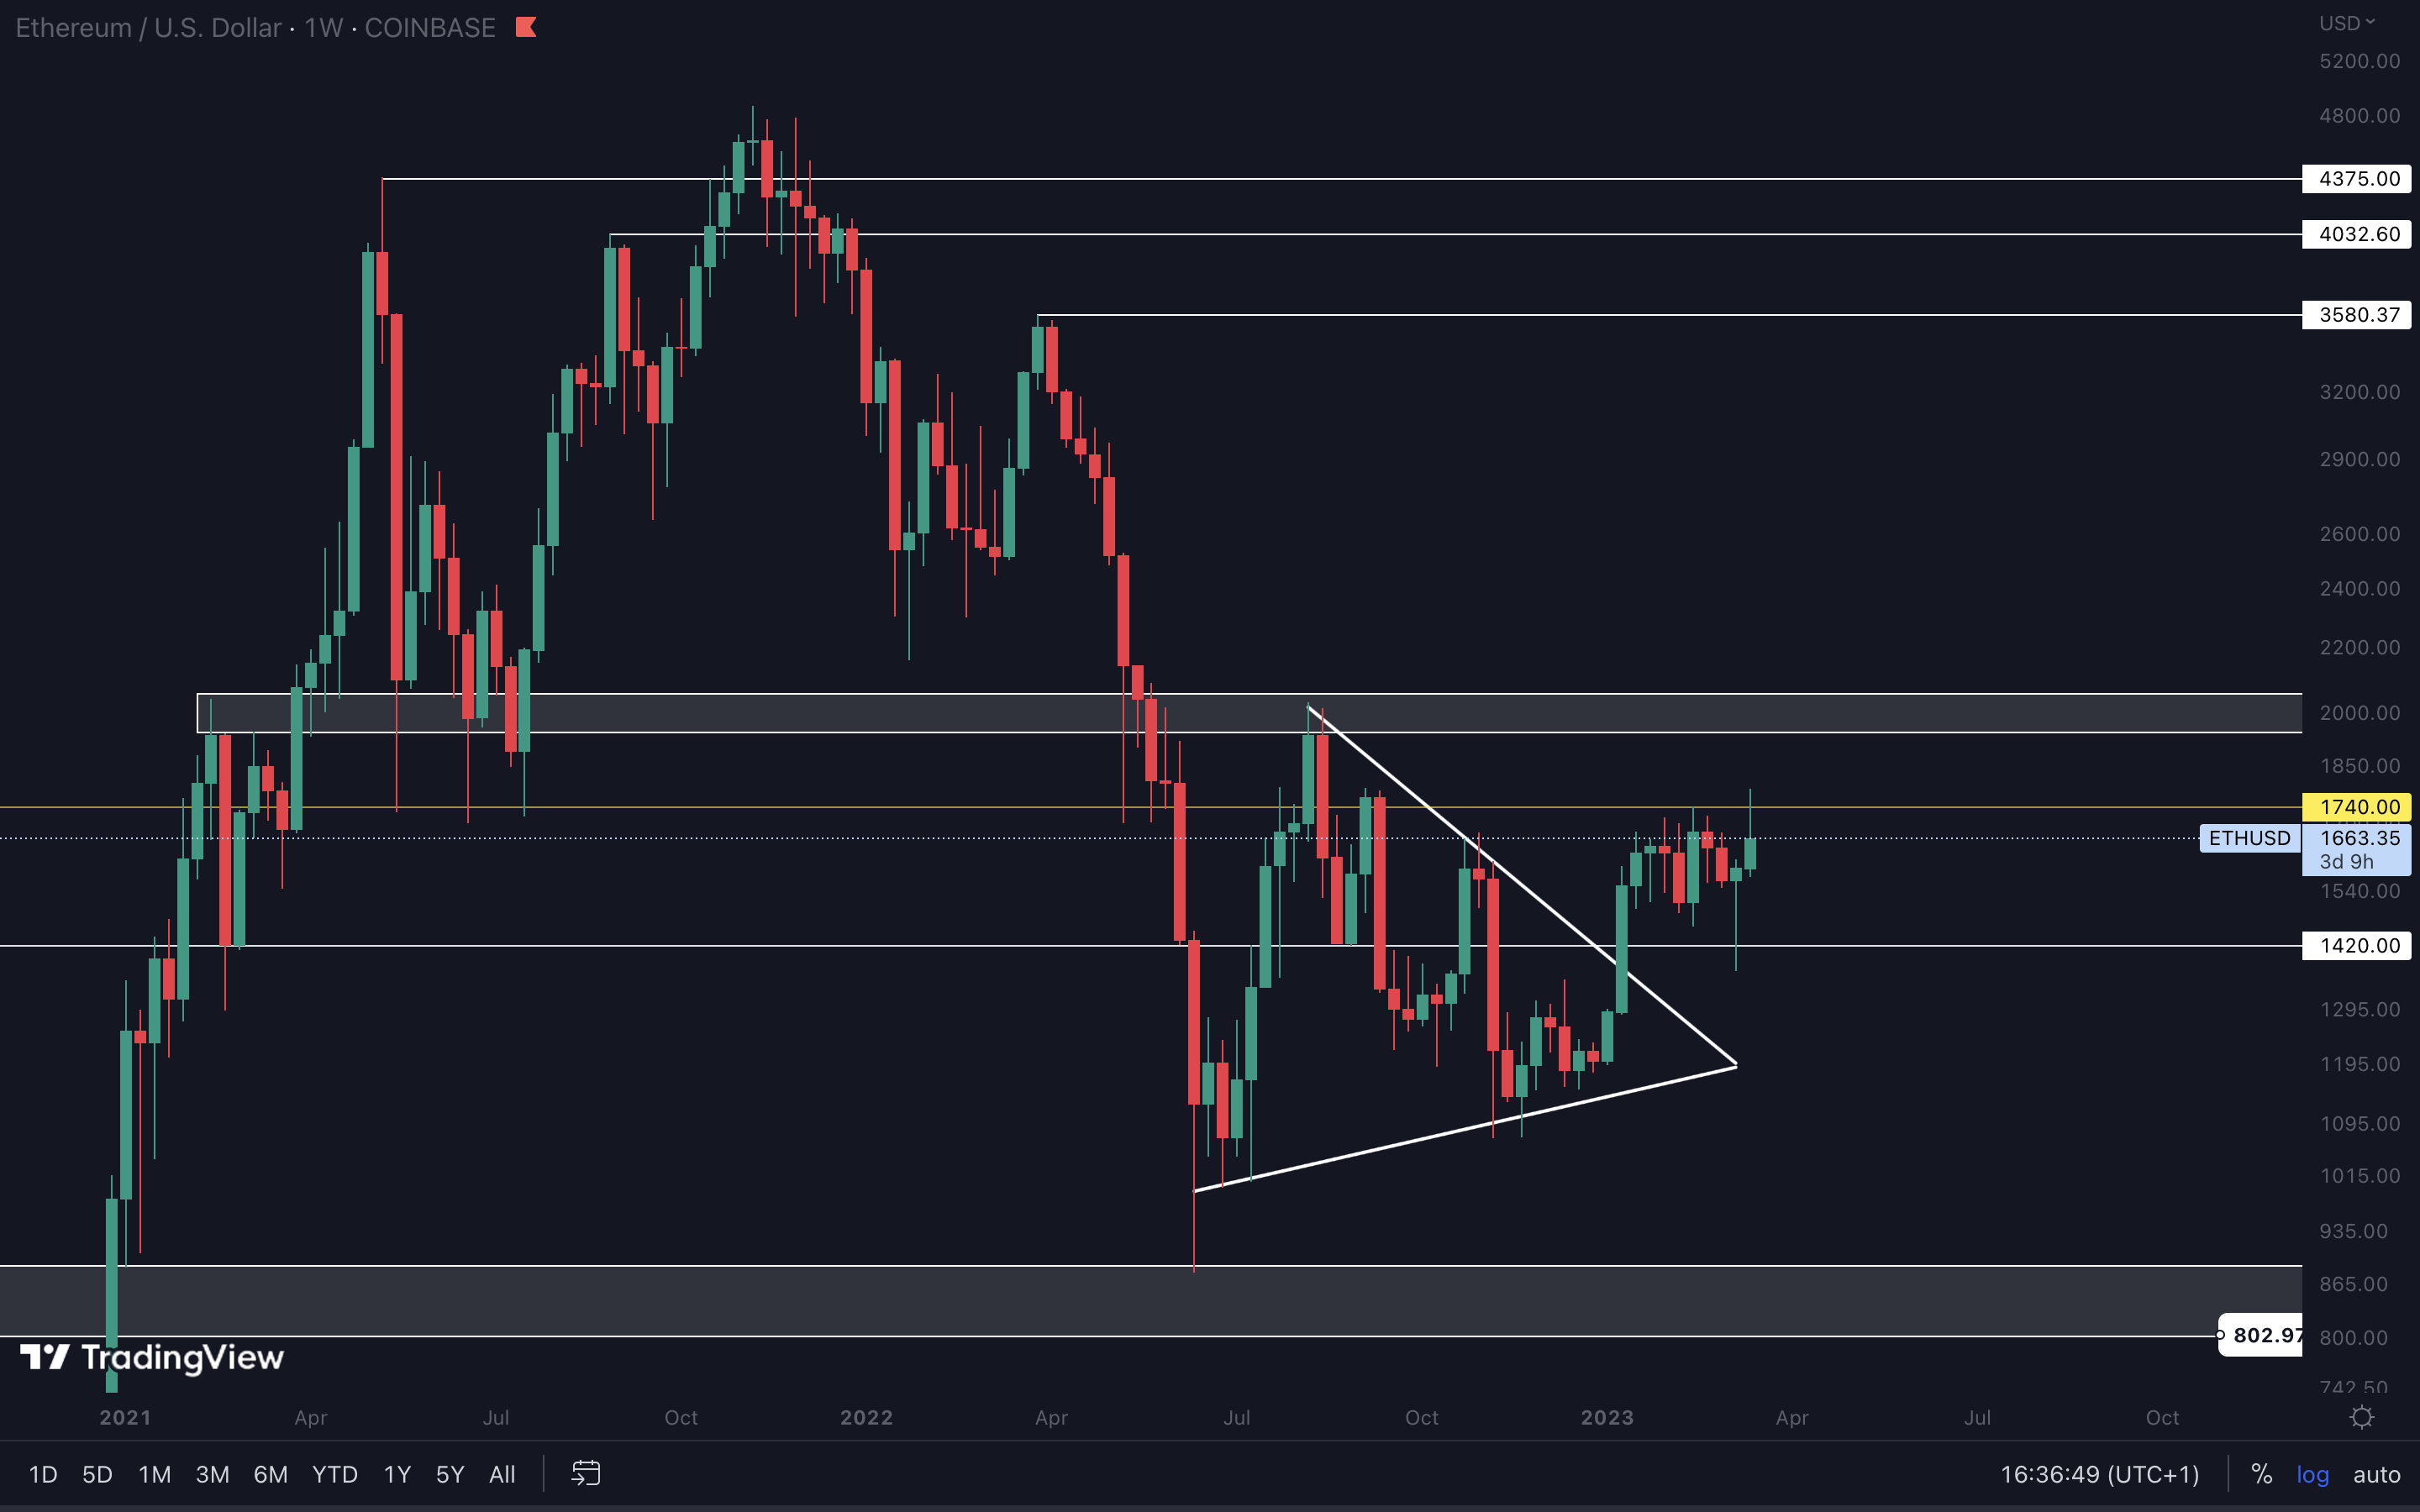
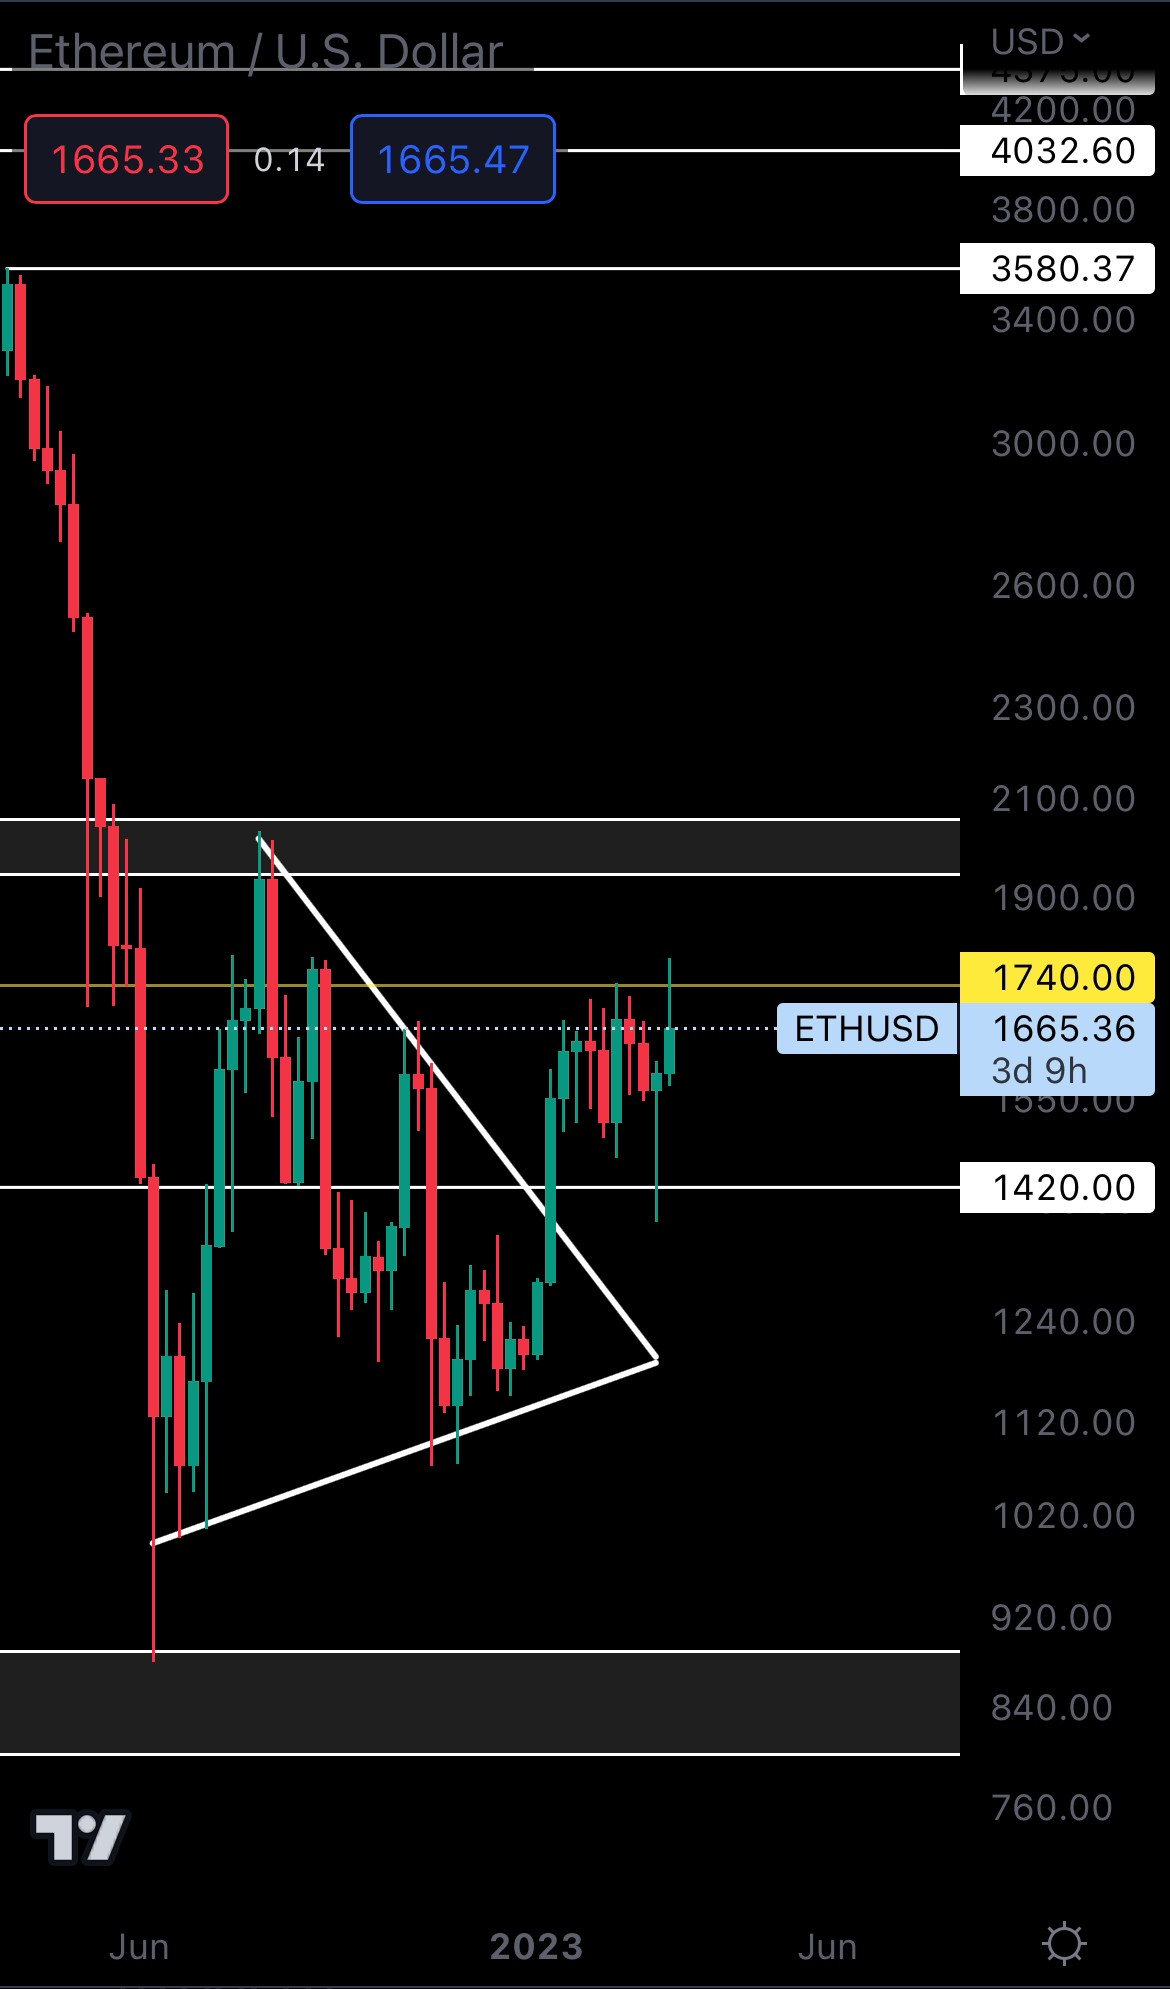 Ether managed to break above $1740 for the first time in over 6 months, but we can already see some selling pressure coming in. For upside to continue, Ether will have to close a weekly candle above this level.
Otherwise, ranging between $1740 and $1420 is the probable outcome.
BNB | Binance (Weekly)
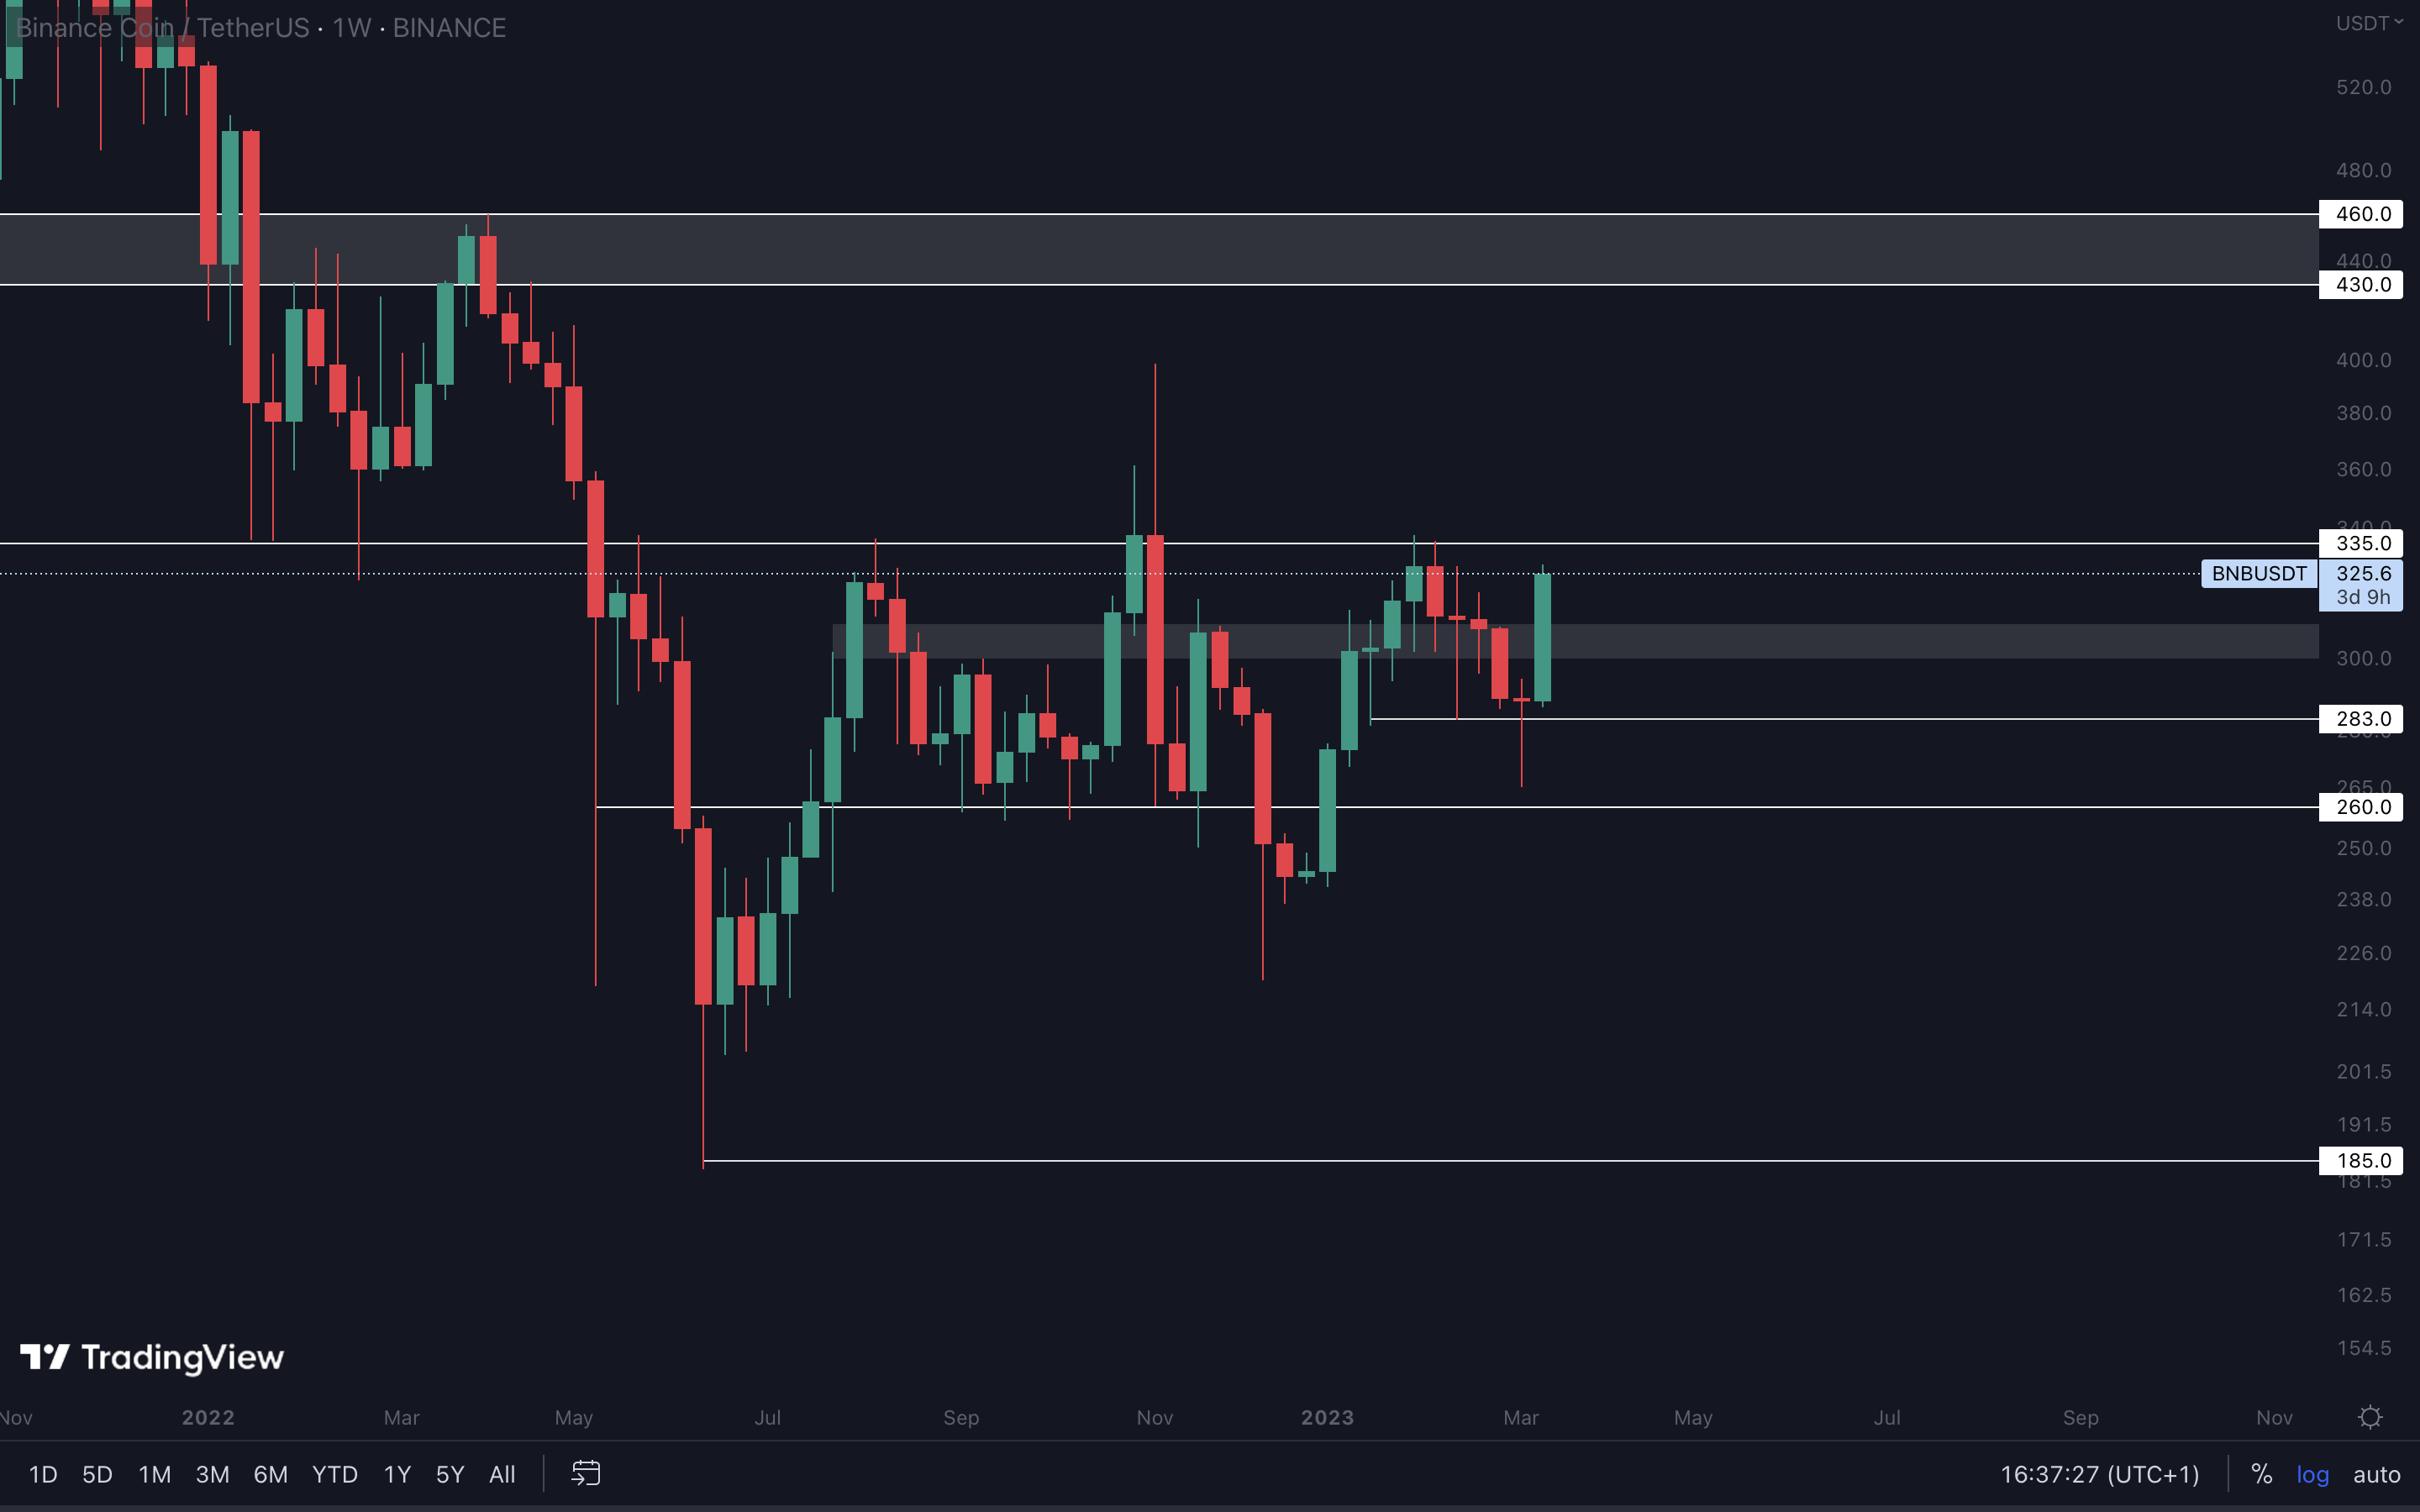
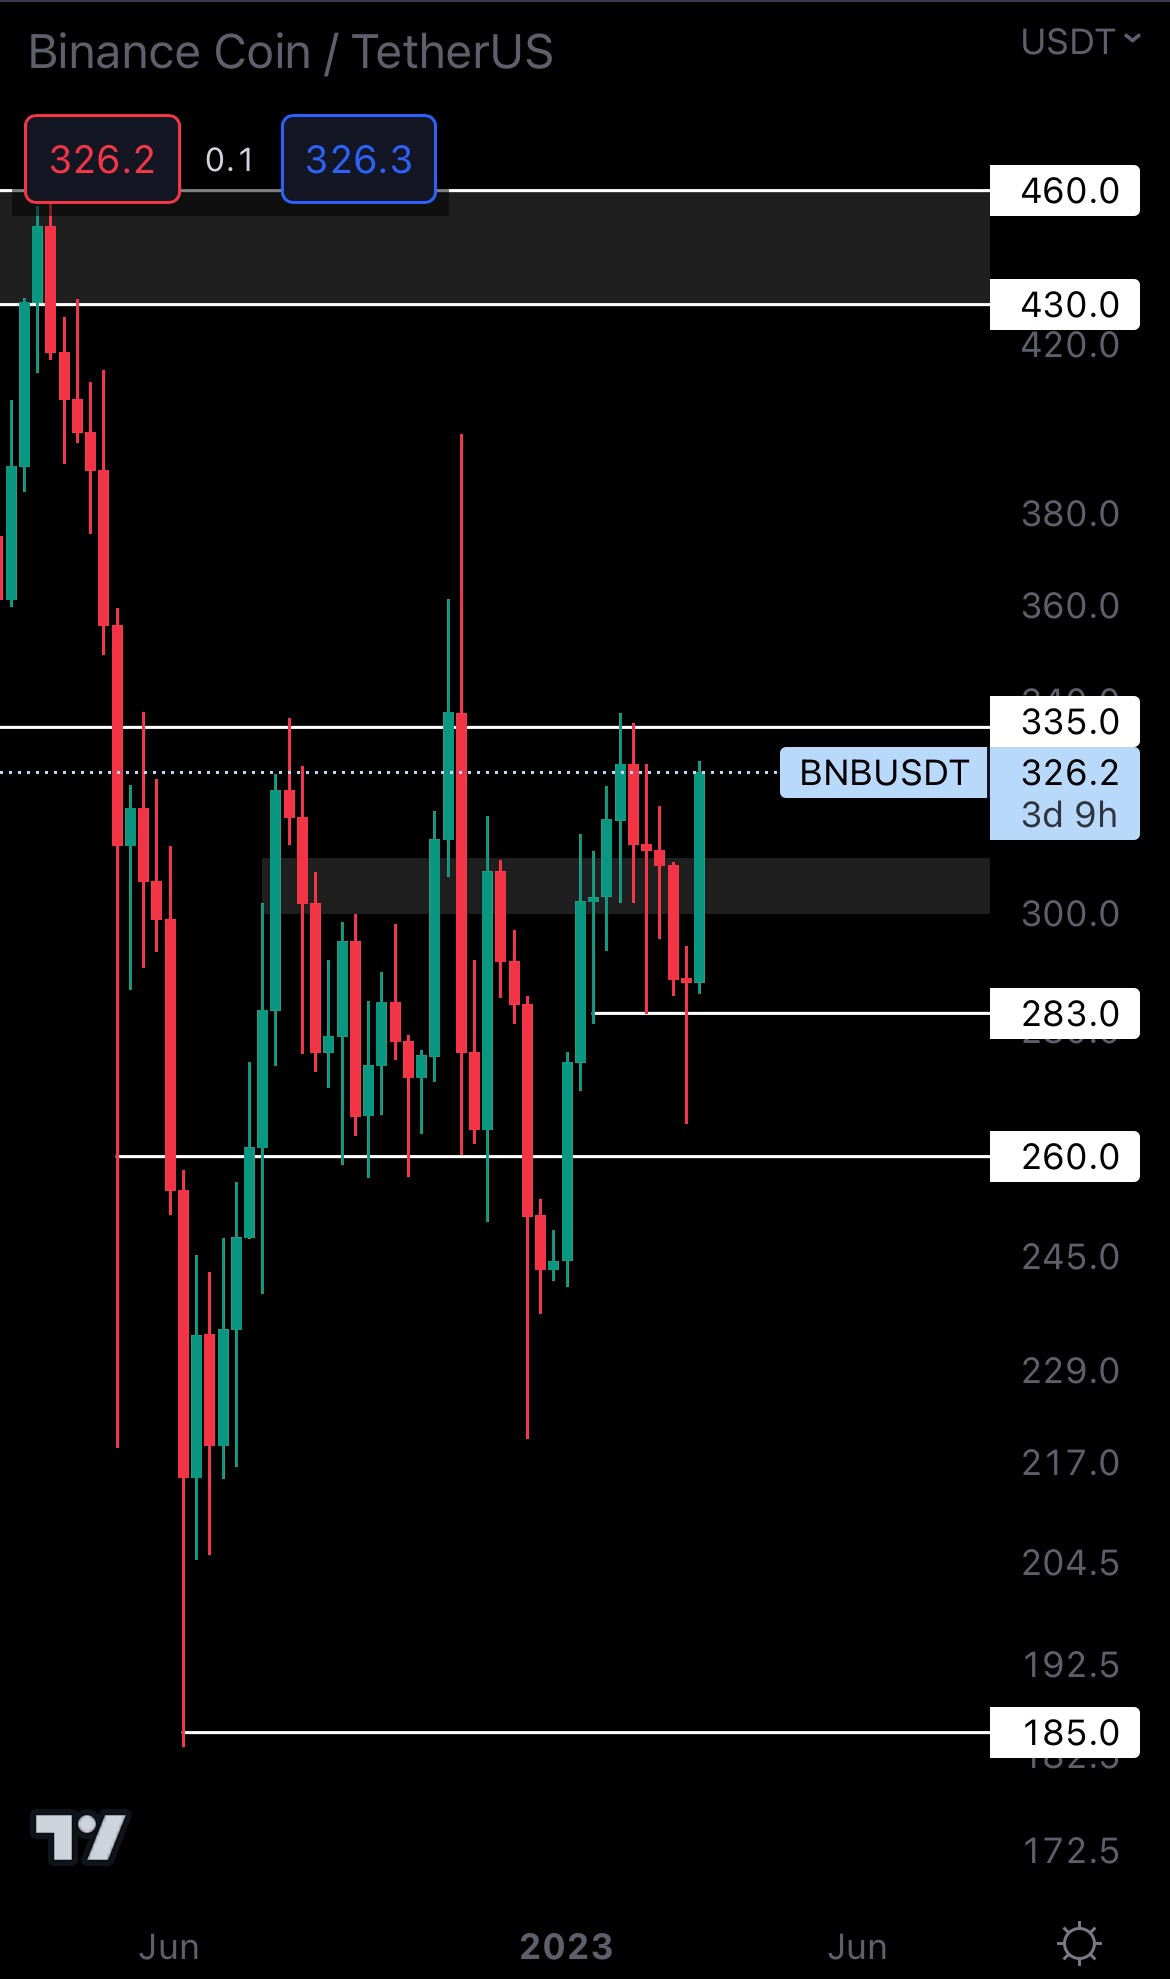 Surprisingly, BNB is one of a few altcoins reacting pretty well right now. It’s currently above resistance (grey rectangle between $310 and $300) and it is on track for $335.
We can also see that because of this week’s performance, last week’s candle has become a weekly higher low. From a technical standpoint, BNB should now be heading for a higher high, and that translates to a weekly break above $335.
The above is in confluence with the market, so chances are BNB will break above $335 in the coming weeks.
XRP | XRP (Weekly)
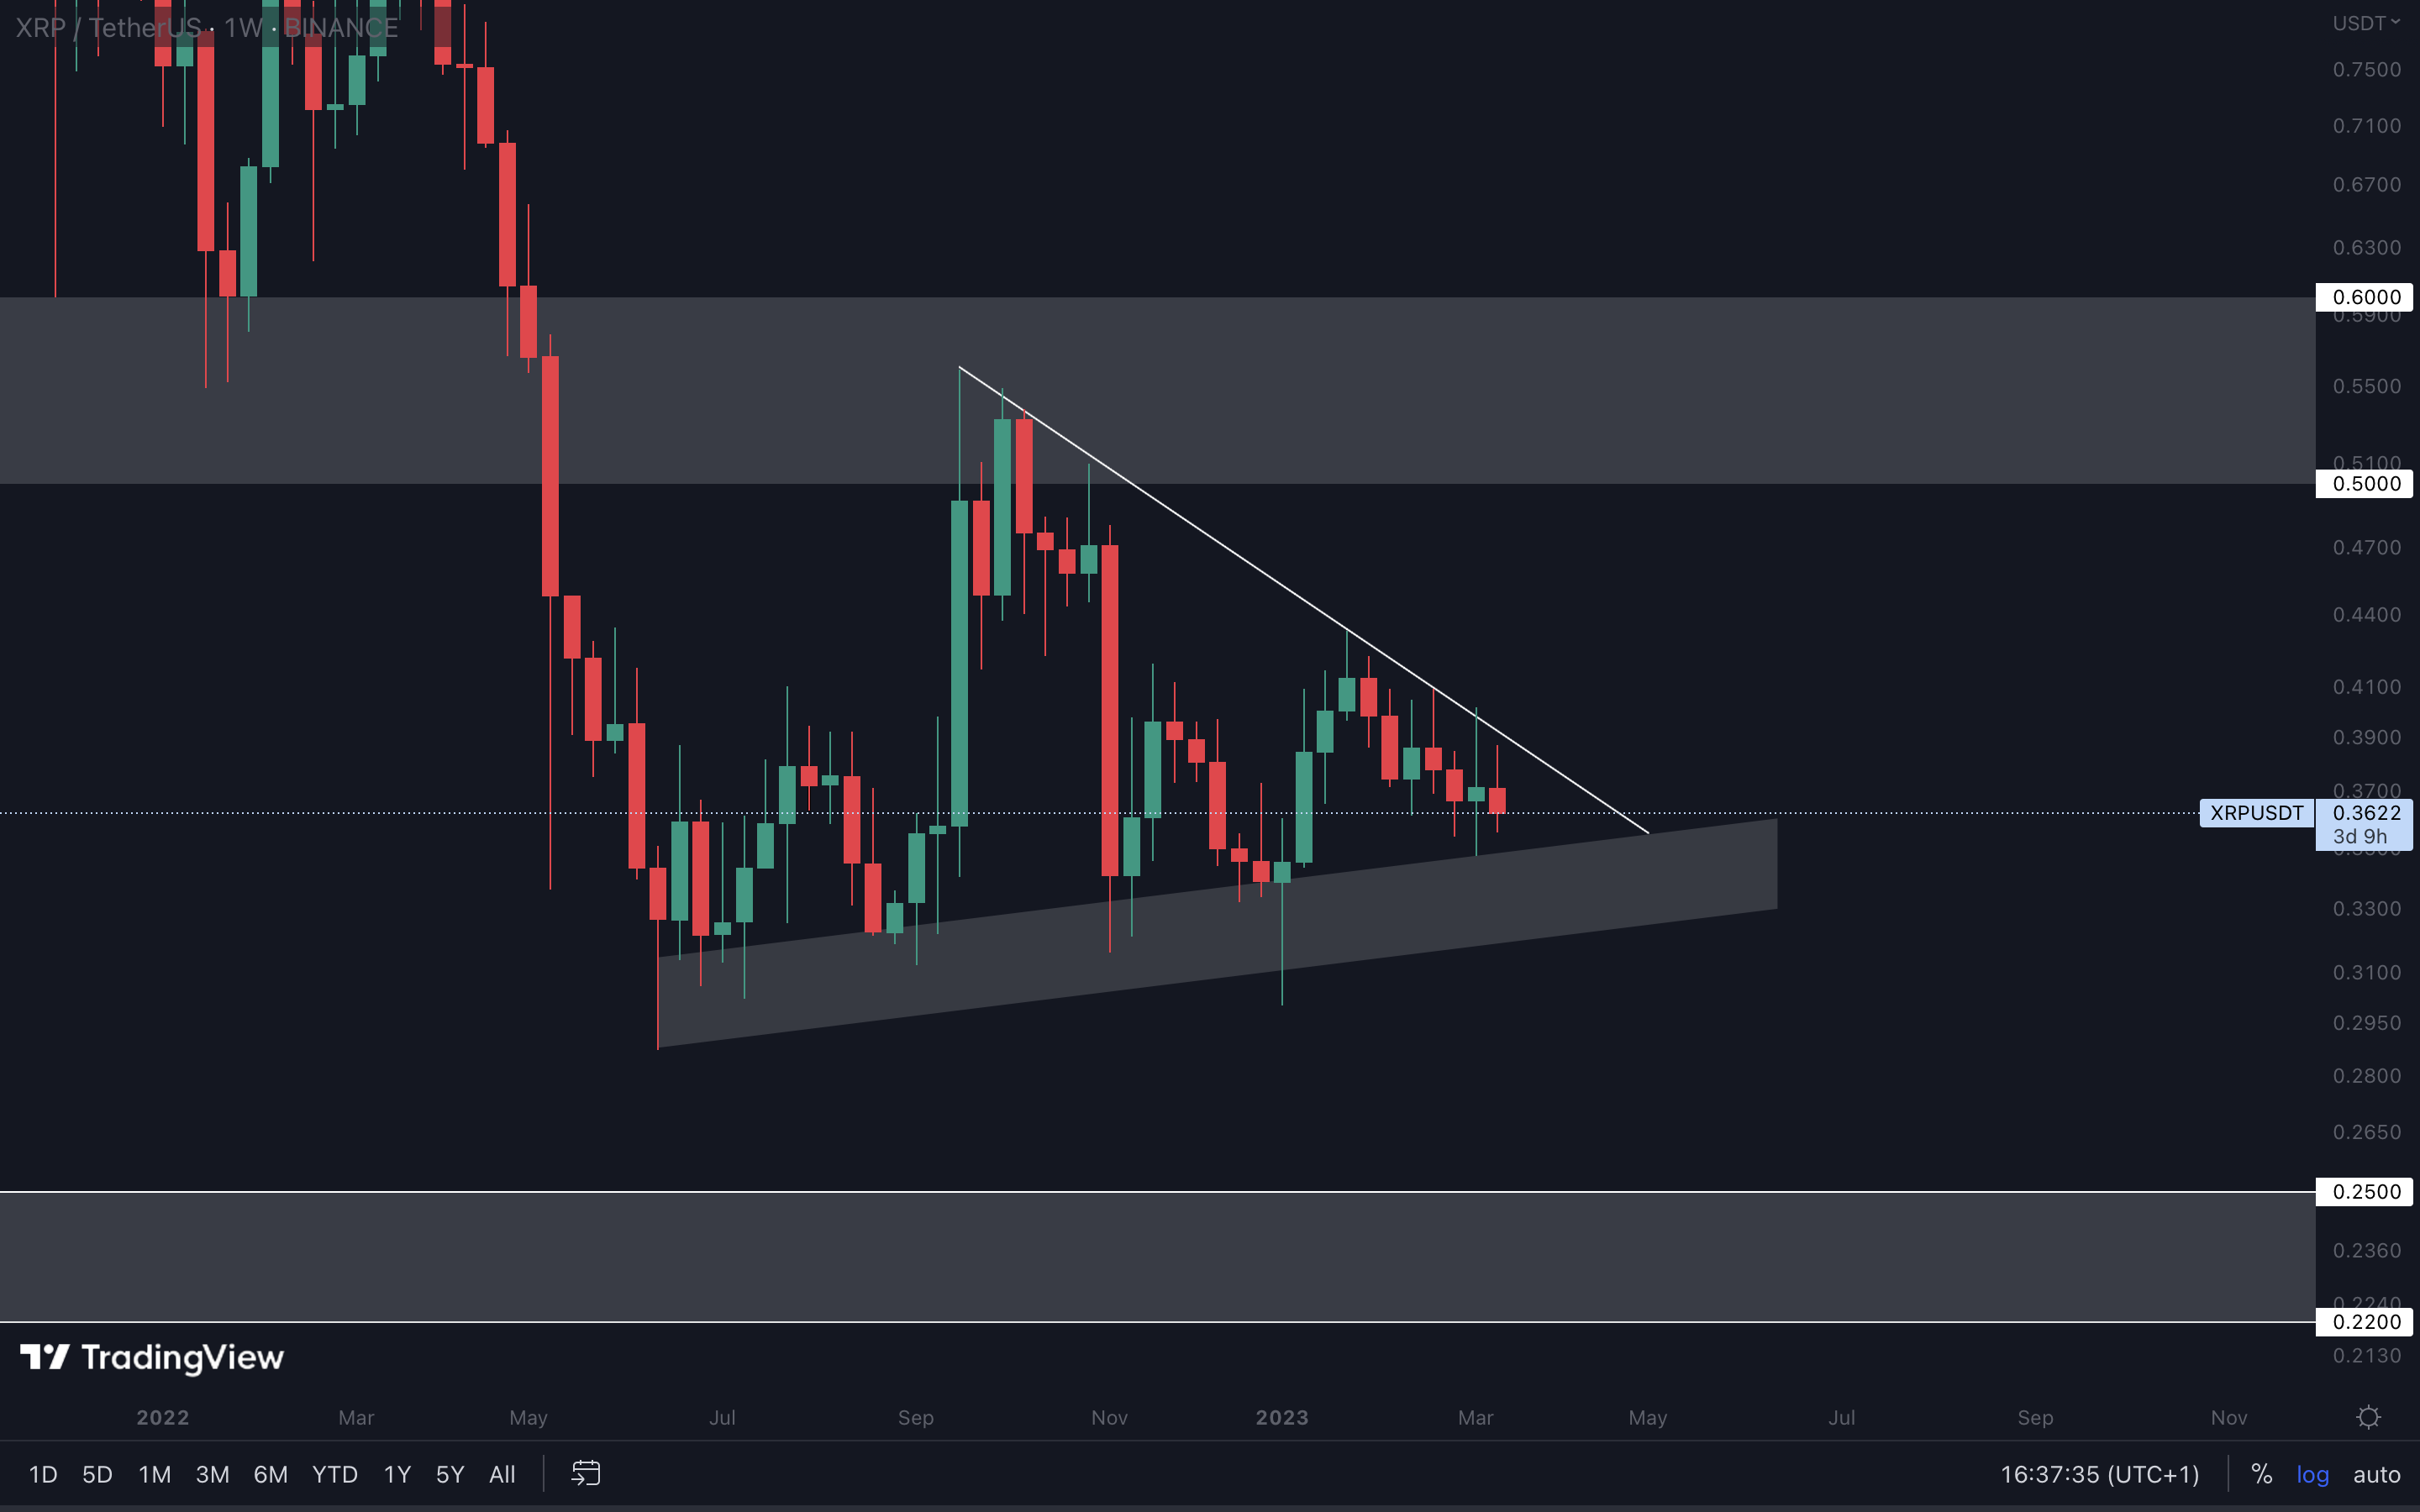
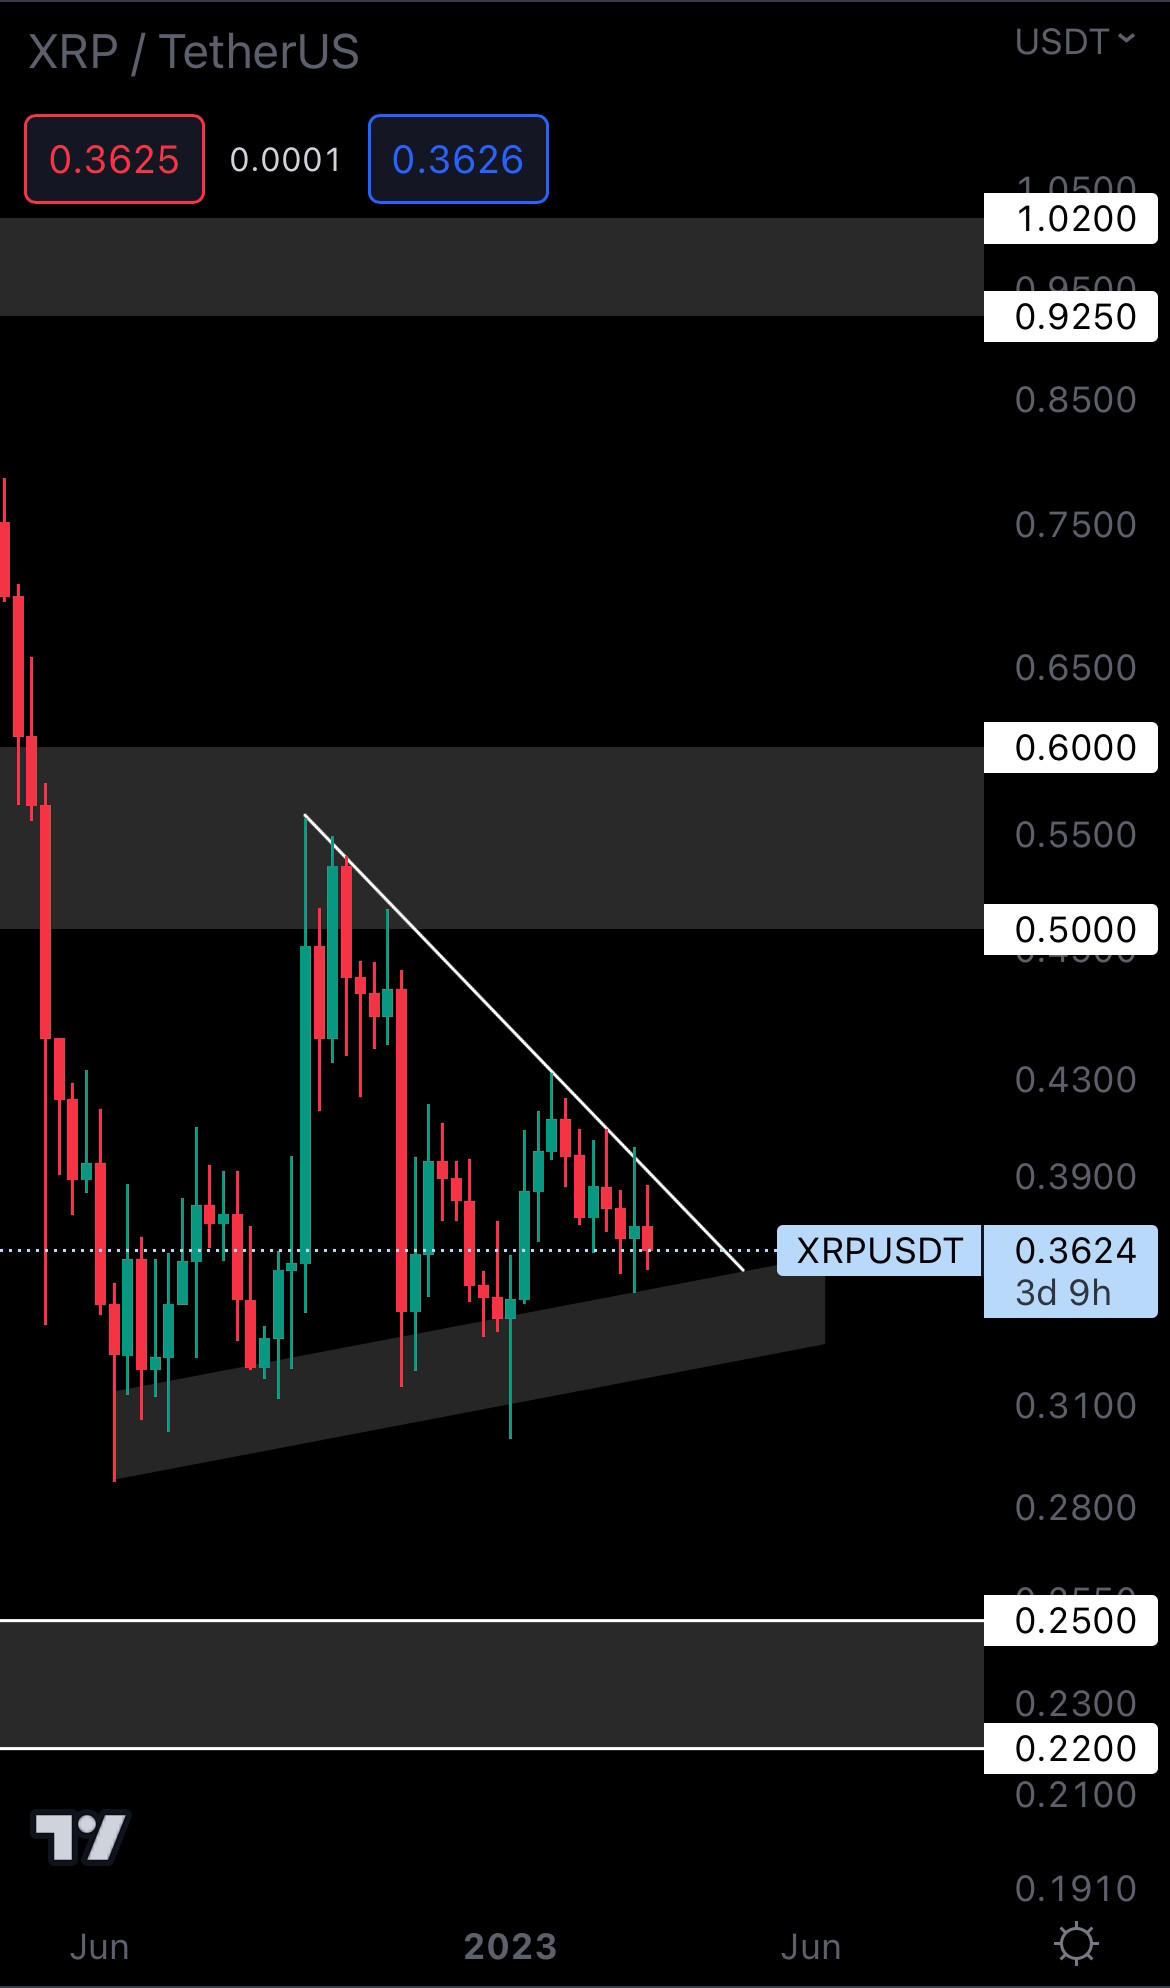 No changes have occurred for XRP, but we’ll remind you of this:
XRP is trading in a symmetrical triangle and is approaching a breakout. The asset will break in either direction in the next 30 days as that’s where the pattern ends.
No changes have occurred for XRP, but we’ll remind you of this:
XRP is trading in a symmetrical triangle and is approaching a breakout. The asset will break in either direction in the next 30 days as that’s where the pattern ends.
ADA | Cardano (Weekly)
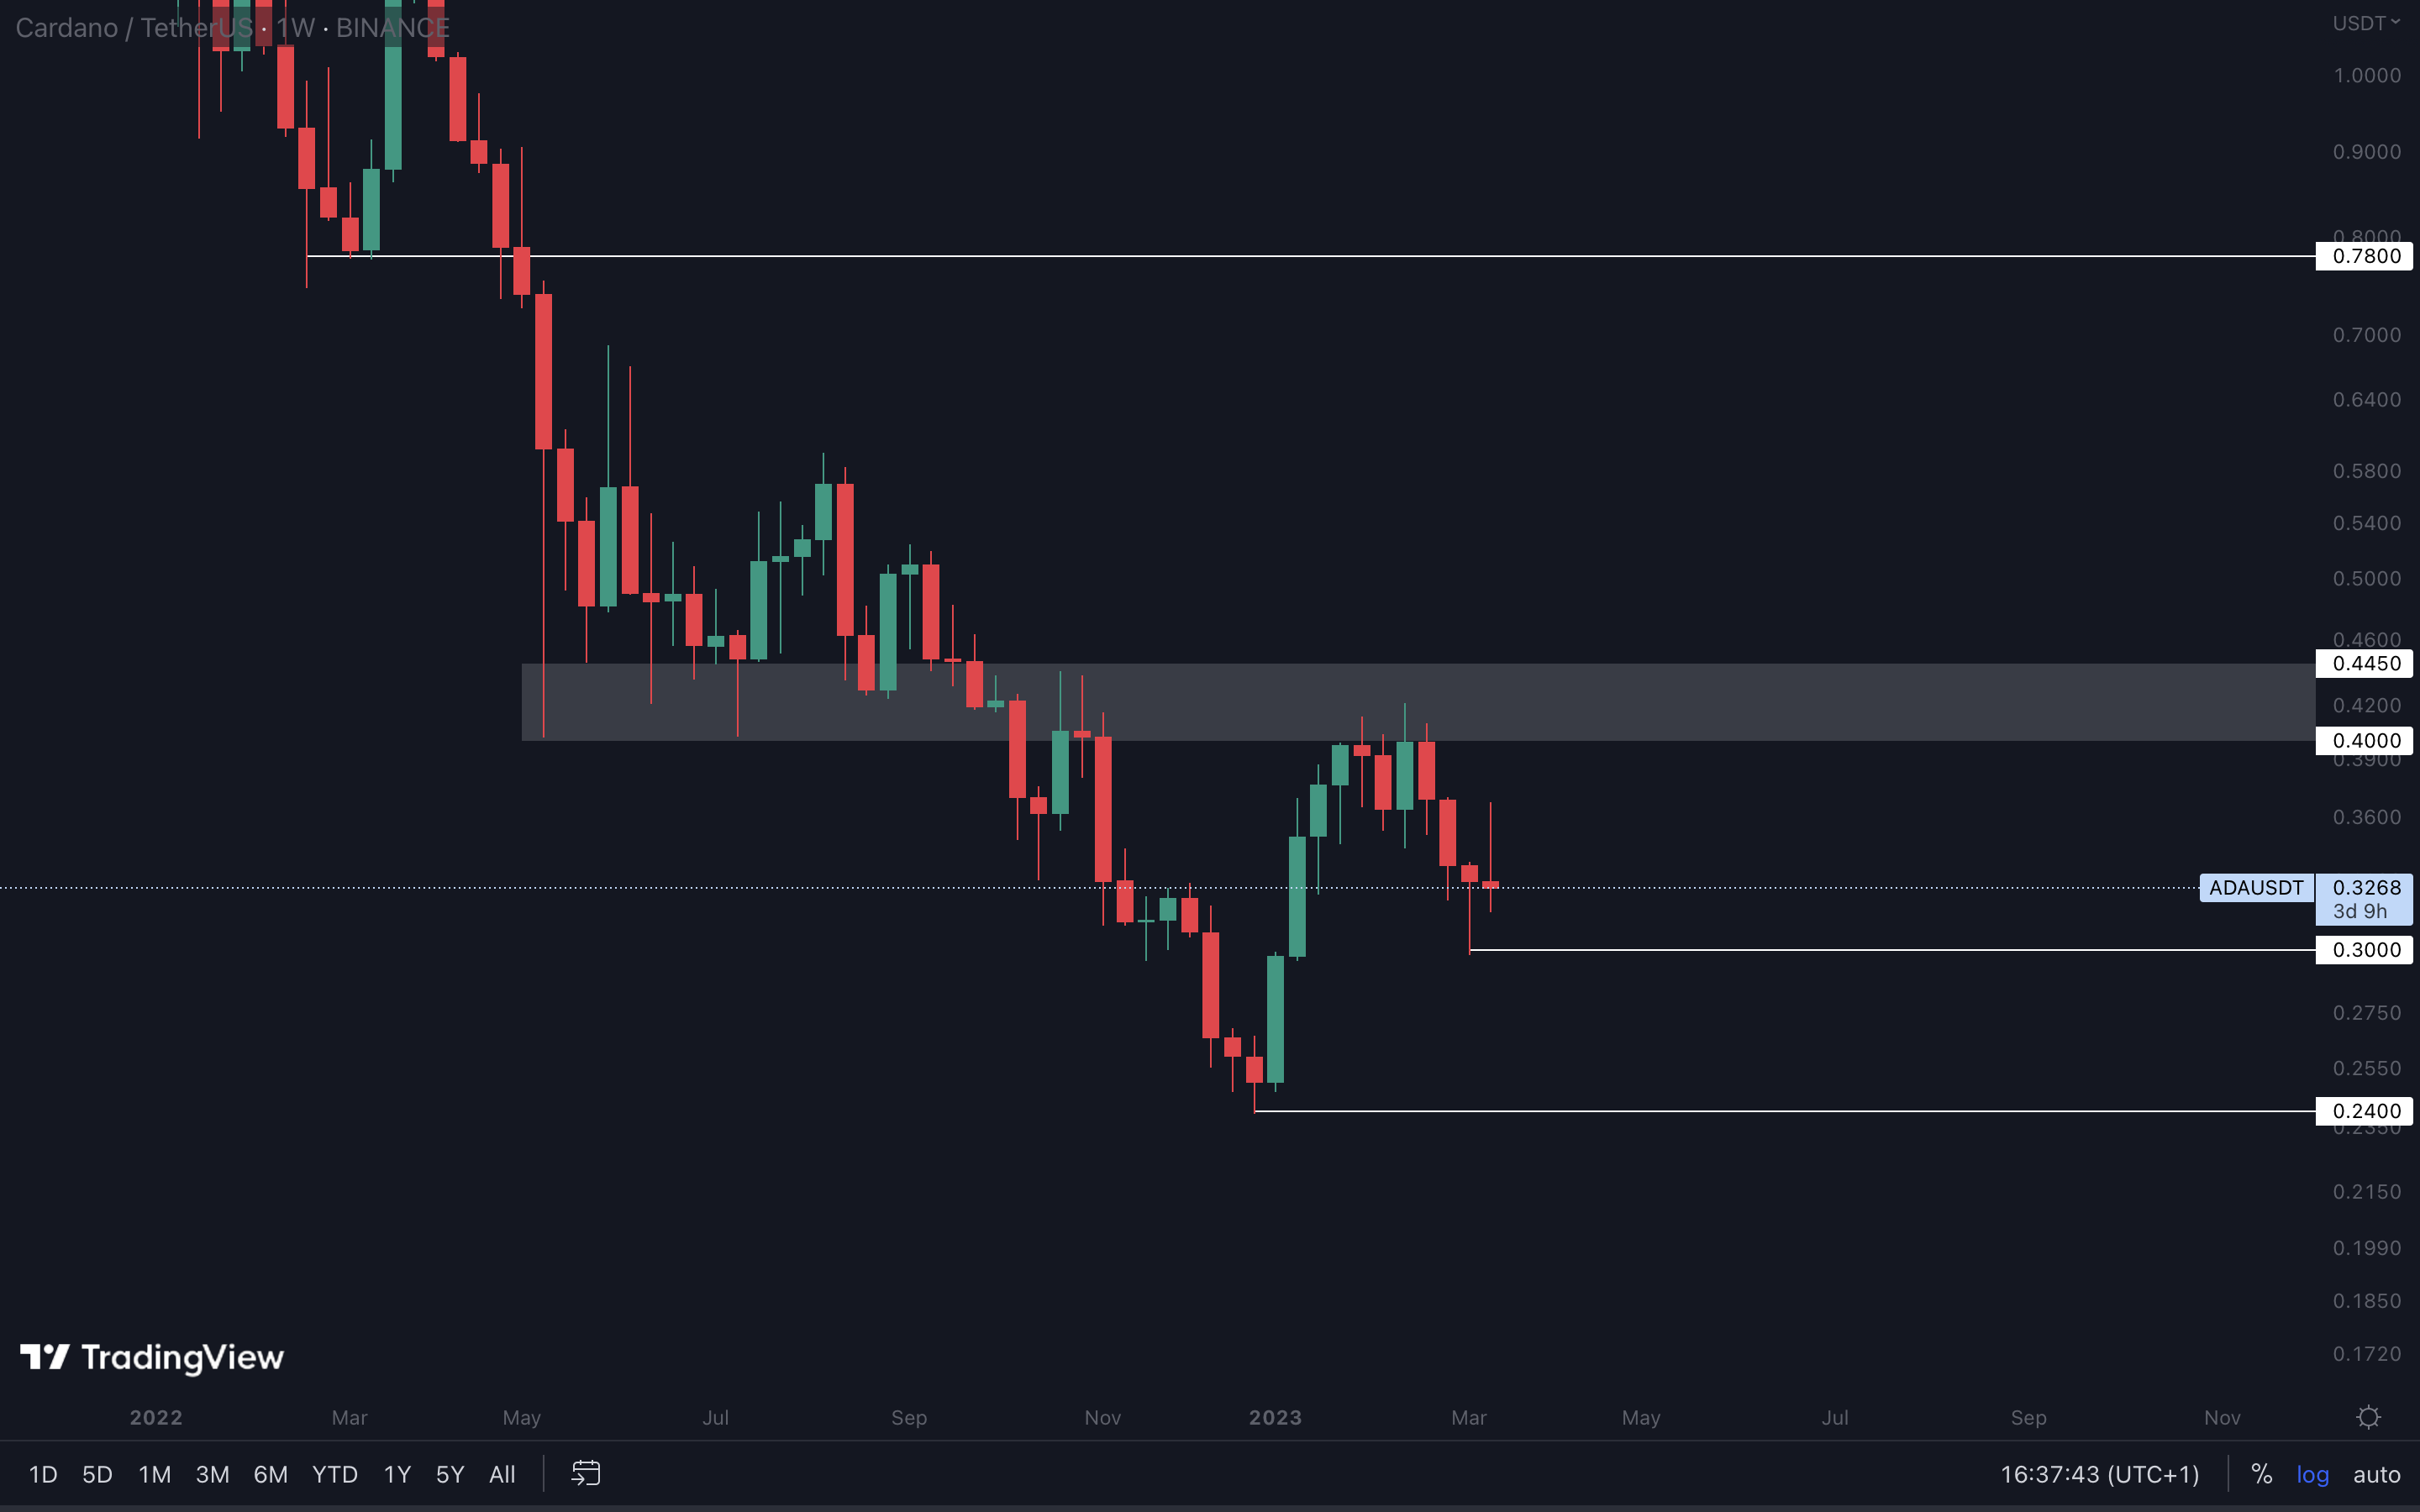
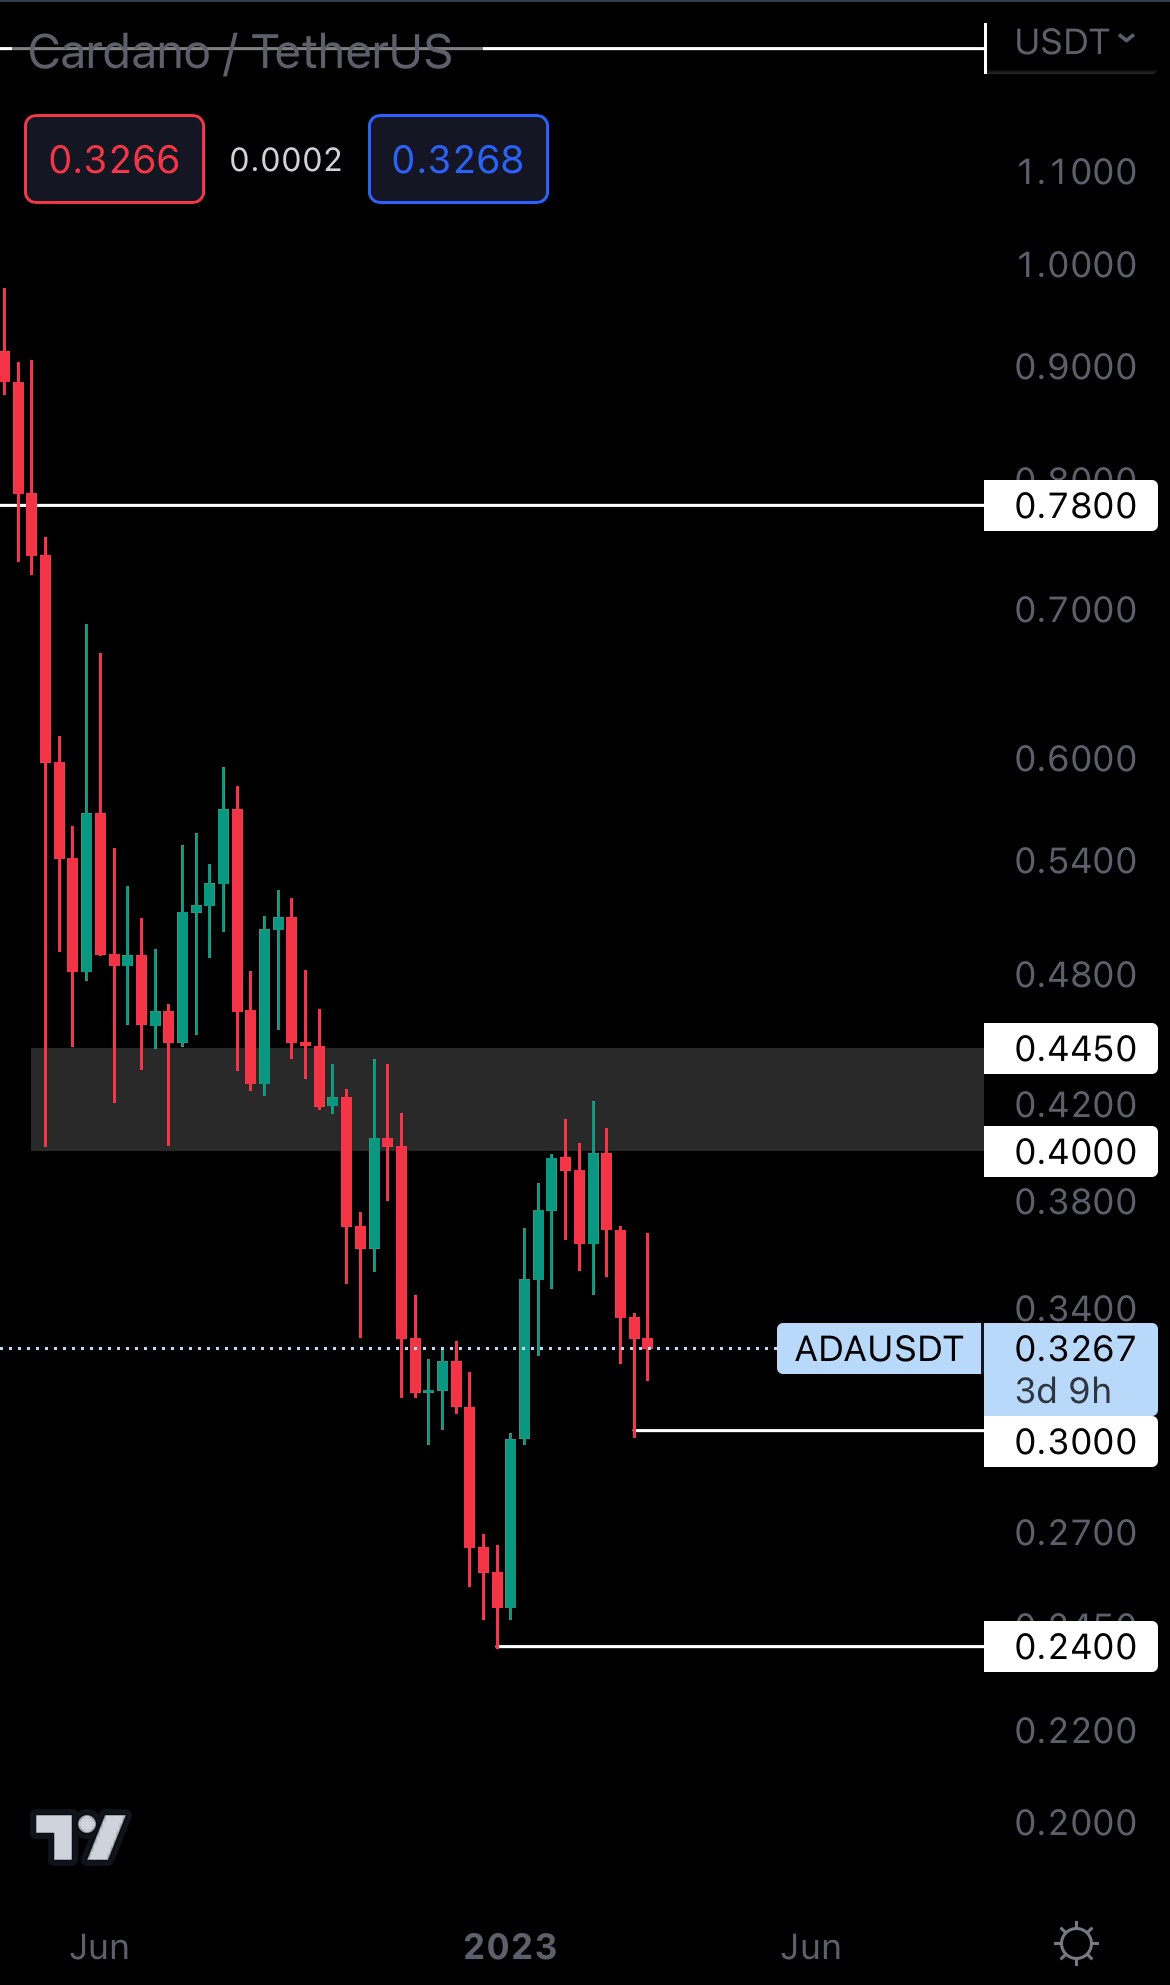 Despite the market rising significantly this week and ADA also experiencing buying pressure, this has now been invalidated entirely and ADA’s candle is now red.
When paired with its macro trend (ADA has been going down for over 18 months), there’s no reason for us to believe that downside will not follow here. For that reason, ADA is heading for $0.30, the nearest support level.
DOGE | Dogecoin (Daily)
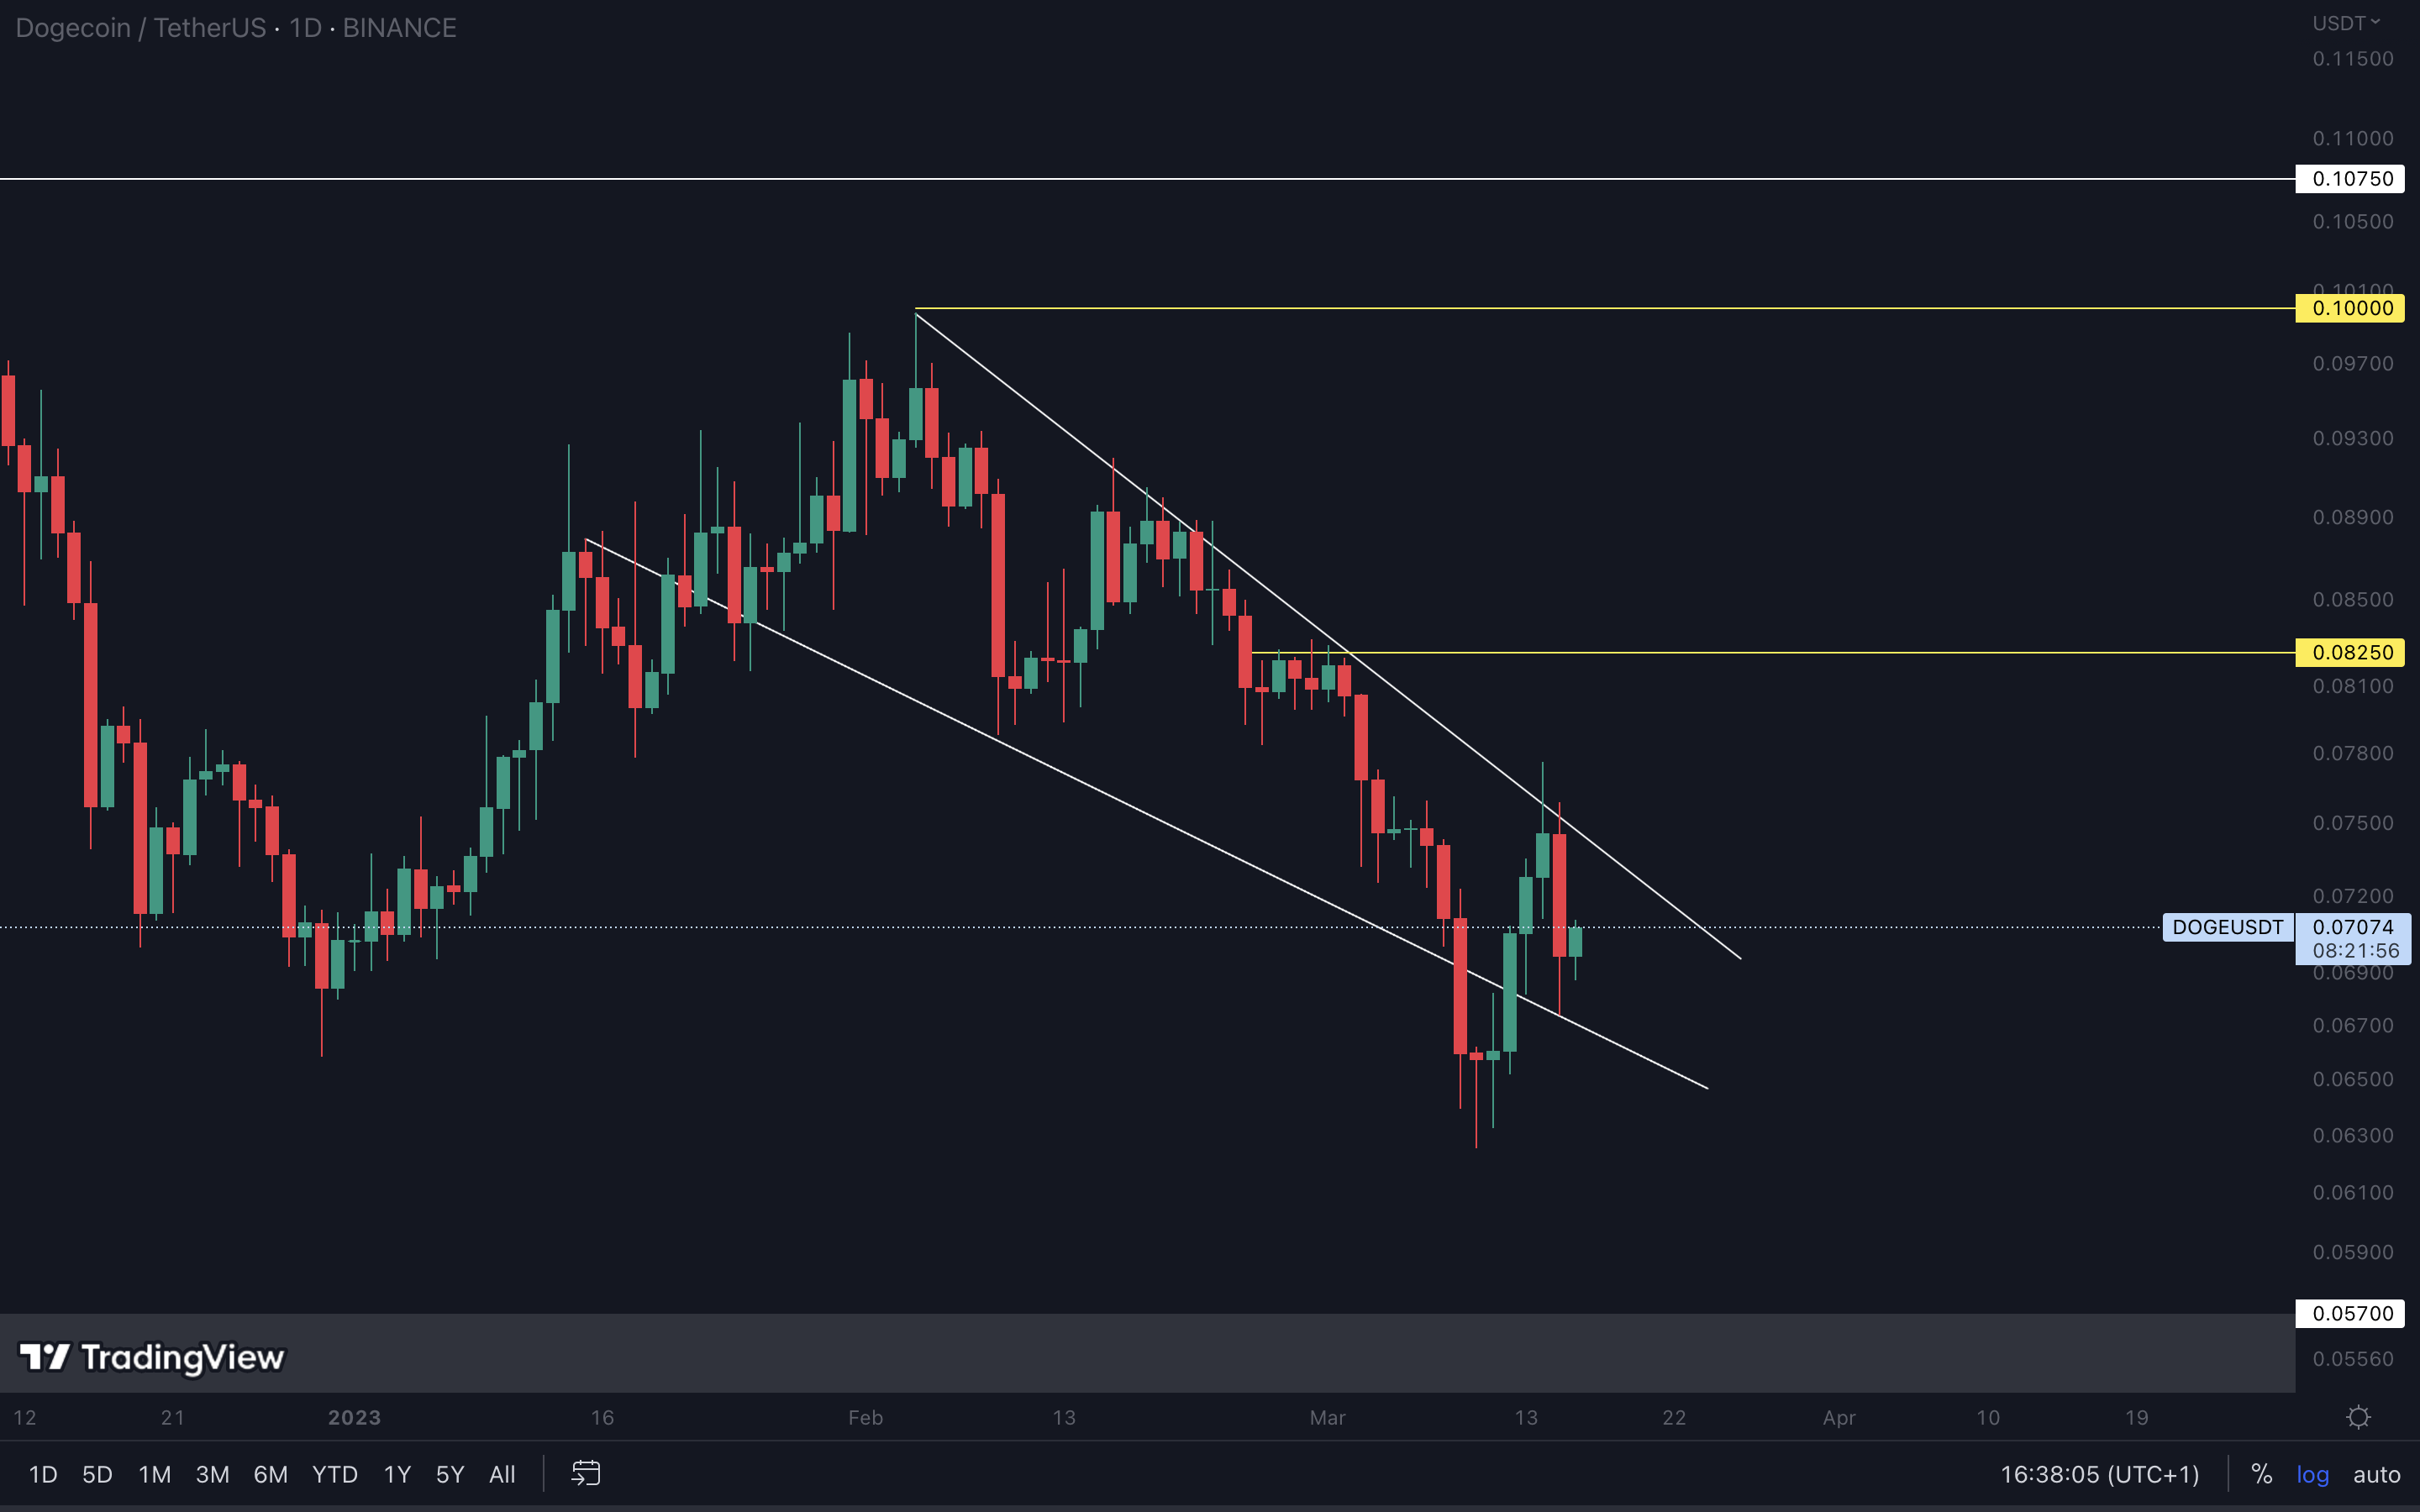
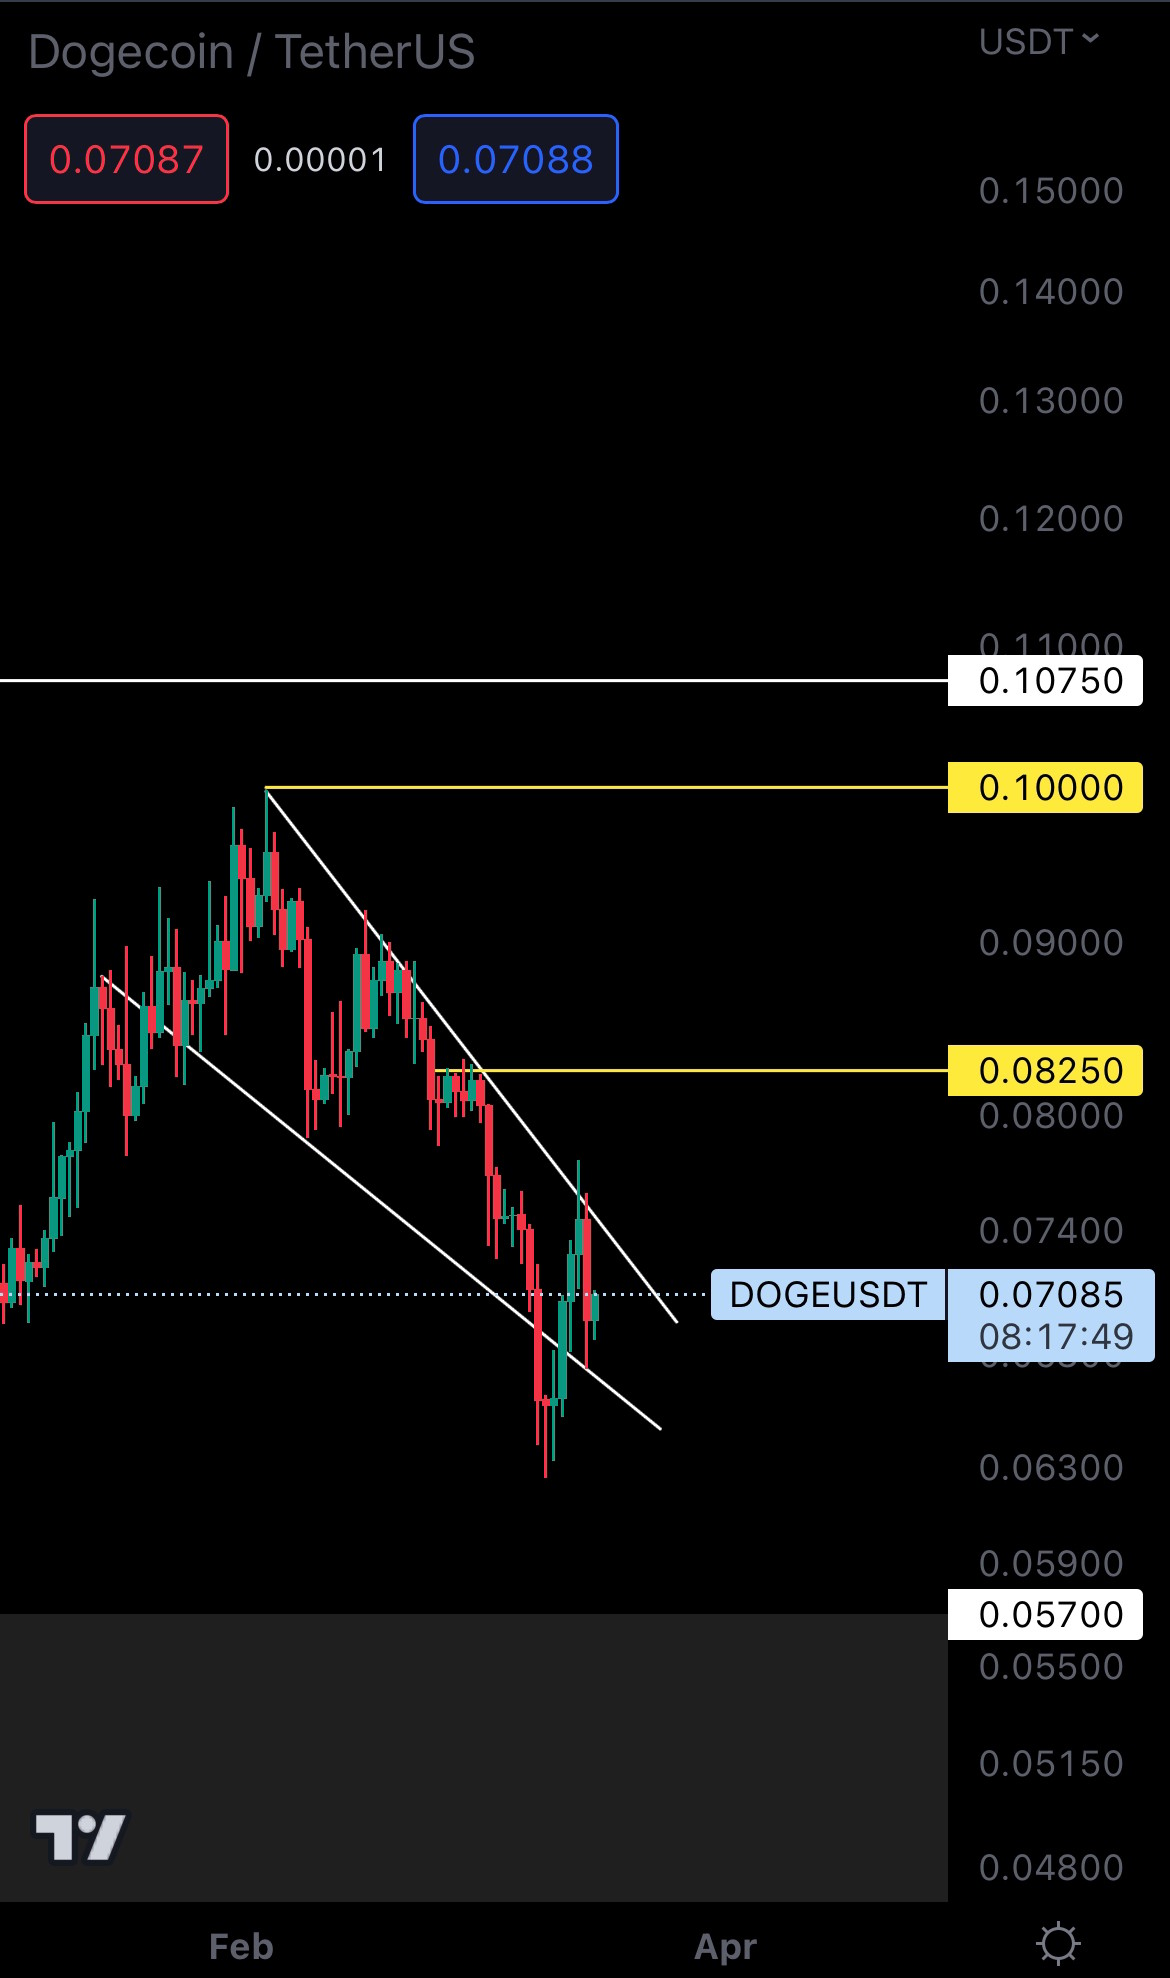 DOGE is back inside the falling wedge, but we can see that buyers are not totally in control yet.
Yesterday, a bearish engulfing formed right into the bottom trend line, and we may now see some ranging inside the pattern. Our prediction is that DOGE will break to the upside, but Bitcoin will have to close above $25,150 for this to happen.
MATIC | Polygon (Weekly)
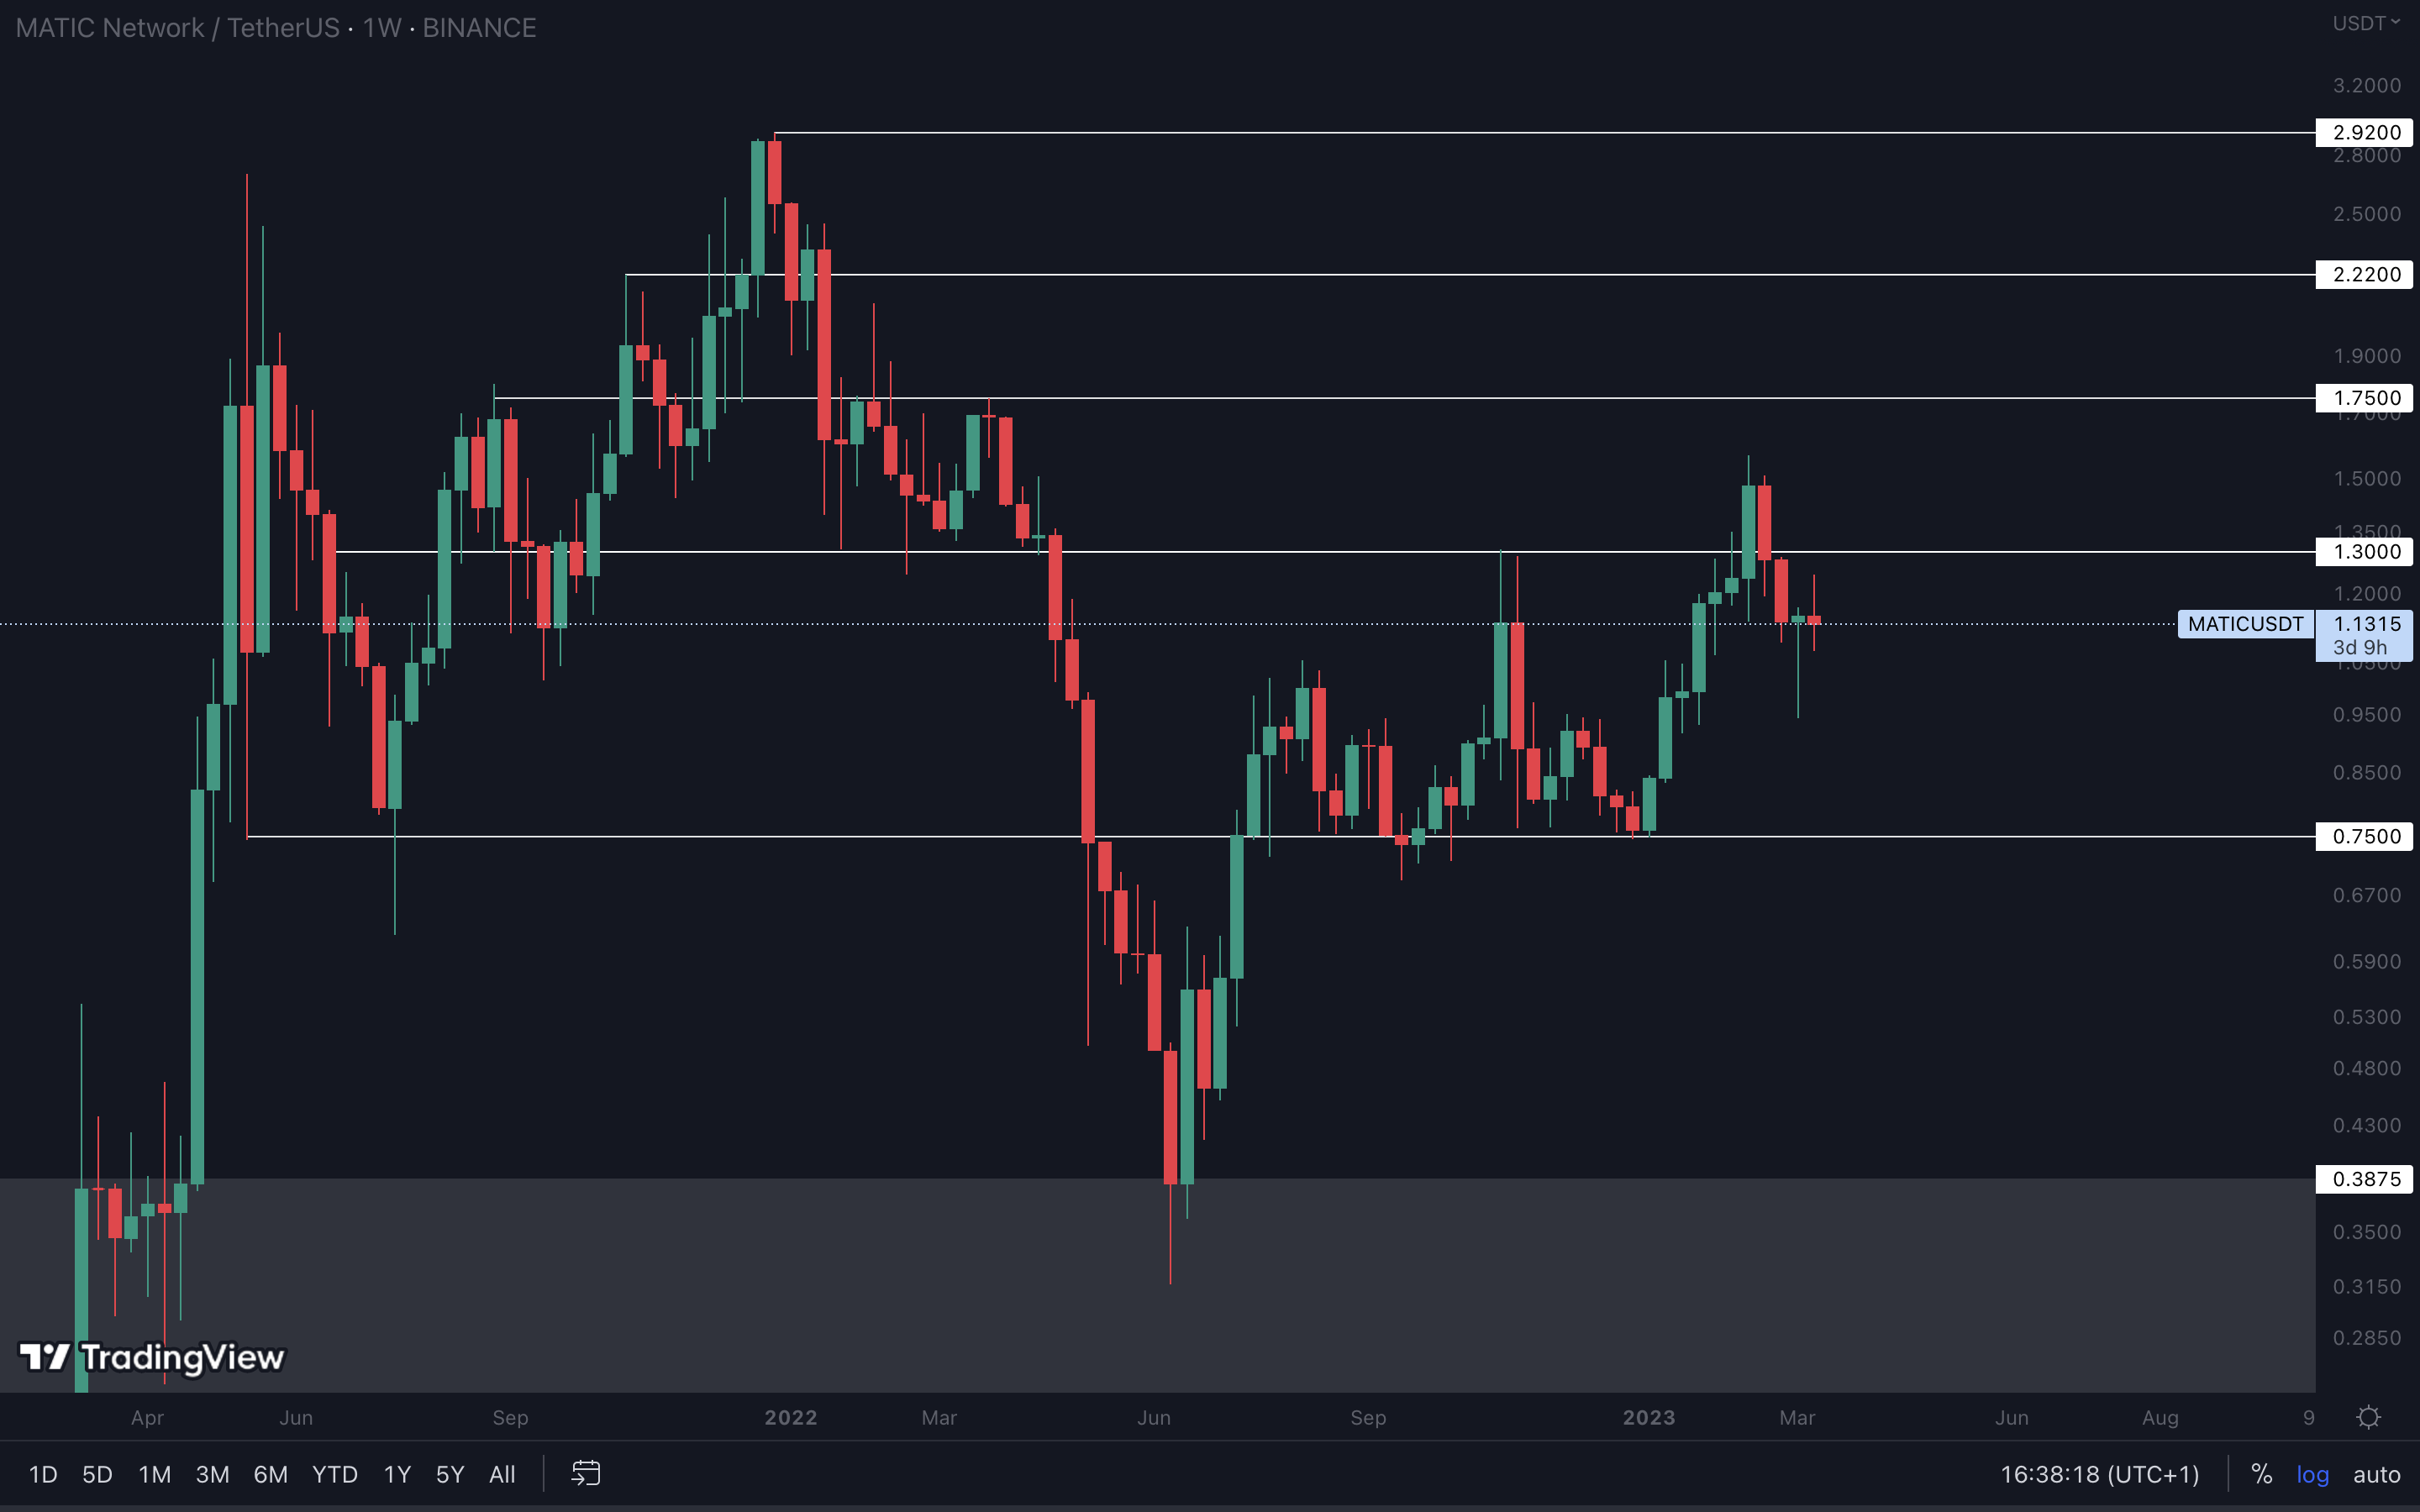
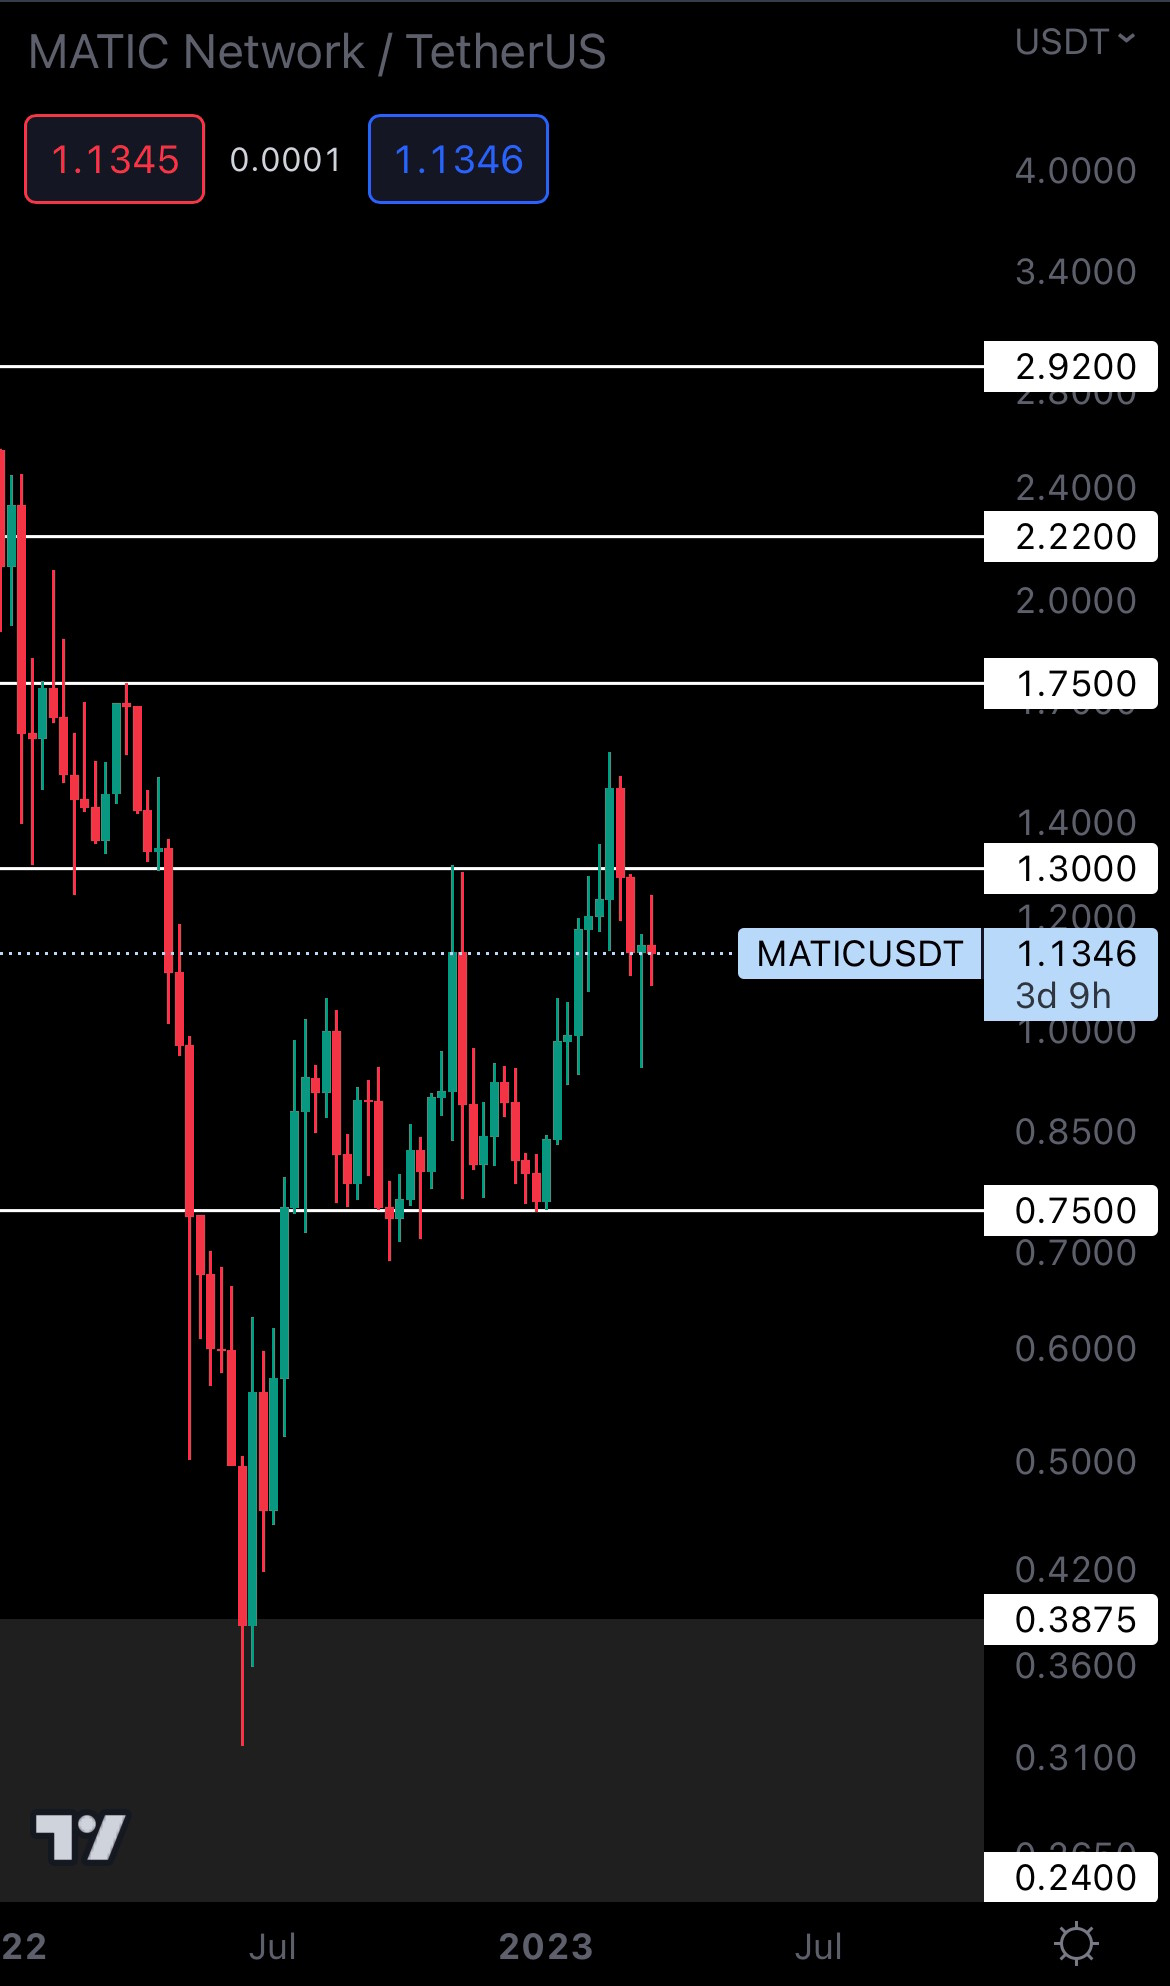 Last week was crazy for MATIC. Despite dropping over 17%, buyers stepped in heavily, invalidating the entire selling pressure, and it closed green for the week. That's a W for the bulls.
For now, MATIC is going with the flow. So keeping an eye on Bitcoin and the $25,150 resistance level is key. A closure above $25,150 for Bitcoin would result in MATIC heading to $1.30.
SOL | Solana (Weekly)
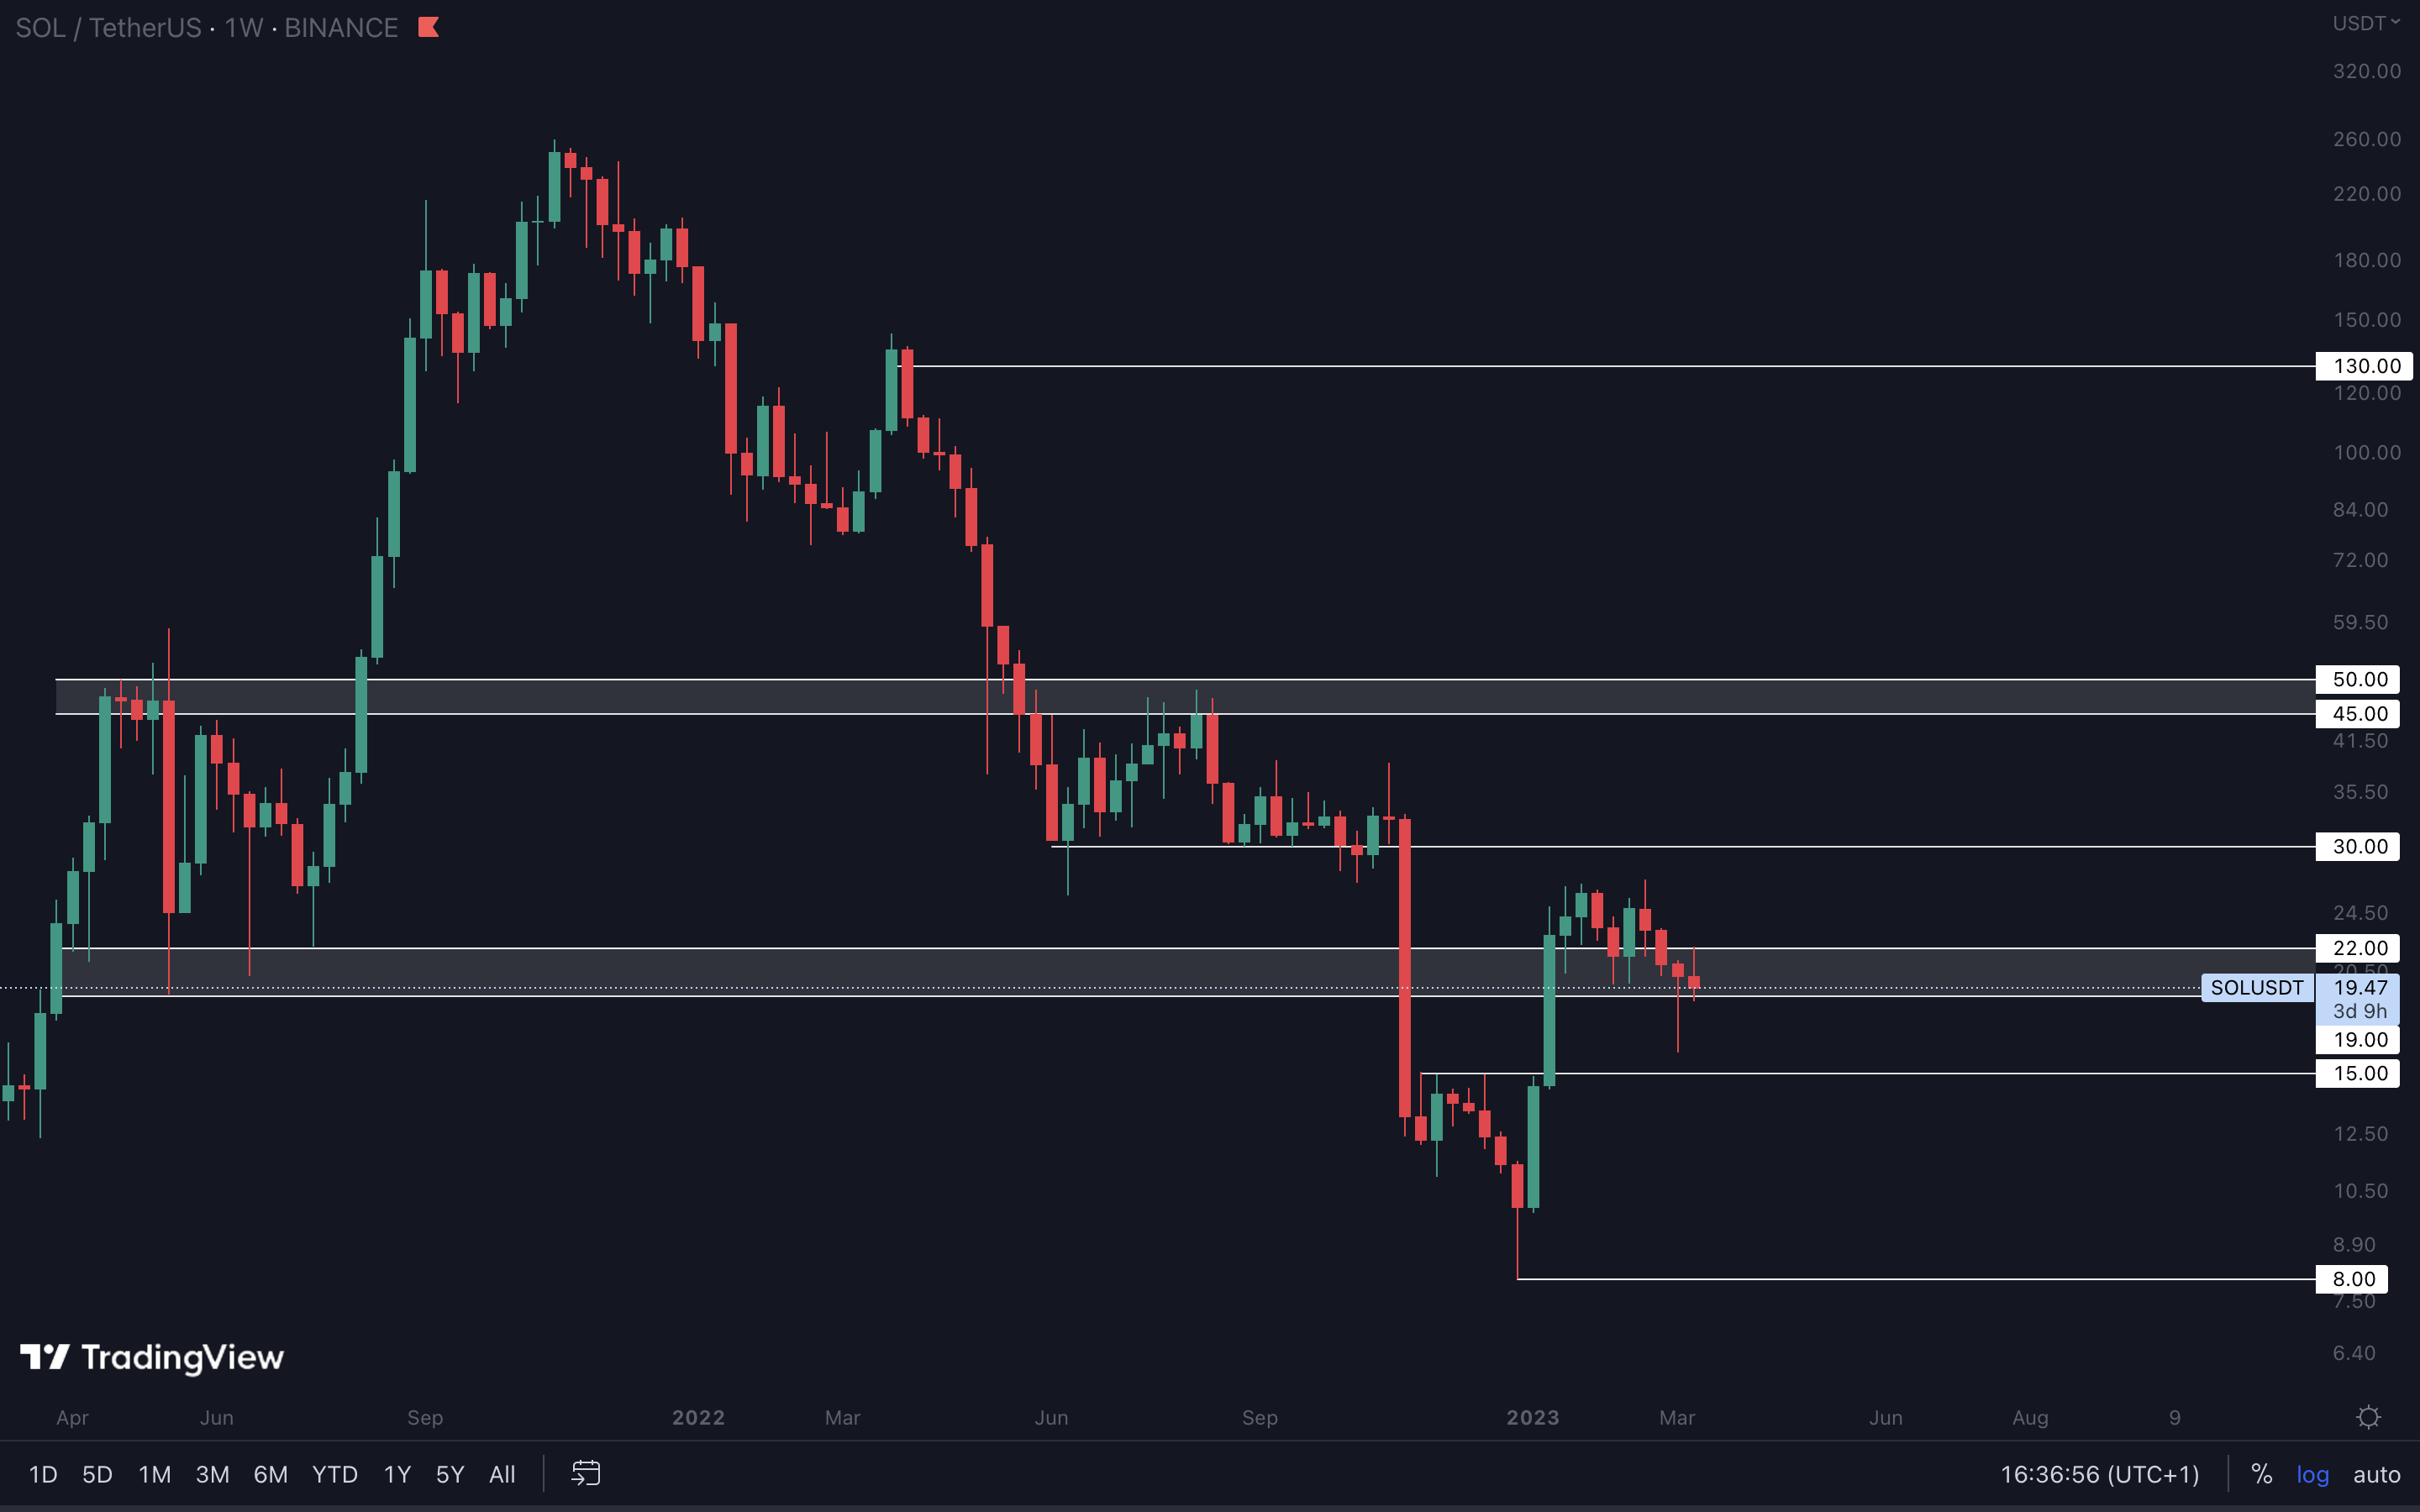
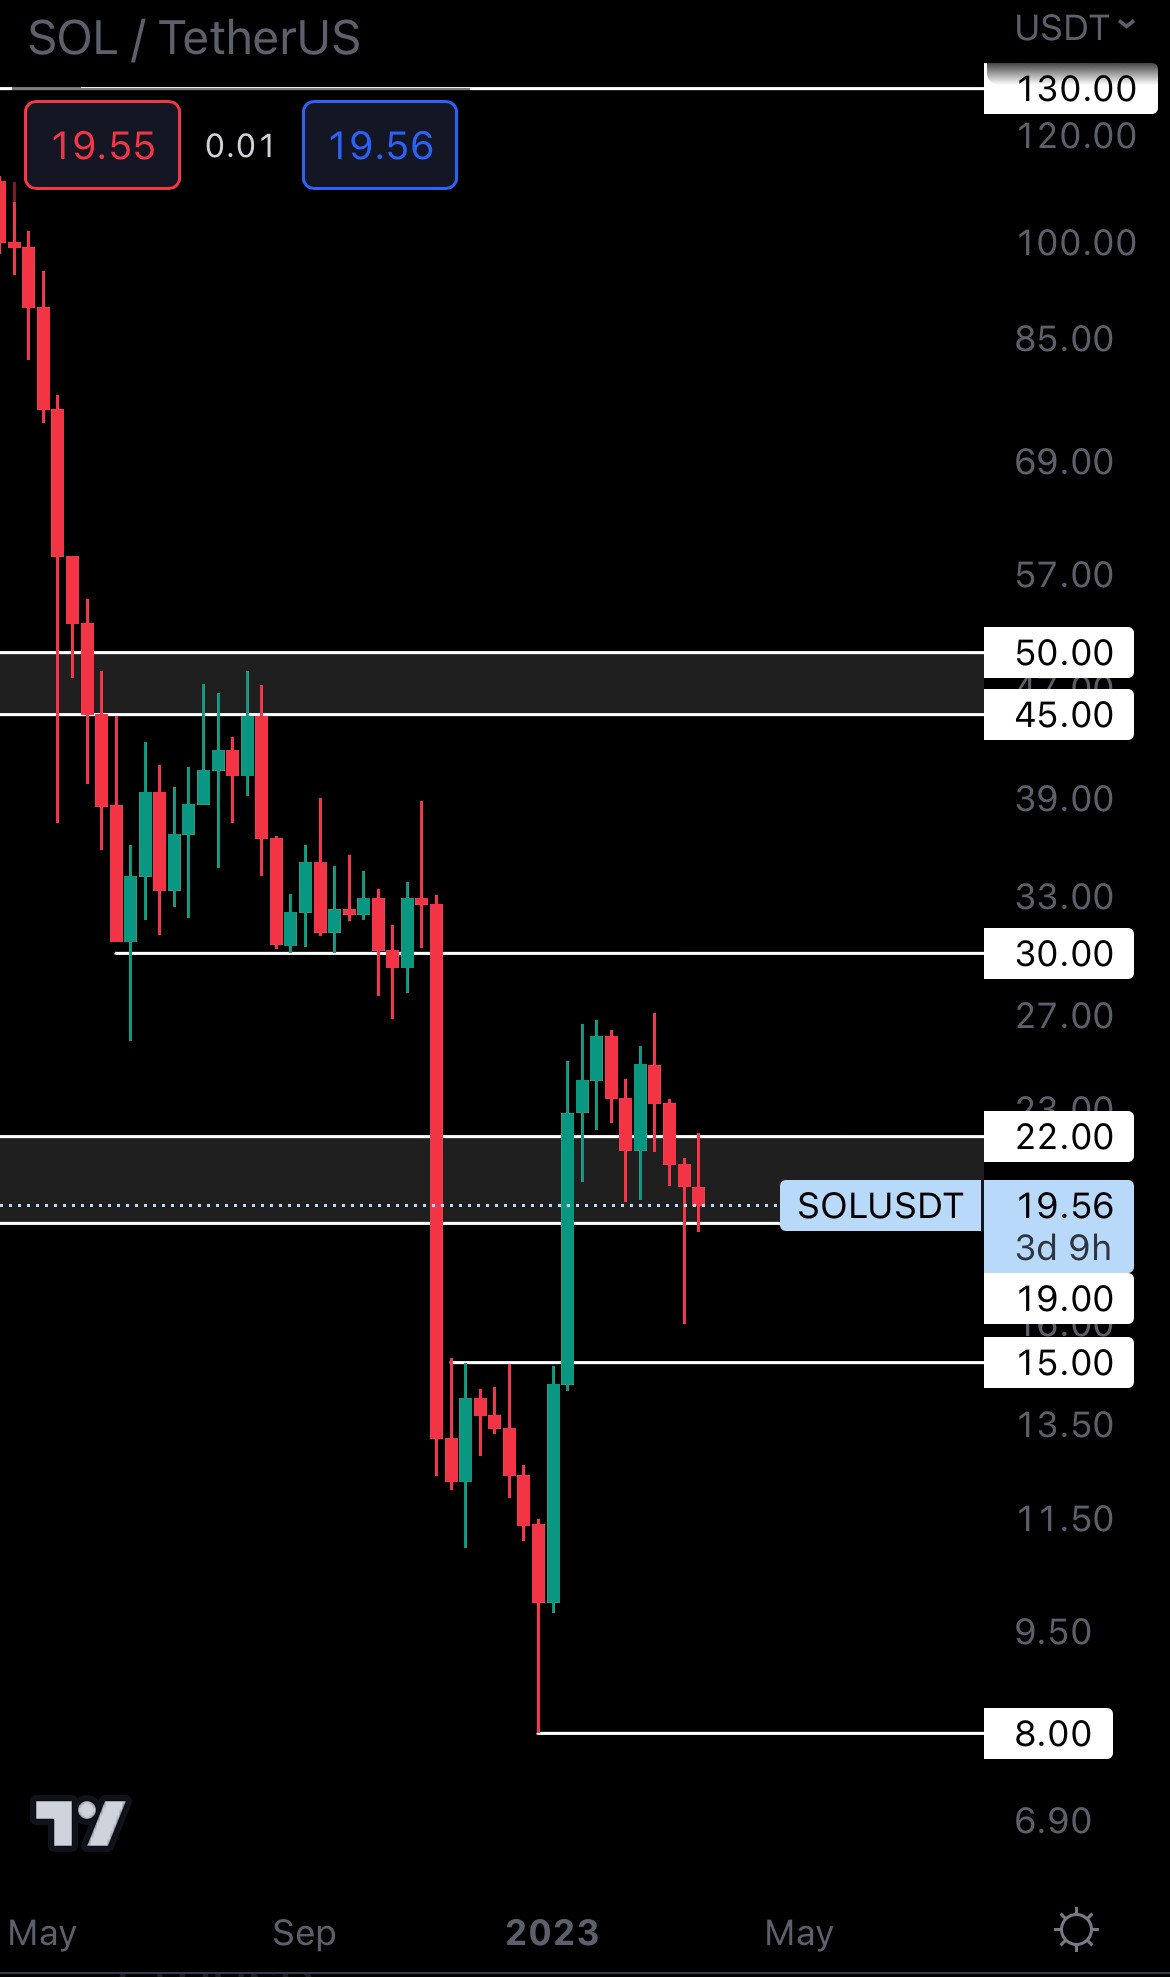 Despite the market-wide pump, SOL barely moved this week. This suggests there isn’t too much interest in the asset right now.
From a technical standpoint, we still haven’t seen SOL close under $19 to confirm further downside, so it could bounce from here as long as $19 holds as support.
DOT | Polkadot (Weekly)
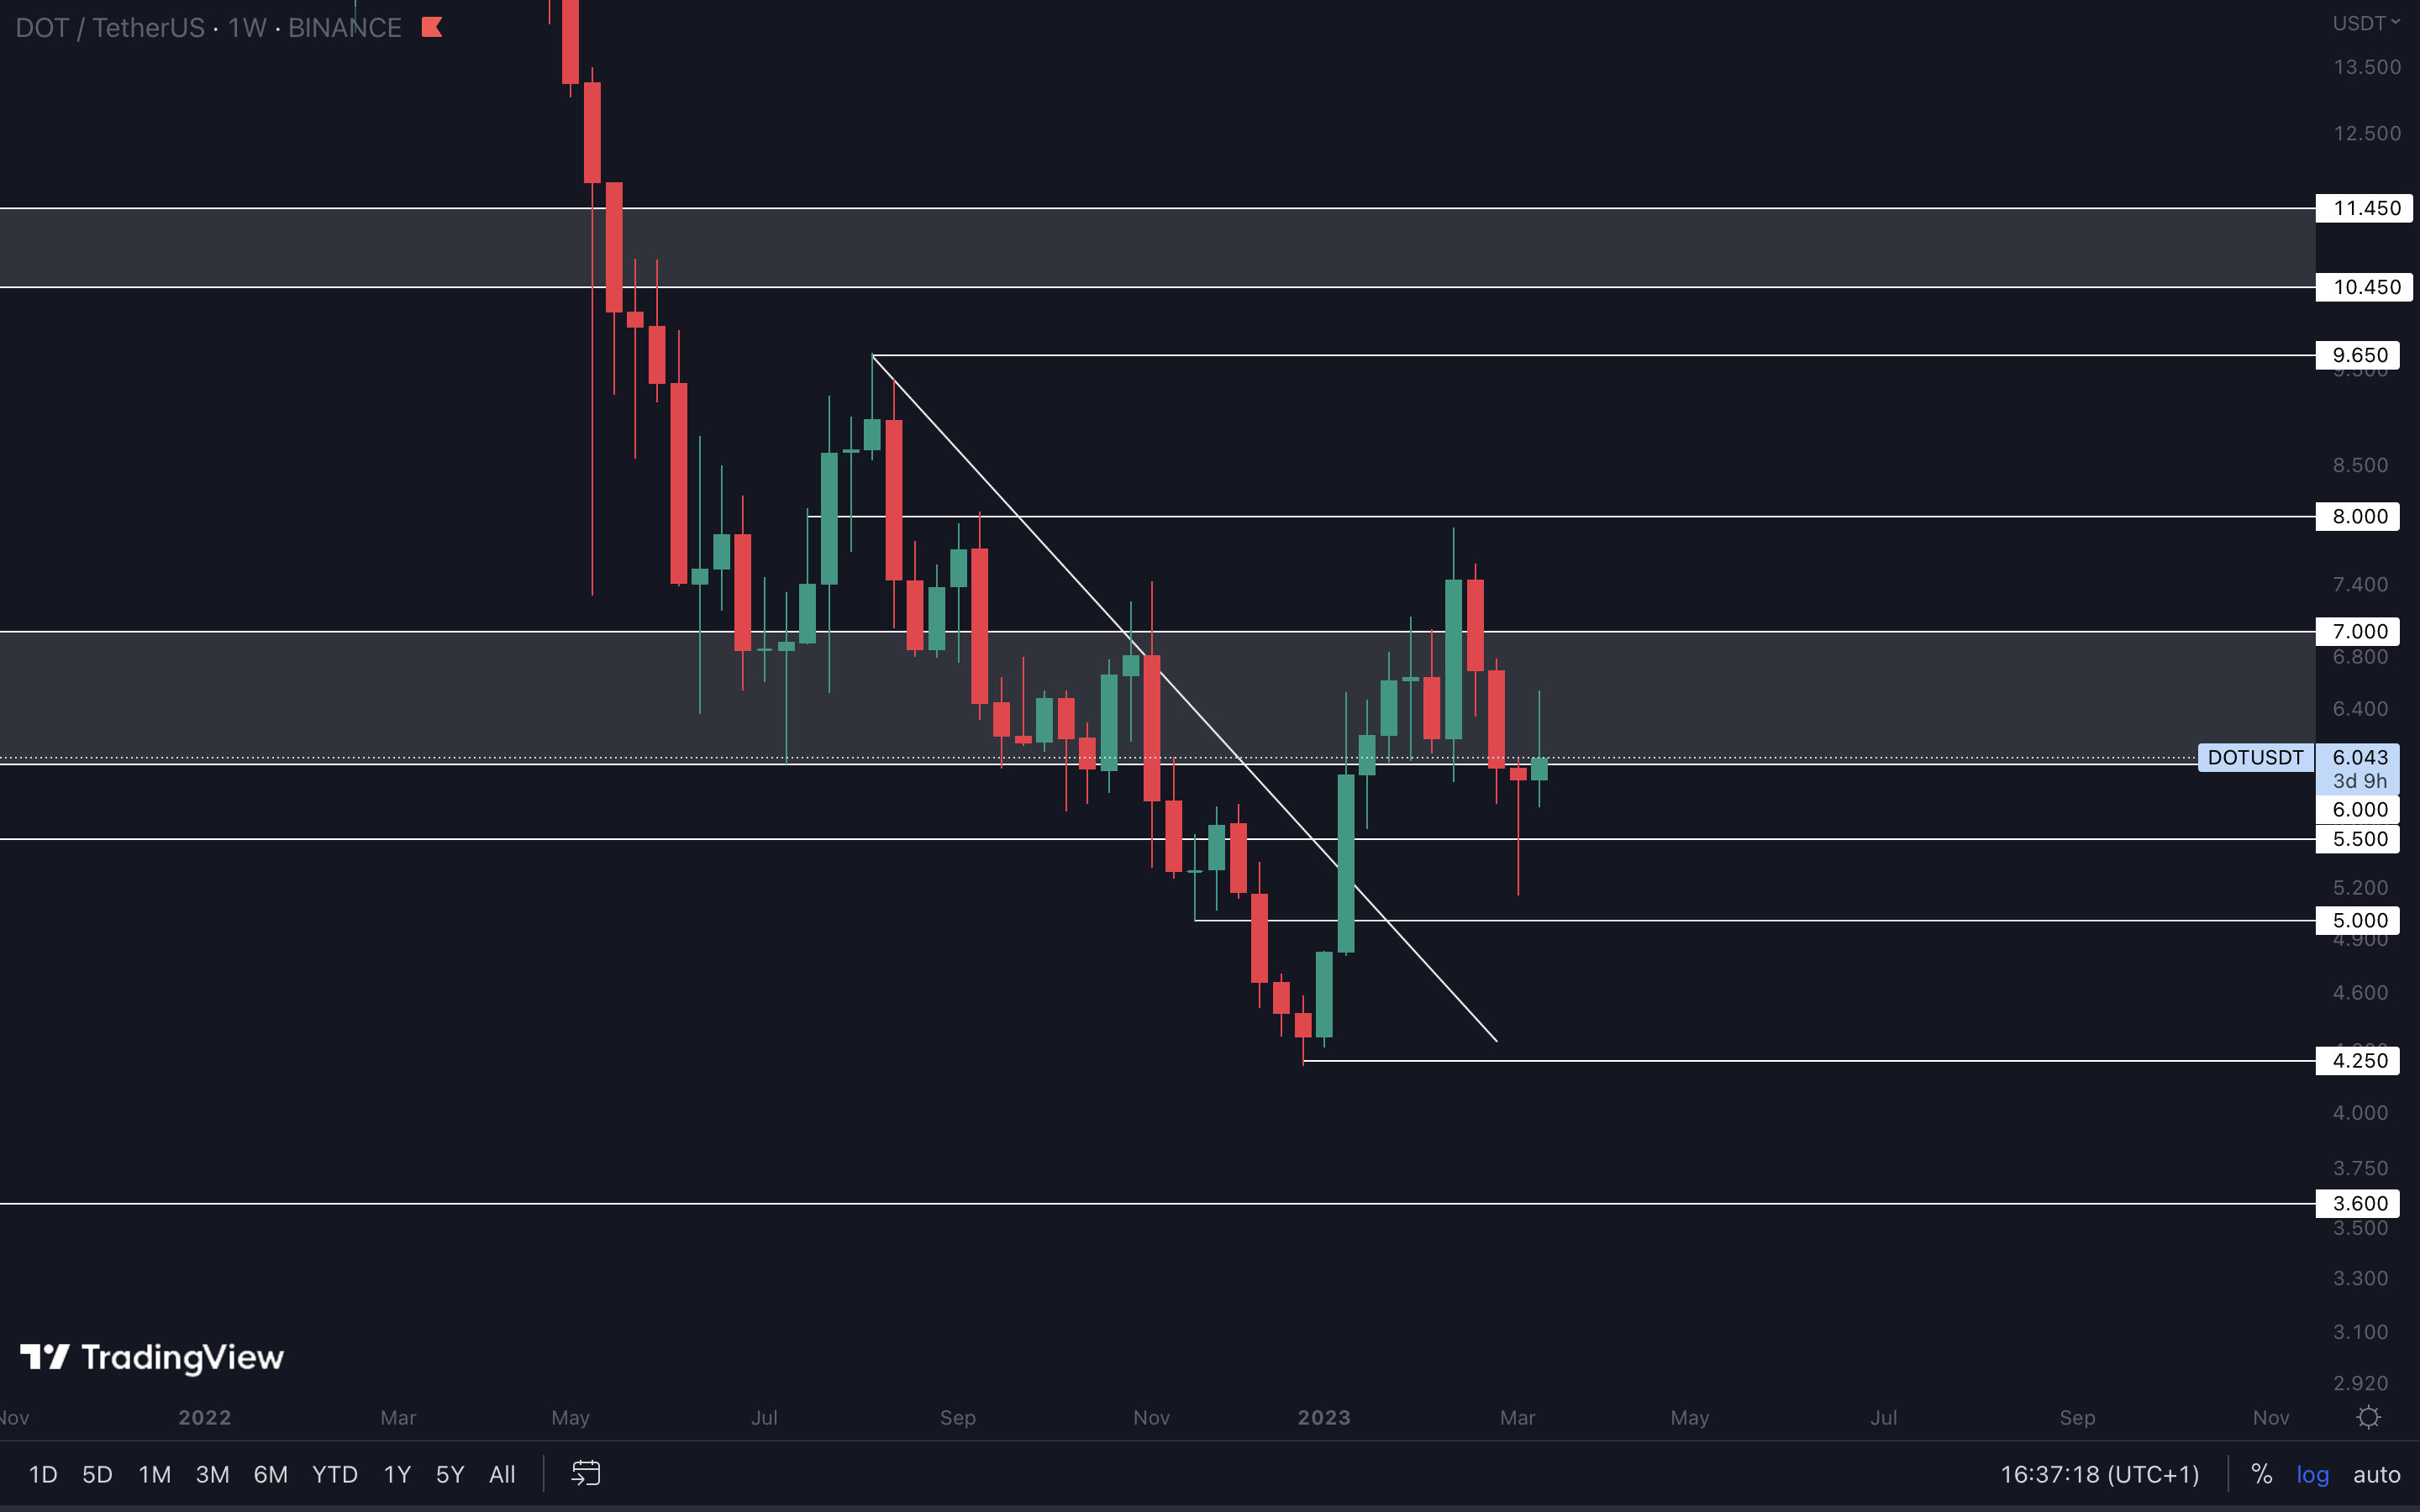
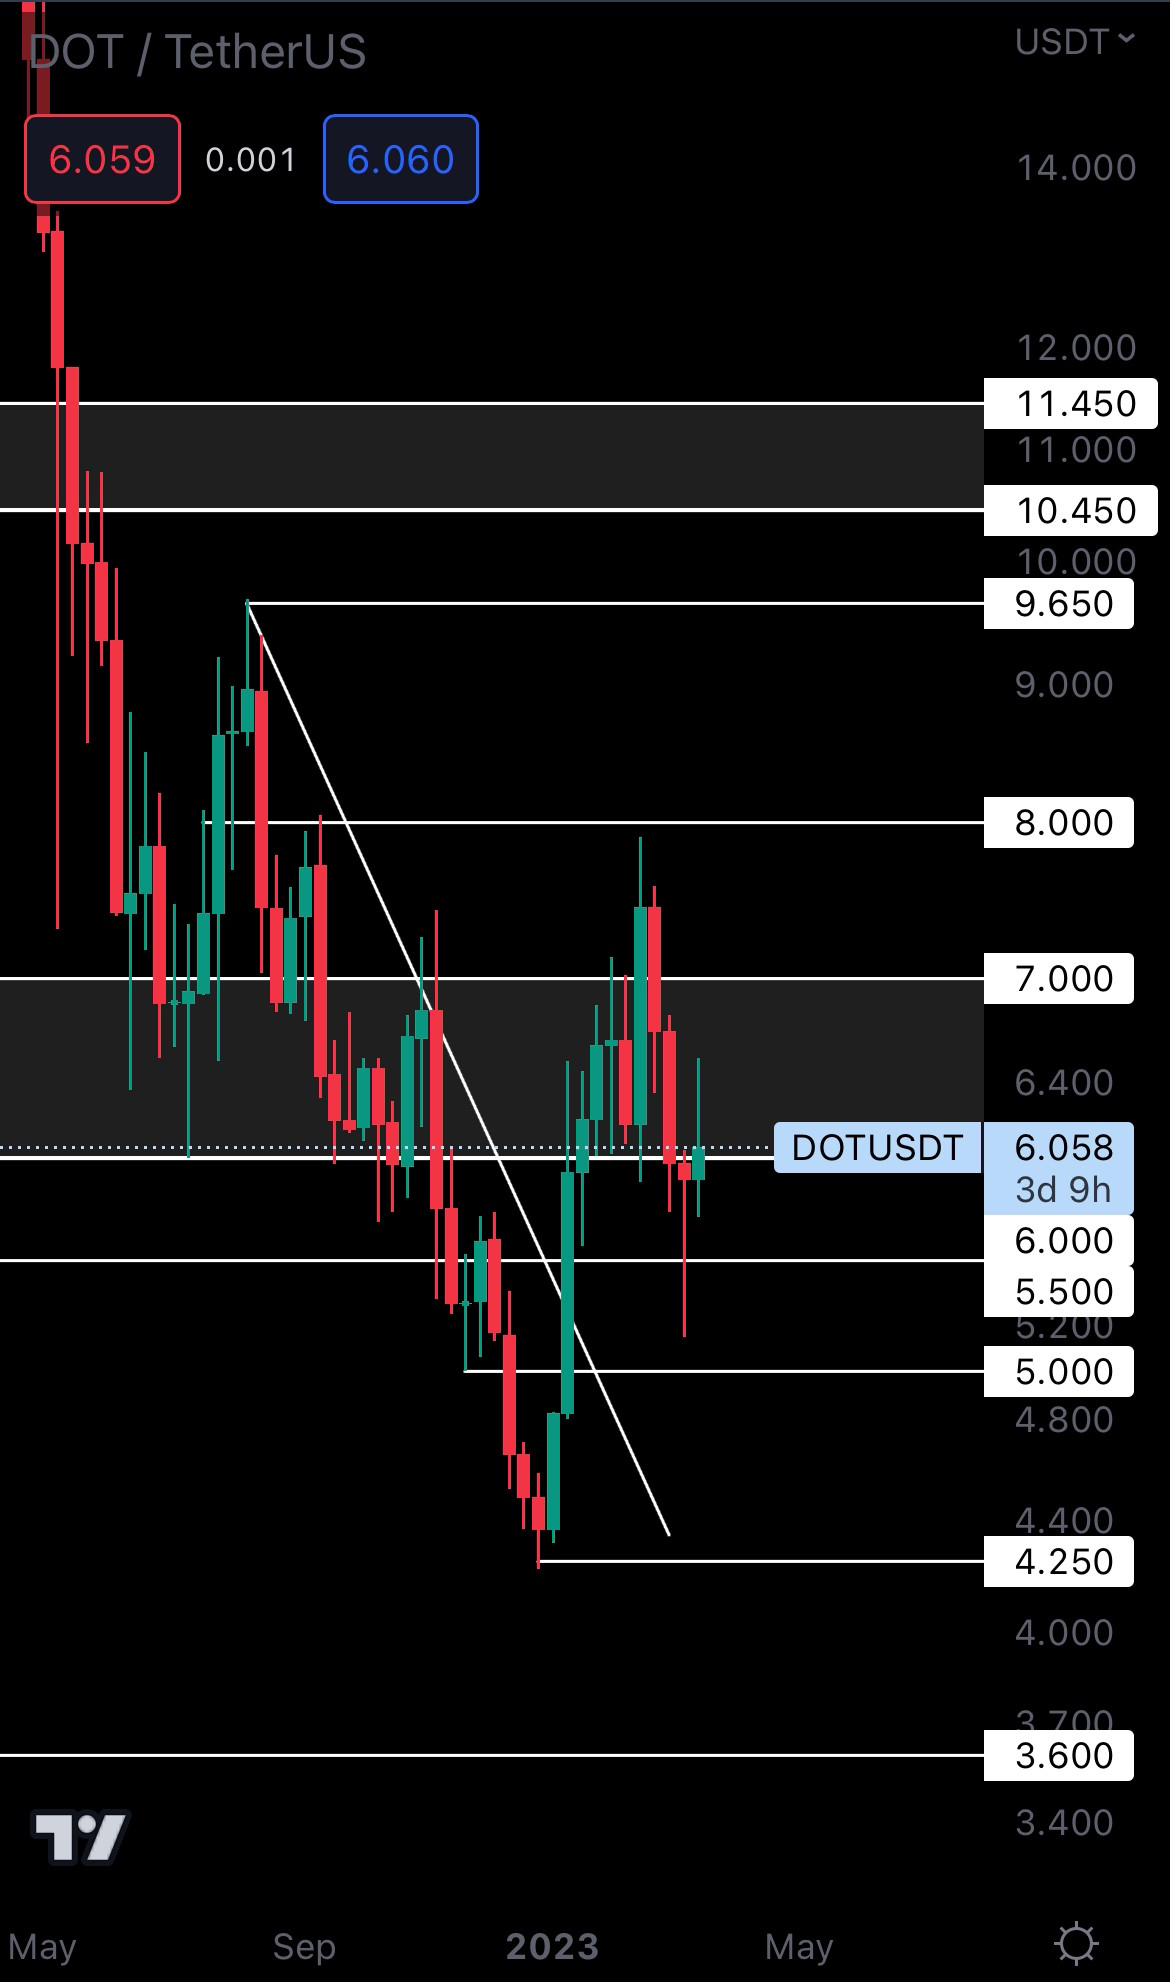 For upside to continue here, DOT will have to close a weekly candle above $6. This would open the road to $7.
If DOT fails to close above $6, a rejection (meaning DOT can go down) would be likely.
SHIB | Shiba Inu (Weekly)

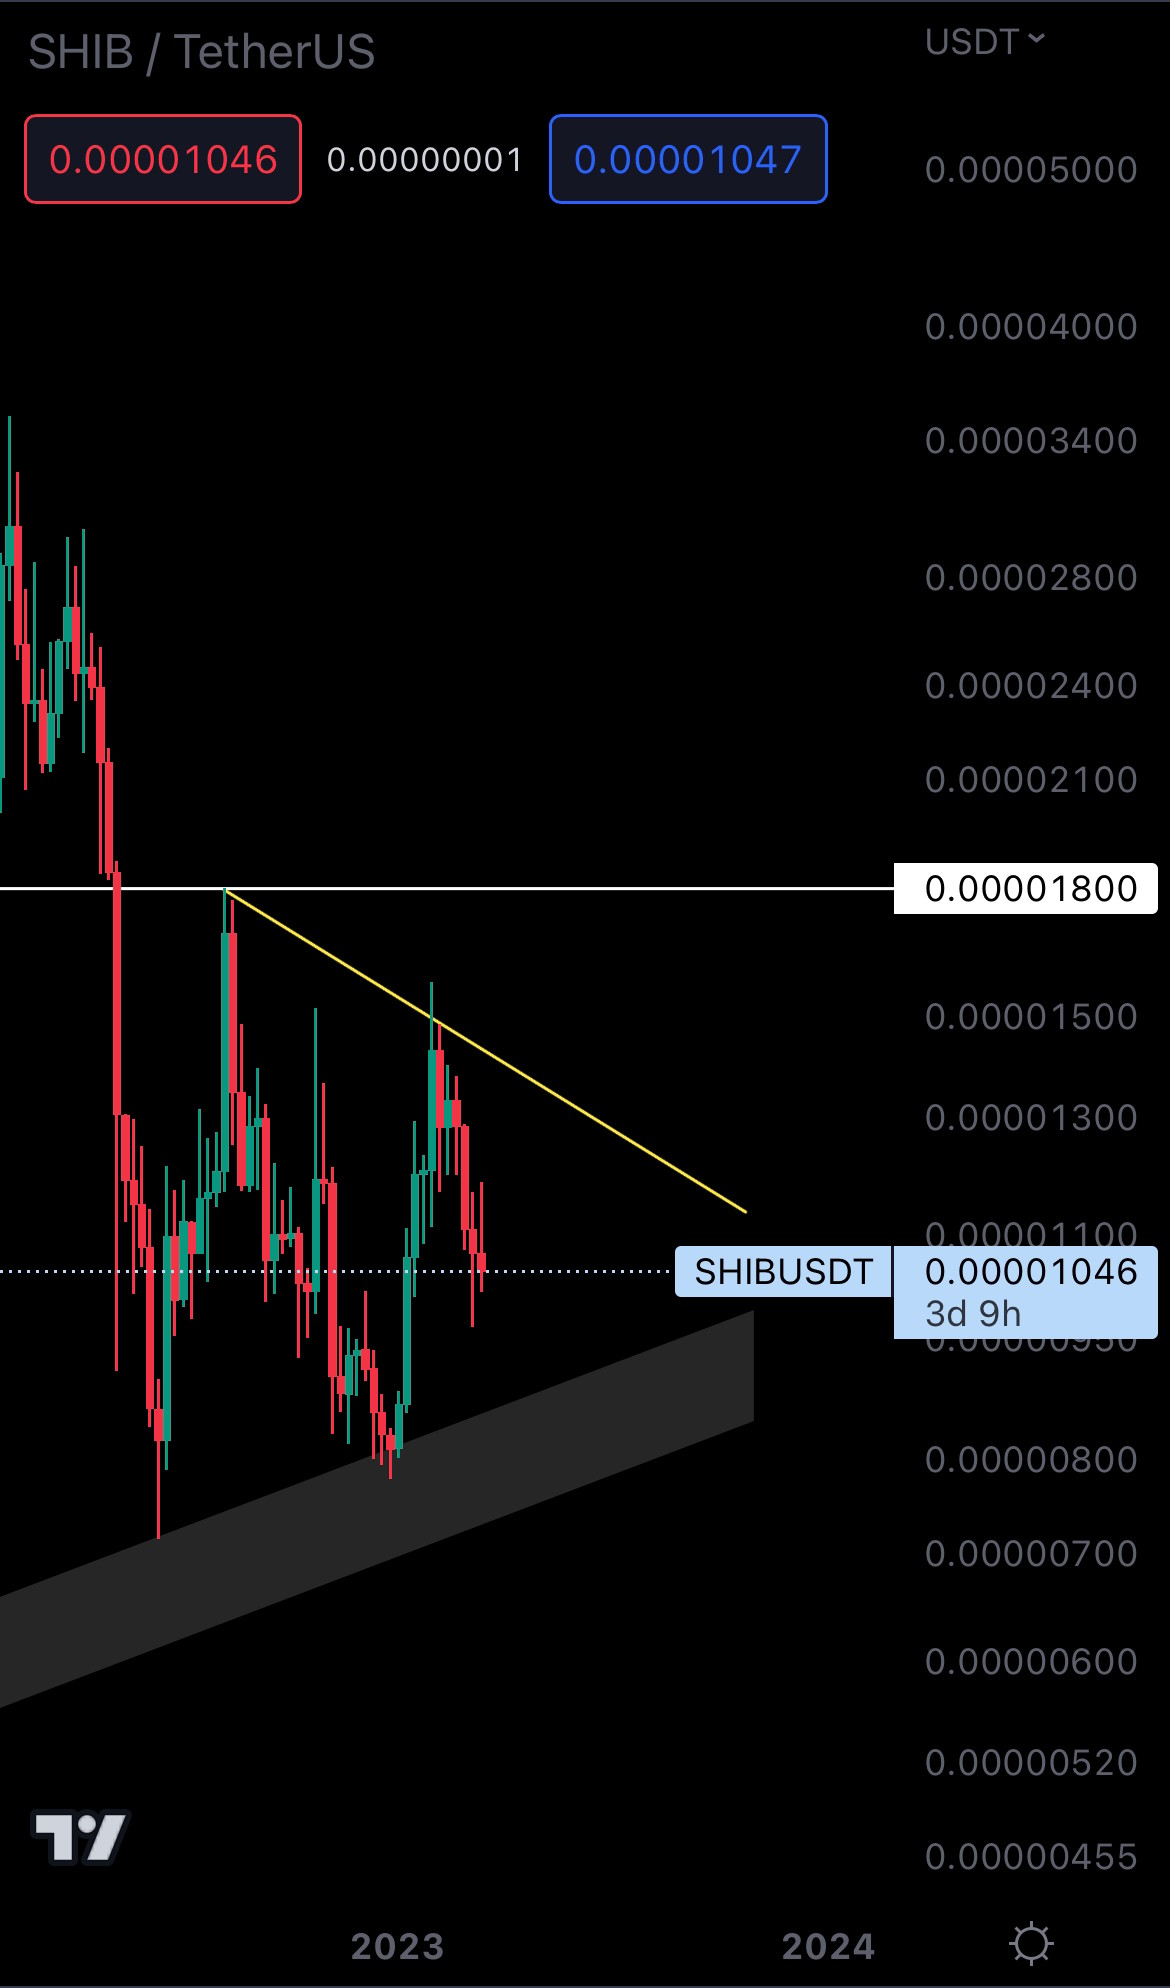 Last week, we identified a potential symmetrical triangle on SHIB’s weekly timeframe. This is a large timeframe pattern, and it will take more time (as in months) before we see a breakout.
However, SHIB’s trend over the past weeks has been bearish, and it’s continuing to drop as we speak. For that reason, we believe SHIB will reach the bottom channel and test it as support in the coming weeks.
Cryptonary's take
A volatile market is like an ocean - if you surf the waves without experience, you’ll fall. We believe the market has enough juice left to rise significantly in the coming weeks or even months. However, this also comes with risks you must be prepared for, such as losing some or all your money.
Here are a few action steps for you:
- If you’re inexperienced, stay away from trading!
- Bitcoin breaking $25,150 is a decisive event that would open the road to $28,750 and above. Once $25,150 is taken out, the market could rise rapidly, and so can your portfolio if your timing is right.
- We believe the crypto market will see even more upside during the coming weeks, and Bitcoin will break above $25,150. Capital should be preserved for this opportunity.
Recommended from Cryptonary


