Save 23% ($351) & Get a Free 1-1 Call with our Team ⏰ : 0d 2h 59m 43s
BTC:
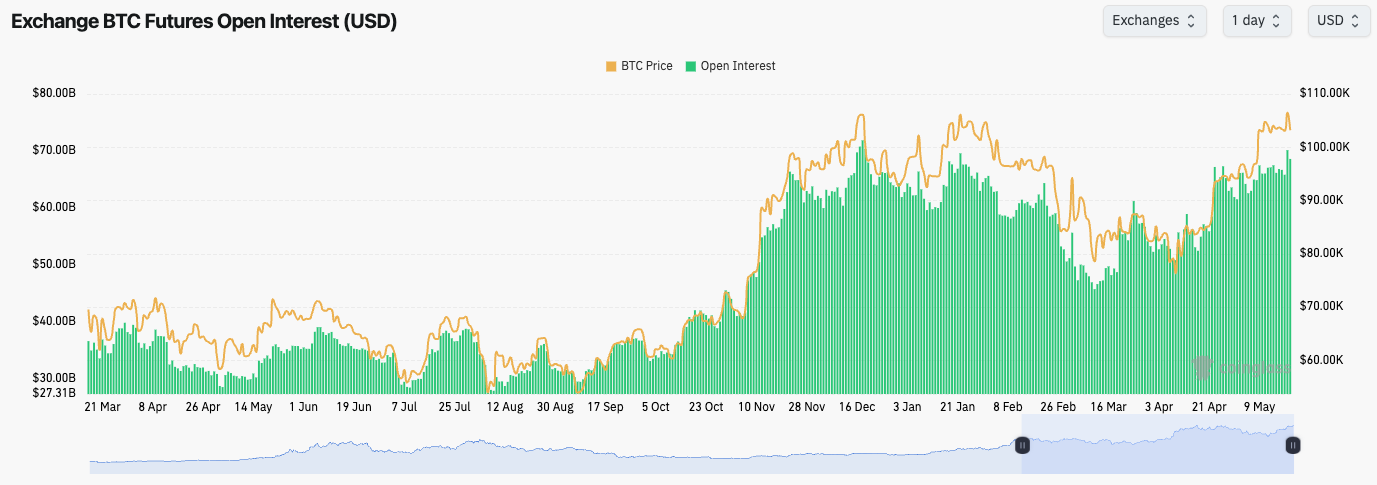
- BTC's OI spiked up over the last few days, and we saw this was mostly Longs, which were then flushed out on the Sunday evening pullback. OI remains high, but not as frothy as it was, whilst Funding Rates are relatively positive.
Technical analysis
- BTC was mostly range-bound between $102,000 and $105,000, when the price broke out higher on Sunday evening. However, price rejected into the main horizontal resistance at $106,900, which also converged with the underside of the uptrend line.
- The key horizontal resistance remains $106,900, and beyond that, the all-time high of $109,000.
- To the downside, $102,000 is the key horizontal support. A break beneath this level and price likely revisits the range between $93,000 and $95,000.
- If $102,000 is tested, then there is another local support at $98,900 that we should be aware of as well.
- As price moved up into $106,900, the RSI moved into overbought territory, whilst it also put in a bearish divergence (higher high in price, and a lower high on the oscillator).
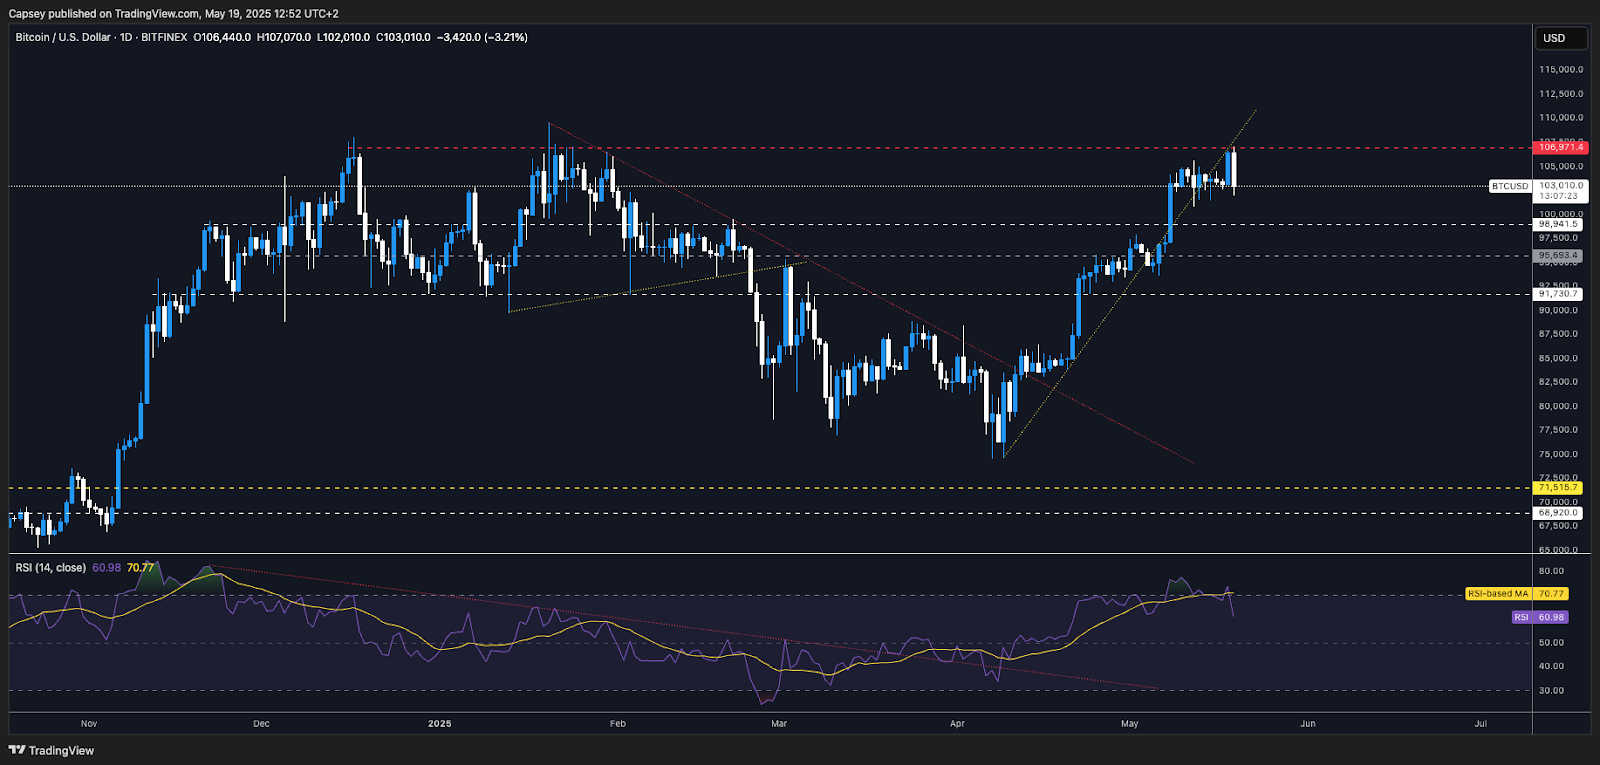
- Next Support: $102,000
- Next Resistance: $106,900
- Direction: Bearish
- Upside Target: $106,900
- Downside Target: $93,000
Cryptonary's take
From a charting perspective, Bitcoin has held the highs well, but it is showing signs of the upside momentum stalling, and therefore, a more substantial pullback may be on the cards. This might be due to trade de-escalation now being priced in and there being a lack of more positive news to continue to help drive prices higher.In terms of a pullback, we expect a more substantial pullback to happen, however, it may be a slow grind down, rather than an 'elevator down' scenario. This, therefore, might take time (a few weeks). Our first area of interest is the $93,000 to $95,000 range.
If price moves down to this level, we will reassess at the time as to whether we begin scaling in with Spot buys. For now, we're staying patient and not chasing strength into resistance.
What's next?
Three names just entered the same distribution pattern that preceded last quarter's 40% drop - this setup is textbook.ETH:
- ETH's Funding Rate remains positive, but at a healthy level,
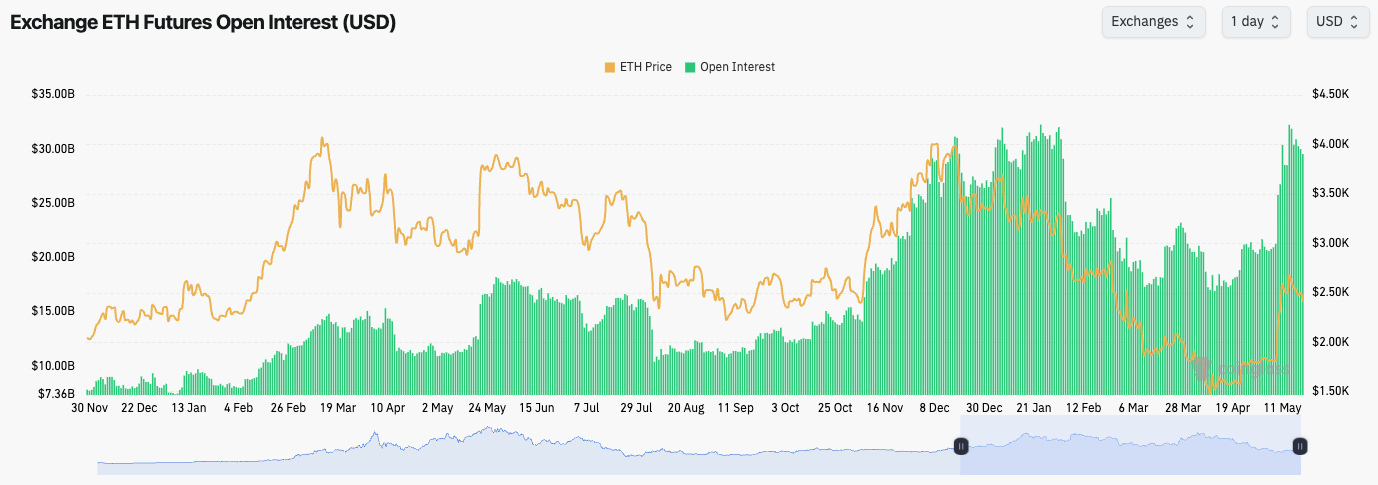
- ETH's Open Interest has increased dramatically on this price rebound. This is likely large players scaling into Shorts.
Technical analysis
- The positive development was ETH reclaiming back above $2,420, and the price began to use that level as horizontal support.
- However, price has since retested below that level, and it's now battling to maintain above it.
- To the downside, the two key horizontal levels are $2,420 (current level) and then $2,160.
- To the upside, the key horizontal level is $2,700.
- ETH's RSI moving average has moved well into overbought territory. It's possible we see a small move up of the RSI, and a rejection of its moving average. This likely results in the price moving into $2,160 over the coming weeks.

- Next Support: $2,420
- Next Resistance: $2,700
- Direction: Bearish
- Upside Target: $2,700
- Downside Target: $2,160
Cryptonary's take
This move higher in ETH was mostly due to Shorts being squeezed, hence it was such a violent move. However, we do see the most likely path for ETH over the coming weeks being a pullback to $2,160. At that level, we may begin DCA'ing into ETH, however, we will reassess at that price level (assuming we get it), and it's very possible that our DCA levels are lower than $2,160. For now, we're remaining patient and we're not looking to accumulate ETH, and probably not anytime soon.SOL:
- The SOL Open Interest is up substantially, and it's currently now short-dominated. We can see this in the fact that the Funding Rate is meaningfully negative (at -0.018%), i.e., Shorts are paying a premium to Longs to be Short.
- This opens the door for a small Short-squeeze in the medium term, that might take the price up to $170, but we would then expect the price to roll over from there.

Technical analysis
- SOL was rejected from the $180 level, and the price has since pulled back into the horizontal support of $162.
- Price is also currently sitting on top of the main uptrend line. If this uptrend is lost, we can expect the eventual landing zone to be $148, and potentially $120 to $130.
- $180 is the key level to the upside.
- To the downside, the key level is $148, and then you have the $120 to $130 zone.
- The RSI has meaningfully reset on this pullback, and it's now also putting in a hidden bullish divergence (higher low in price, lower low on the oscillator).

- Next Support: $148
- Next Resistance: $180
- Direction: Bearish
- Upside Target: $180
- Downside Target: $120
Cryptonary's take
SOL does have some bullish elements here, but it is also battling bearish elements like many of the other charts. SOL is at a key level here, sitting on top of its uptrend line, and the horizontal support of $162.If price can get a small bounce in the short term, this still wouldn't change our view that we do expect to see a more significant SOL pullback to at least the $120 to $130 levels over the coming 3-5 weeks. In that area, we'll likely begin becoming constructive again and looking to add to our long-term Spot bags in that $120 to $130 area. In the meantime, once again, patience.
HYPE:
- Price remains in its major uptrend; however, price has initially rejected the prior highs of $28.00.
- Price is now moving lower but into the prior cluster area between $23.00 and $26.00. This may see price find some short-term support in this zone.
- To the upside, the main resistance remains the highs at $28.00. We don't expect them to be breached anytime soon.
- To the downside, $23.00 is a key horizontal support, with $18.50 the next level below that.
- The RSI has begun to reset, and it's fallen below its moving average. This may mean we see price test lower levels over the coming weeks.

- Next Support: $23.00
- Next Resistance: $28.00
- Direction: Bearish
- Upside Target: $28.00
- Downside Target: $14.50
Cryptonary's take
HYPE has been one of the outstanding performers over the last 6 weeks. But, like other Majors, price seems to be losing upside momentum here. We're watching if price can hold above its uptrend line and the key horizontal level of $23.00.However, our expectation is that in 3-5 week's time, the price will have broken down and it'll be revisiting the $14.50 to $18.50 area. We also wouldn't be surprised to see the lower end of this zone - $14.50.
Disclaimer: This is not financial or investment advice. You are responsible for any capital-related decisions you make, and only you are accountable for the results.
Recommended from Cryptonary


