Save 23% ($351) & Get a Free 1-1 Call with our Team ⏰ : 0d 2h 59m 43s

Disclaimer: Not financial or investment advice. You are responsible for any capital-related decisions you make, and only you are accountable for the results.
TLDR
- Bitcoin is cheap, according to indicators.
- FED decisions this week, based on inflation data, may shake up the markets.
- Miners are starting to capitulate - a bottoming indicator.
- The bottom is either near or in.
Macro
This week is perhaps one of the most important weeks of the year regarding macro data and markets. On 13th December, a flurry of inflation data will be released, followed by the FED Interest Rate decision, FOMC Economic Projections, and then the FED Press Conference on the 14th.- 13 December: Expectations are that the Year-on-Year Inflation rate will be down from 7.7% to 7.6%, and the Core Inflation Month-on-Month will be 0.3/0.4%; the prior month was 0.3%. The FED focuses on the latter, and if it comes in as expected, we may see a slight sell-off.
- 14 December: Wednesday is also key, as it is likely that the FED will raise interest rates by 50bps (0.50%) - anything else would be a shock to the markets.
Total Market Cap
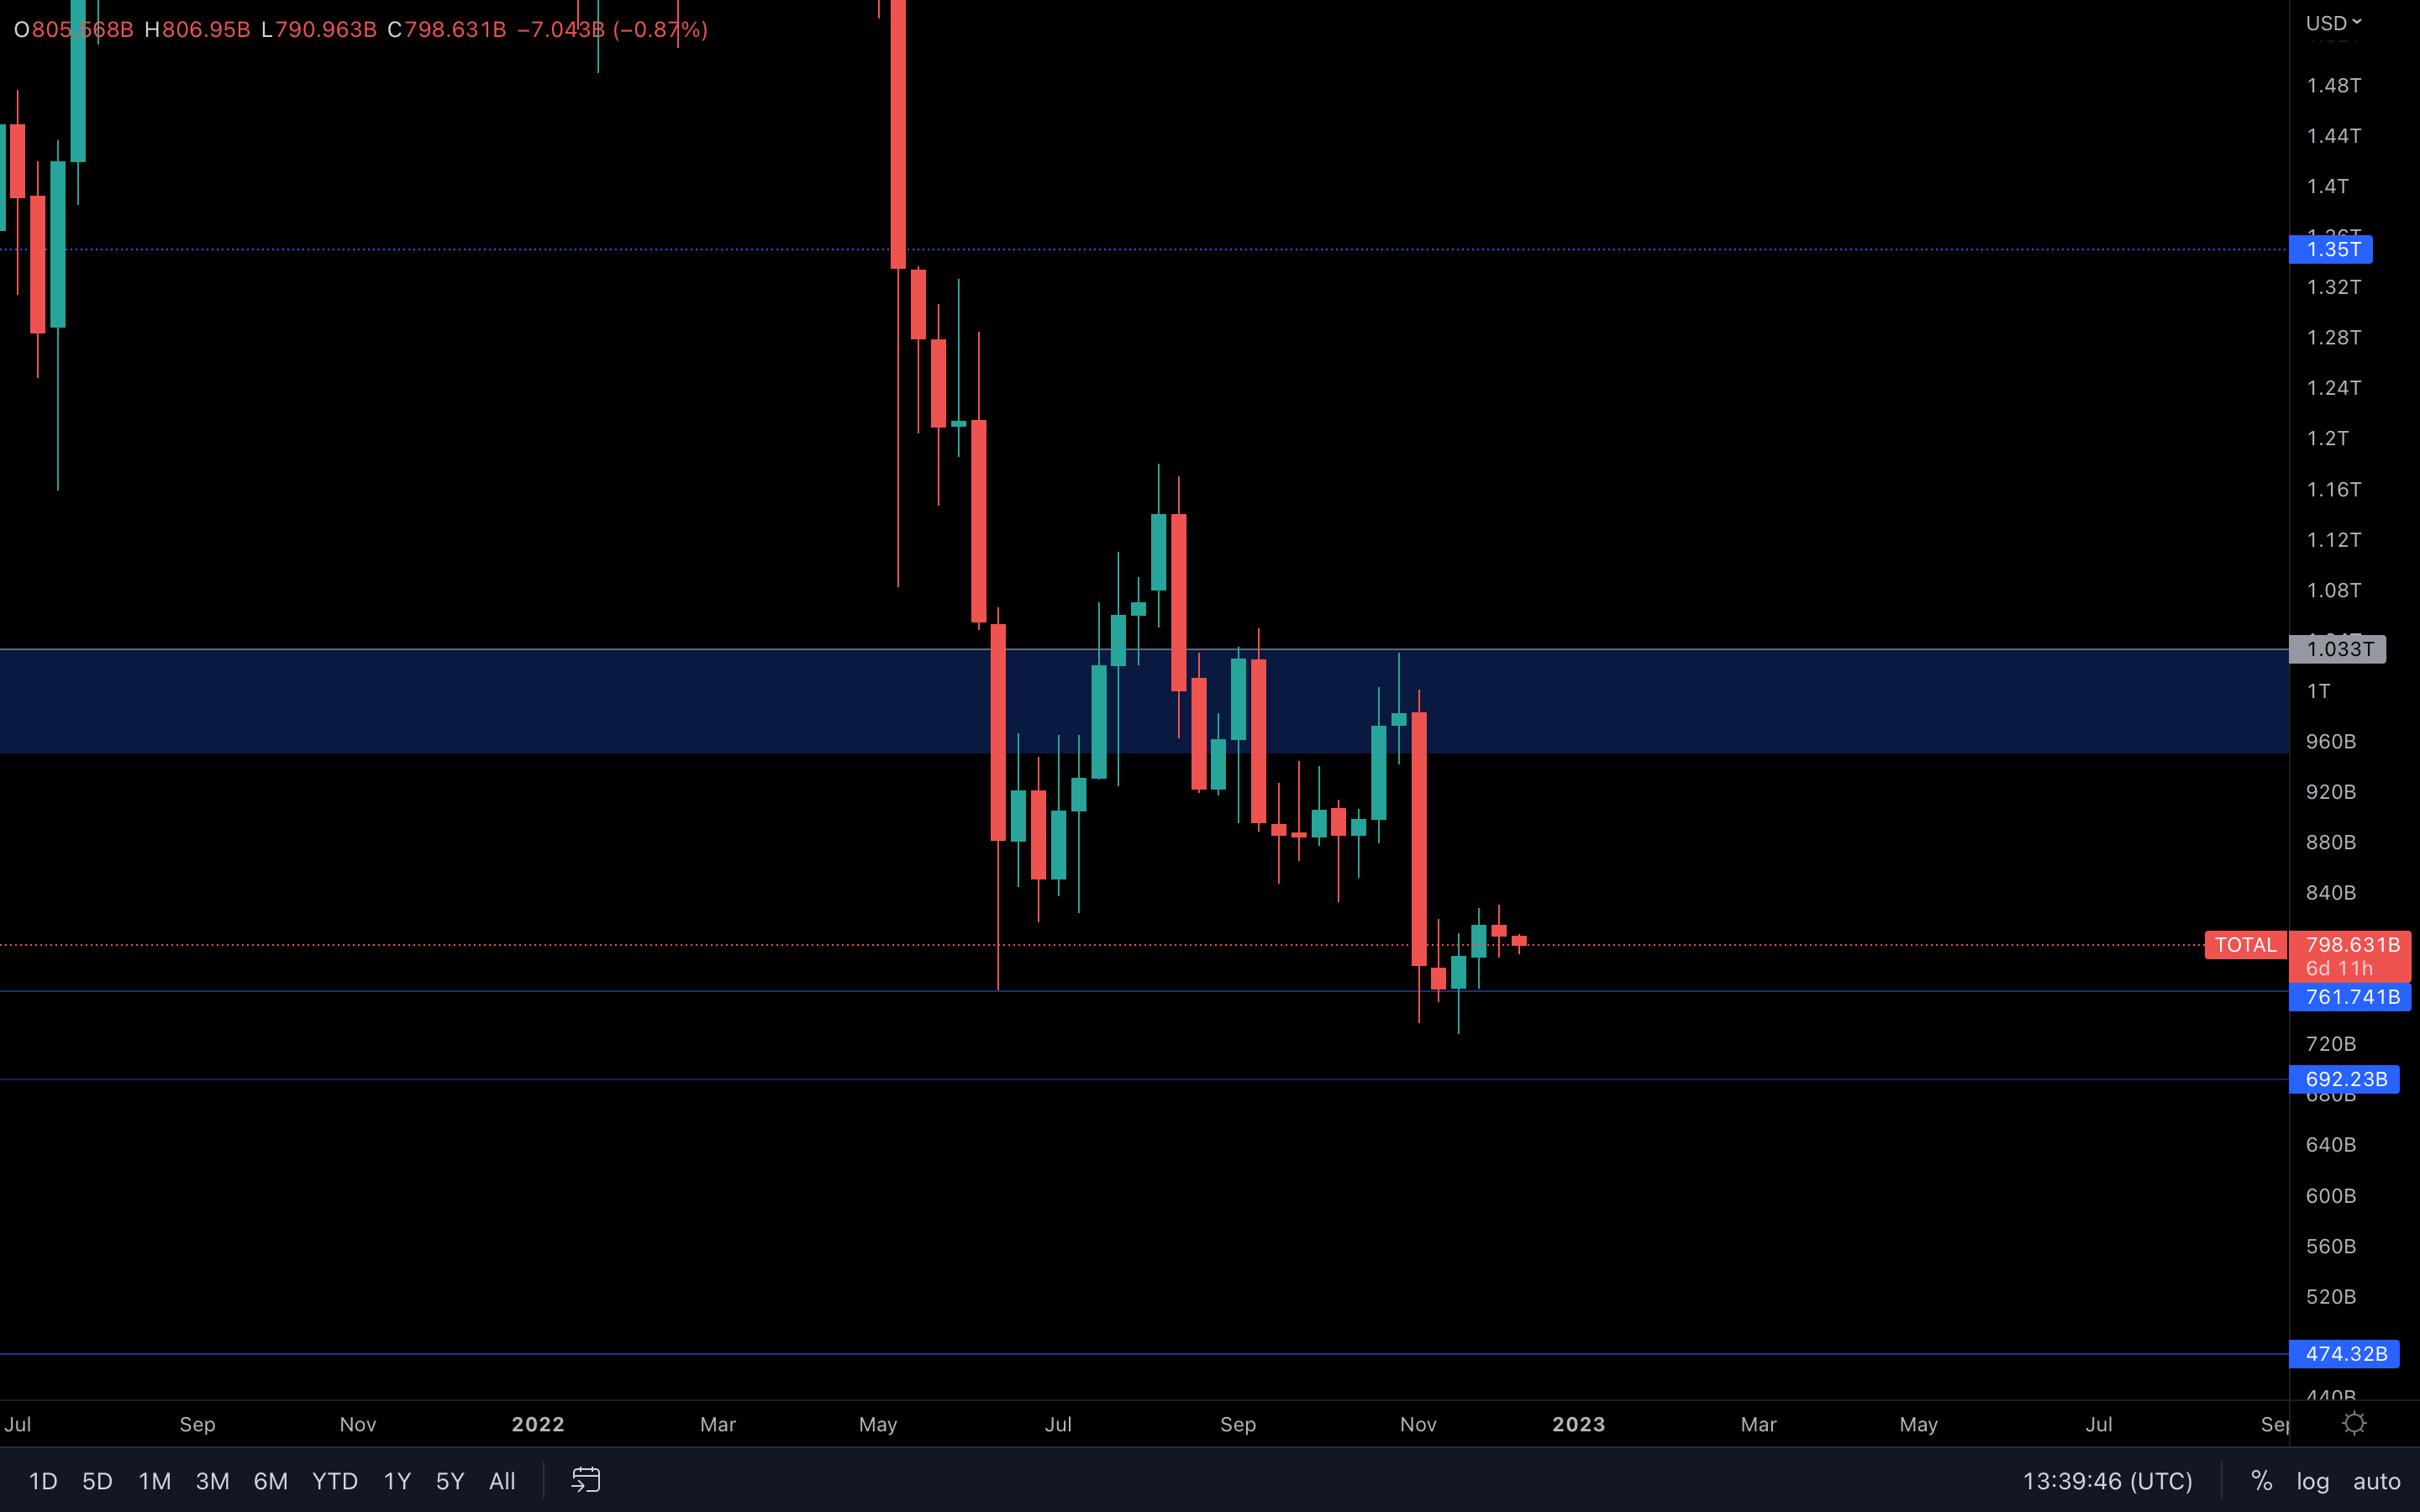
Last week, the Total Market Cap index registered a bearish candle, indicating sellers are in control. As simple as it may sound, another $761B support test is now on the cards. Unless the latter breaks, we may see a move back toward the $1T resistance at the start of 2023.
Altcoins Market Cap
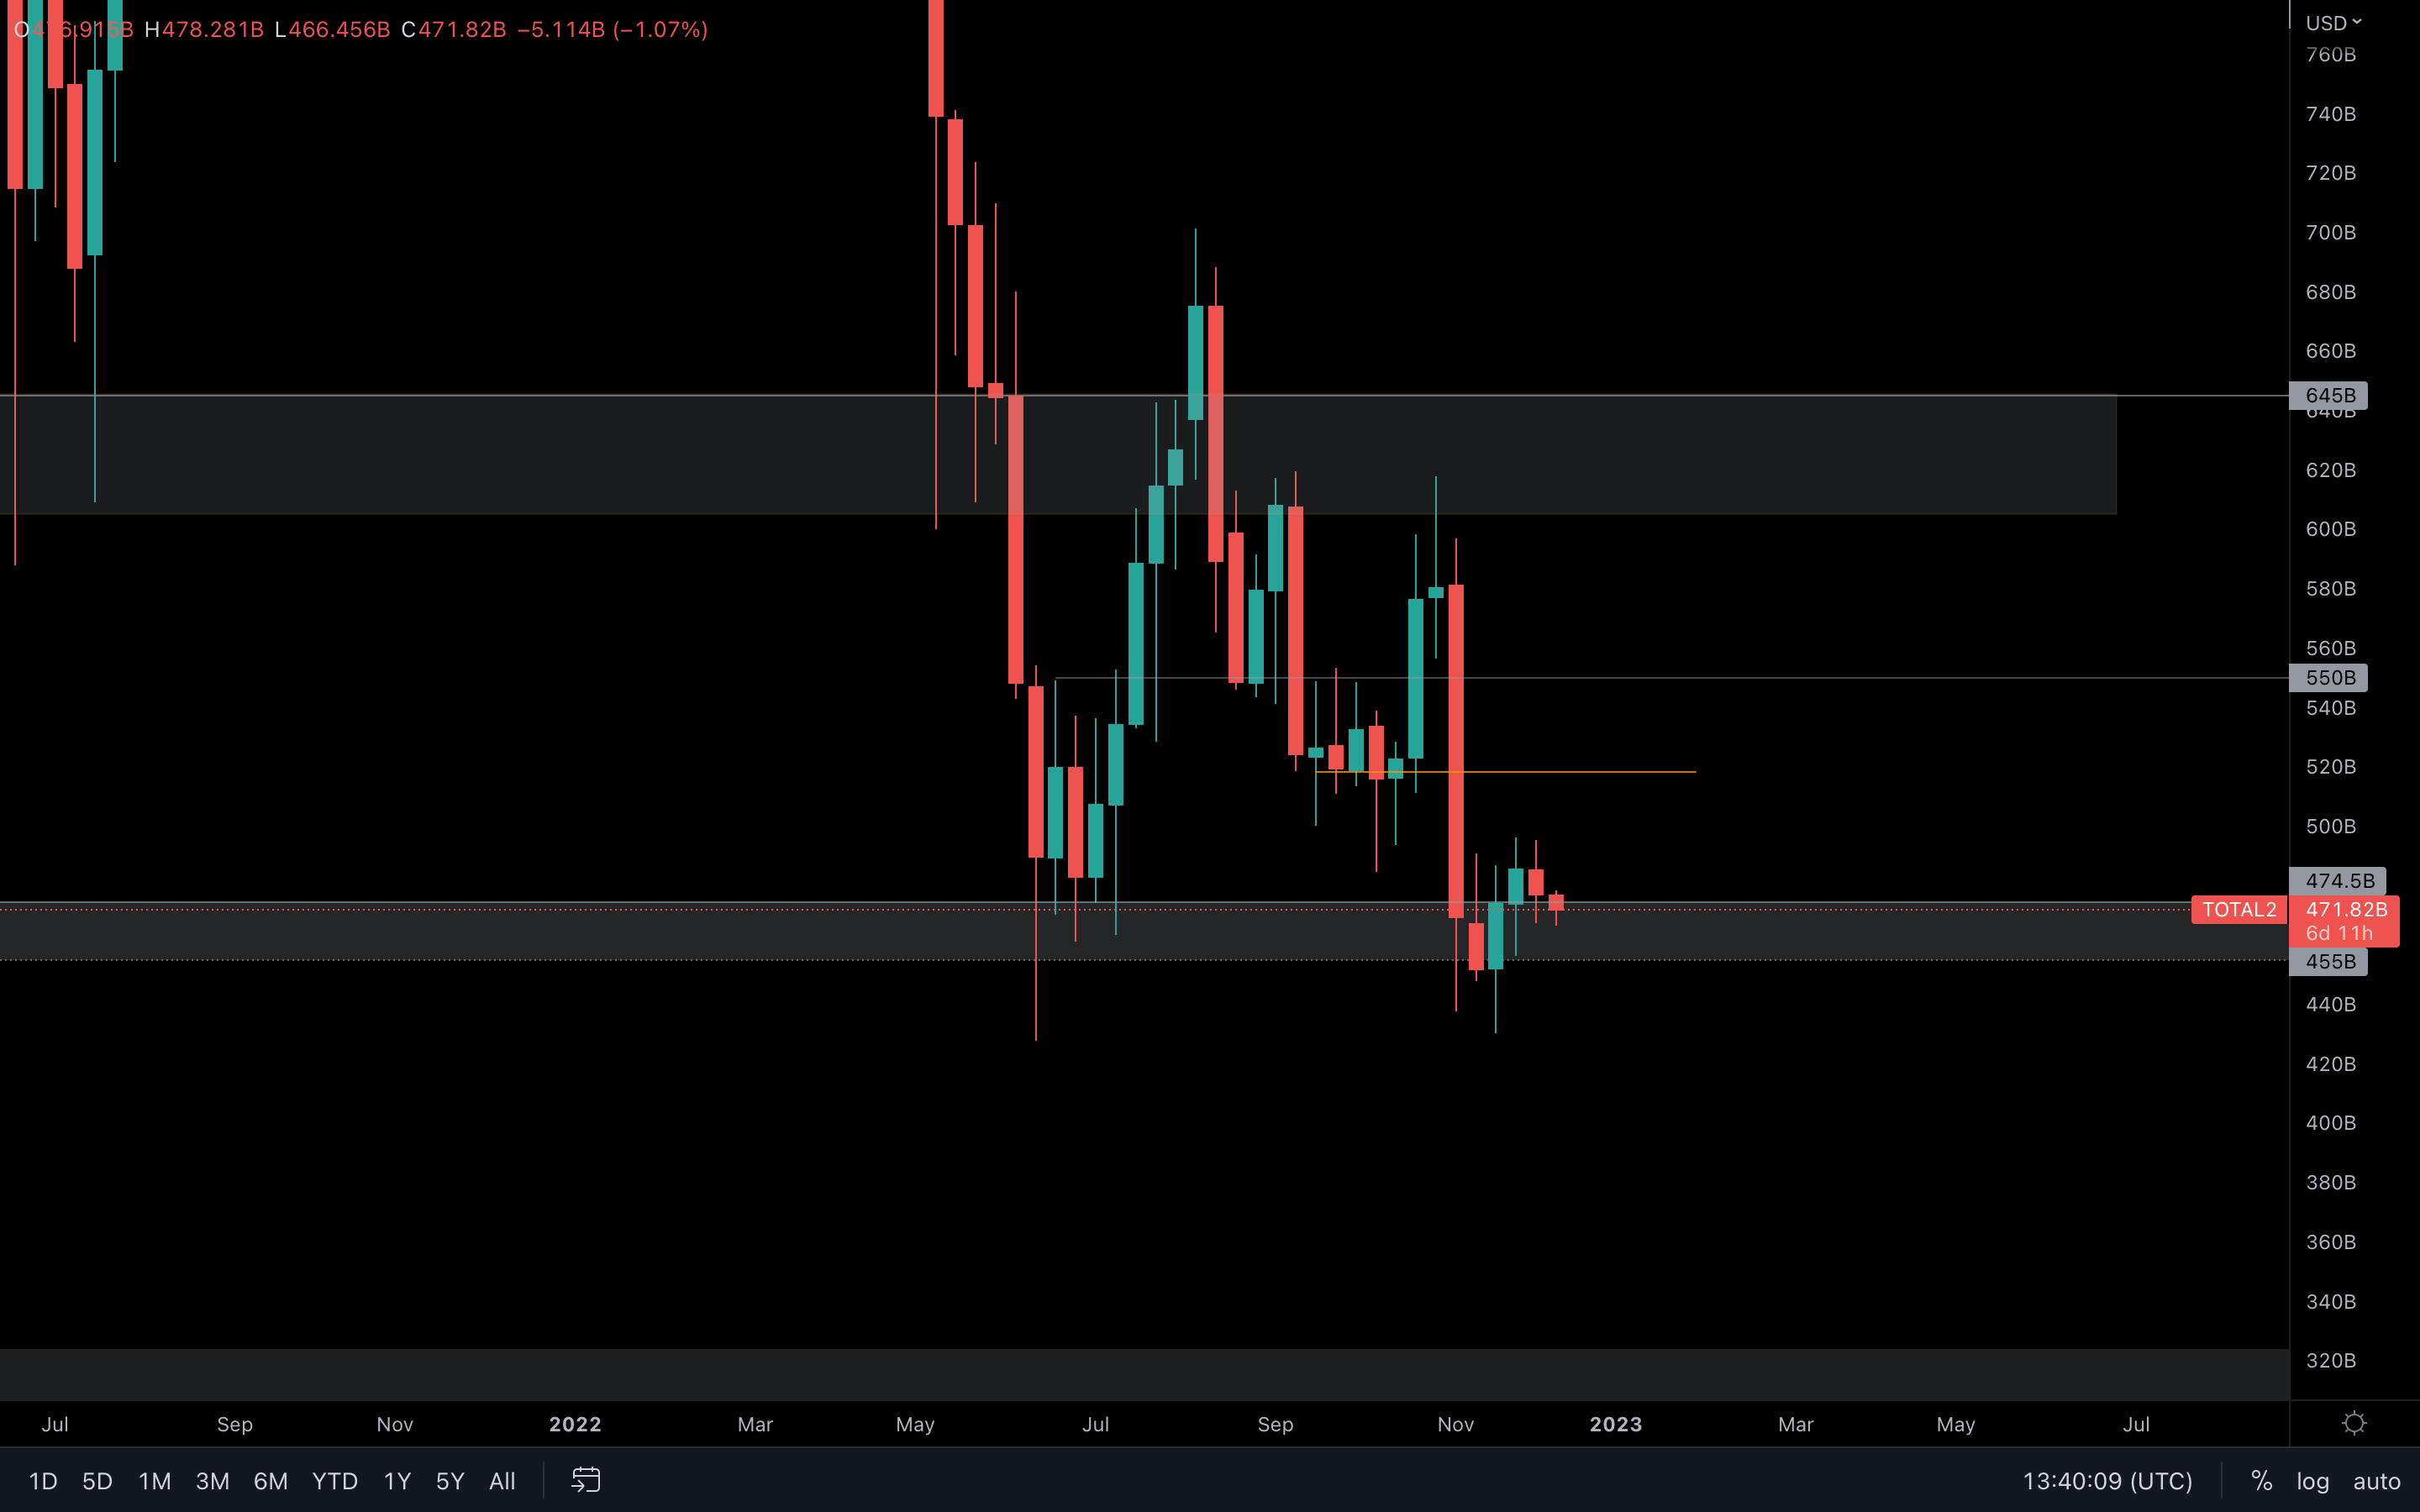
The Altcoins Market Cap index is back in this local support area. To put it in simple terms, this area currently acts as a safe zone. As long as we do not lose $455B, then further ranging can occur inside or above it. On a shorter timeframe, we could be looking at a $455B test driven by the Total MCap's price action.
BTC | Bitcoin
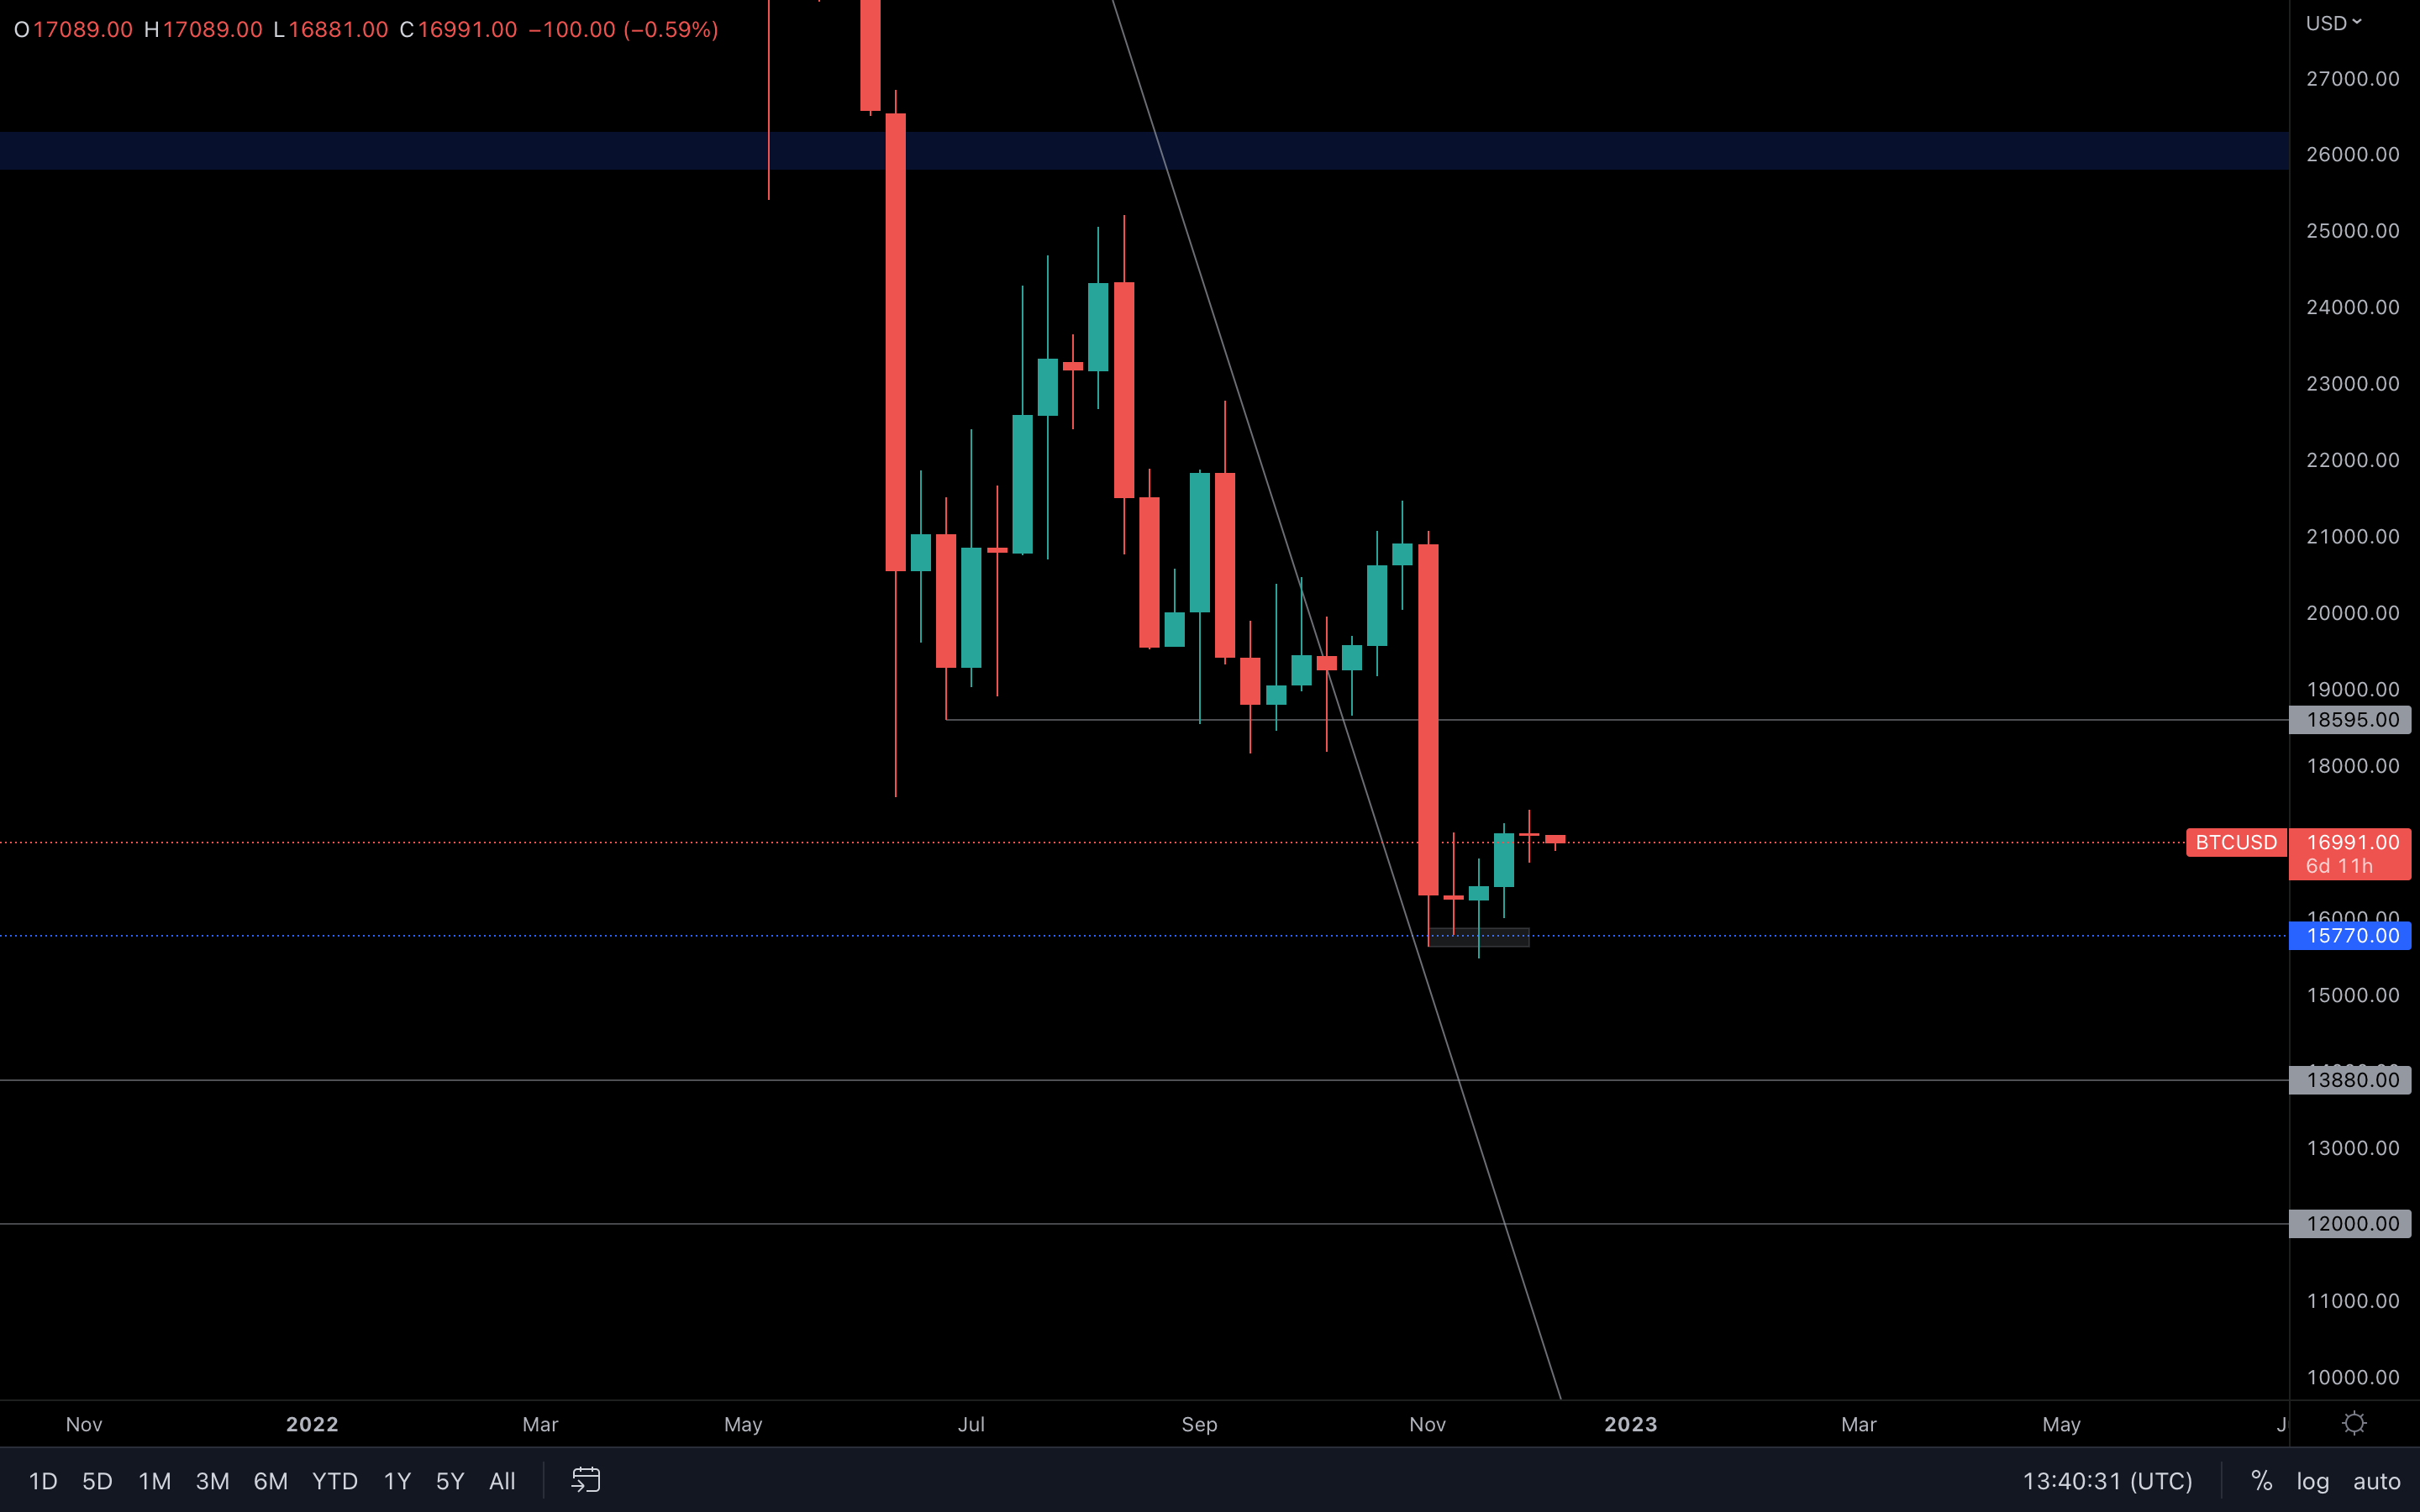
What we can see here is that a Doji candle was registered last week - this type of candlestick usually suggests indecision, a battle between buyers and sellers. This makes predicting an asset's next move hard. However, that's not the case here. Since both indexes (Total MCap & Altcoins MCap) have shown signs of weakness, we can assume Bitcoin will be going toward $15,770 next. Invalidation of this scenario occurs when the previous high ($17,400) is broken and reclaimed.
Now we will dive into some on-chain metrics for further investigation.
The Puell Multiple | BTC
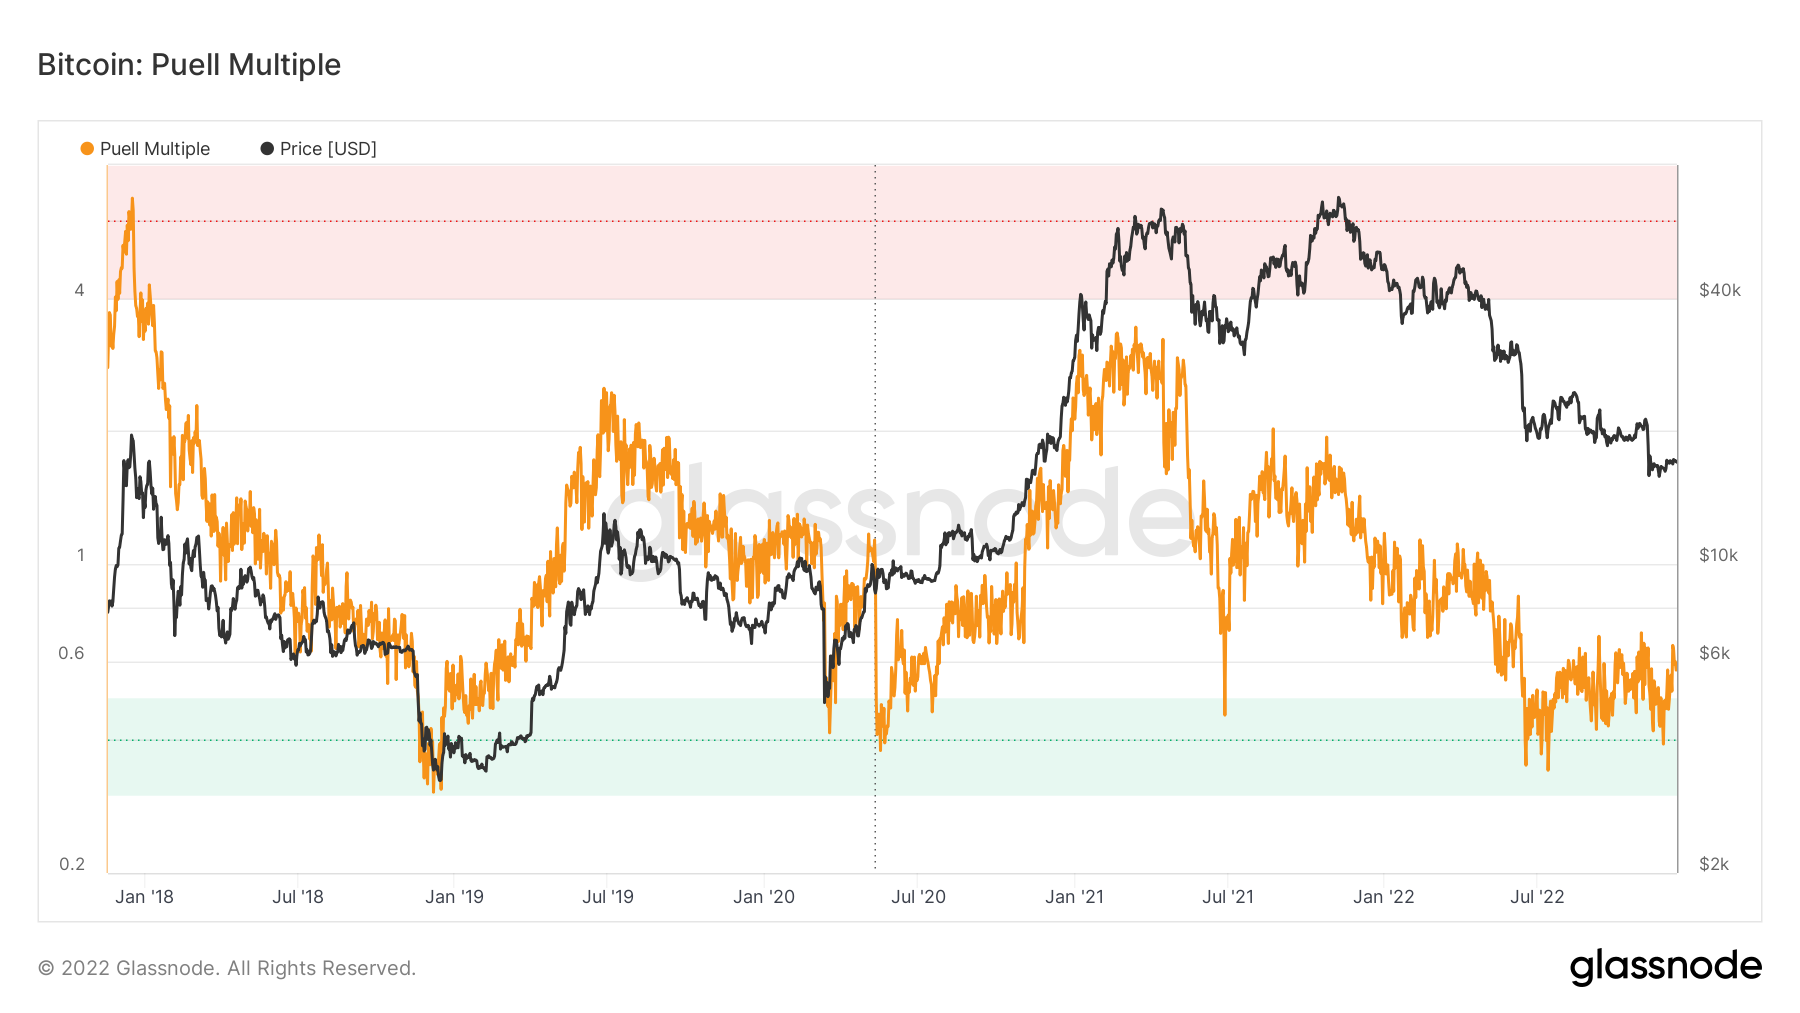
The Puell Multiple has been able to show when Bitcoin may be reaching a USD price level which is historically cheap - the metric shows when the daily issued bitcoins are cheap compared to the past year.
MVRV Z-Score | BTC
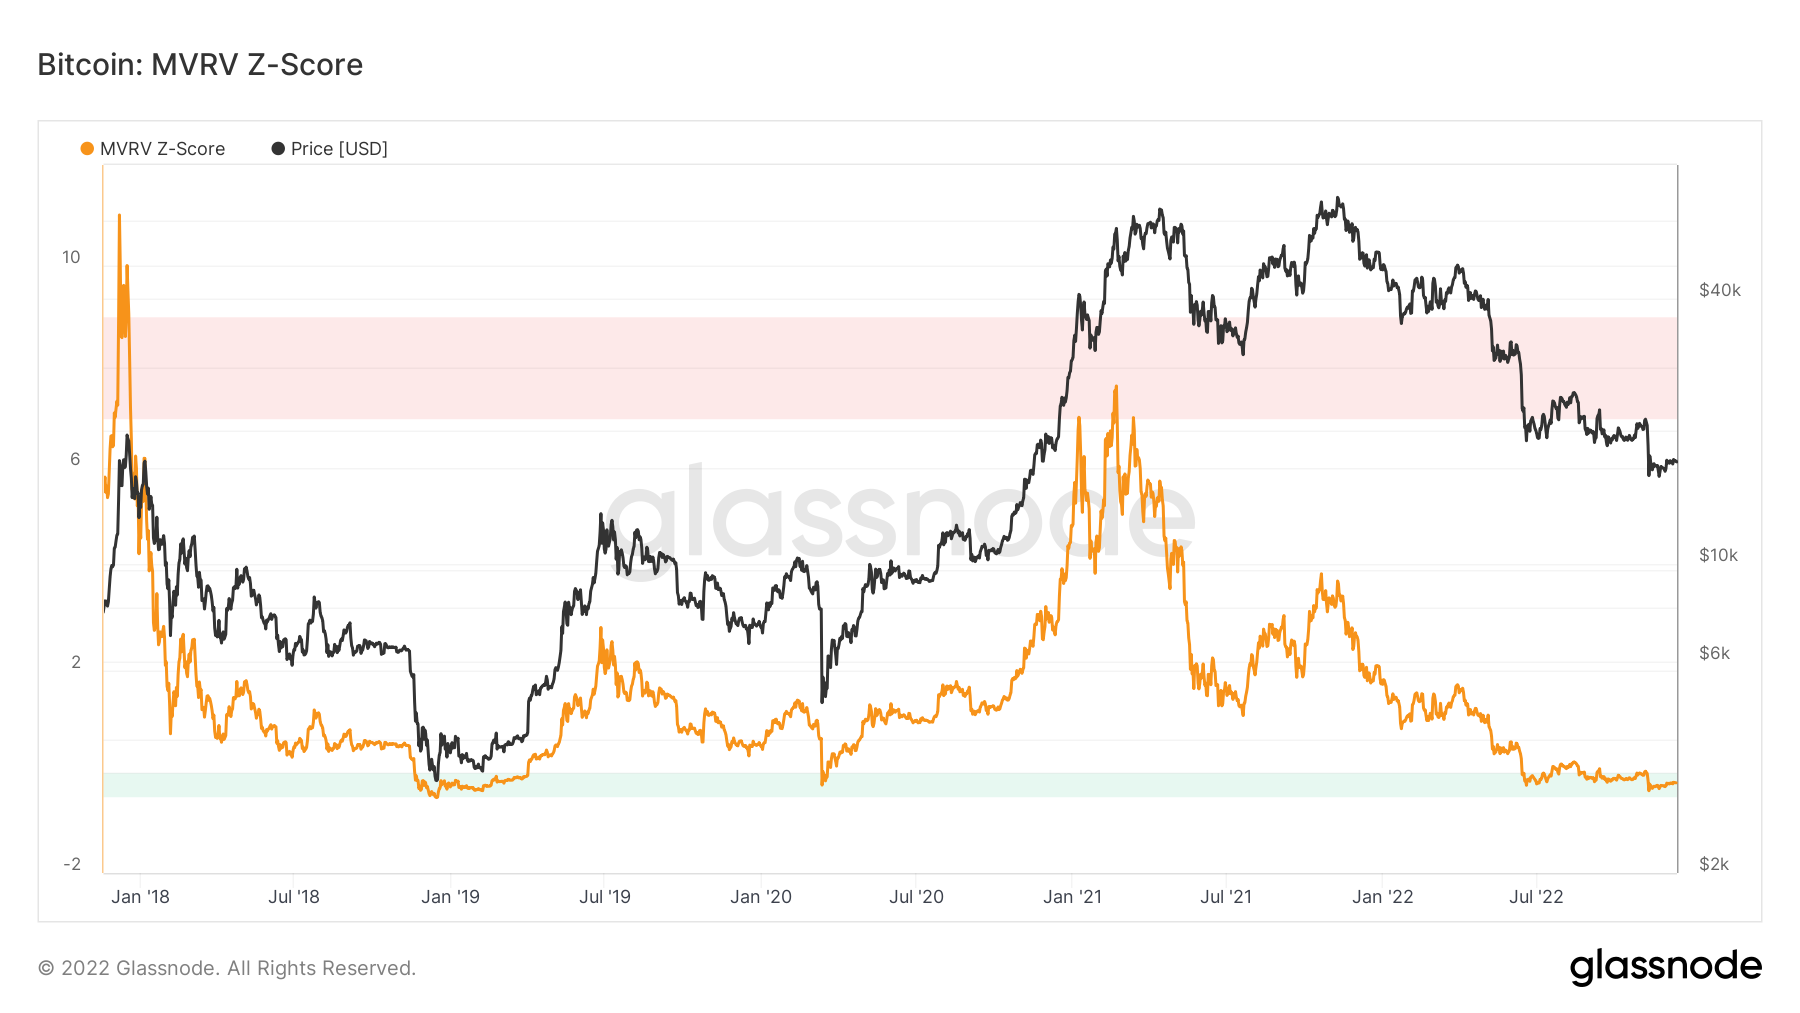
If we zoom out and look at the MVRV Z-Score, we can see that Bitcoin is still in significant value territory relative to its “fair value” and therefore, a DCA approach at current prices could be considered.
Hash Ribbon | BTC
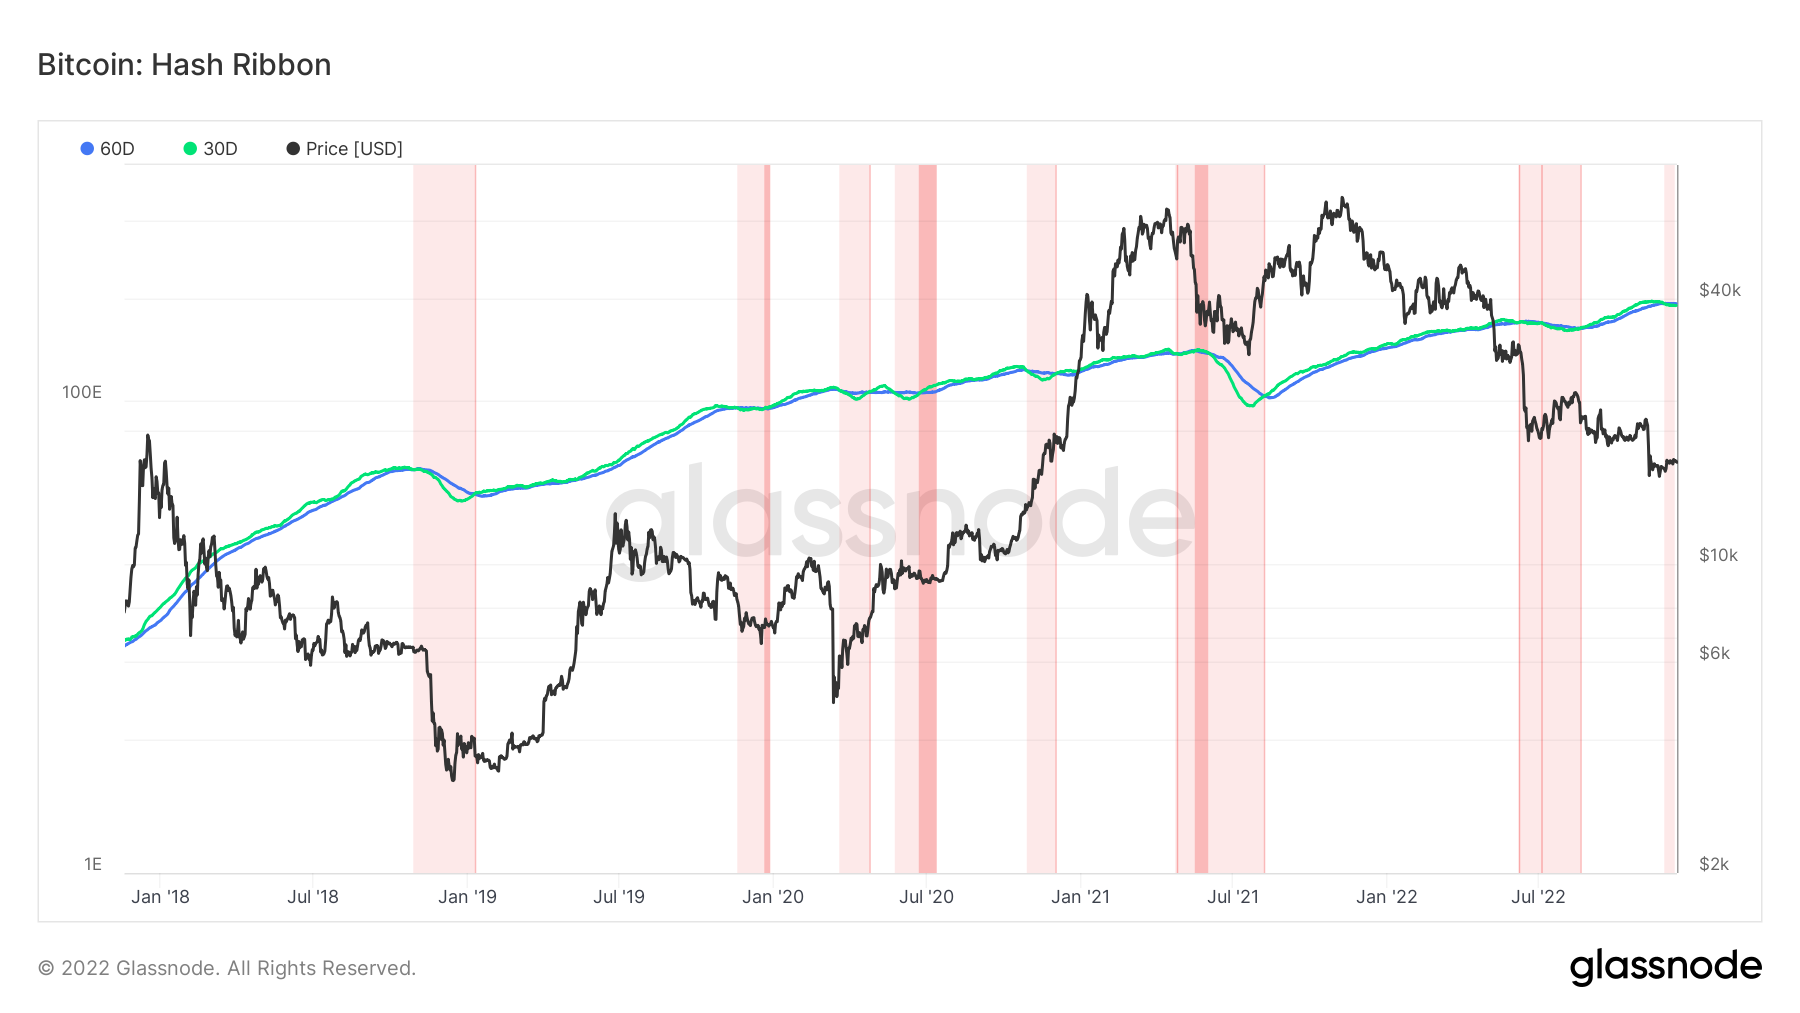
We know that with Difficulty and Hash Rate coming down, this means some miners have turned their rigs off. We, therefore, study the Hash Ribbon as it assumes that Bitcoin tends to reach a price bottom when miners capitulate.
Miner capitulation is a key characteristic of late-stage bear markets. The Hash Ribbon suggests that Miner Capitulation is over when the 30d MA (green line) dips relative to the trend and then crosses back above the 60d MA (blue line). Looking at the graph below, we can see that we are in the early stages of this but that this is forming.
While the technicals show that BTC may see some short-term downside volatility because of the FED. The indications that we are near or at the bottom are ramping up.
ETH | Ethereum
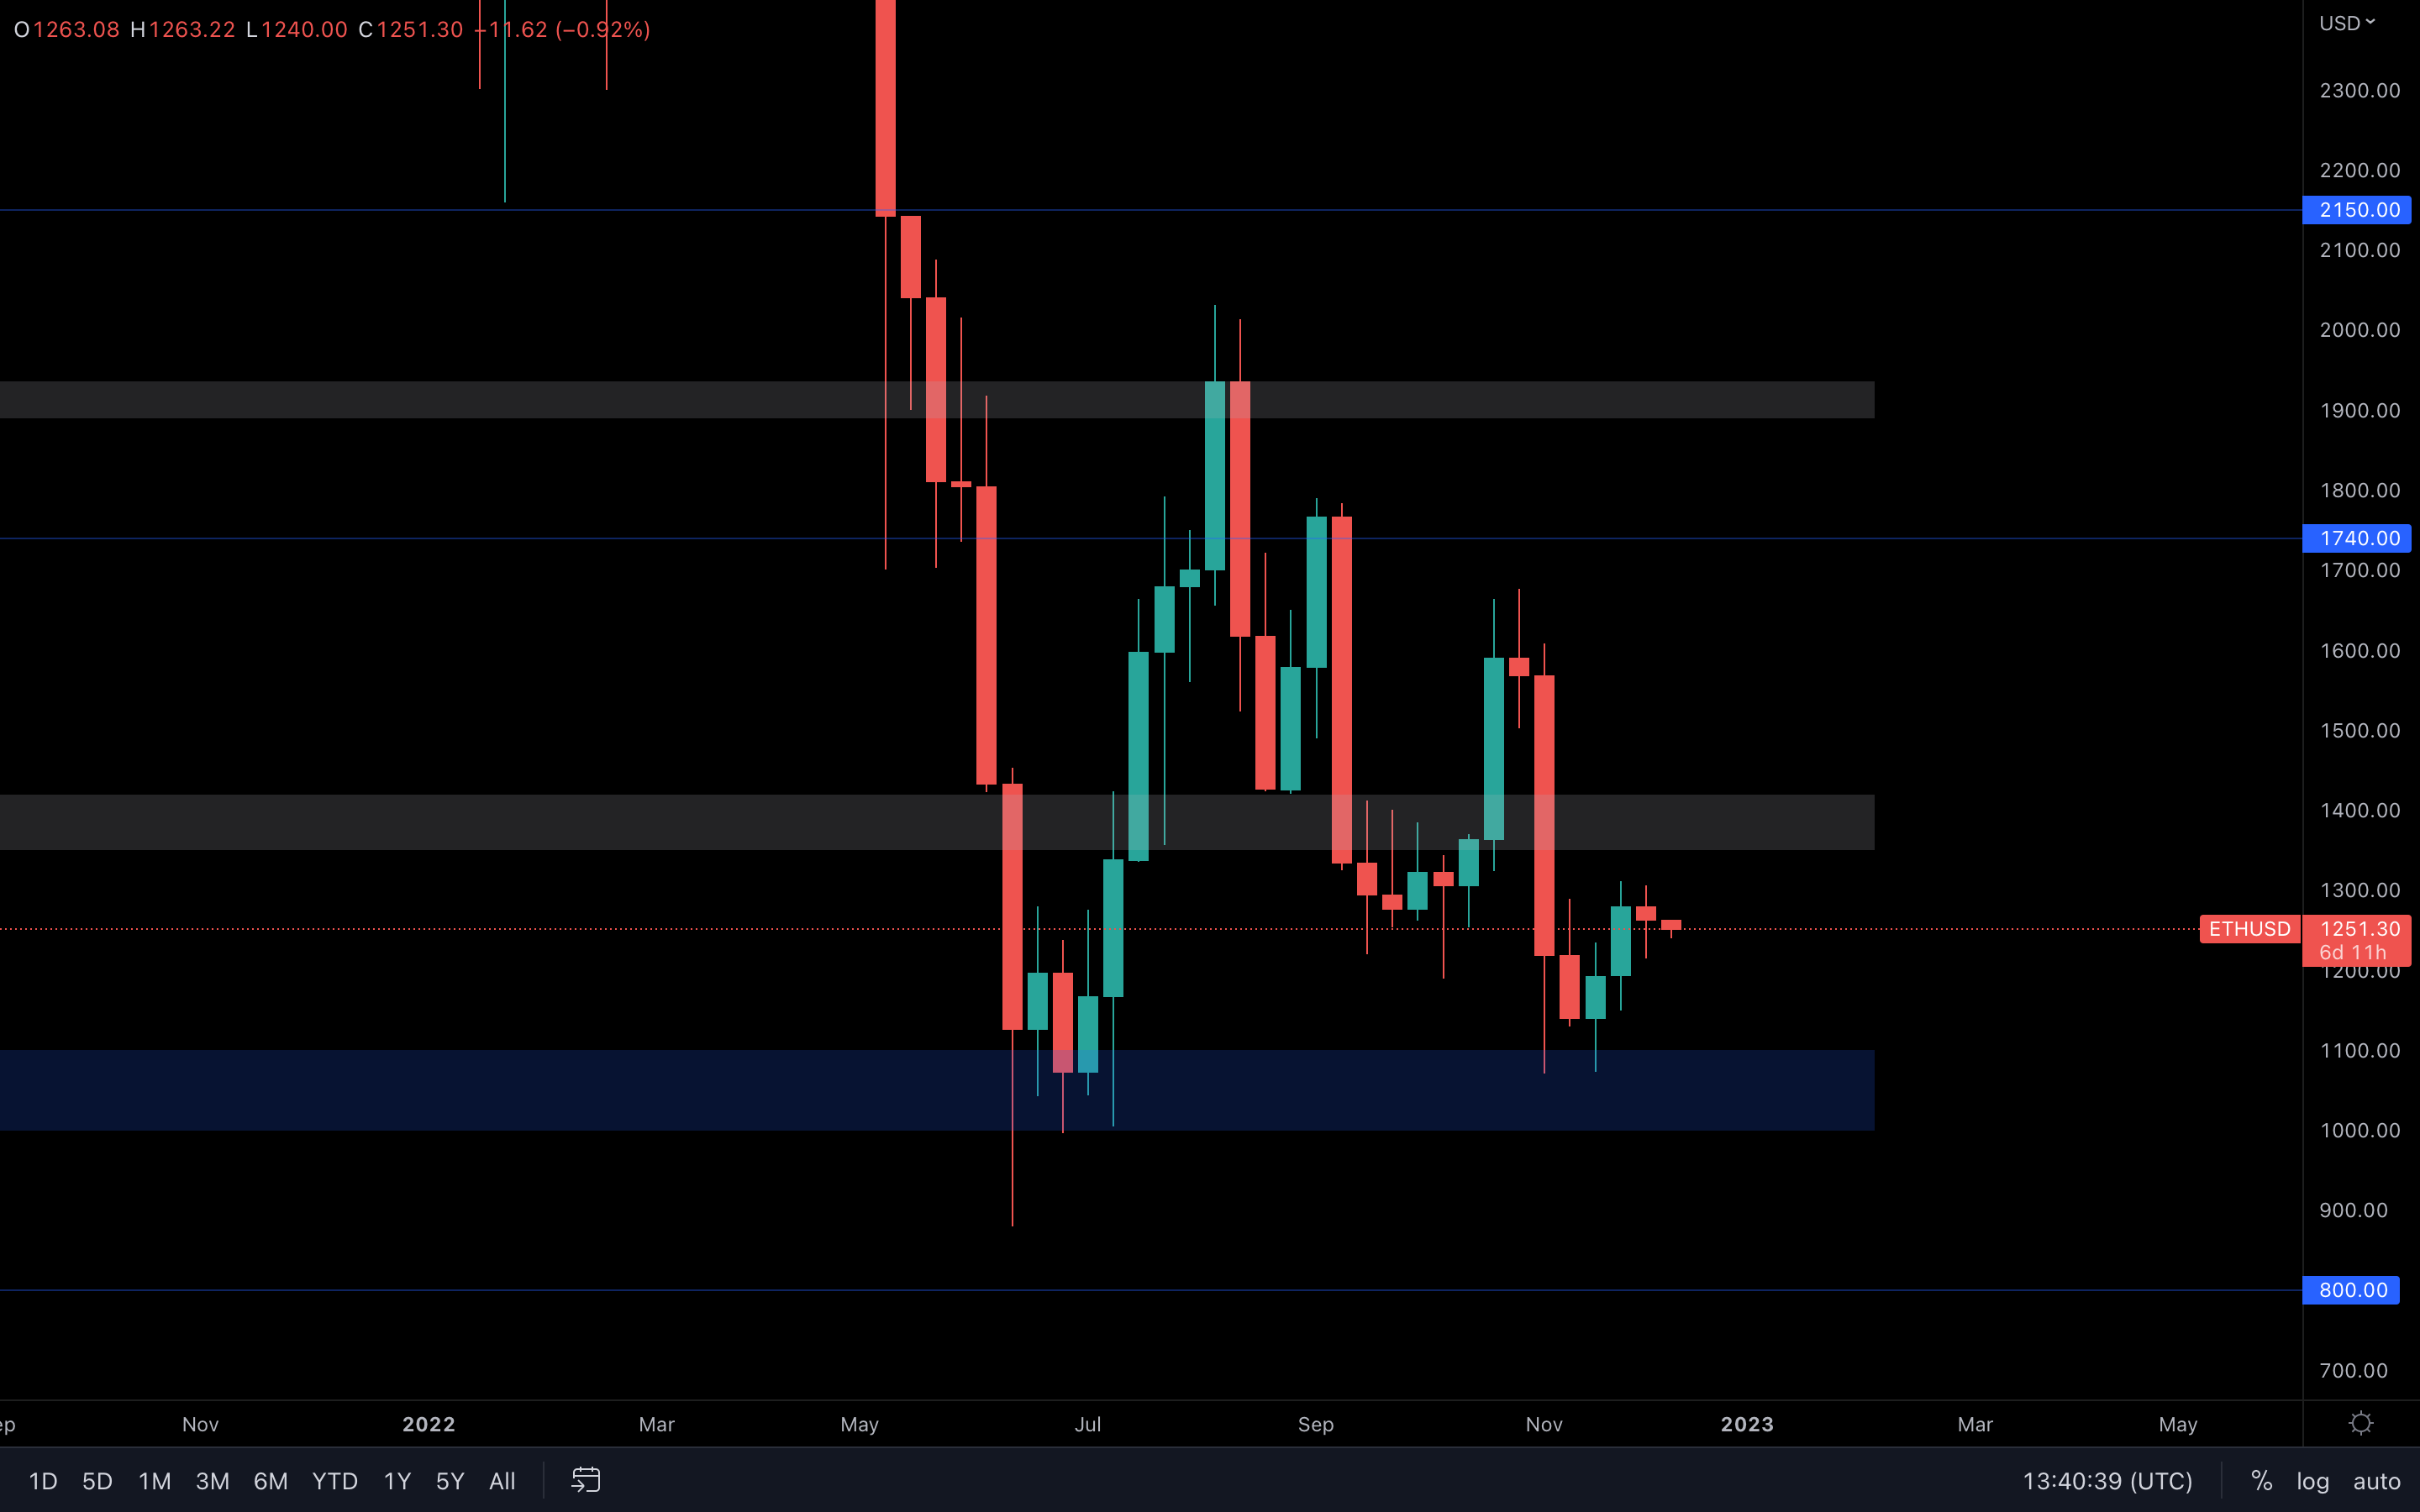
ETH may also see another test of $1,100 but as long as that remains an unbroken support then a move back up to $1,900 is on the cards.
SOL | Solana
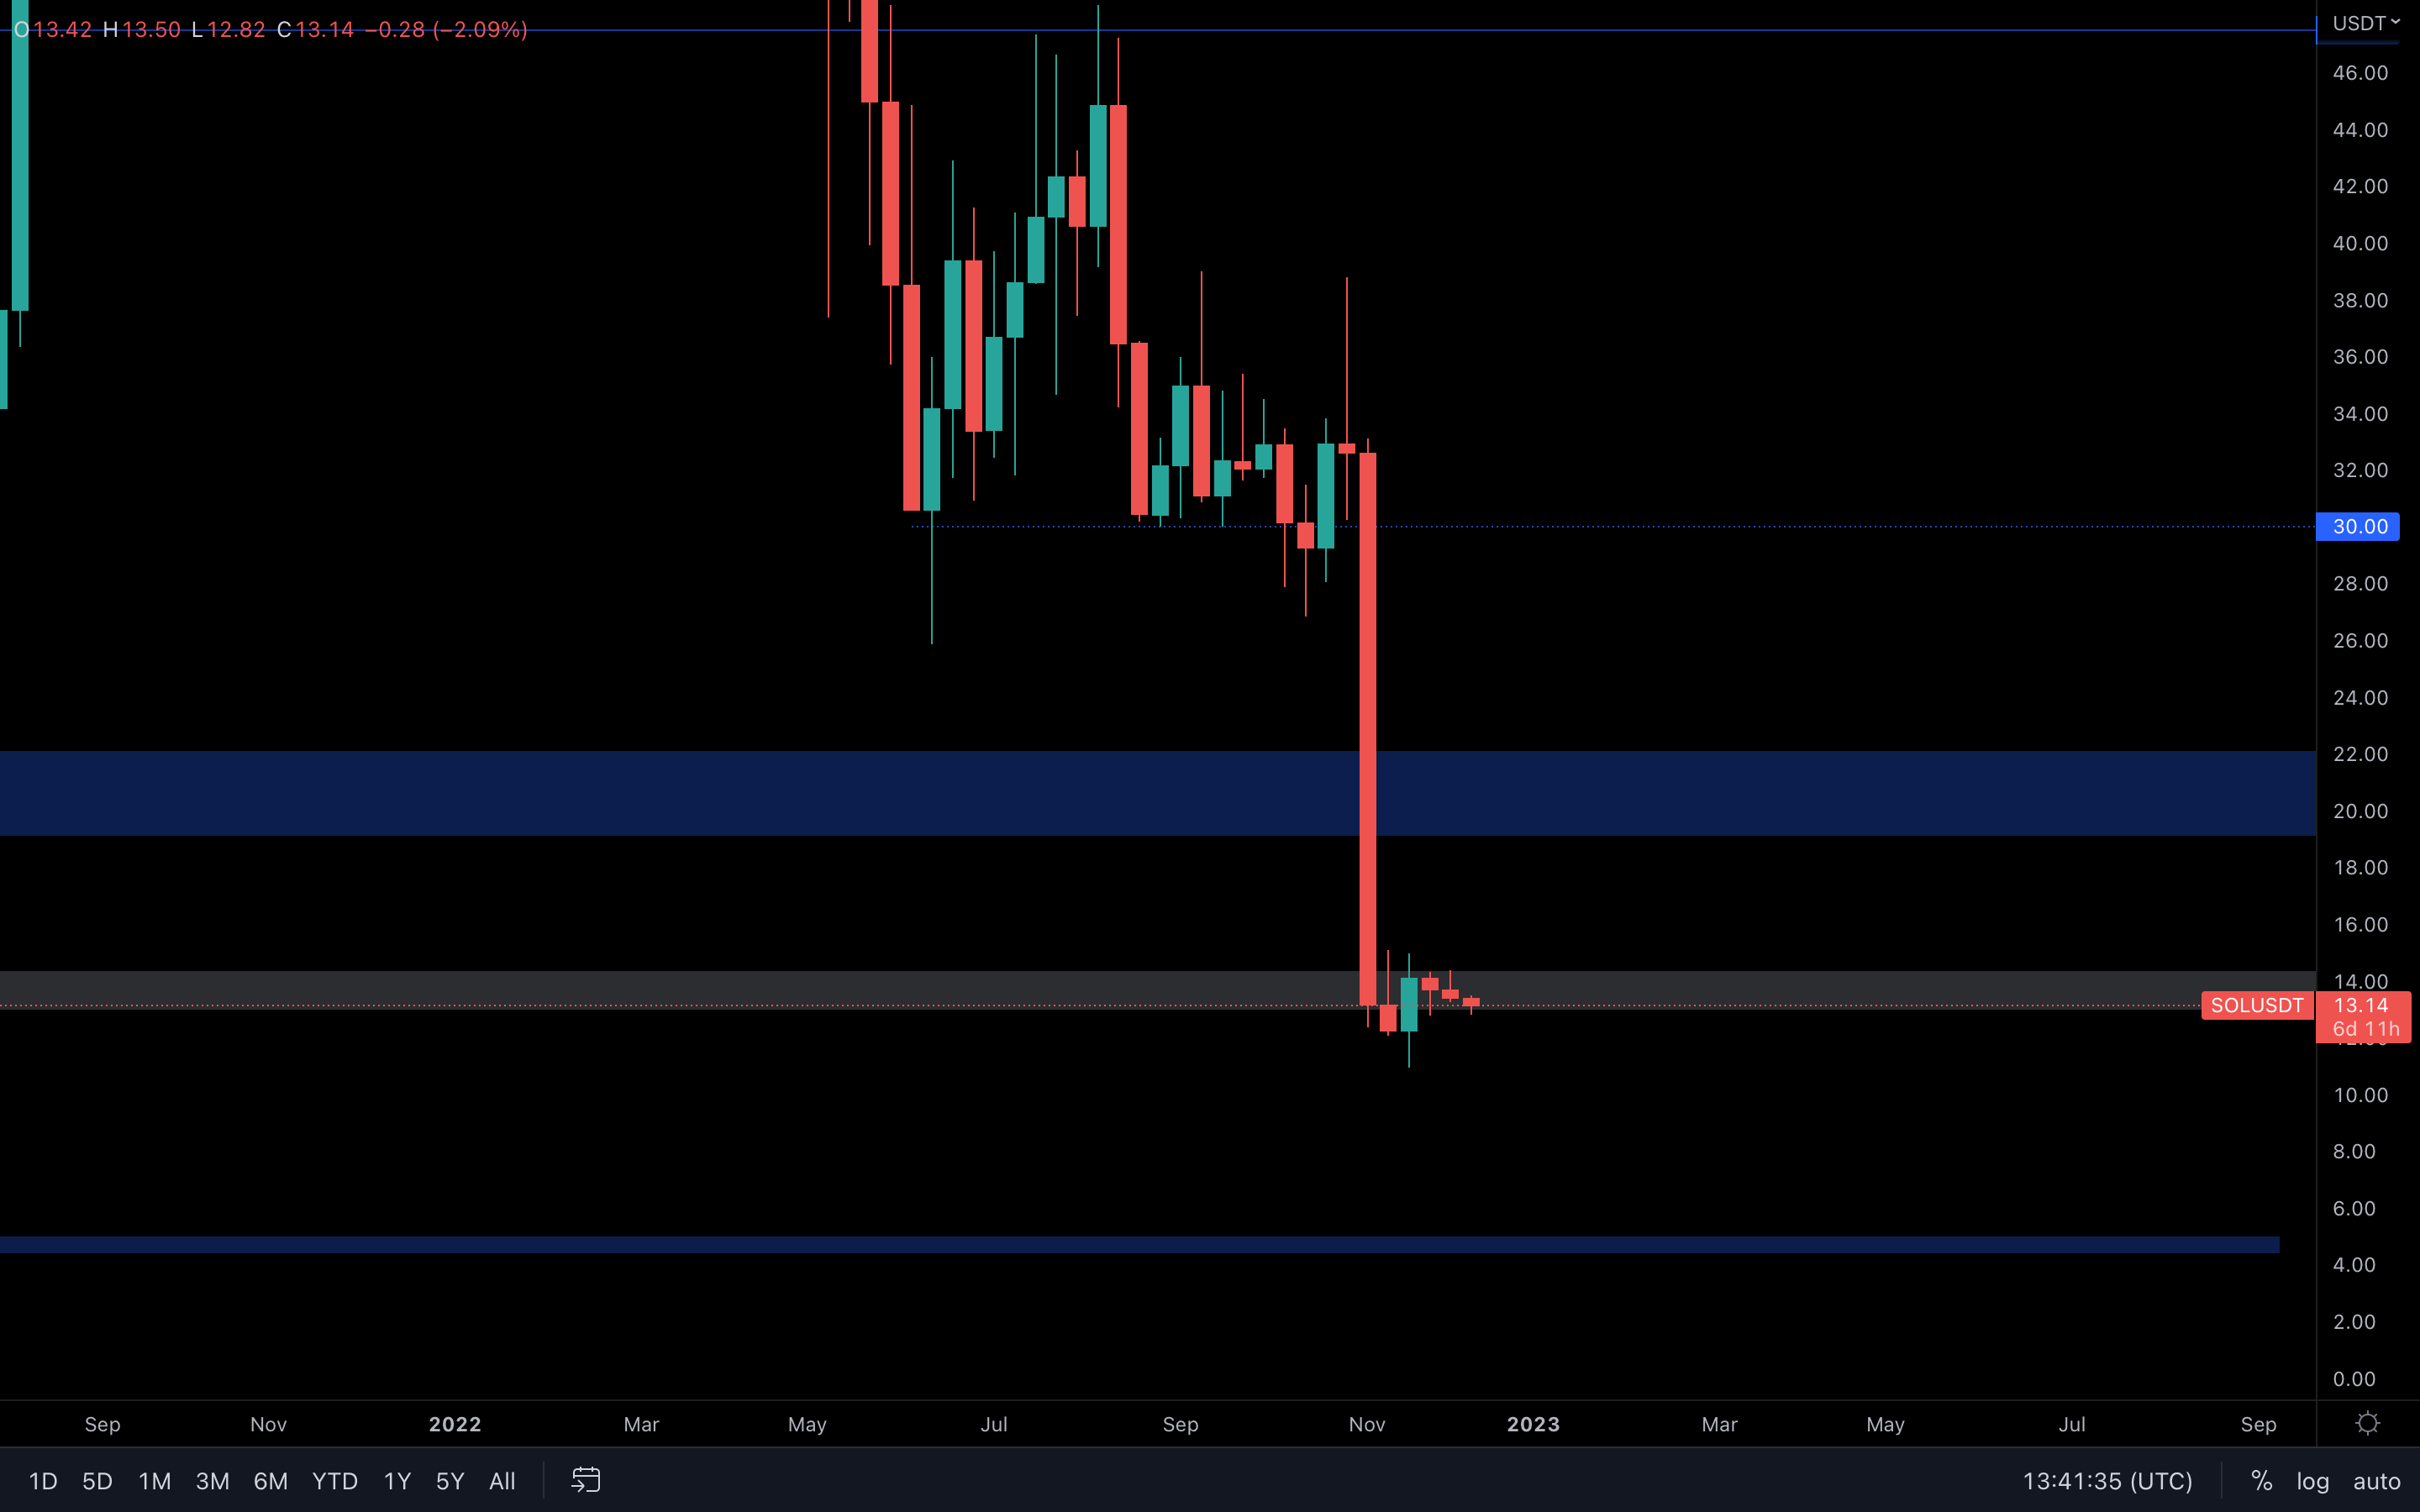
SOL is still suffering from boring price action disease, and it doesn't look like that will change anytime soon. For now, the asset is still at support so we cannot assume further downside until a loss actually occurs. Expect ranging between $13 and $14.35. If a daily candle closes under $13, then we should expect buyers showing up around the $12 level.
RUNE | THORChain
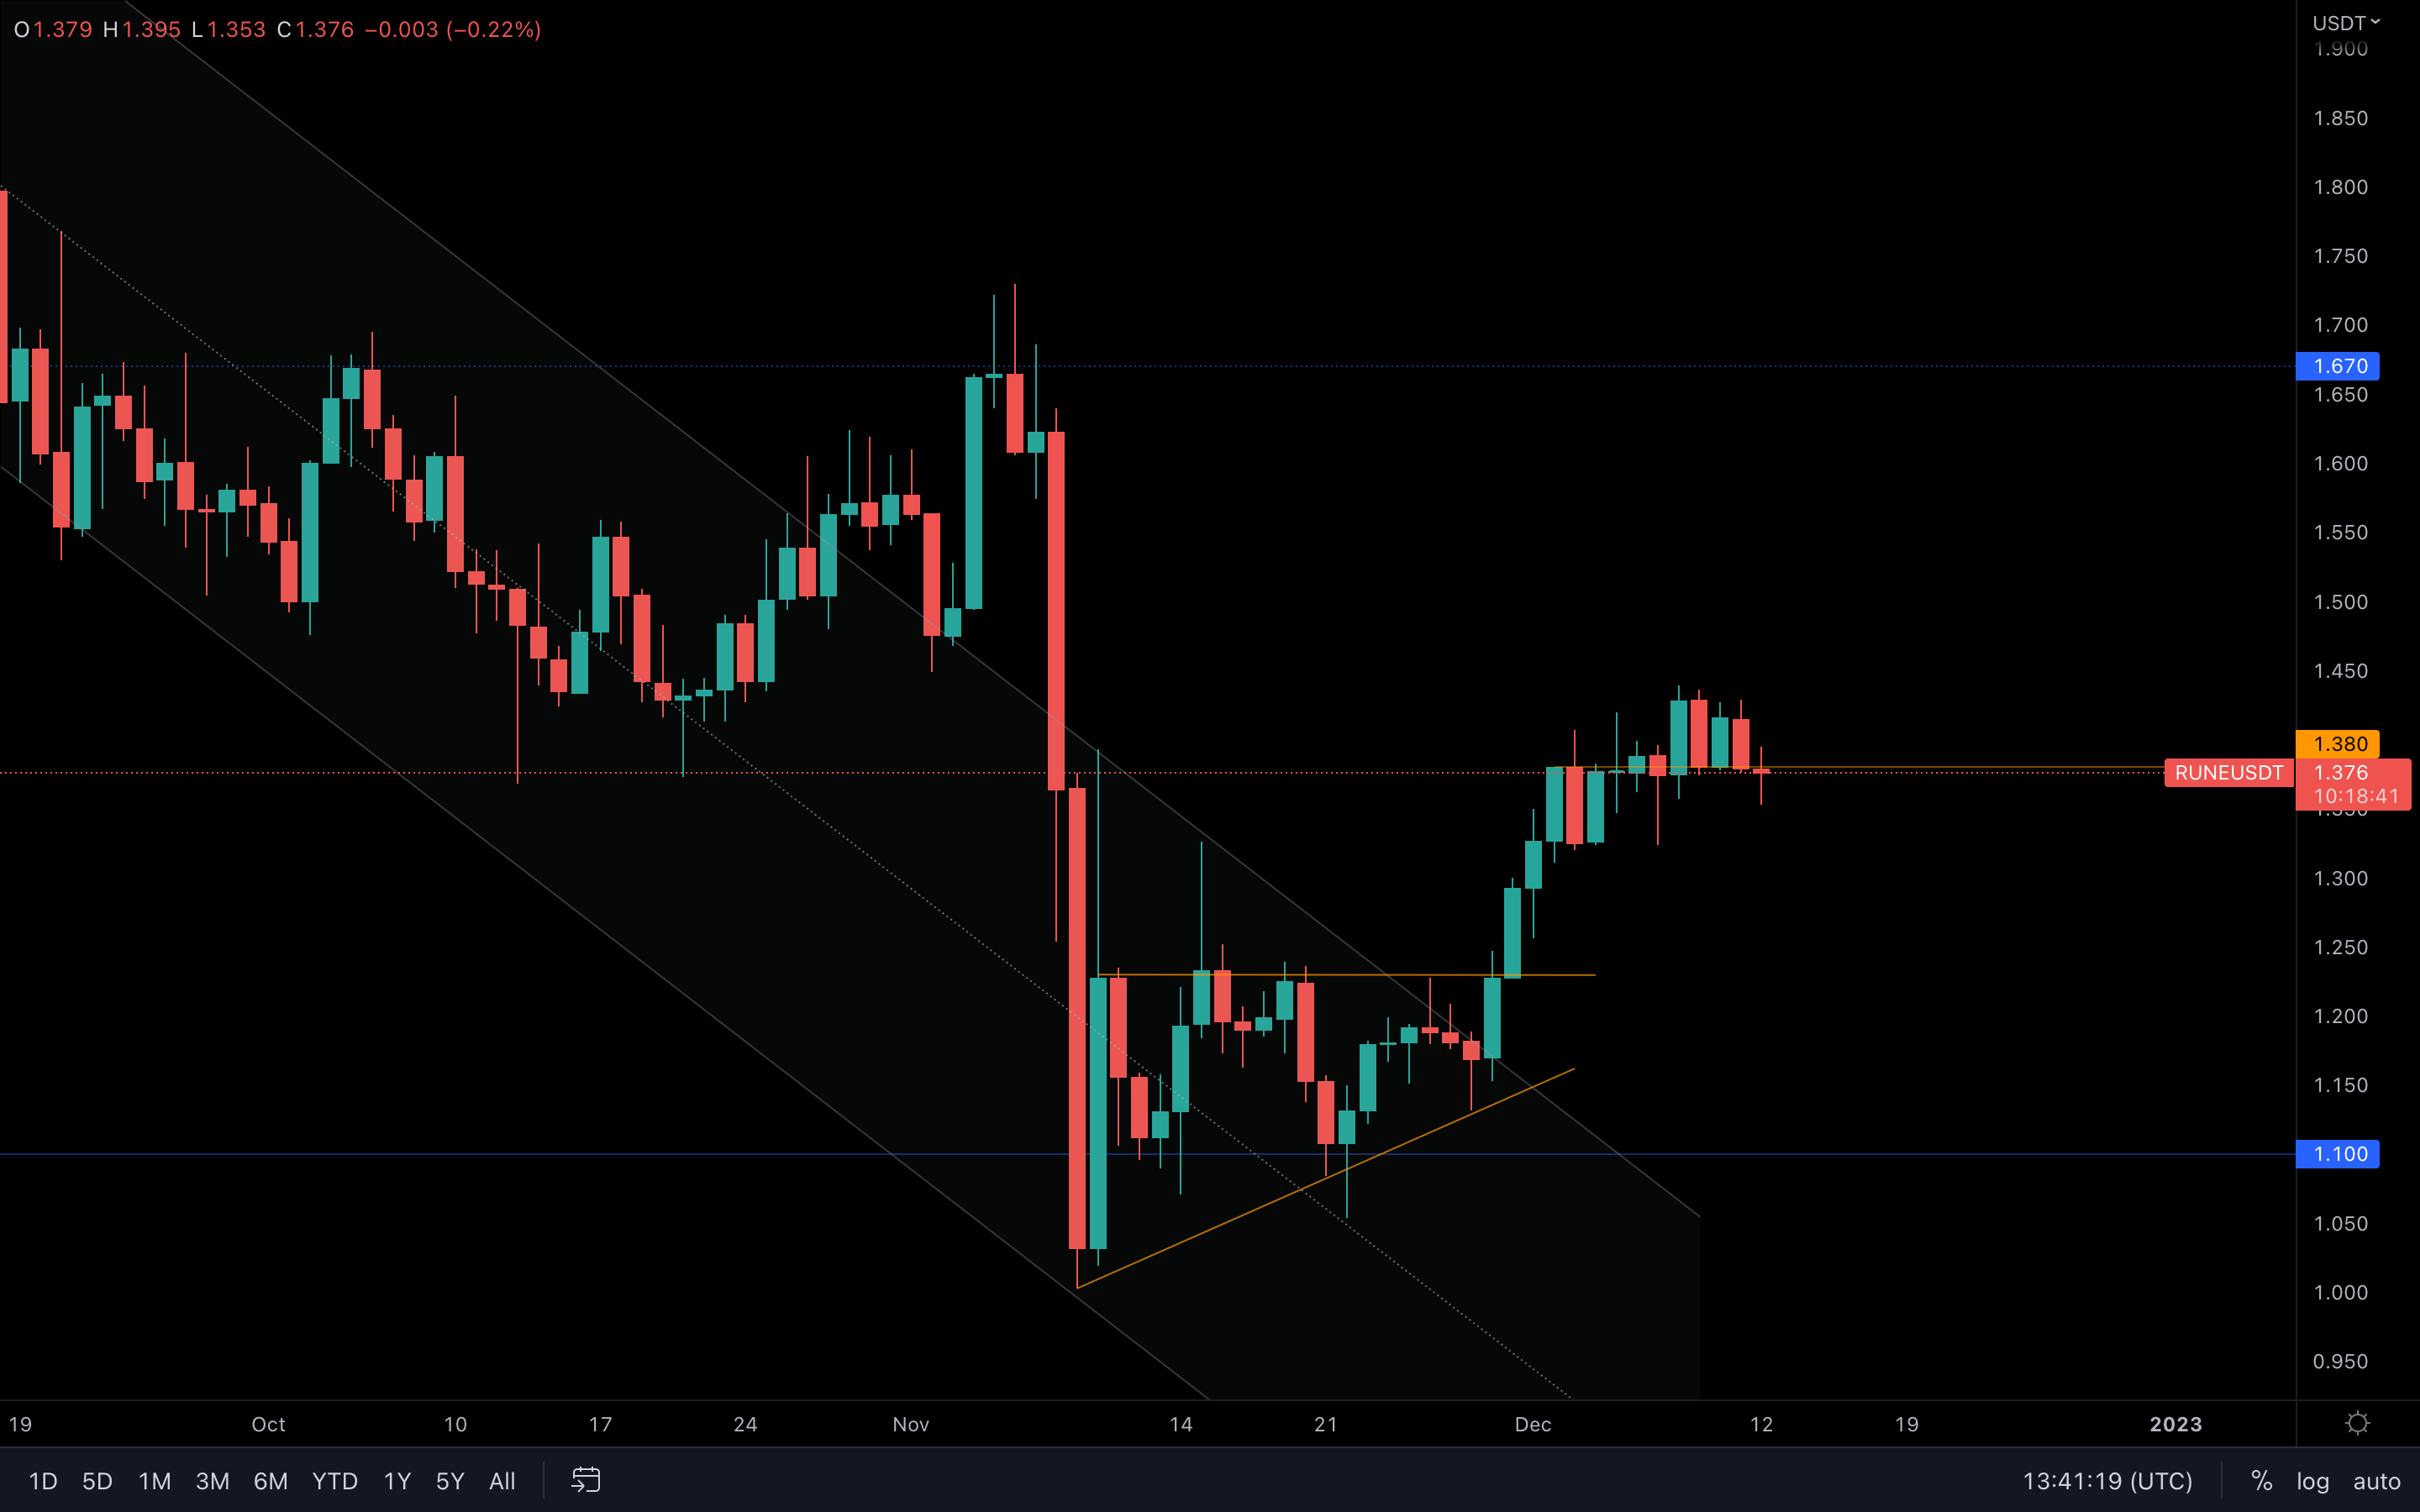
(Daily chart was used) RUNE needs to close above this local supporting trend line ($1.38) to maintain the possibility of further upside. Otherwise, this could become a local top that will push the price of RUNE toward $1.10.
SNX | Synthetix
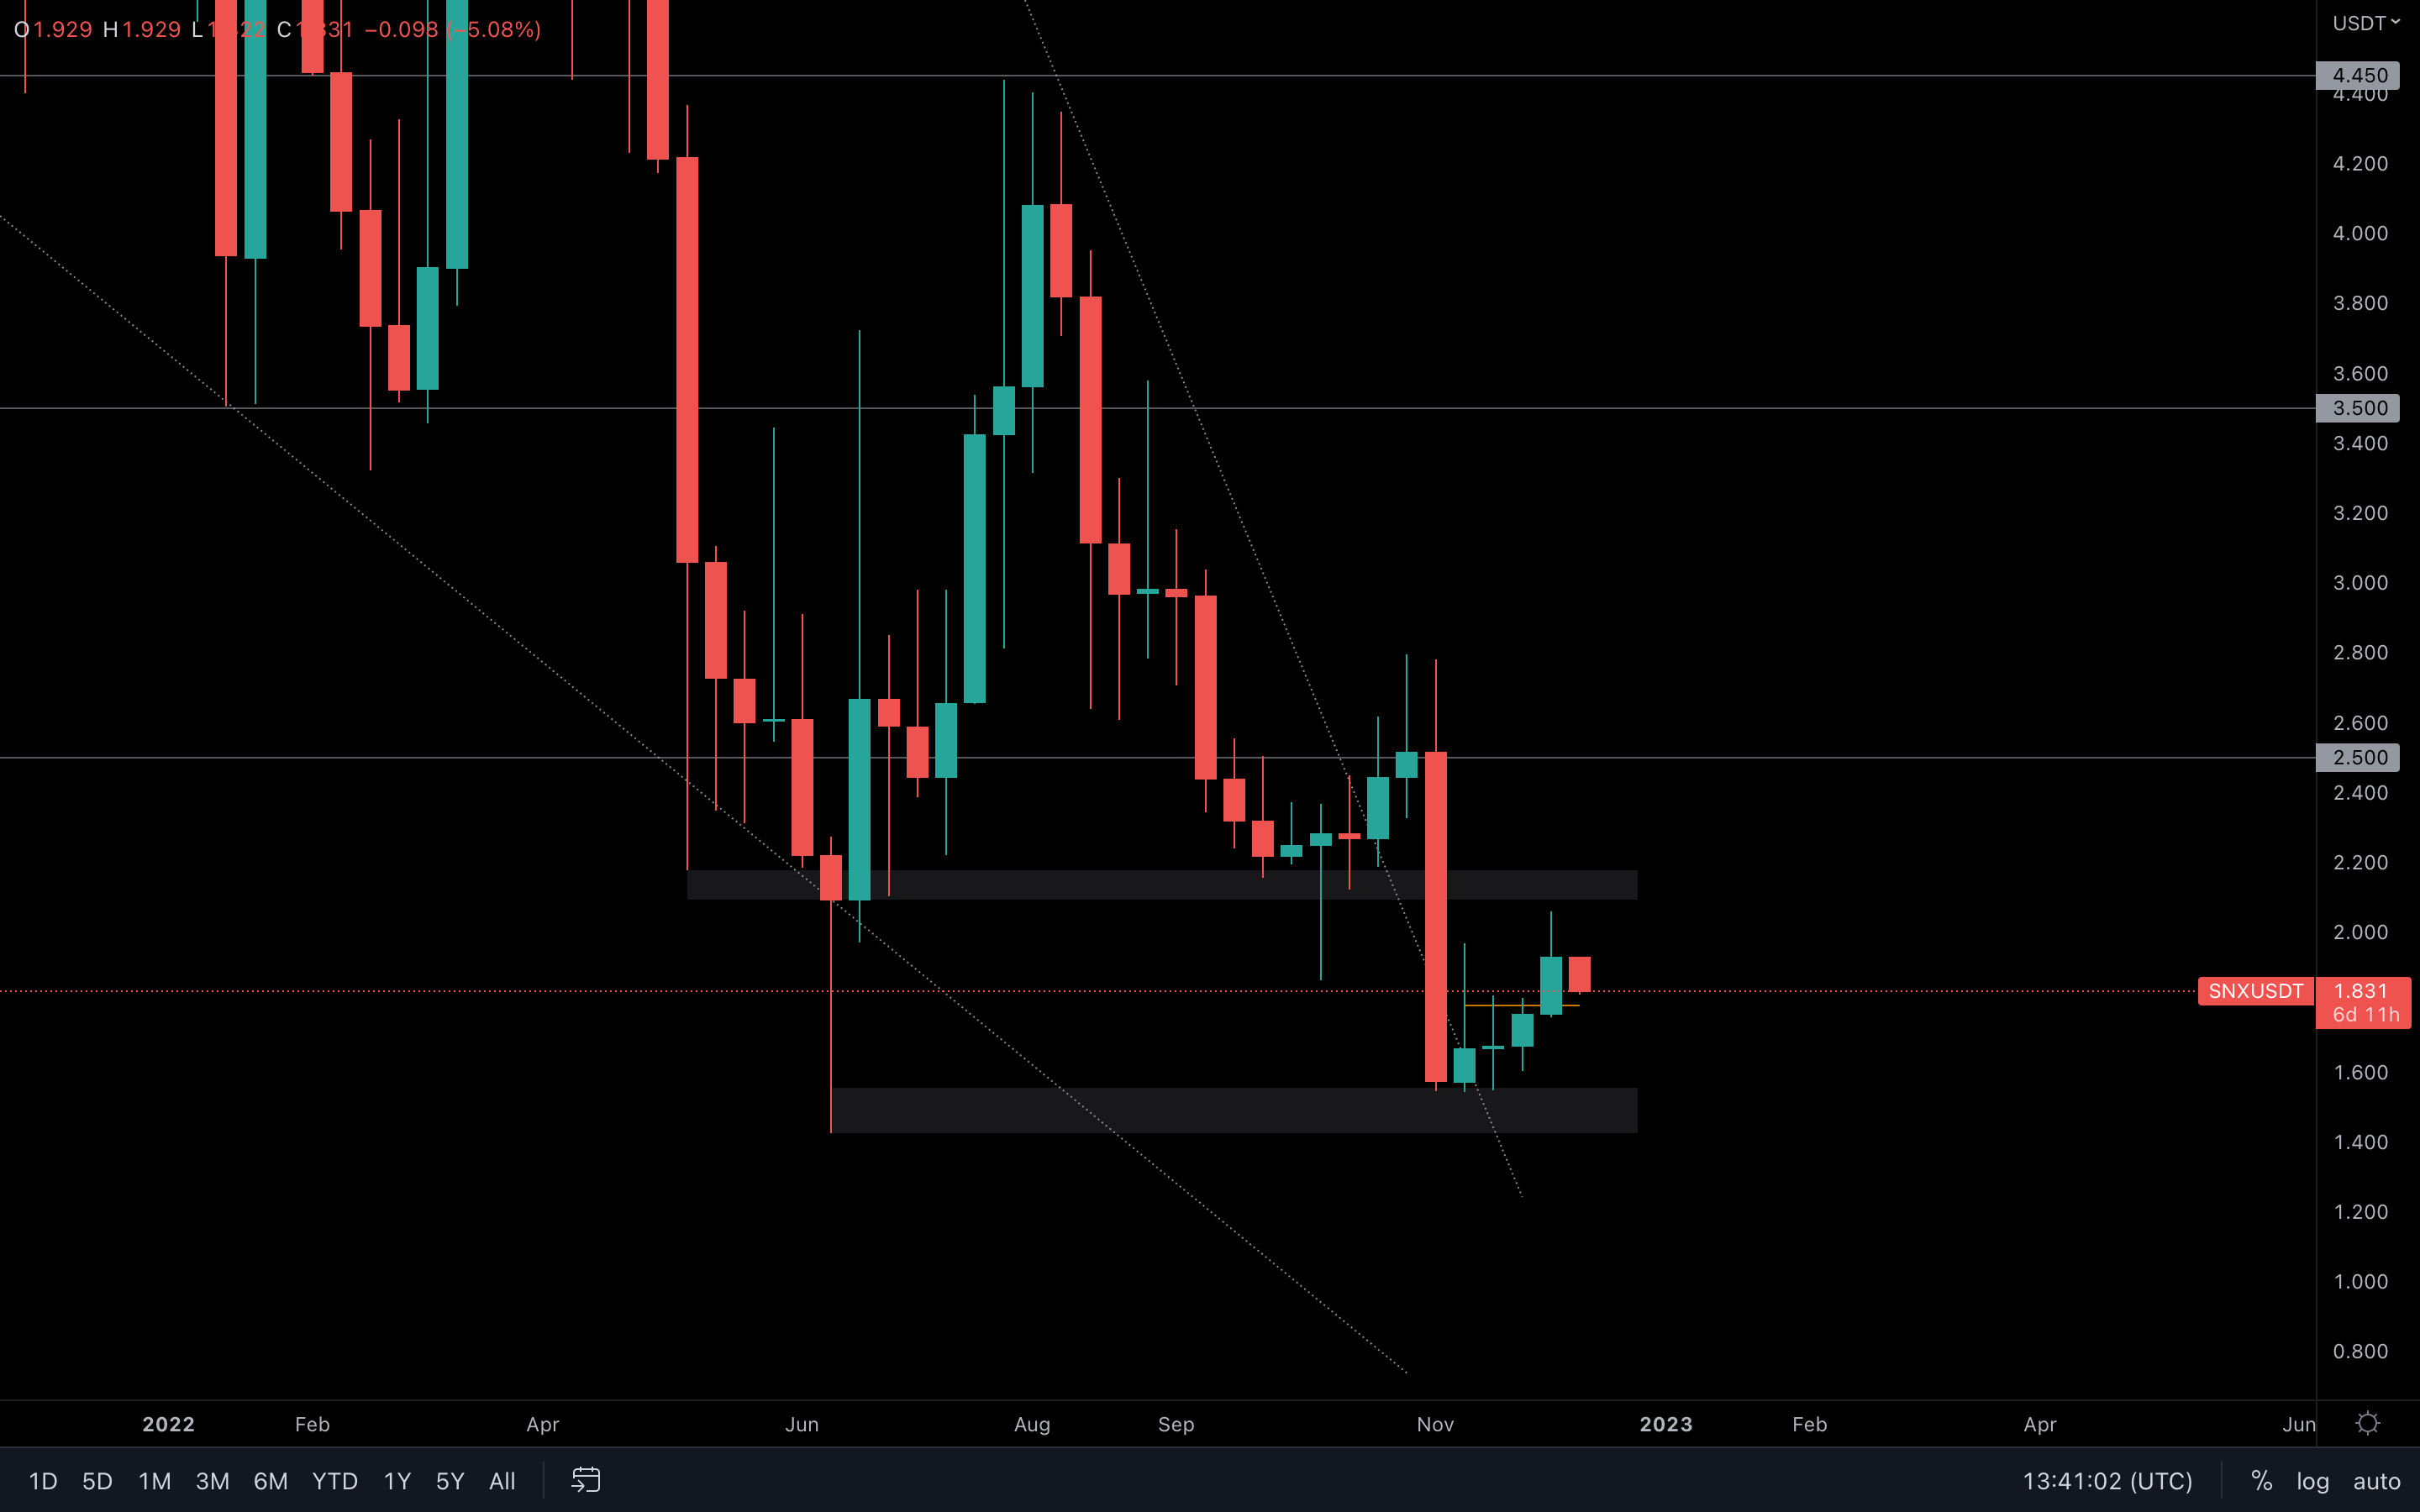 SNX's performance has been sub-par as of late; a second test of $1.50 is on the cards. What we want to see is an end of the bearish market structure through a break of $2.20, this would indicate the start of a new bullish trend.
Alpha-DAO & Cryptonary Watchlist
DOT | Polkadot
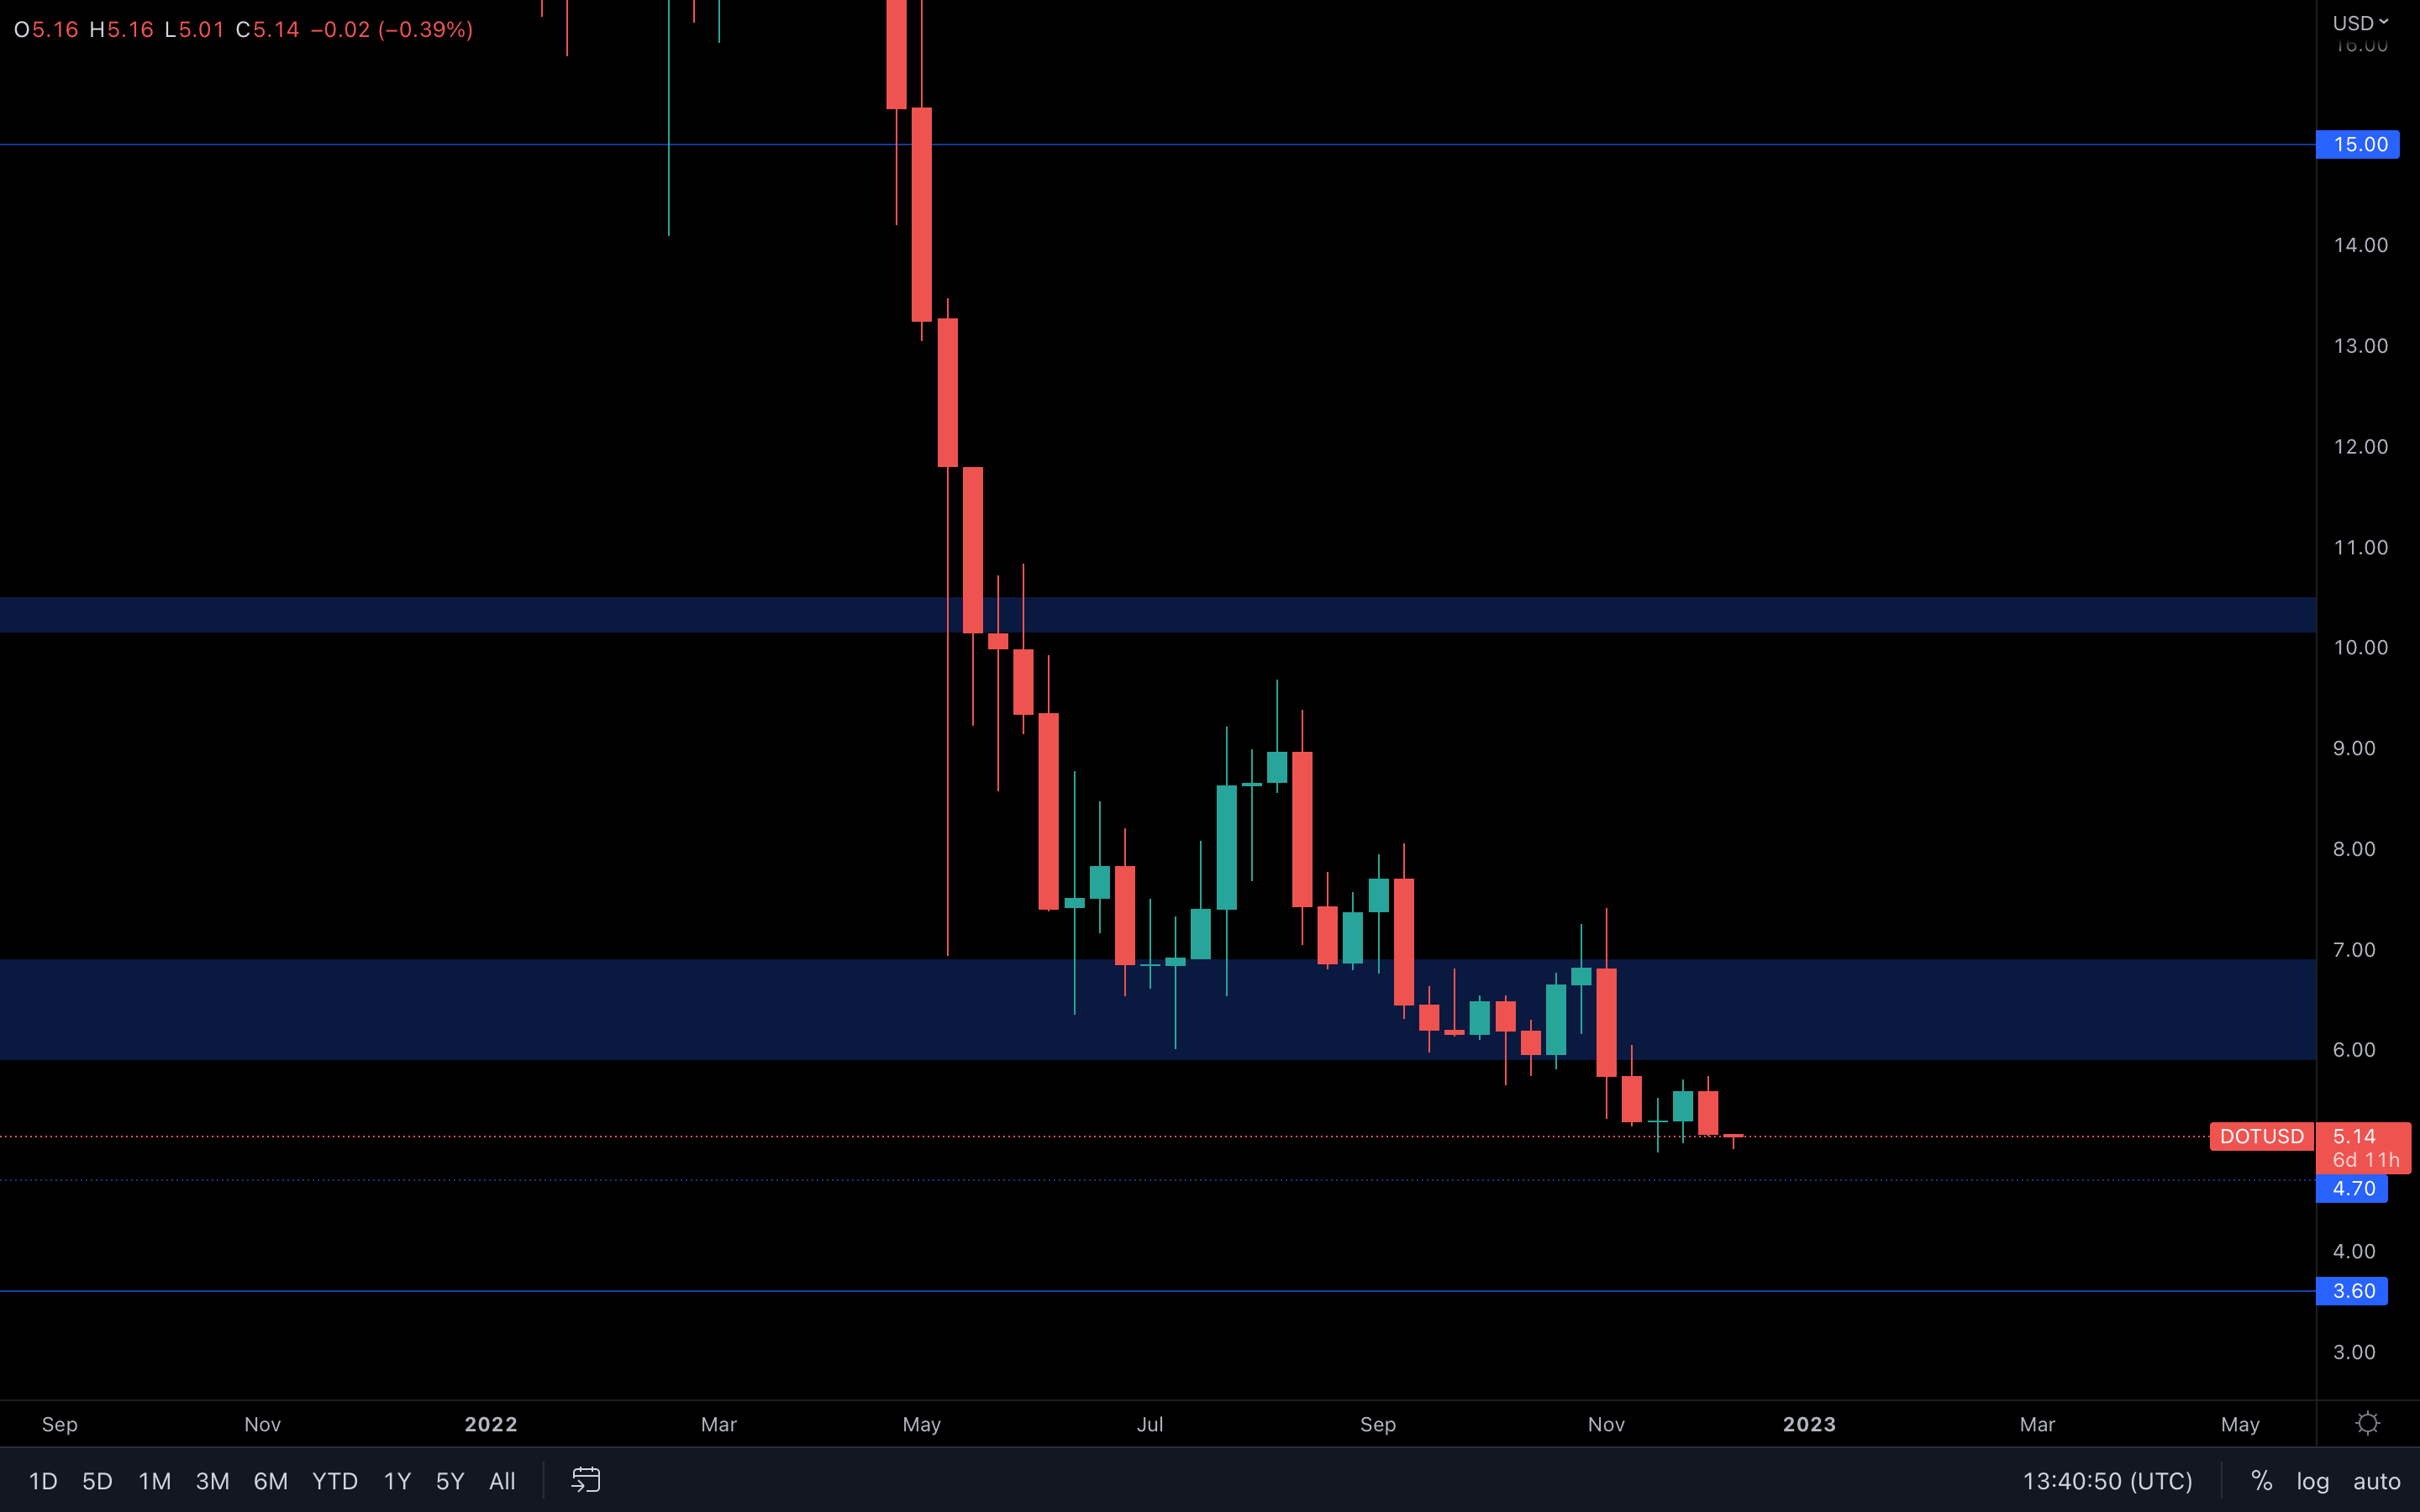
Here, we can see that Polkadot has registered a bearish engulfing candle last week, even full-bodied. This puts $4.70 on the cards again.
SYN | Synapse
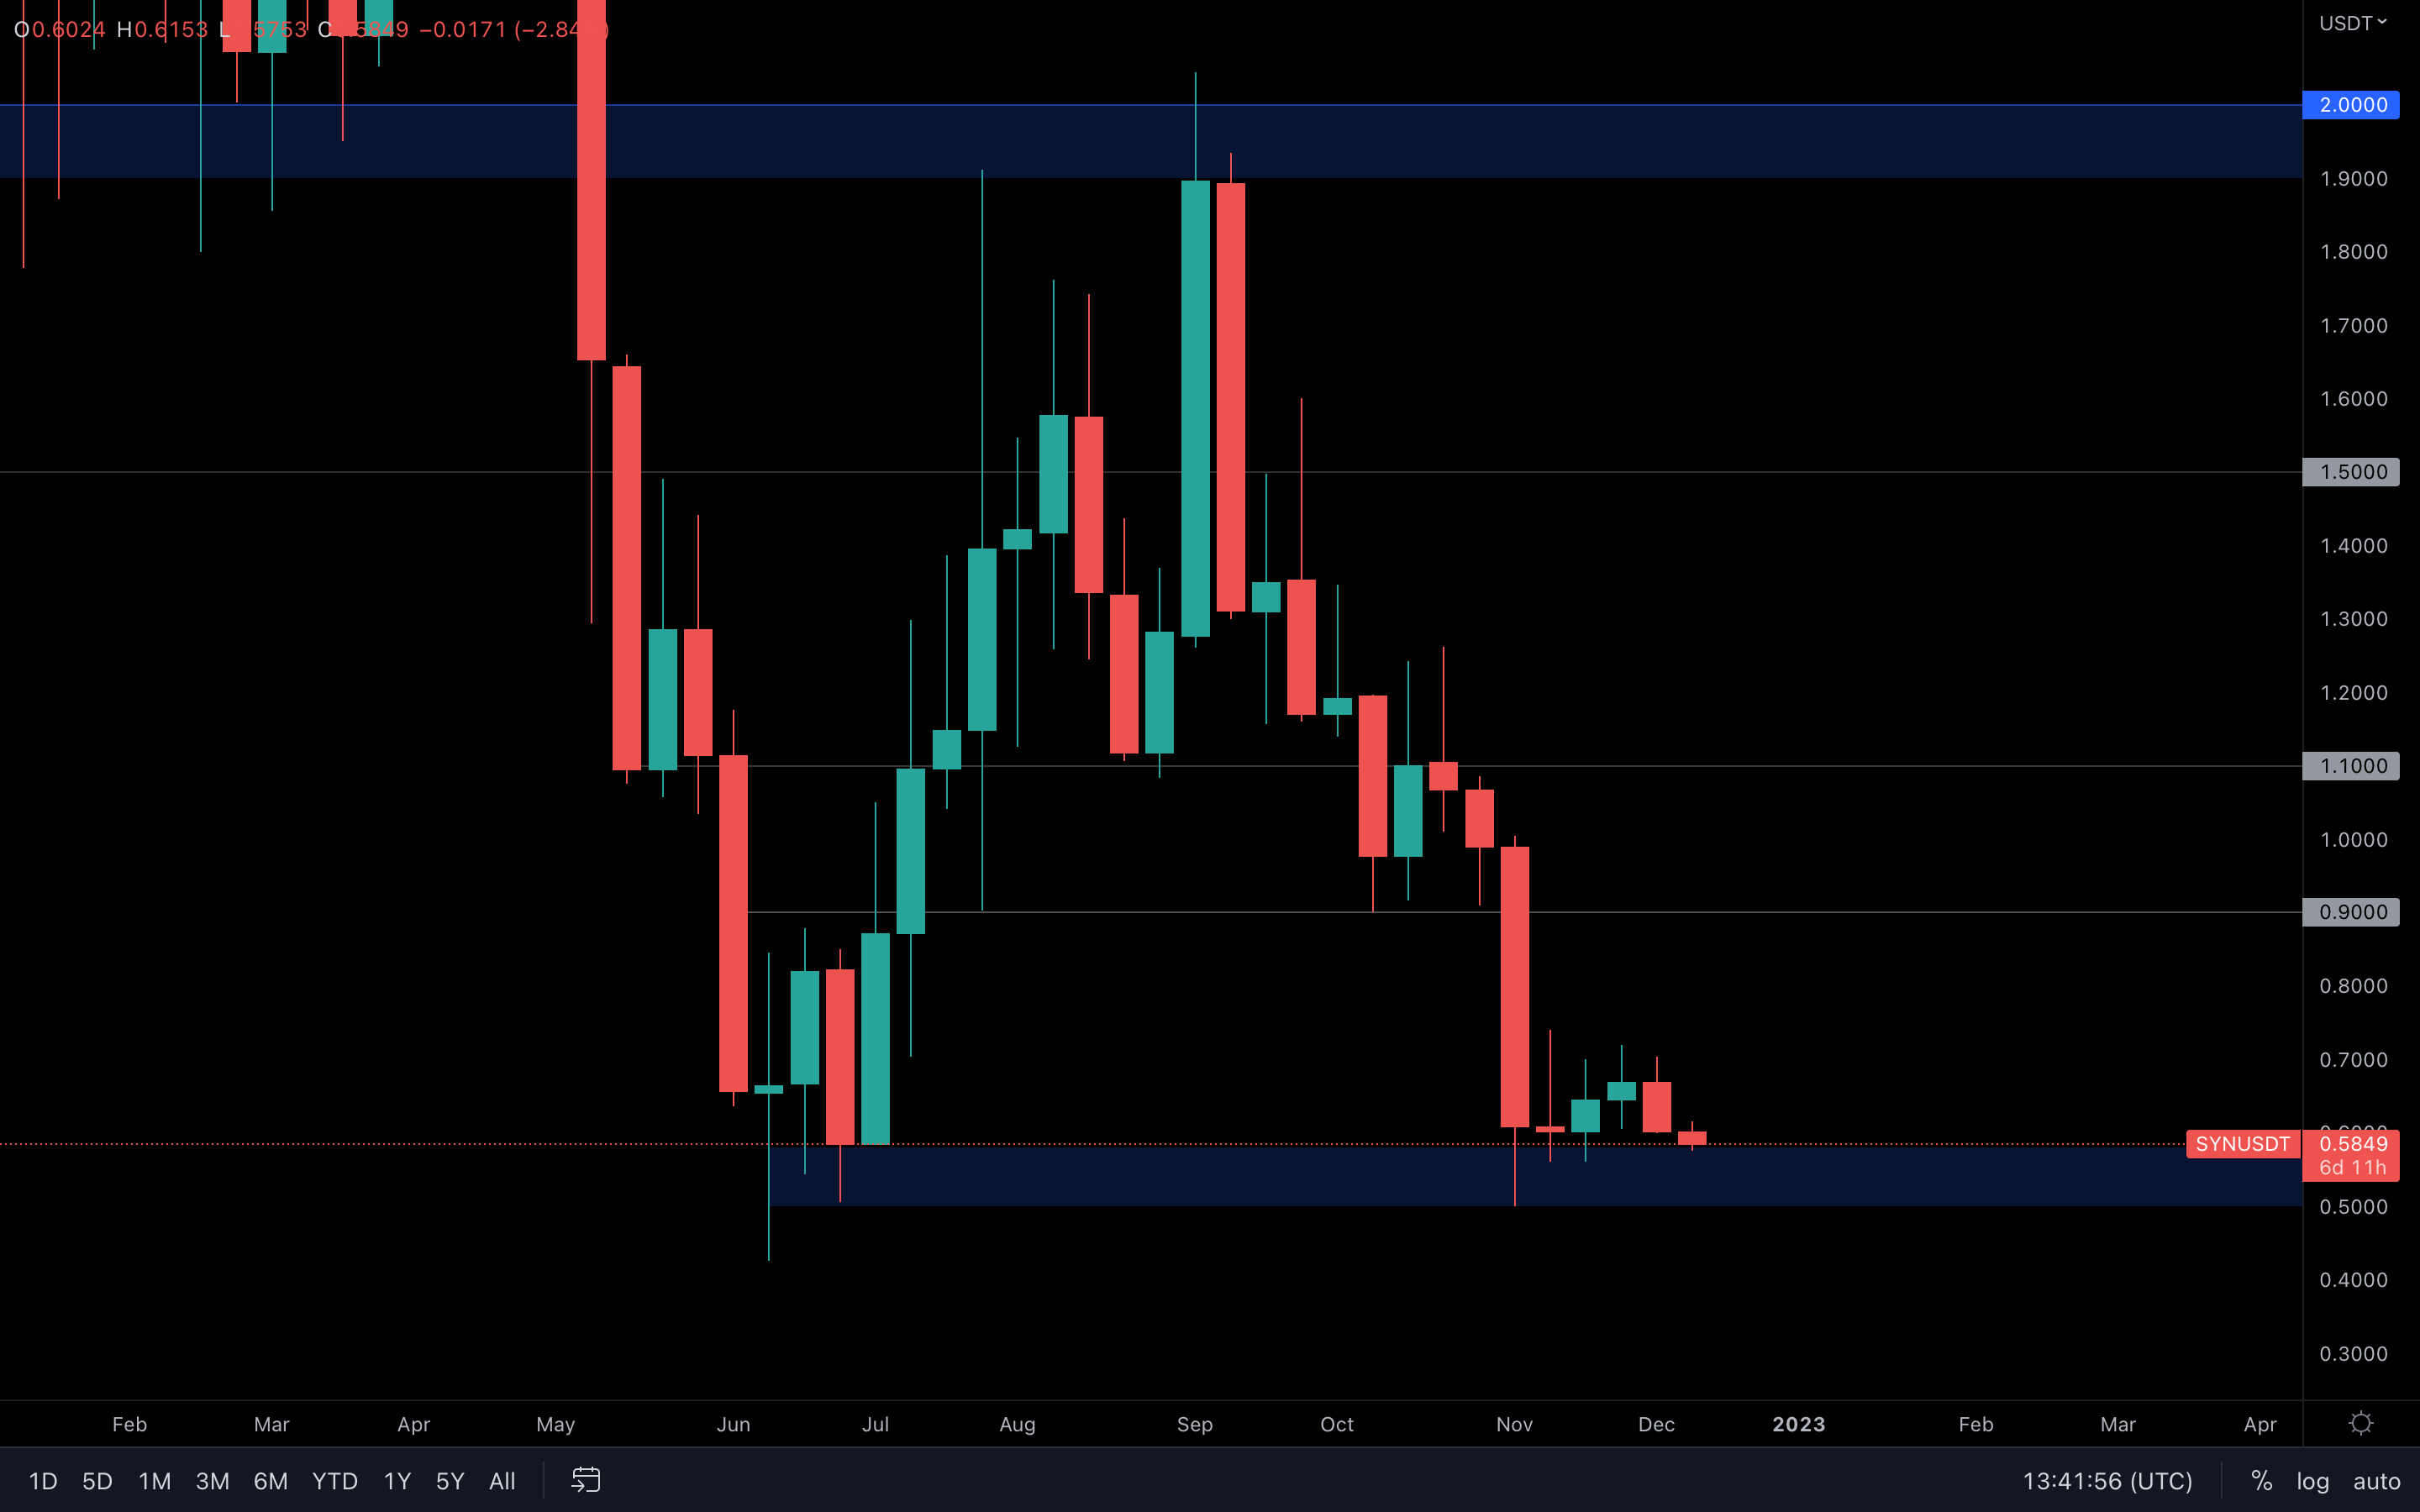
Bearish engulfing candle registered last week, and it's a full-bodied one with that. However, the asset is above support, which "cancels out" the bearish engulfing candle. From a more zoomed out perspective, as long as $0.50 doesn't break this may form into a double bottom that leads SYN towards $1.90.
OP | Optimism
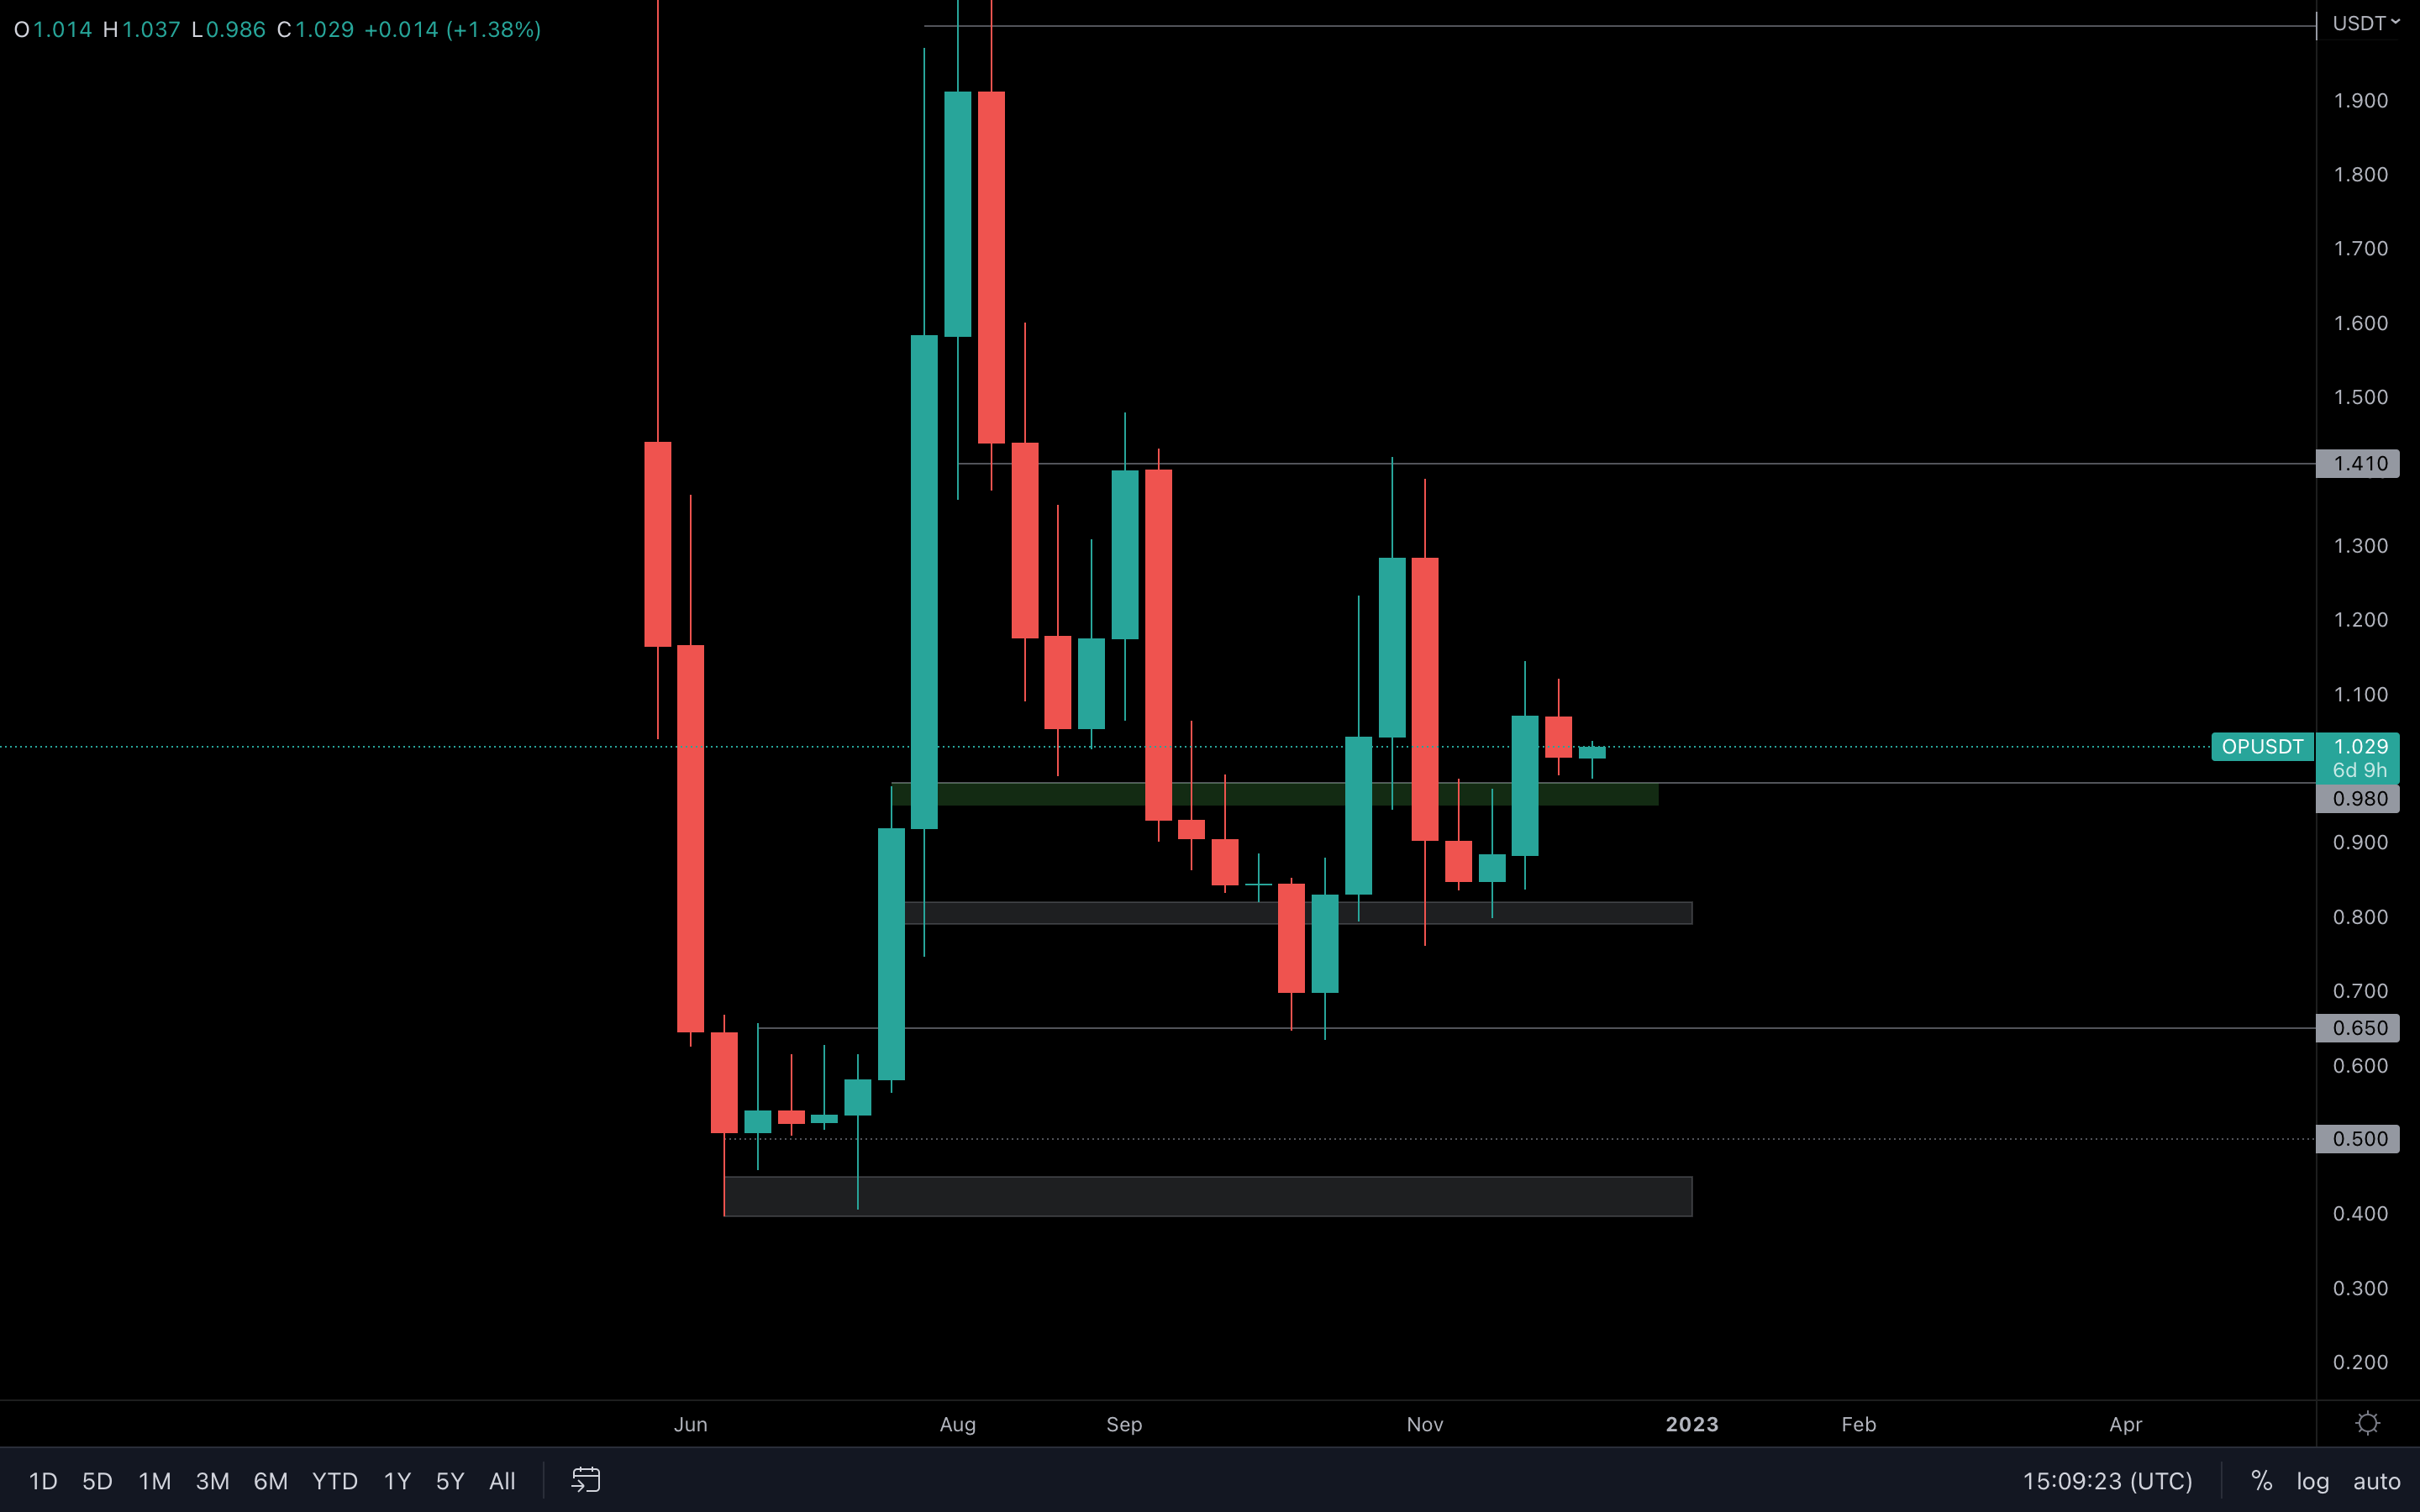
Last week, OP almost closed into support and is now experiencing some buying pressure. Since we do have support under the current price ($0.98), OP is looking ready to bounce from this level. The overall market structure is bullish.
LDO | Lido DAO
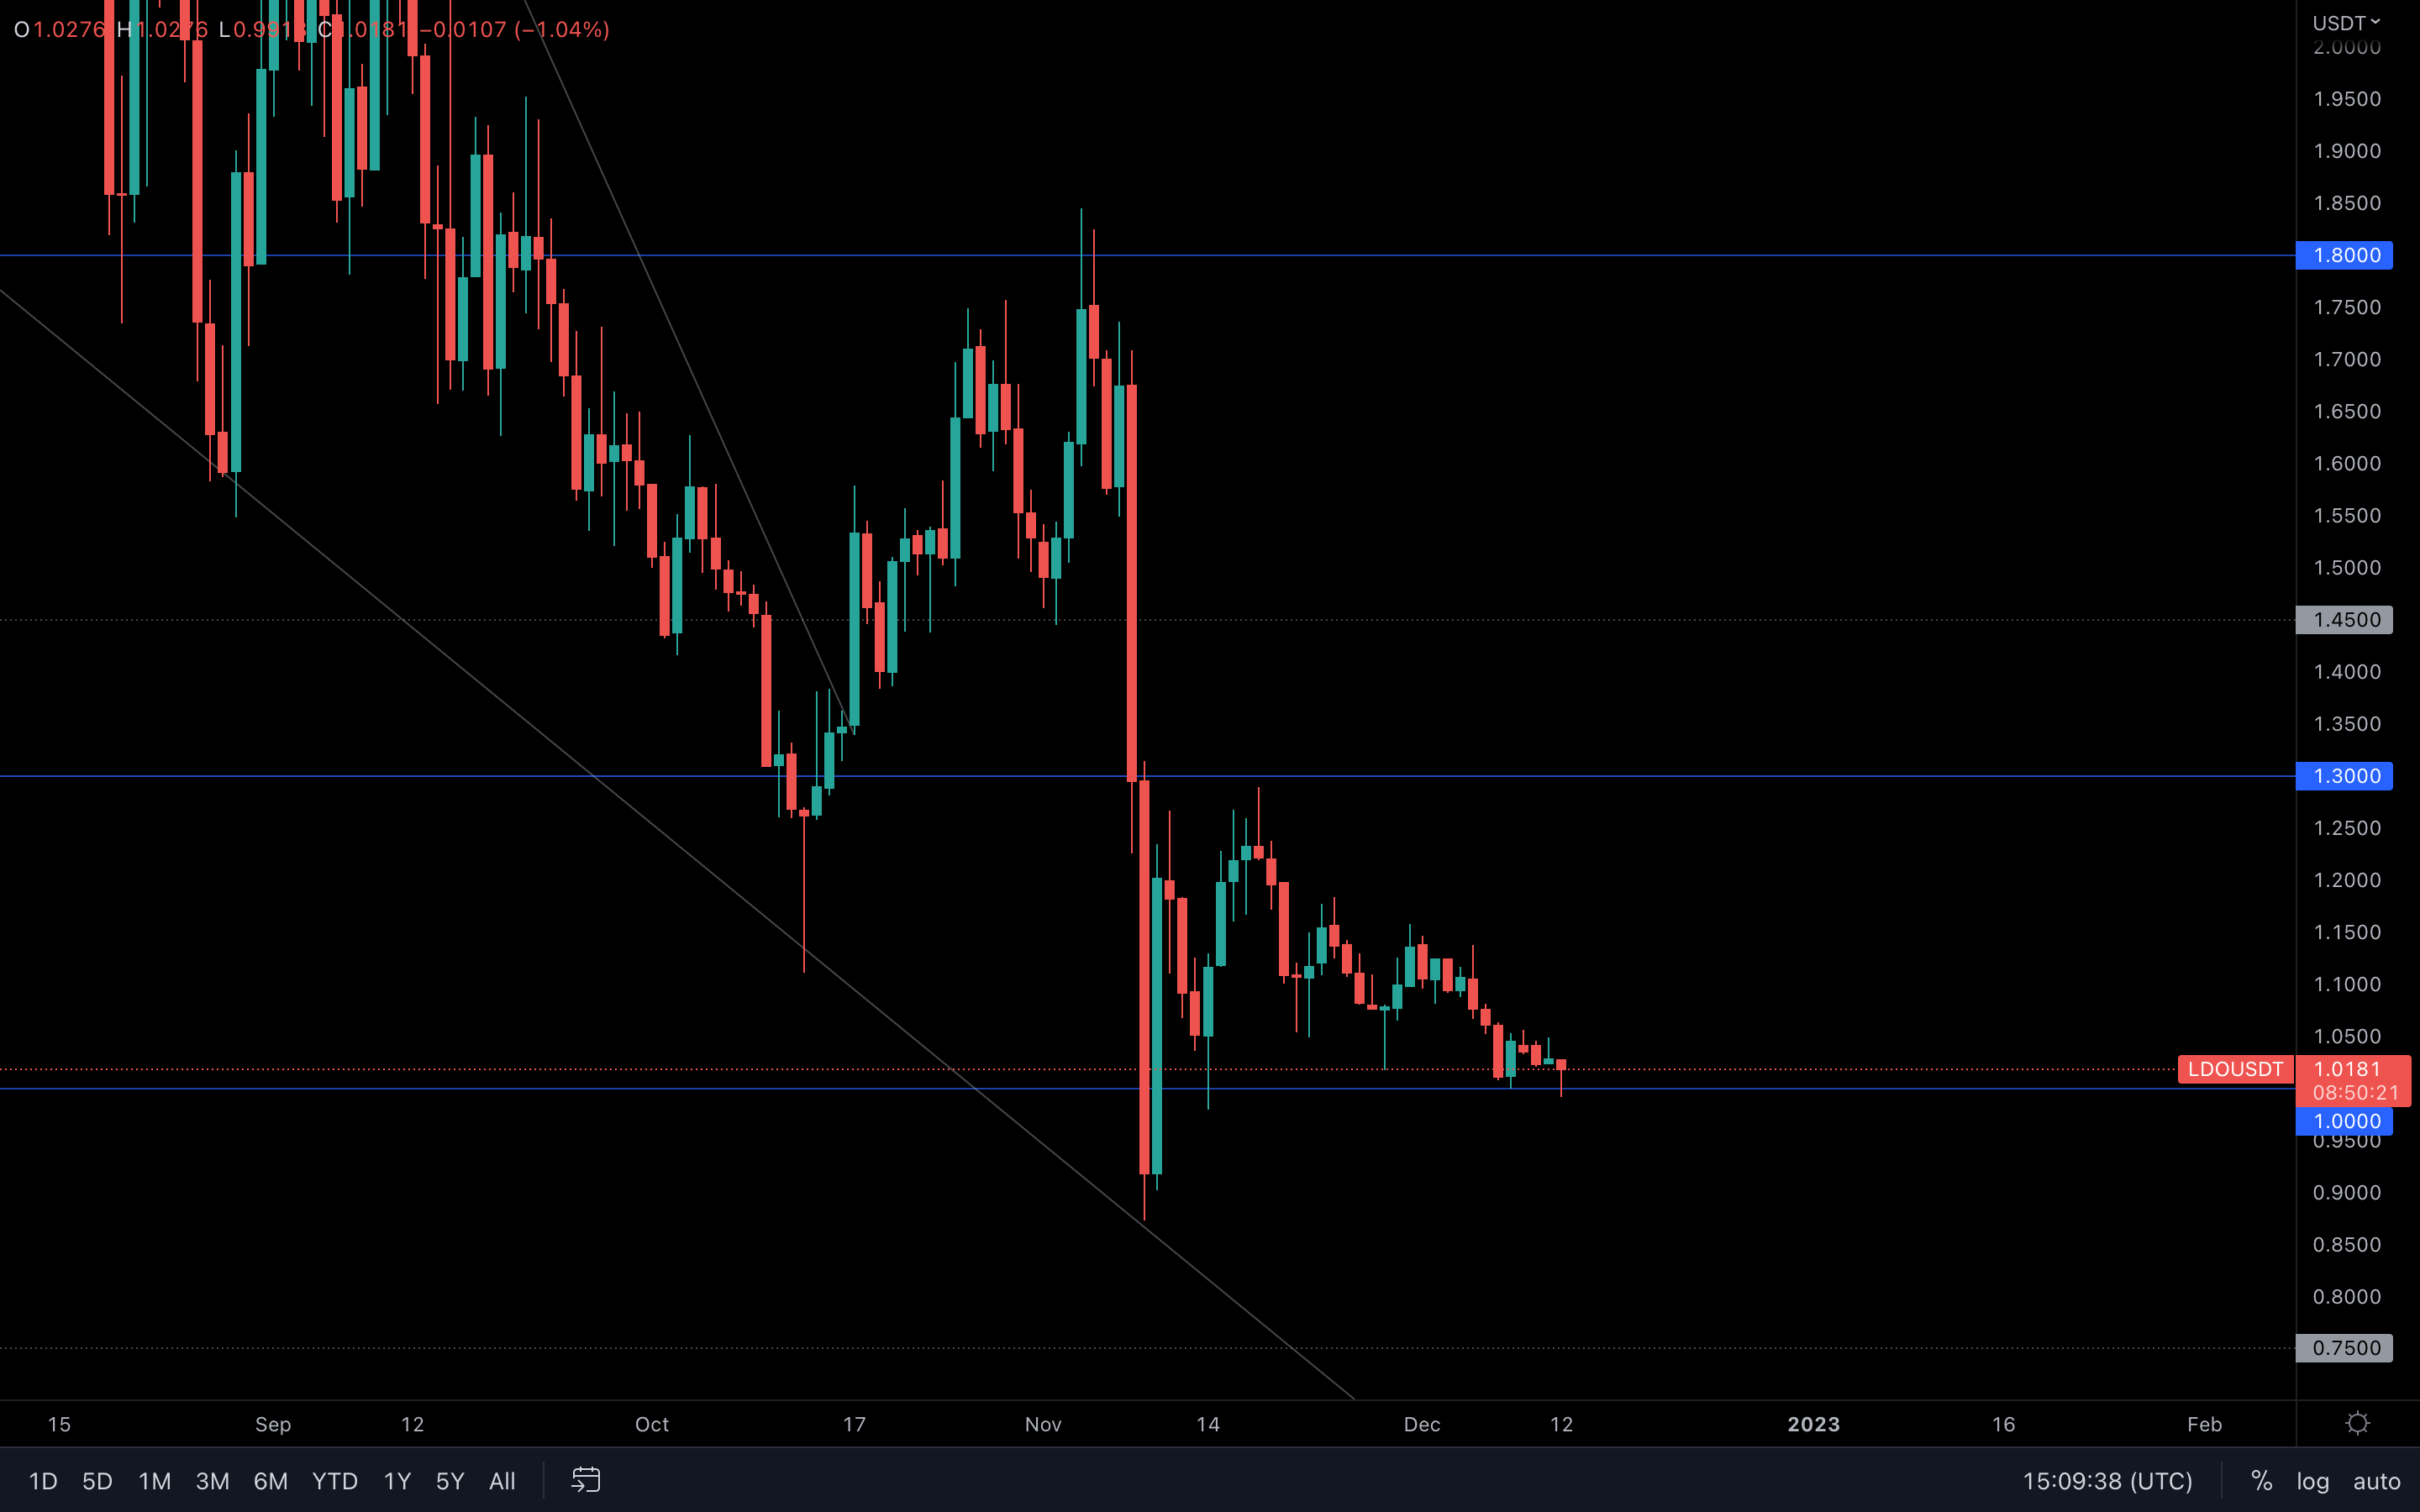
(Daily chart was used) Lido has descended into support as well and is also experiencing some buying pressure, as we can see from its current daily candle. Whether the asset will bounce from here remains to be seen, but we should expect some ranging above the $1 level especially since it is a psychological one.
THOR | THORSwap
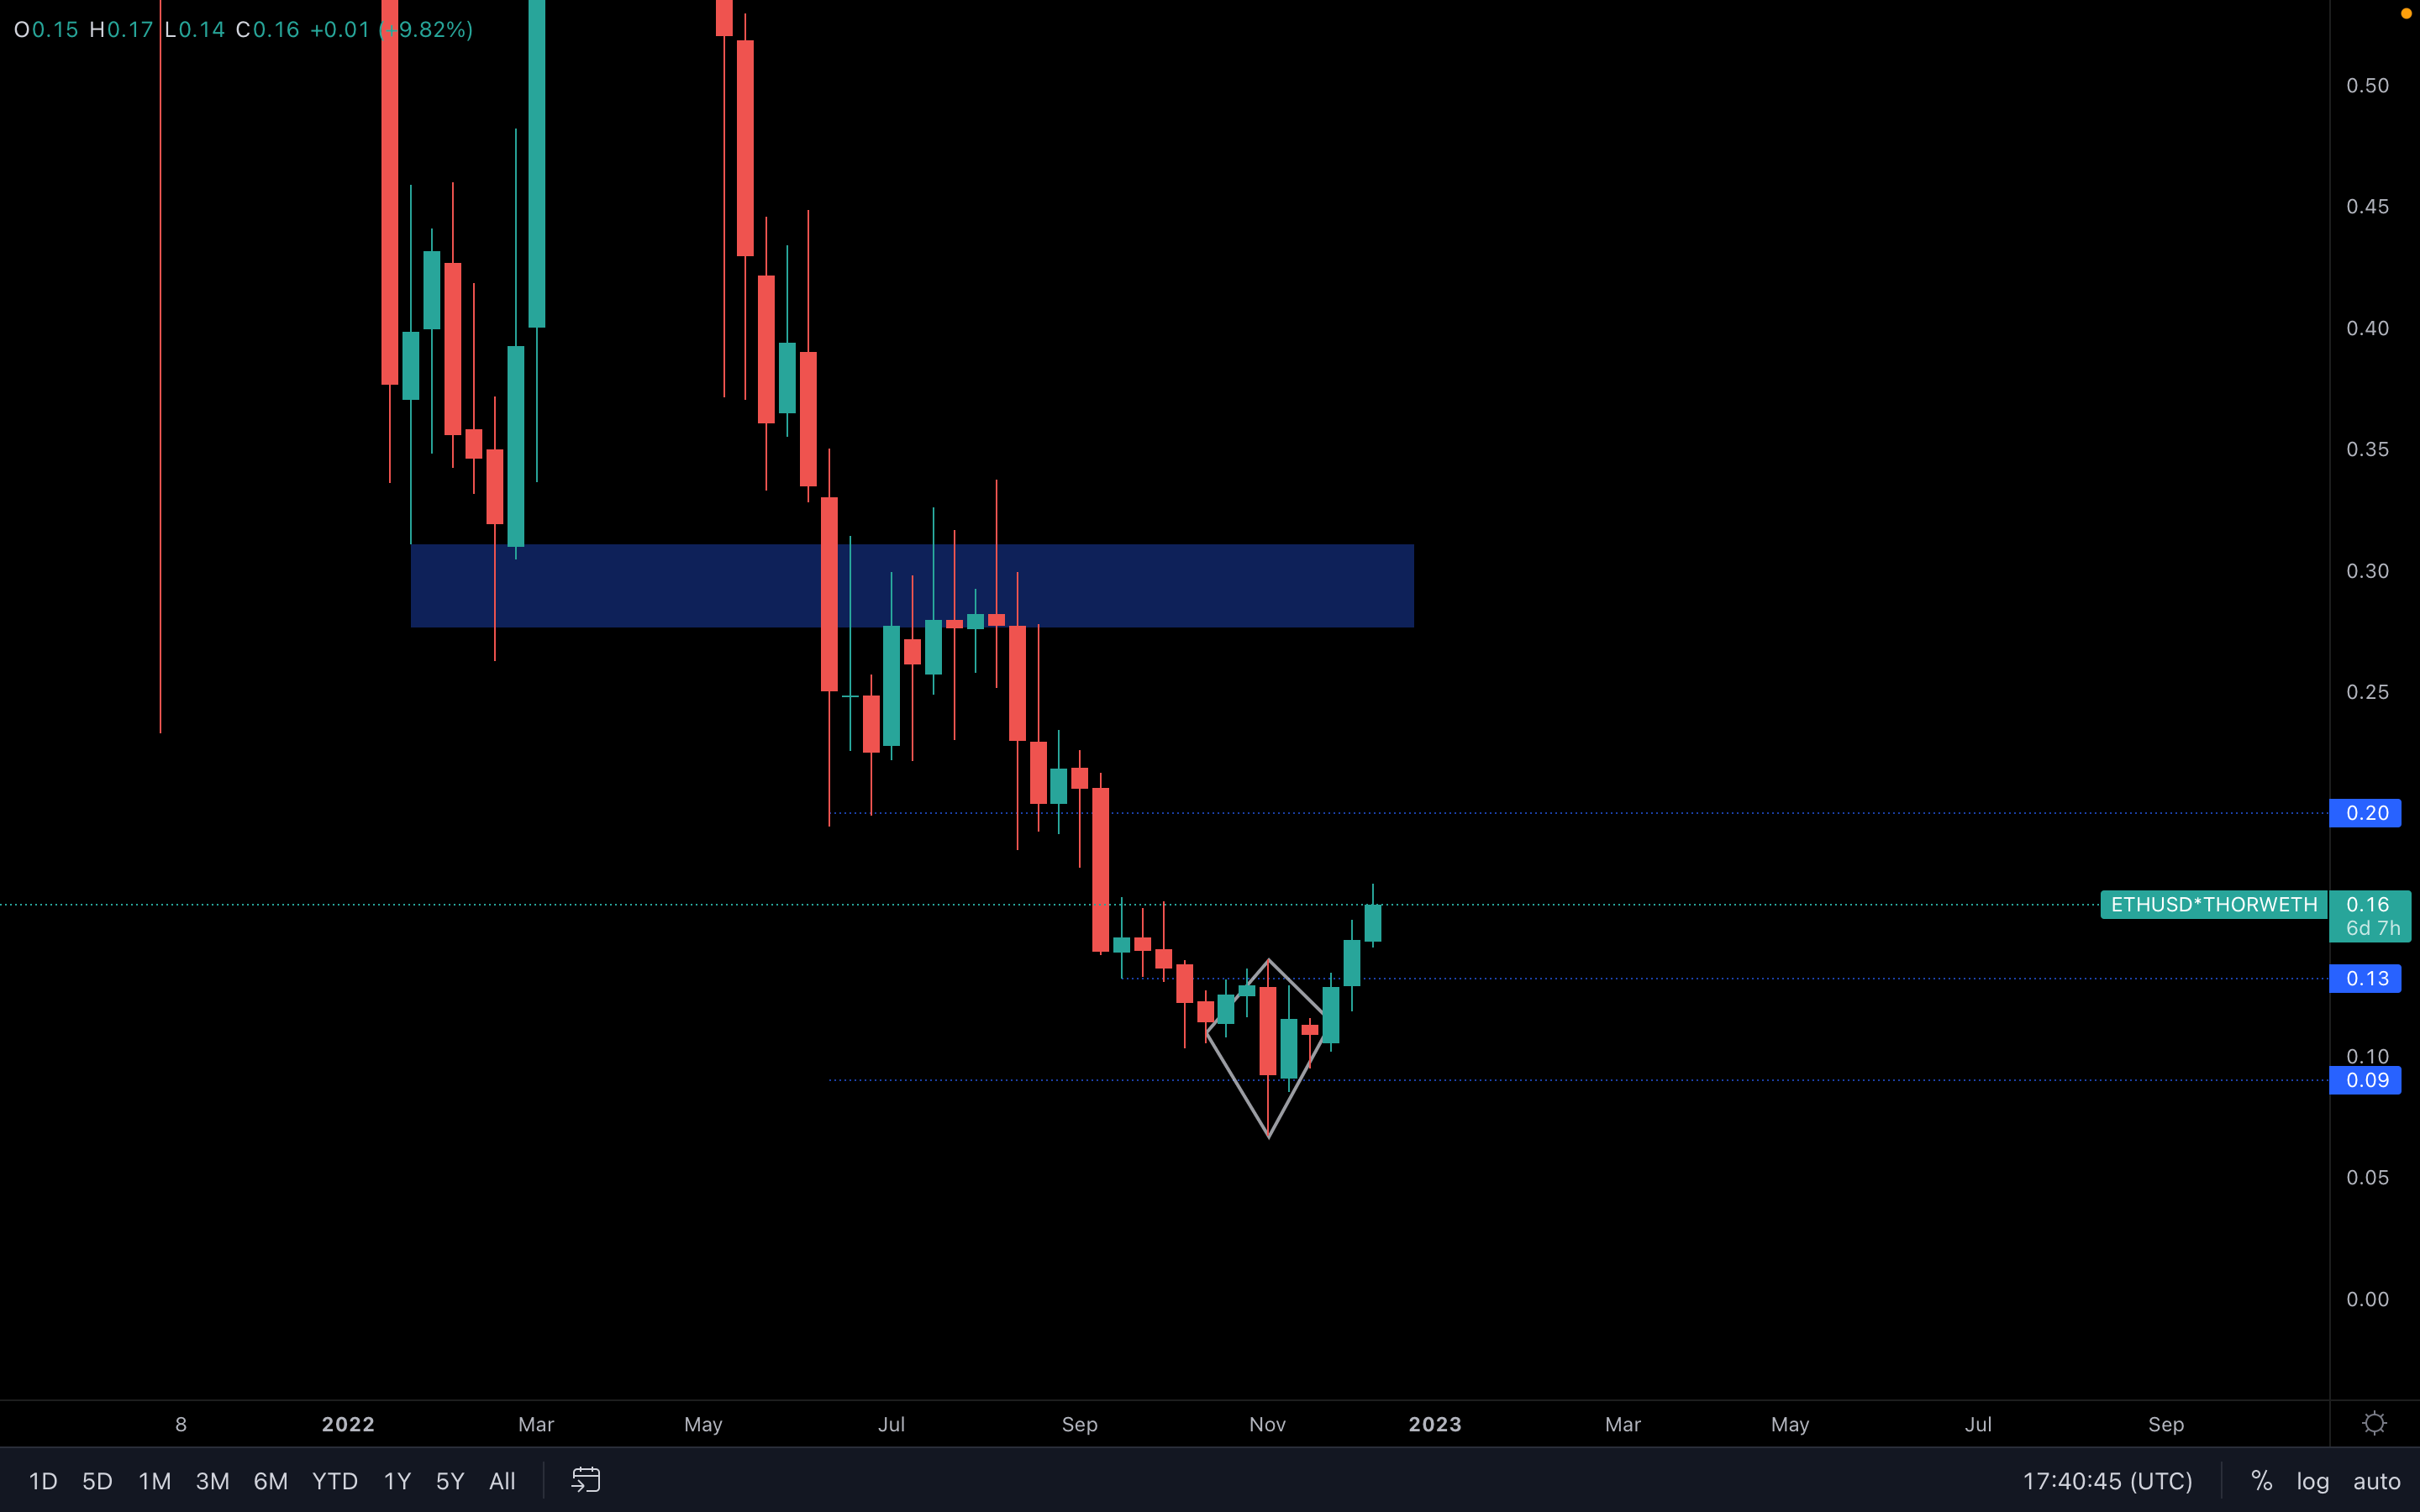
Thor managed to close above $0.13 last week, and although we could see further upside without any stops whatsoever, it would be ideal if Thor retested $0.13 before taking off toward $0.20. Short-term, the chart is bullish and will likely test $0.20 soon.
MINA | Mina Protocol
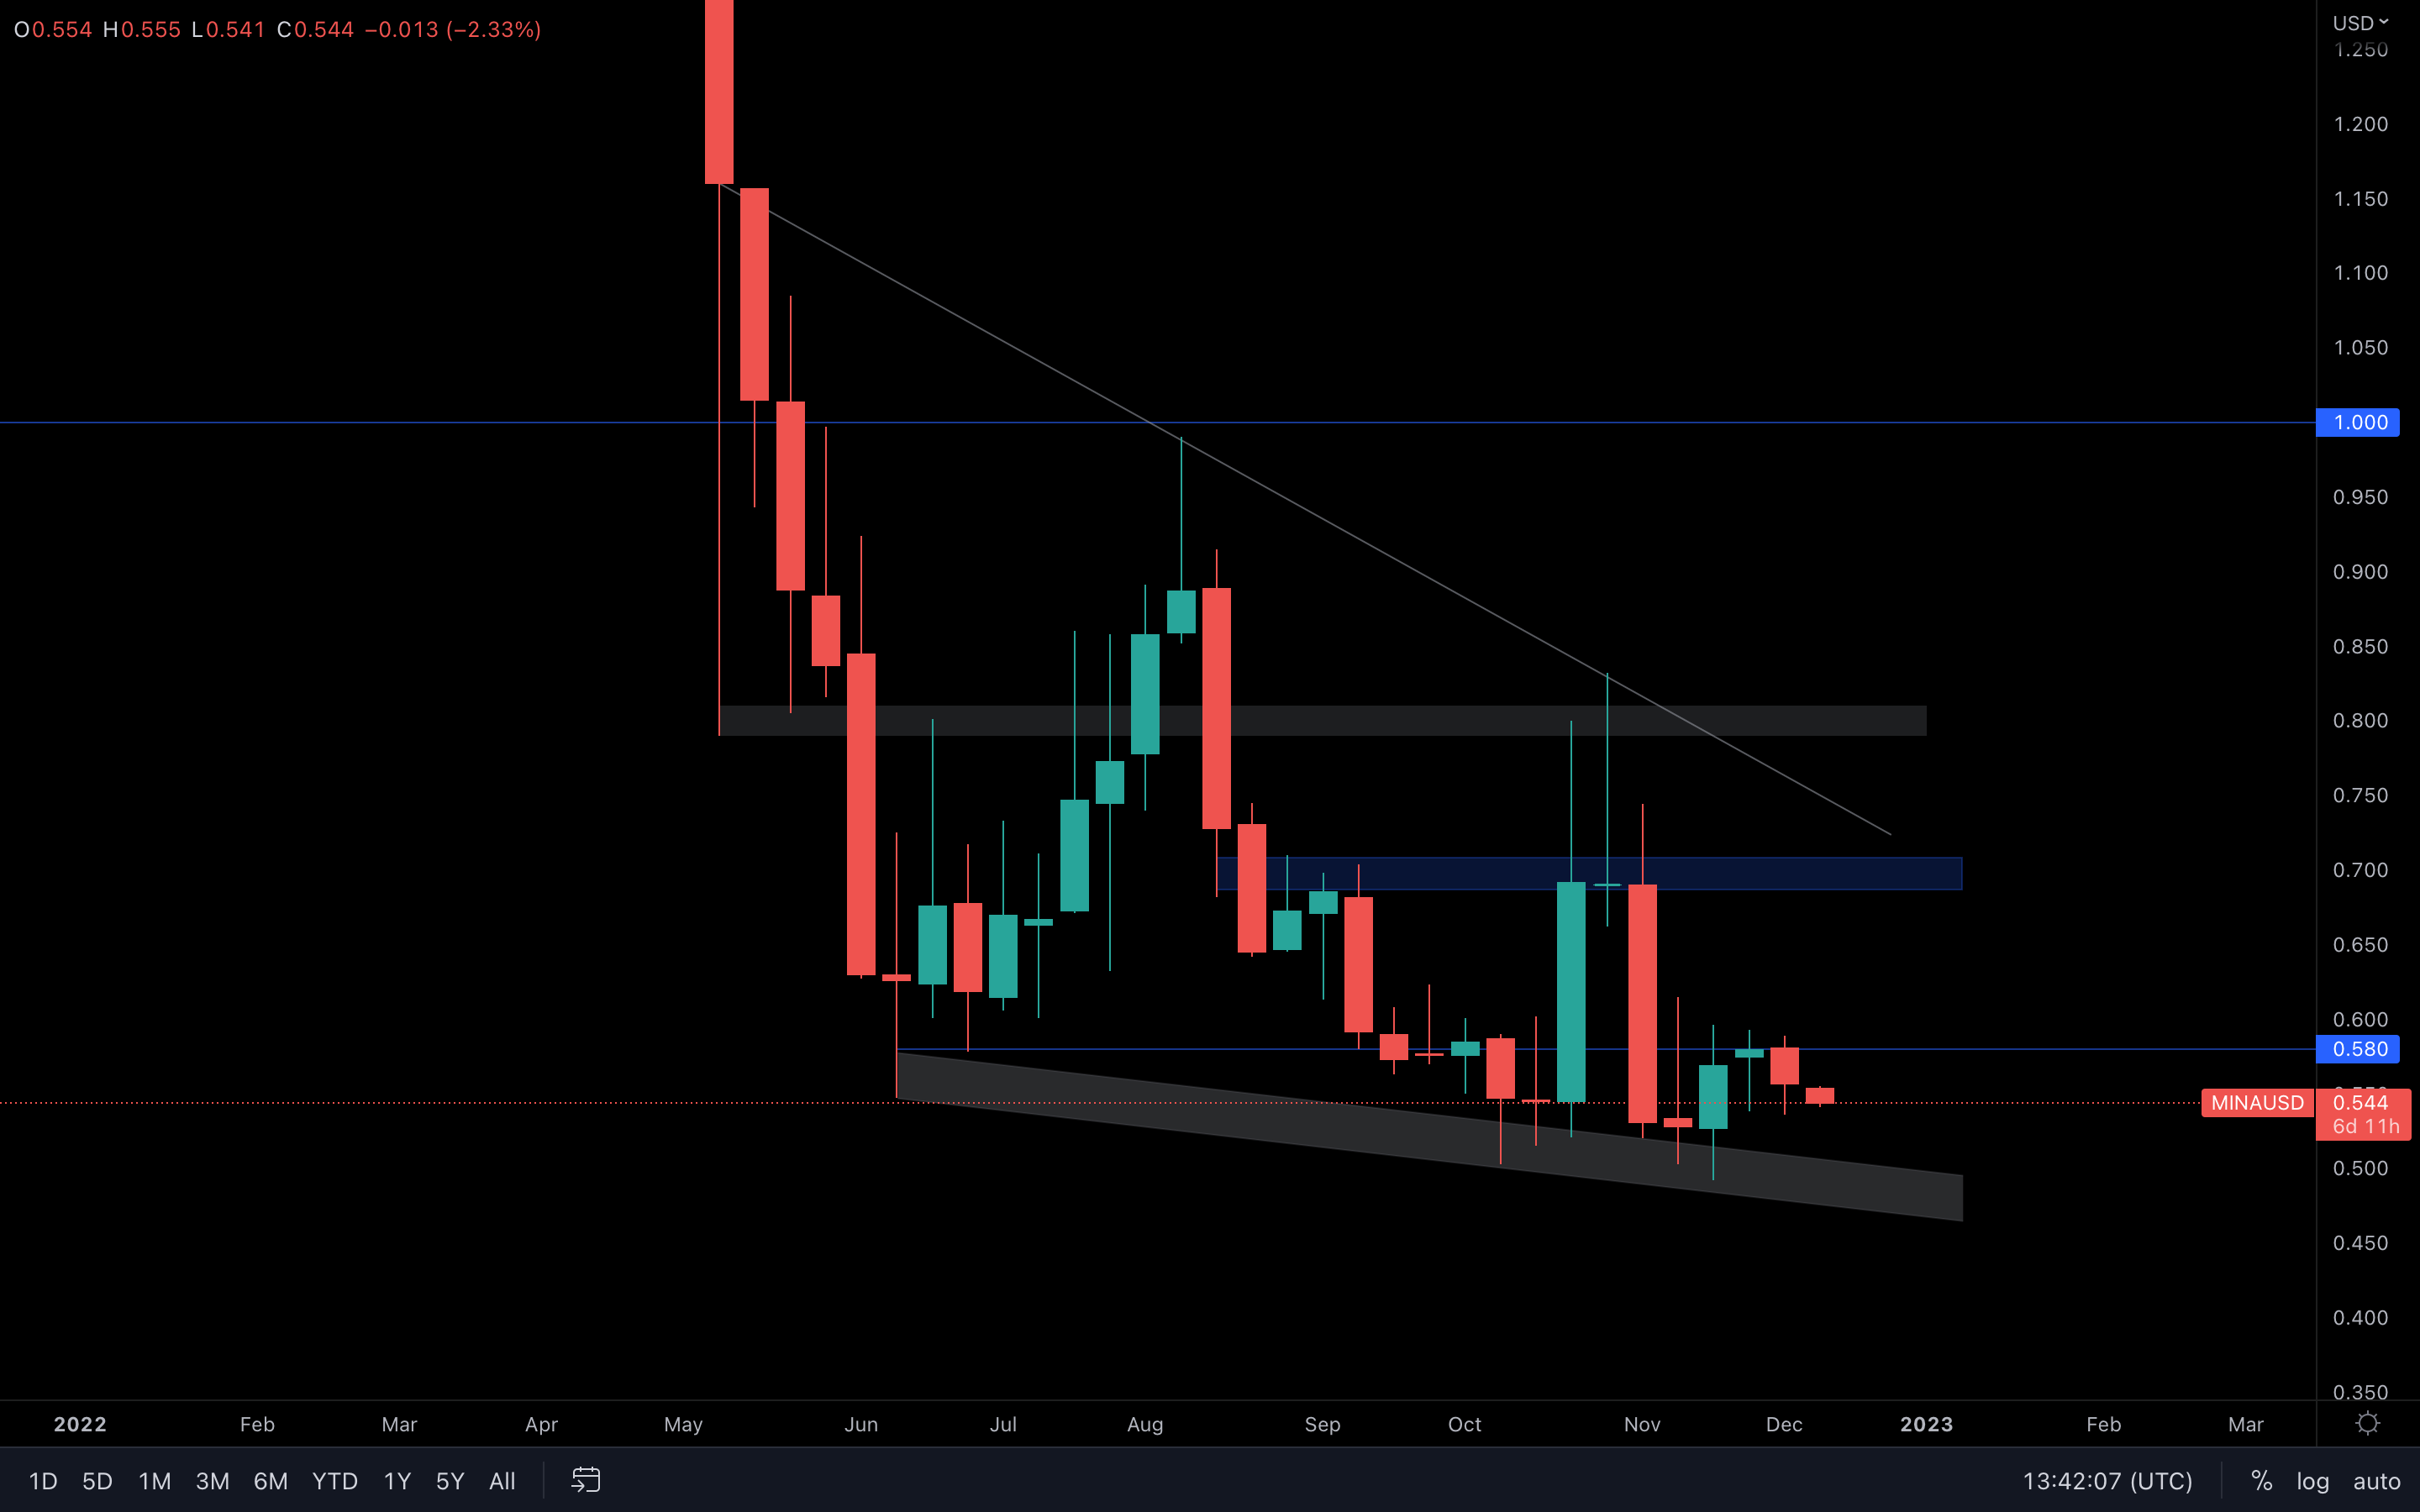
Another test of $0.50 is on the cards now as $0.58 remains resistance. If we see a breakdown of $0.50 then we'll see downside price discovery.
DYDX | dYdX
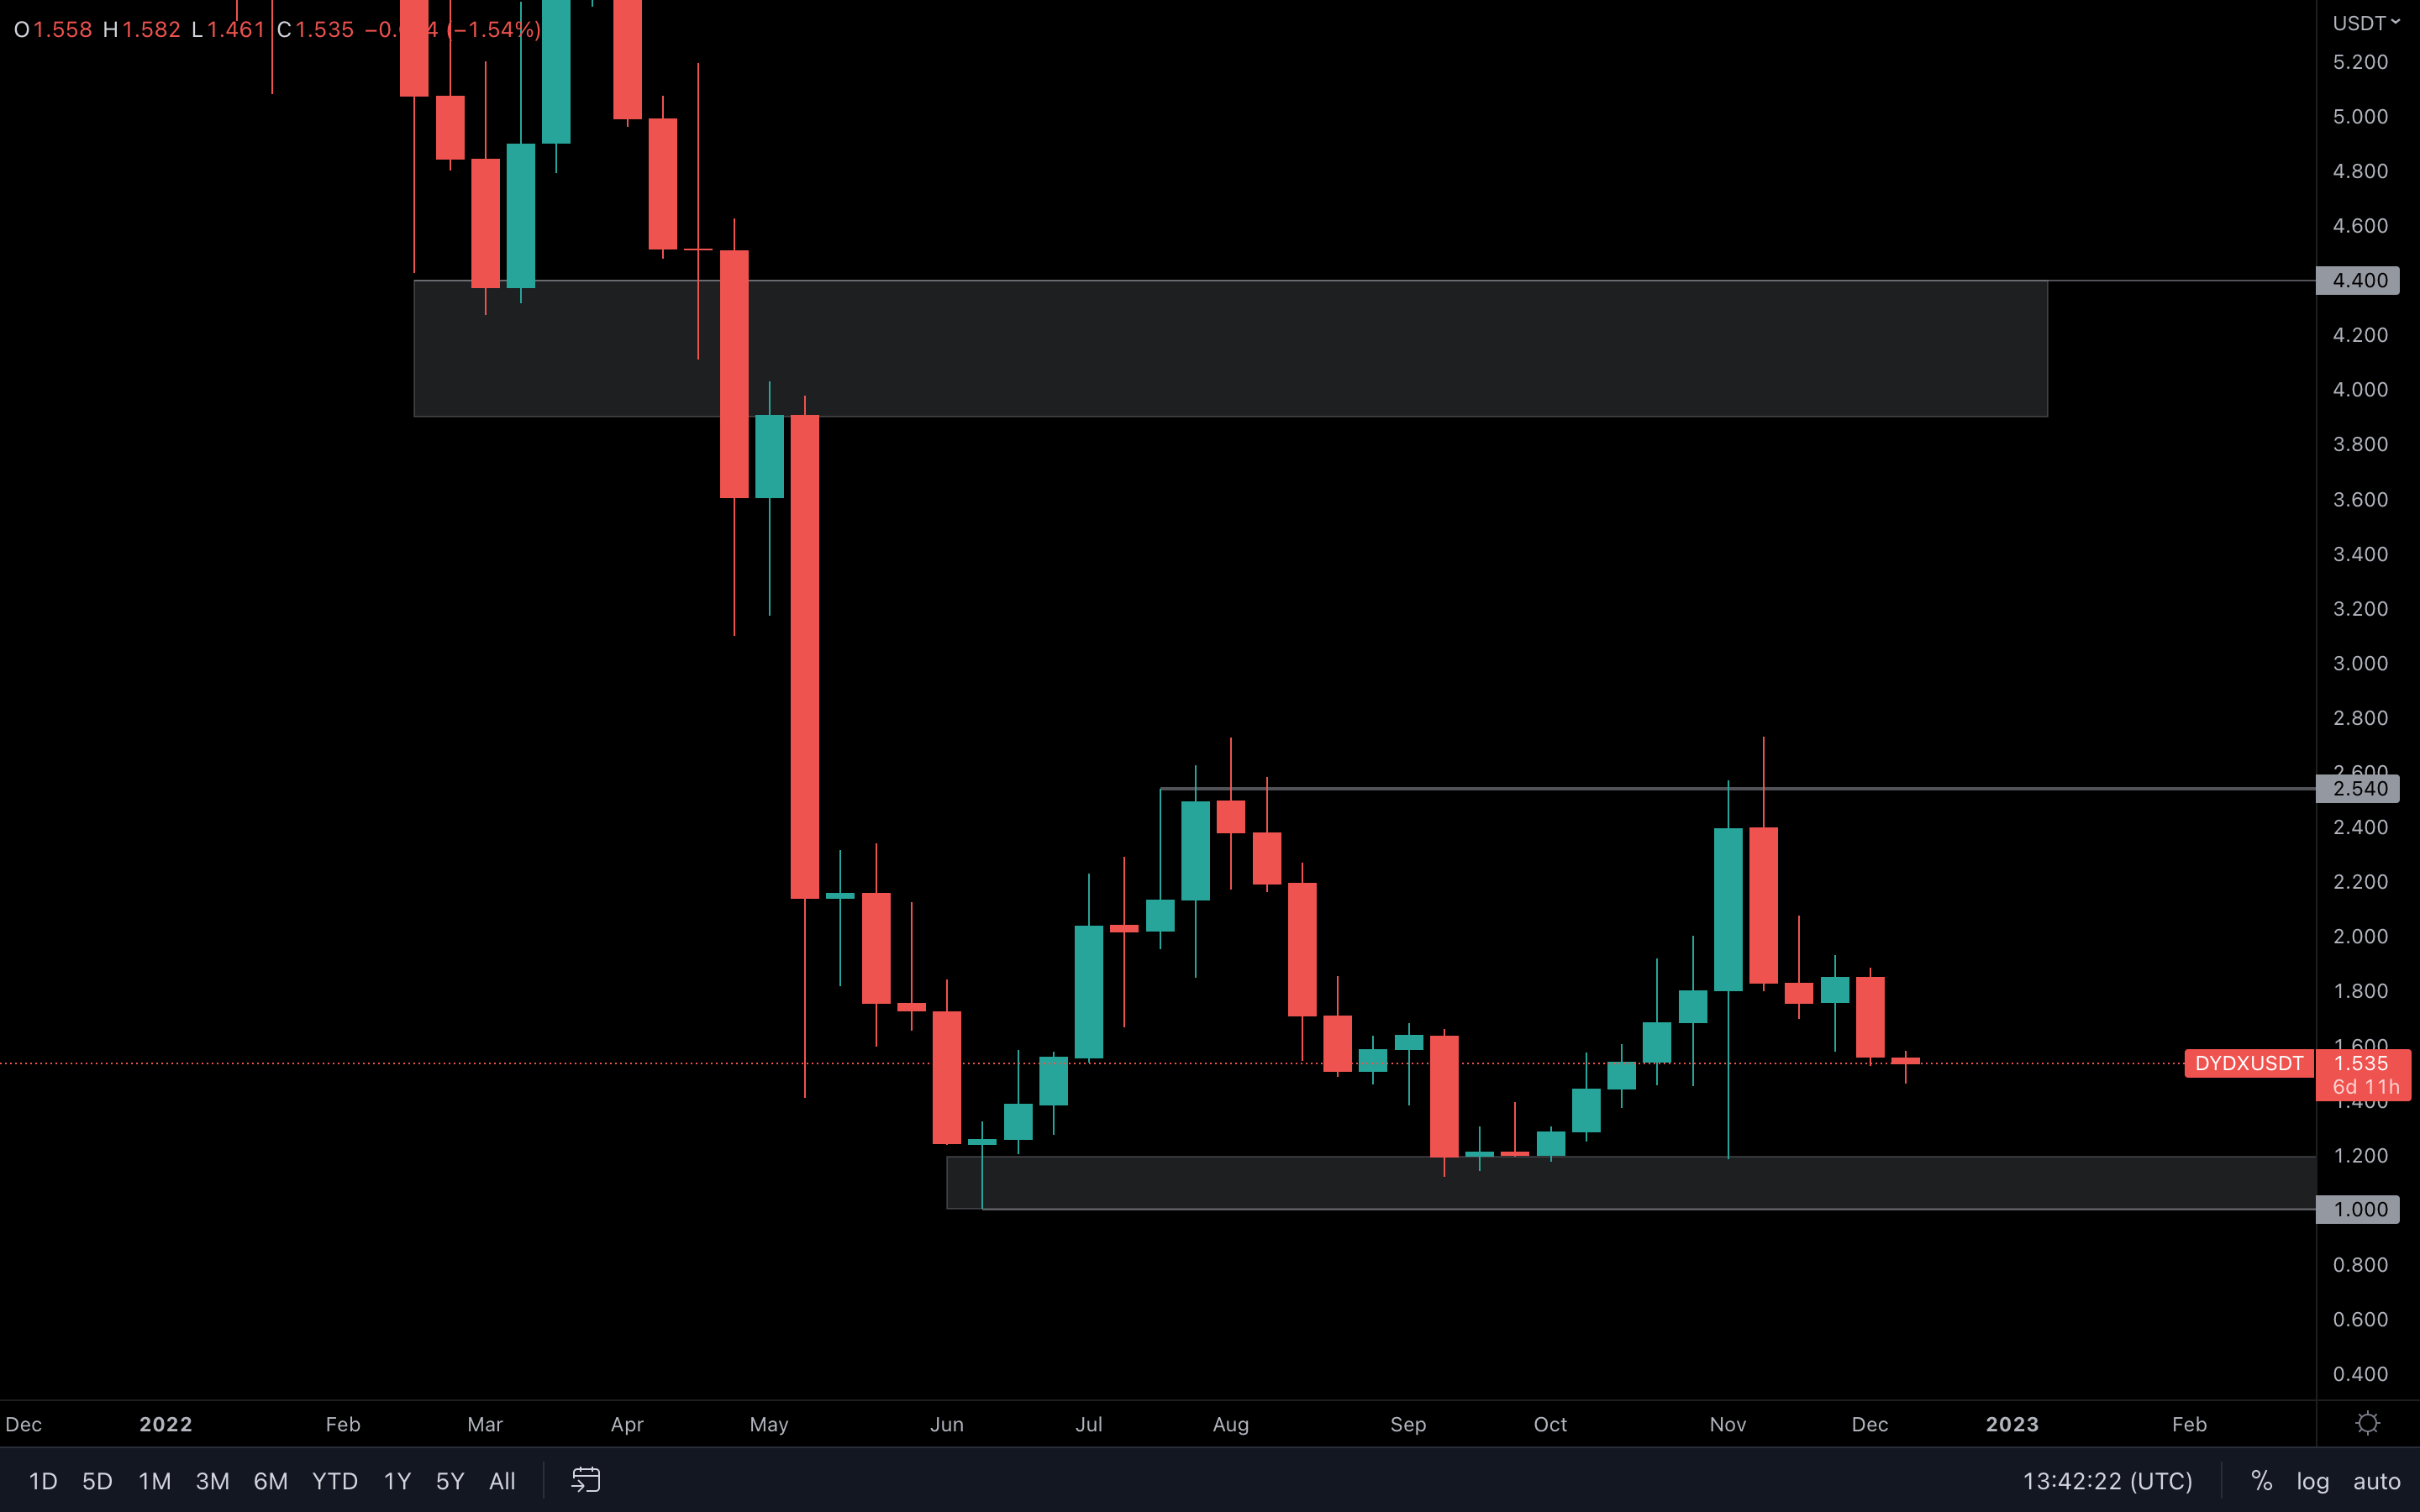
DYDX is still ranging between $1 and $2.50. After heavy downside in 2021, this may the accumulation zone. A break from either $1 or $2.50 would start a new trend. For the time being we can expect further ping-ponging.
Summary
Bitcoin miners are starting to capitulate and the FED may shake up the markets based on inflation data this week. These factors may lead towards another test of the previous lows.While this is taking place, Bitcoin currently looks cheap through on-chain metrics, and therefore it may be unwise to wait for significantly lower prices as they may not come. The bottom is either near or in.
Recommended from Cryptonary


