Save 23% ($351) & Get a Free 1-1 Call with our Team ⏰ : 0d 2h 59m 44s

Disclaimer: Not financial or investment advice. You are responsible for any capital-related decisions you make, and only you are accountable for the results.
TLDR
- The Indexes are at the 2017 high levels - using them as support.
-
The middle Bitcoin wallet cohorts (1, 10 & 100BTC+) risked the most in the past week.
- The percent of the Bitcoin supply in profit was 45% in the past week.
-
On-Chain Metrics show that BTC is getting very cheap.
Macro
Total Market Cap
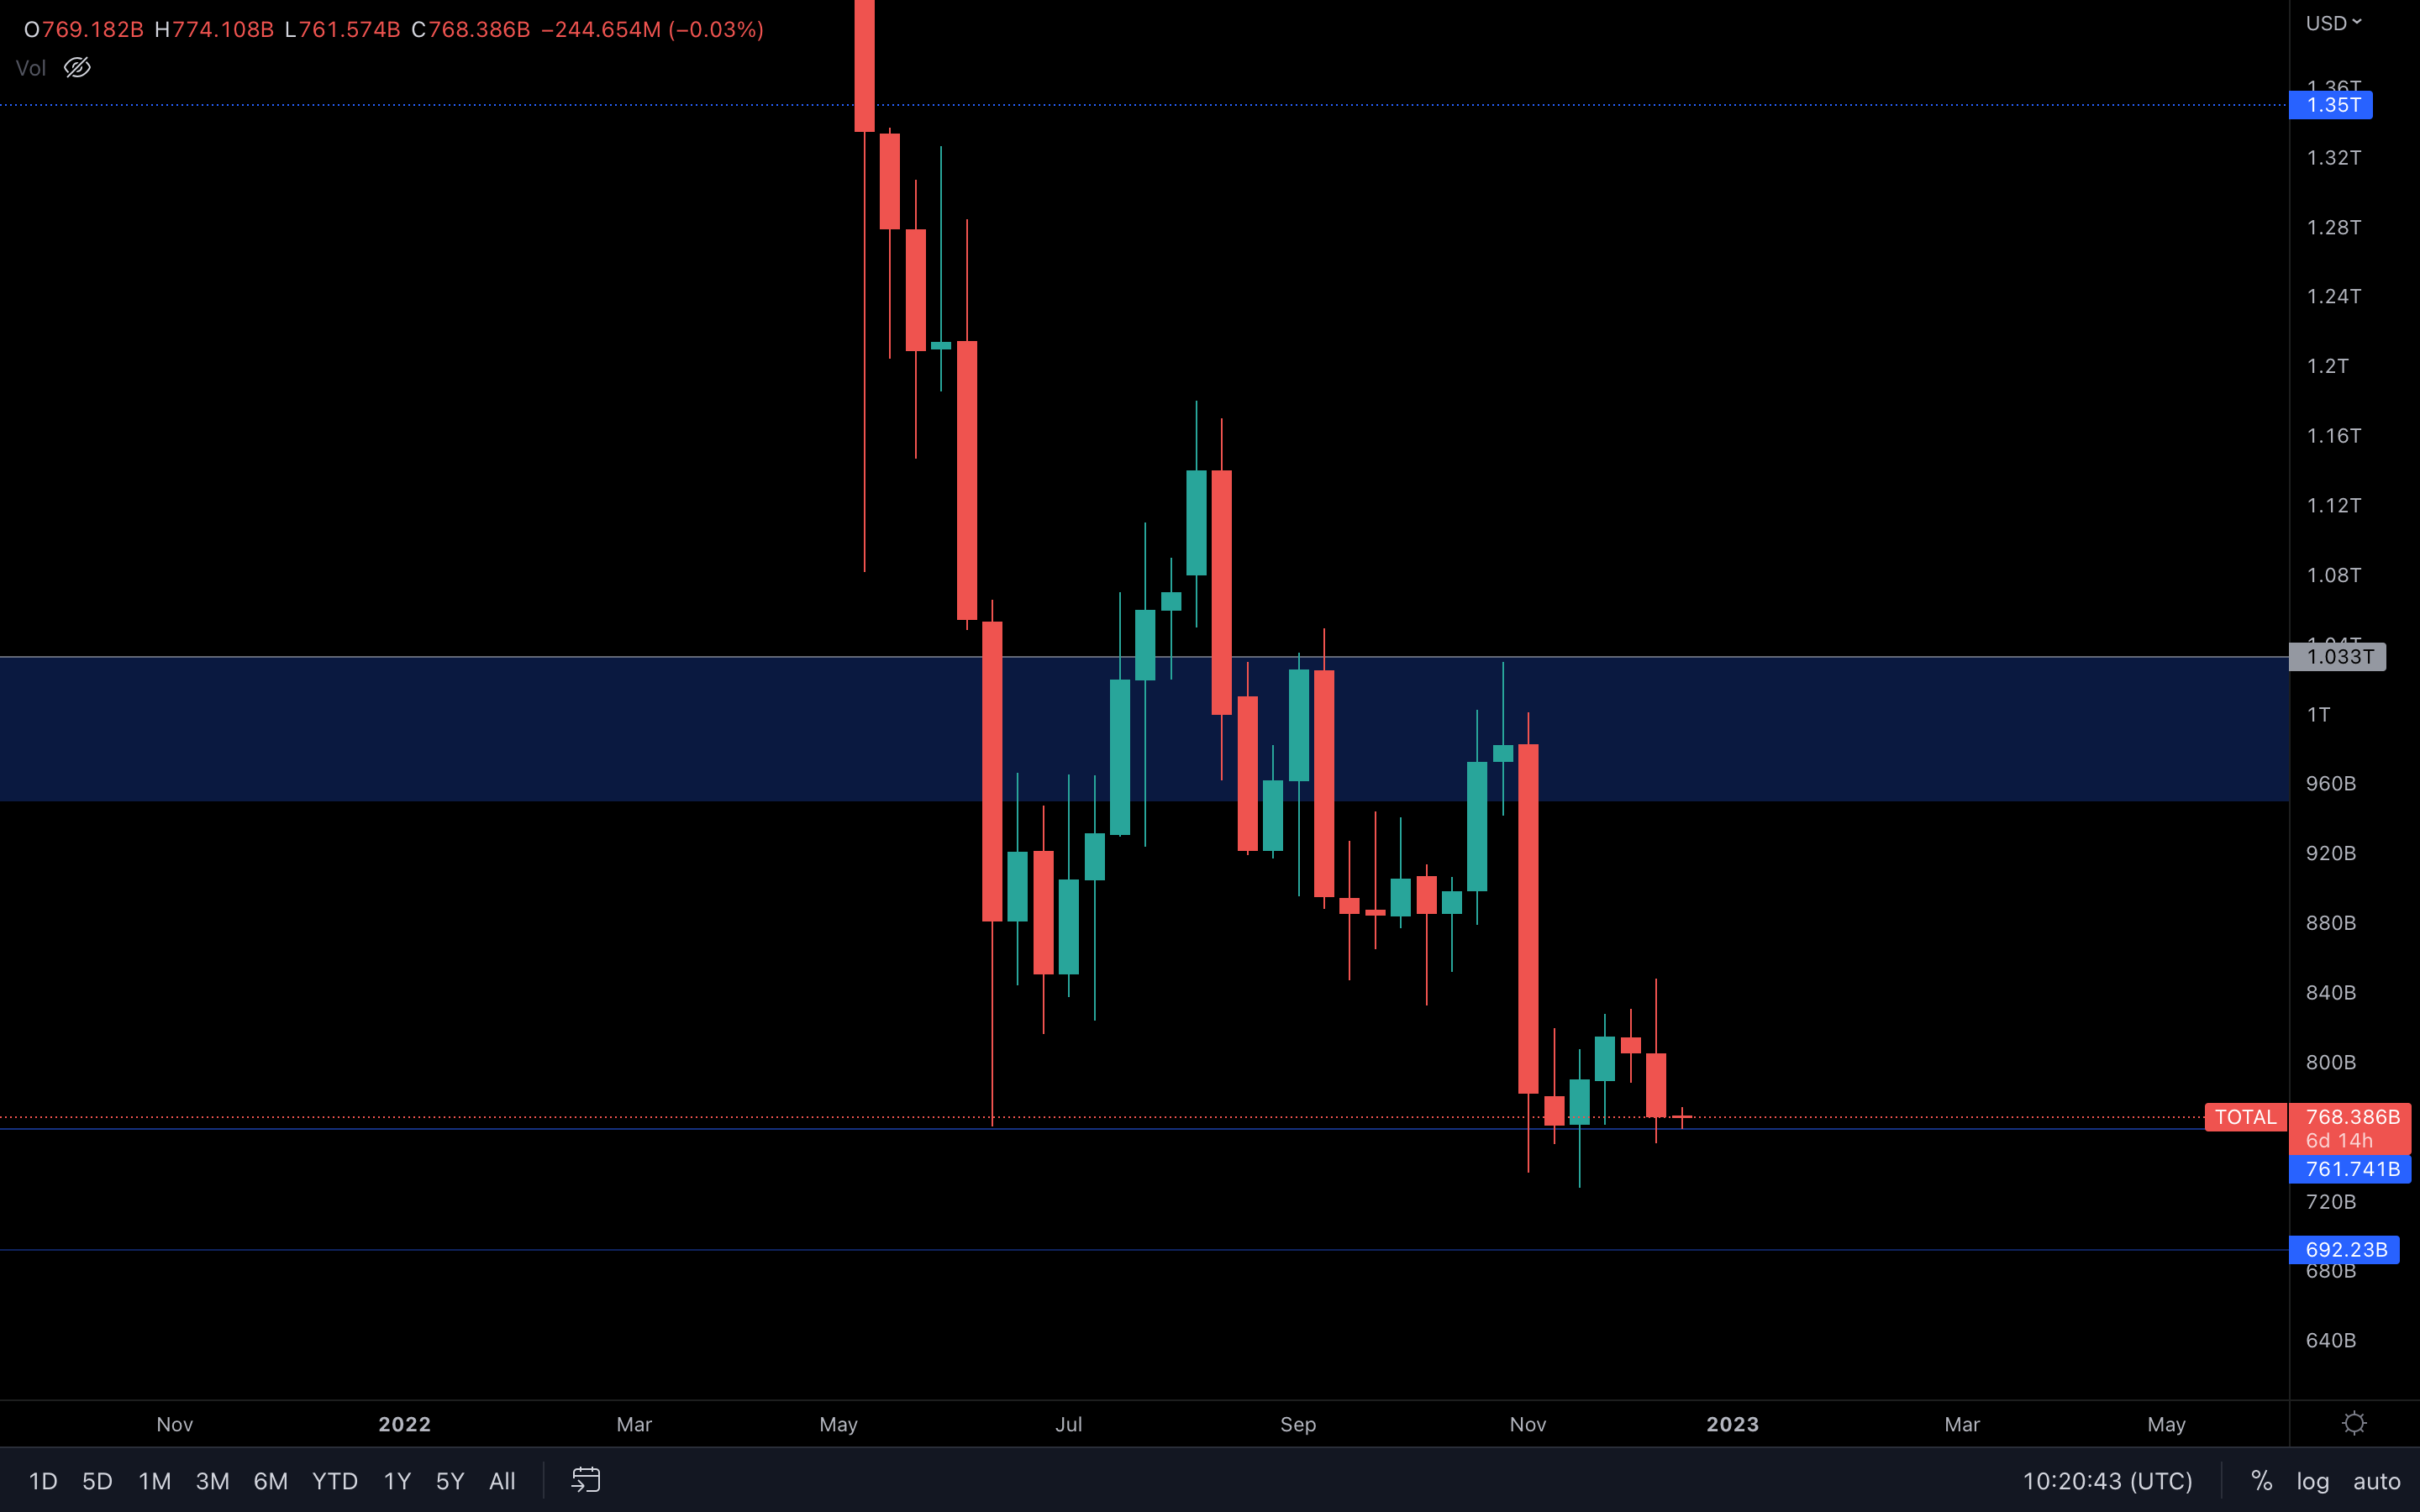
As expected, the Total Market Cap index has retested $761B. Unless we see a loss of $761B by a weekly candle closure, we cannot expect more downside. This level is also the 2018 all-time high so buyers could step in anytime.
Altcoins Market Cap
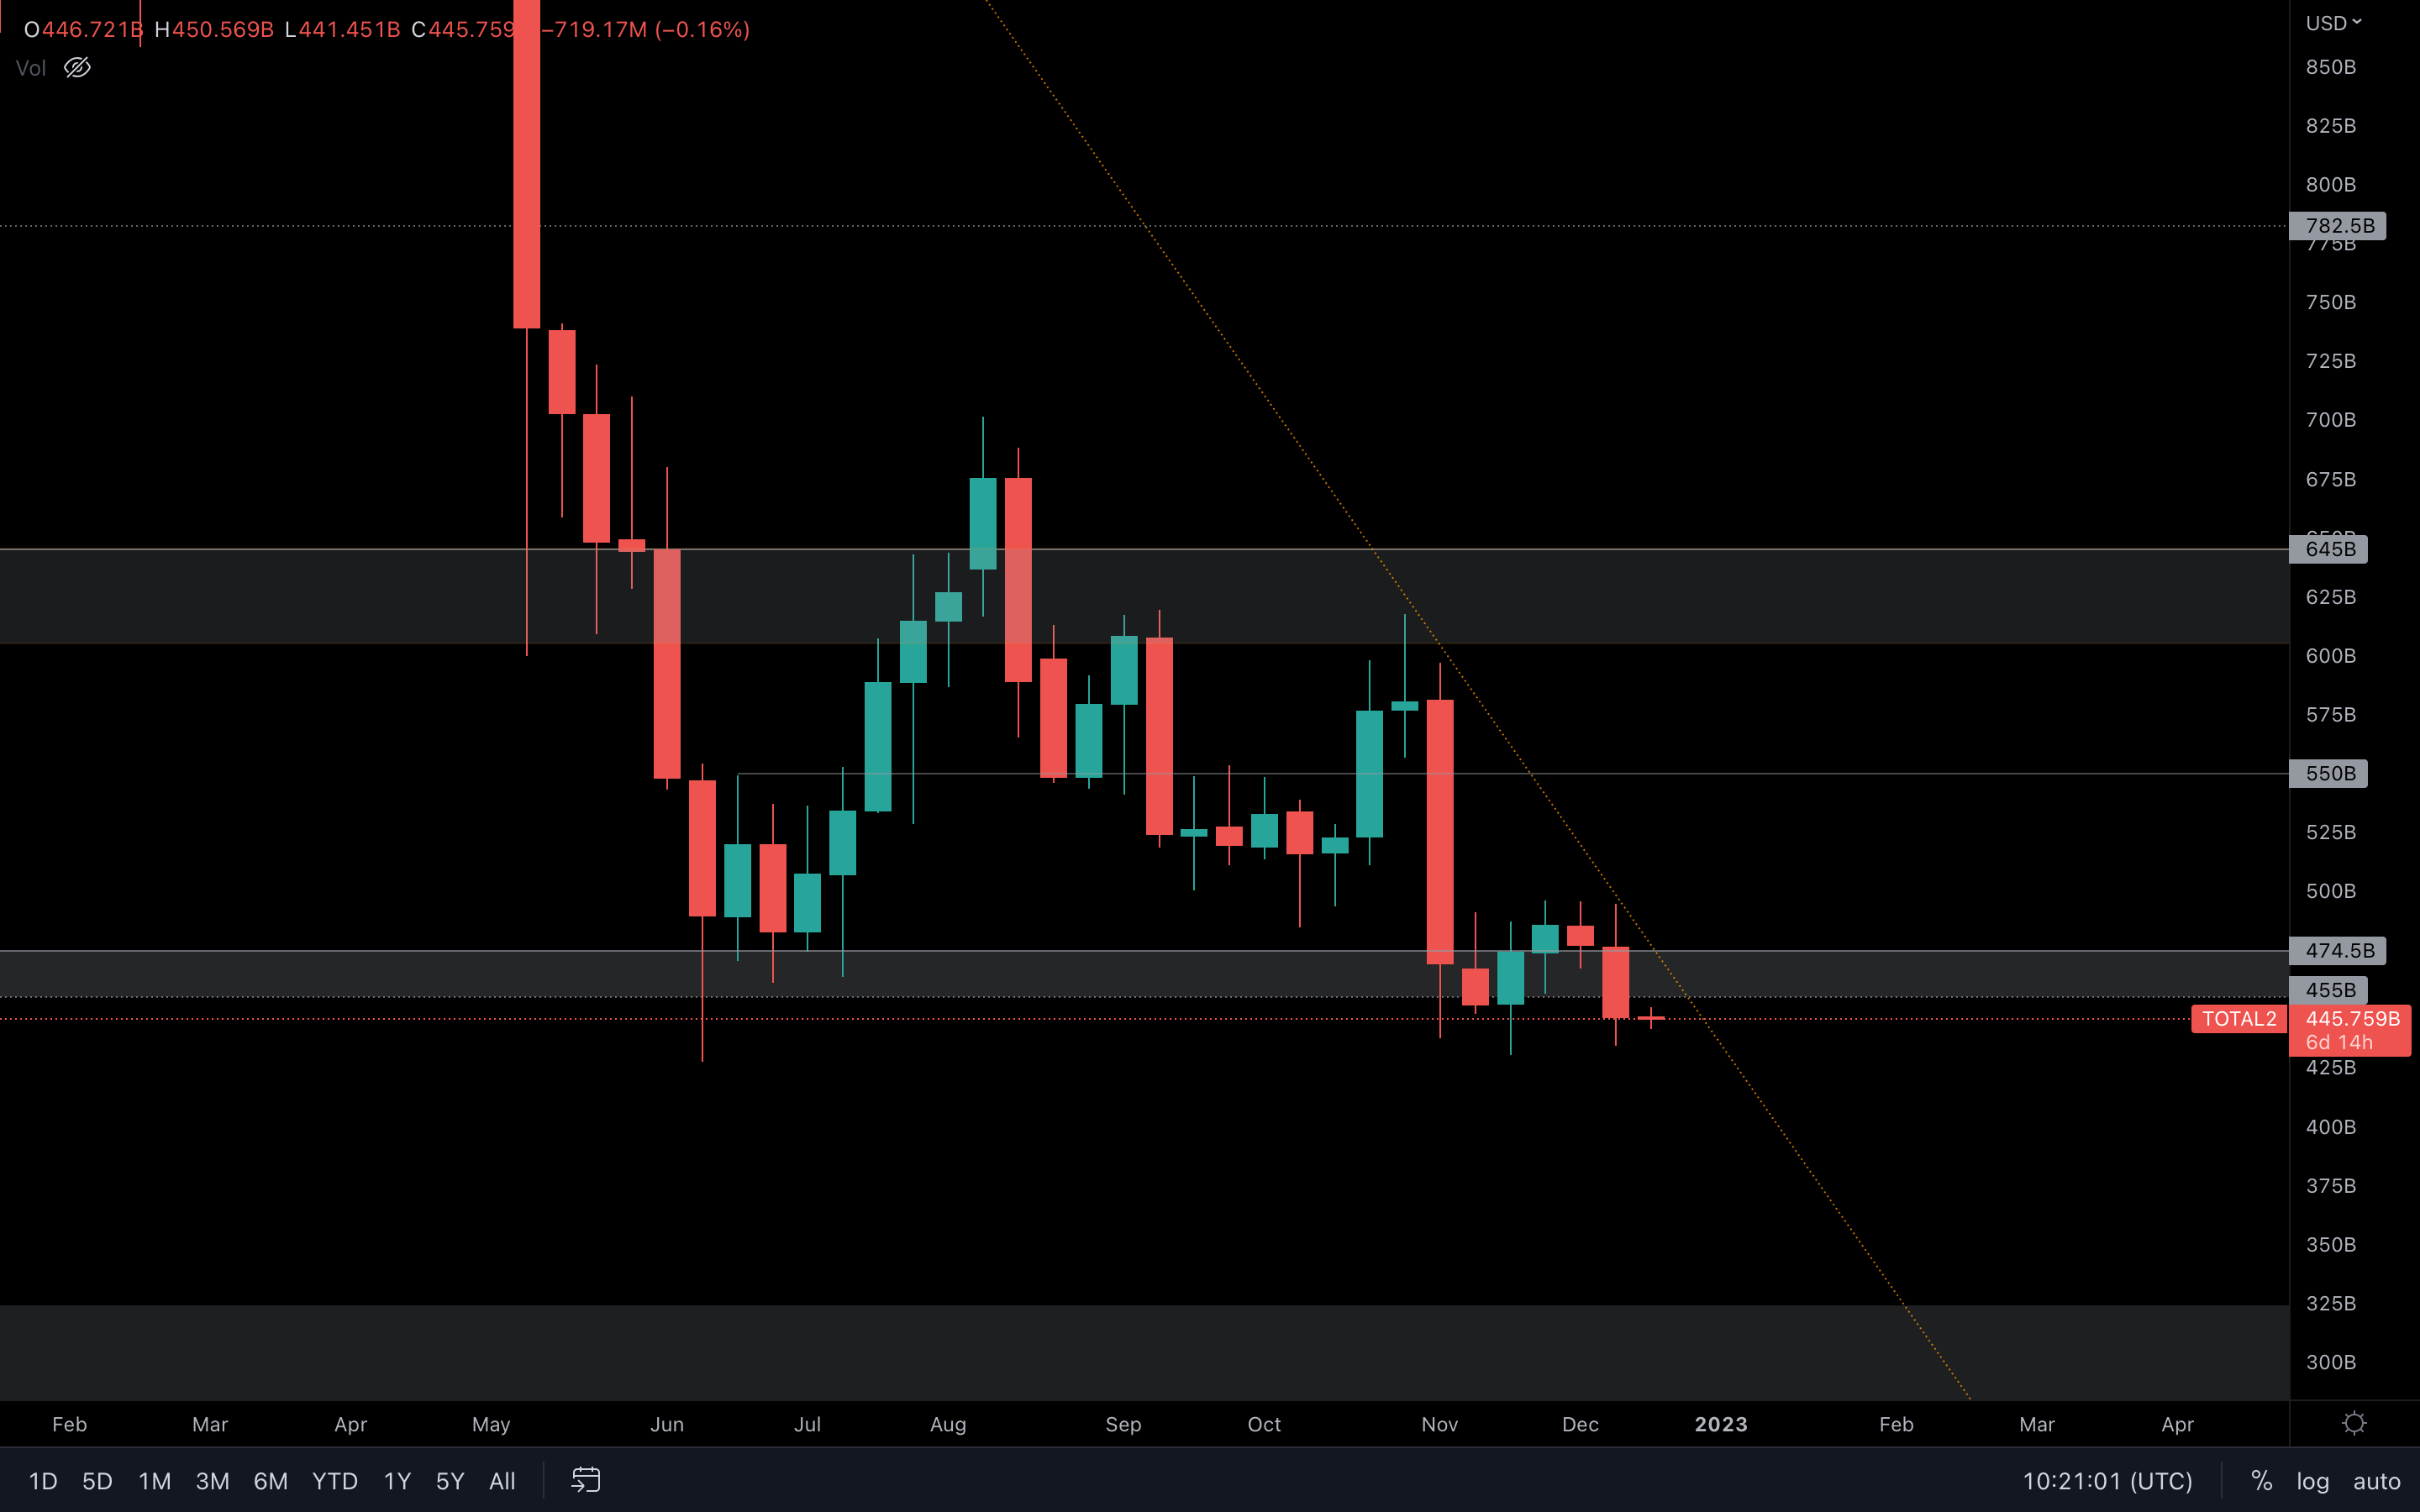
The index has registered an even lower weekly candle closure than before. Last week's candle has also closed under support, so further downside is likely on the cards. But, this index is also in 2018 all-time high territory, which means buyers can step in at any moment.
BTC | Bitcoin
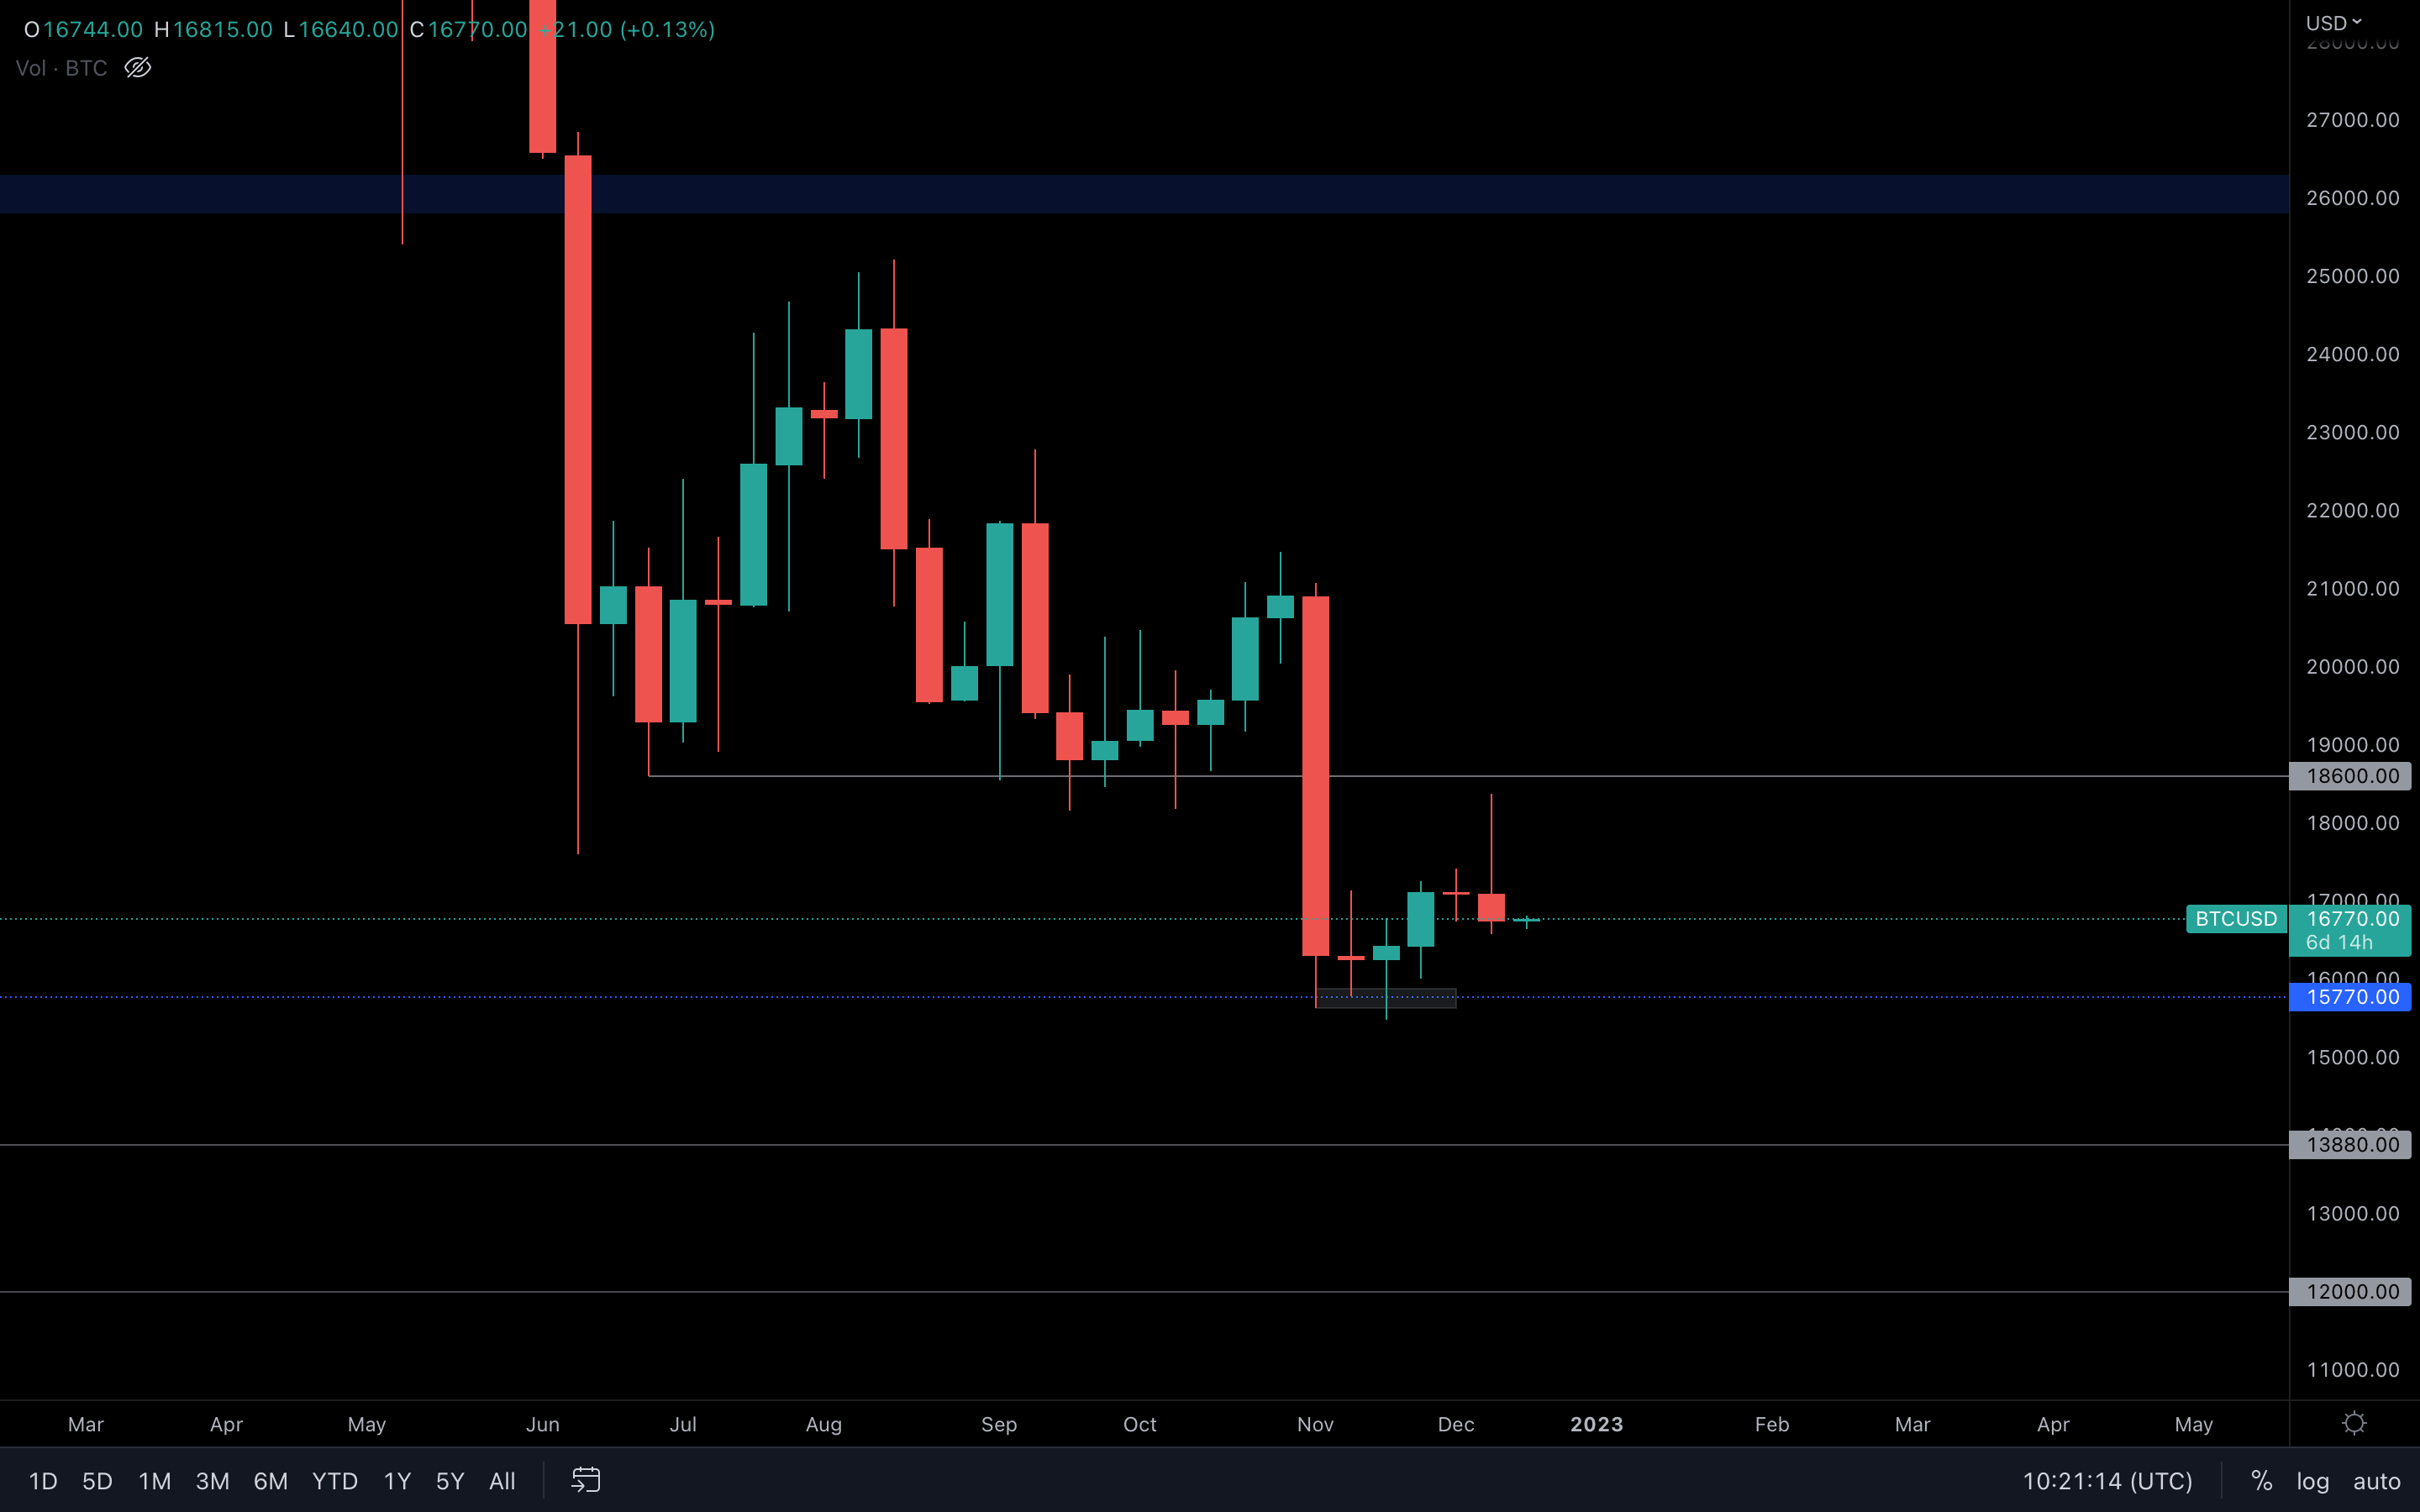
Clear signs of bearishness after last week's closure. Bitcoin is heading toward $15,770, with only a few levels on the way that could easily get invalidated.
Now we will dive into some on-chain metrics for further investigation.
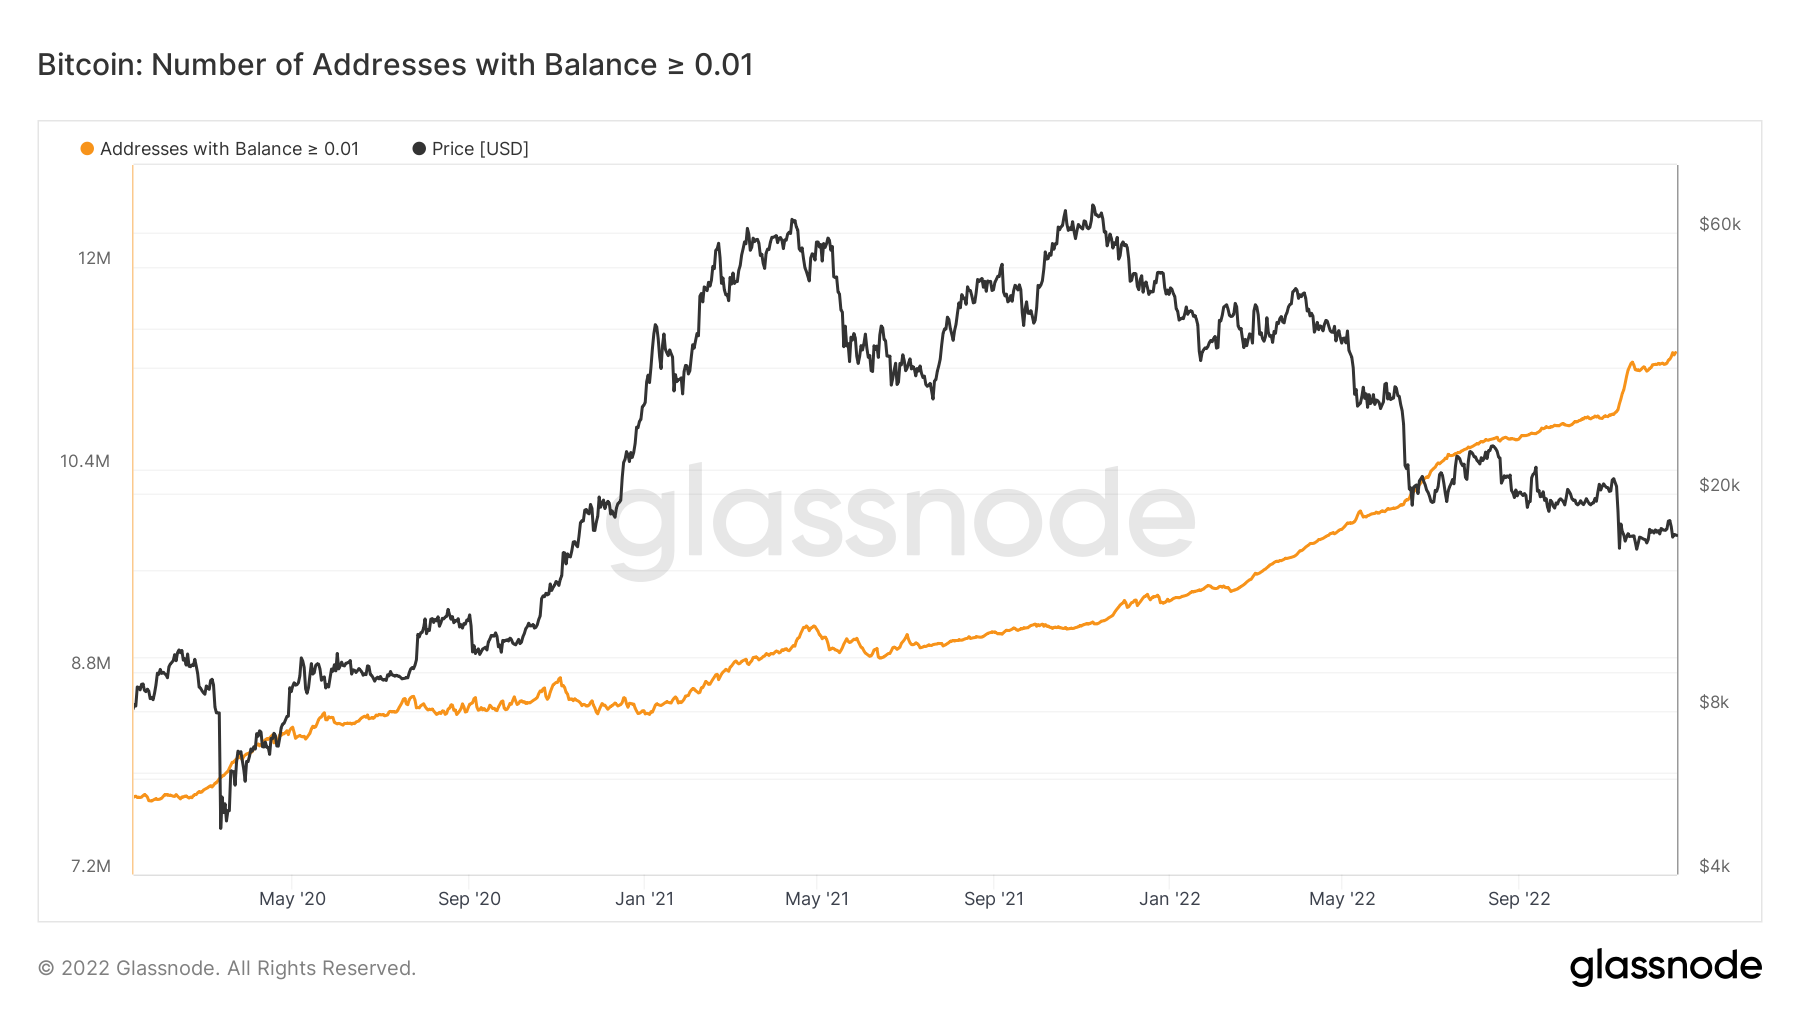
Adresses | BTC
One of the best metrics for assessing how traders are positioned going into year-end is the Addresses metrics. We can see that the smallest Bitcoin wallet cohorts (Addresses with Balances > 0.01 and 0.1 Bitcoin) had an increase in their total number of wallets.We will go through all the significant wallet addresses below.
Adresses with Balance > 0.01 Bitcoin | BTC
 Adresses with Balance > 0.1 Bitcoin | BTC
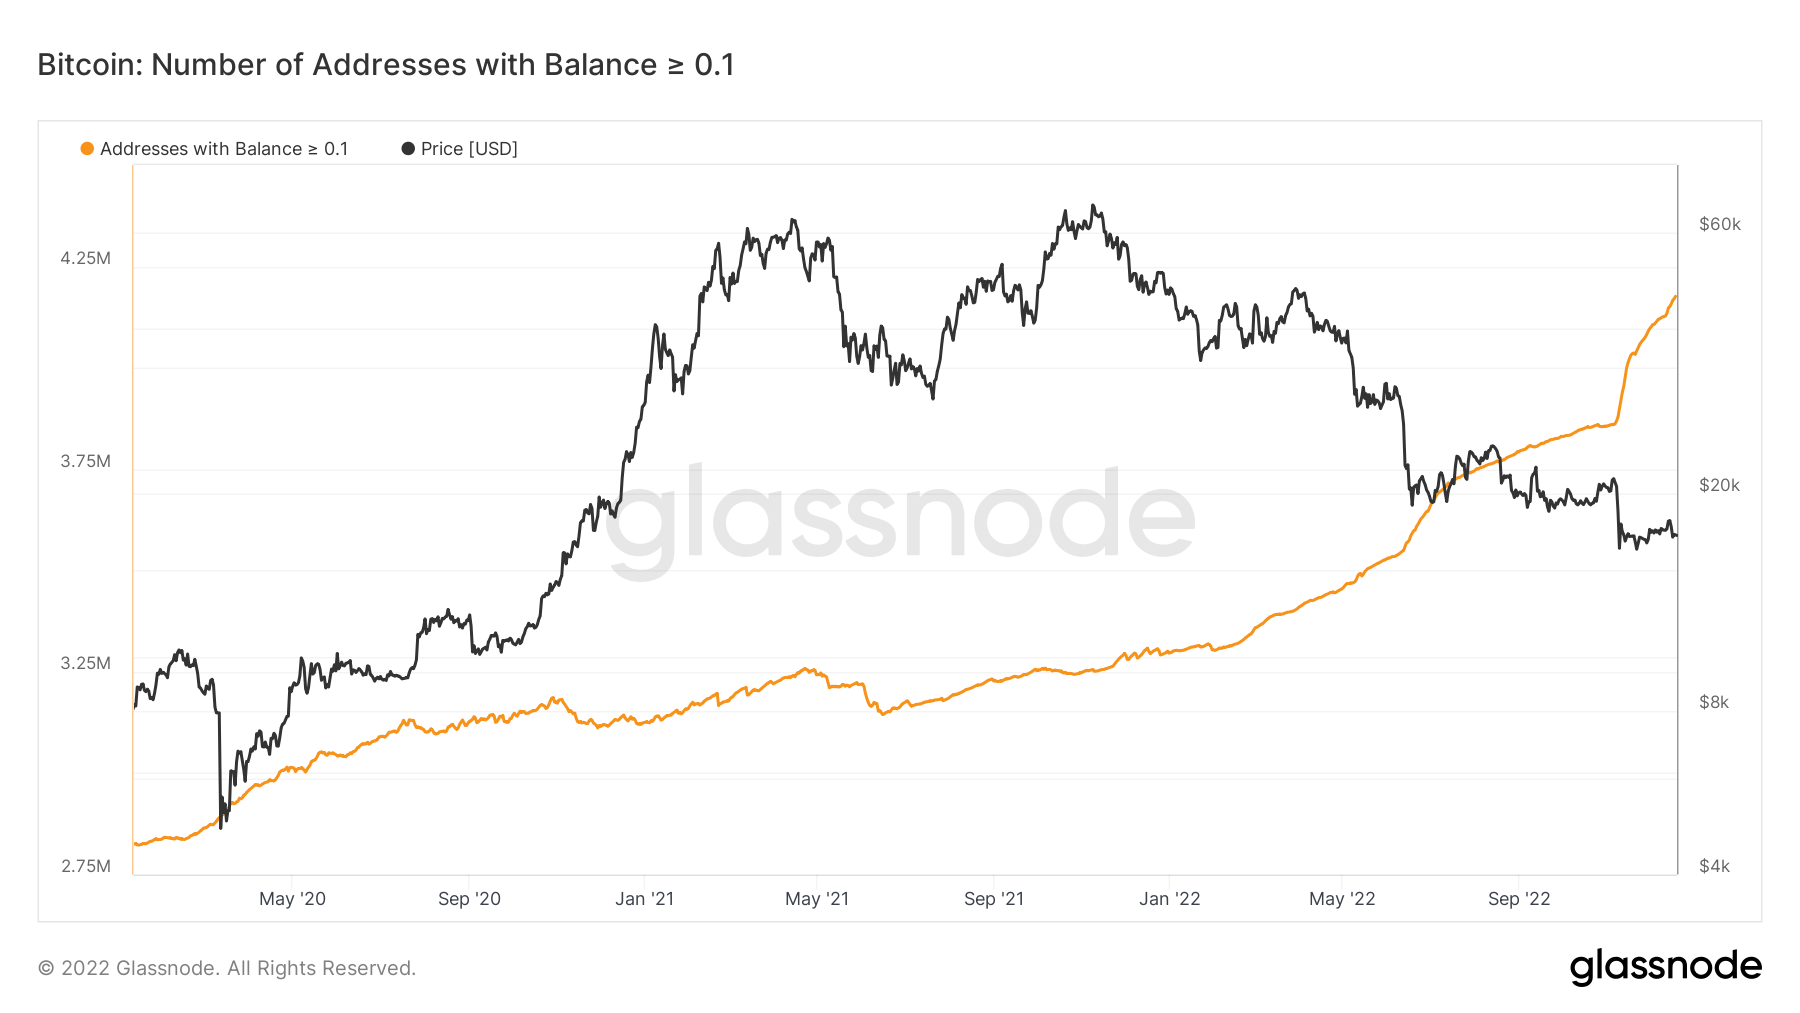
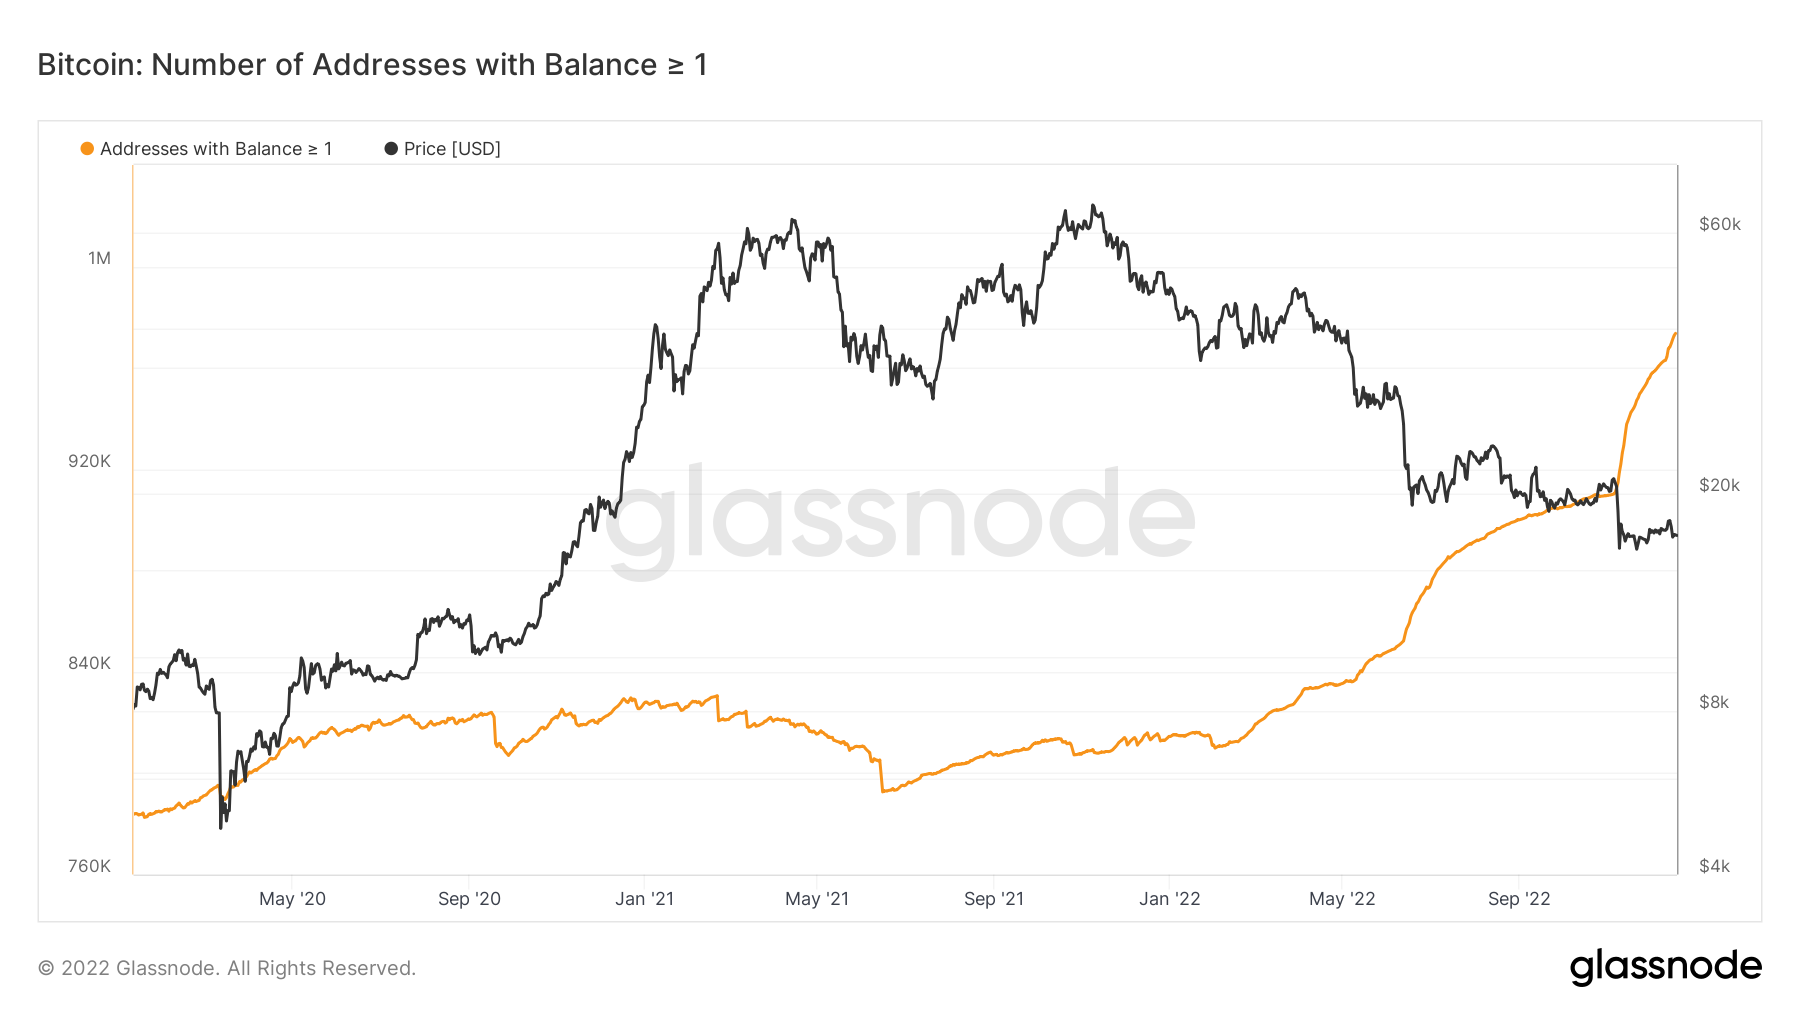
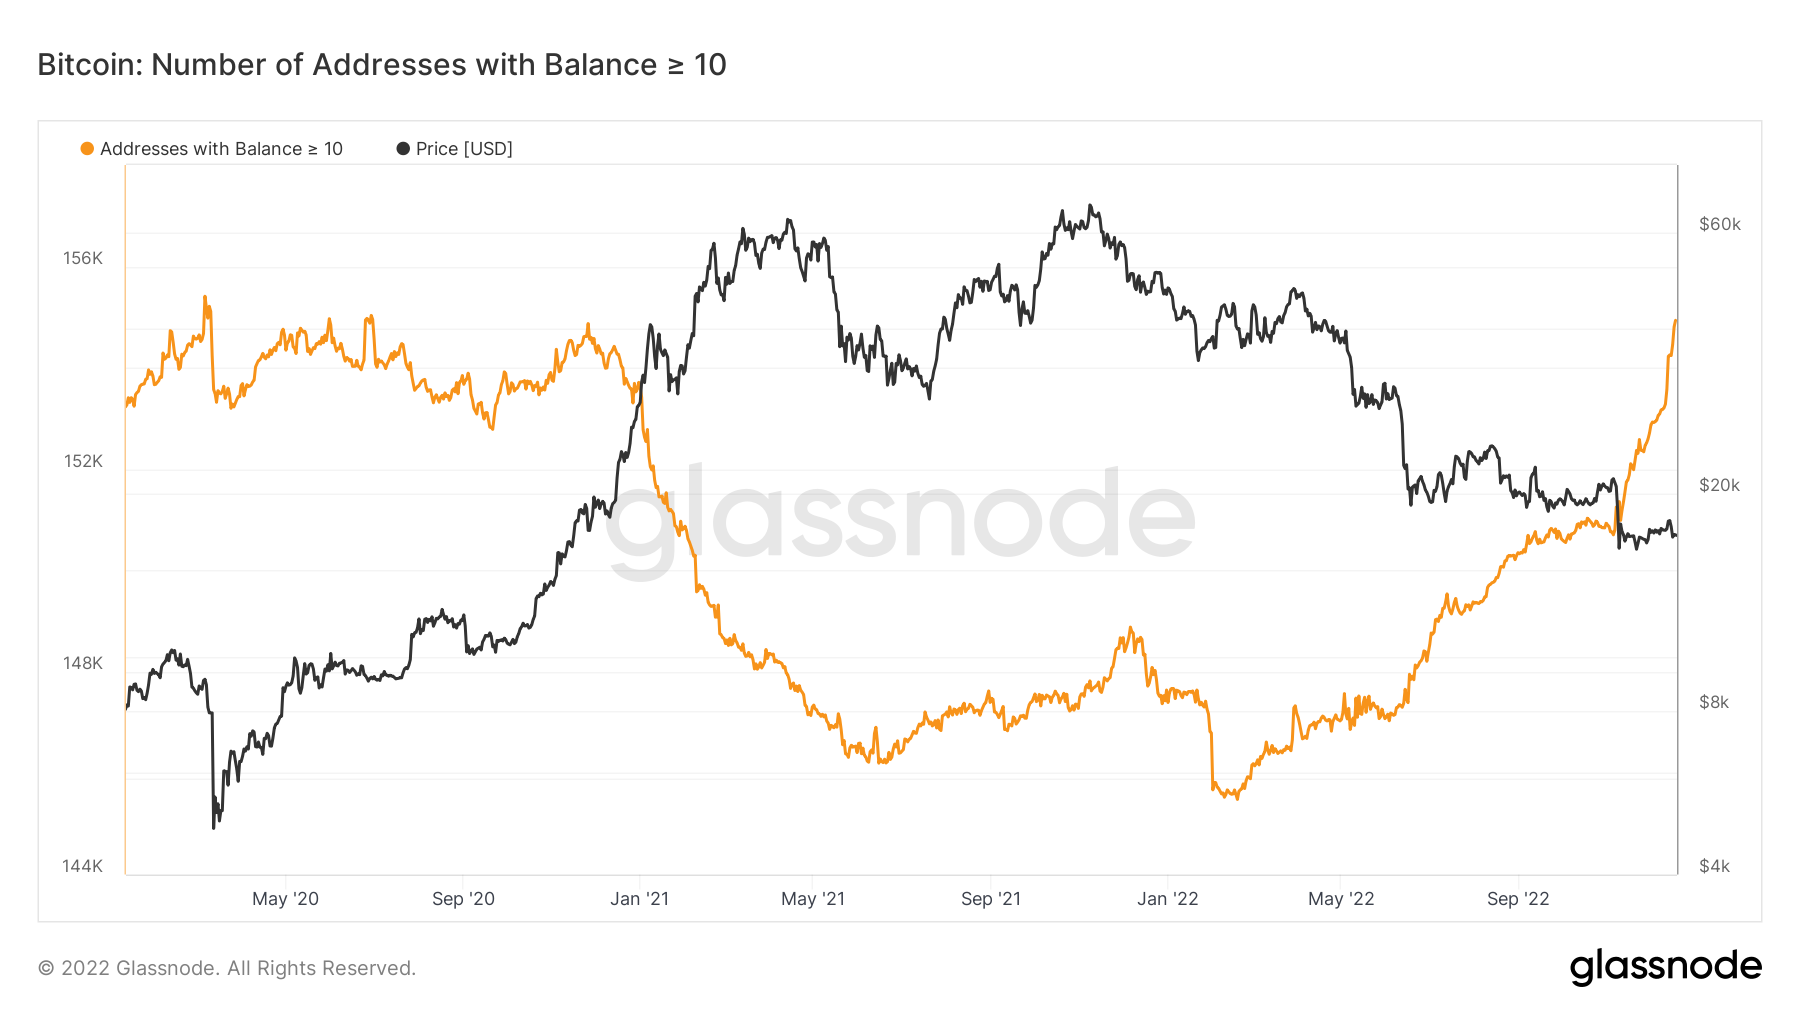
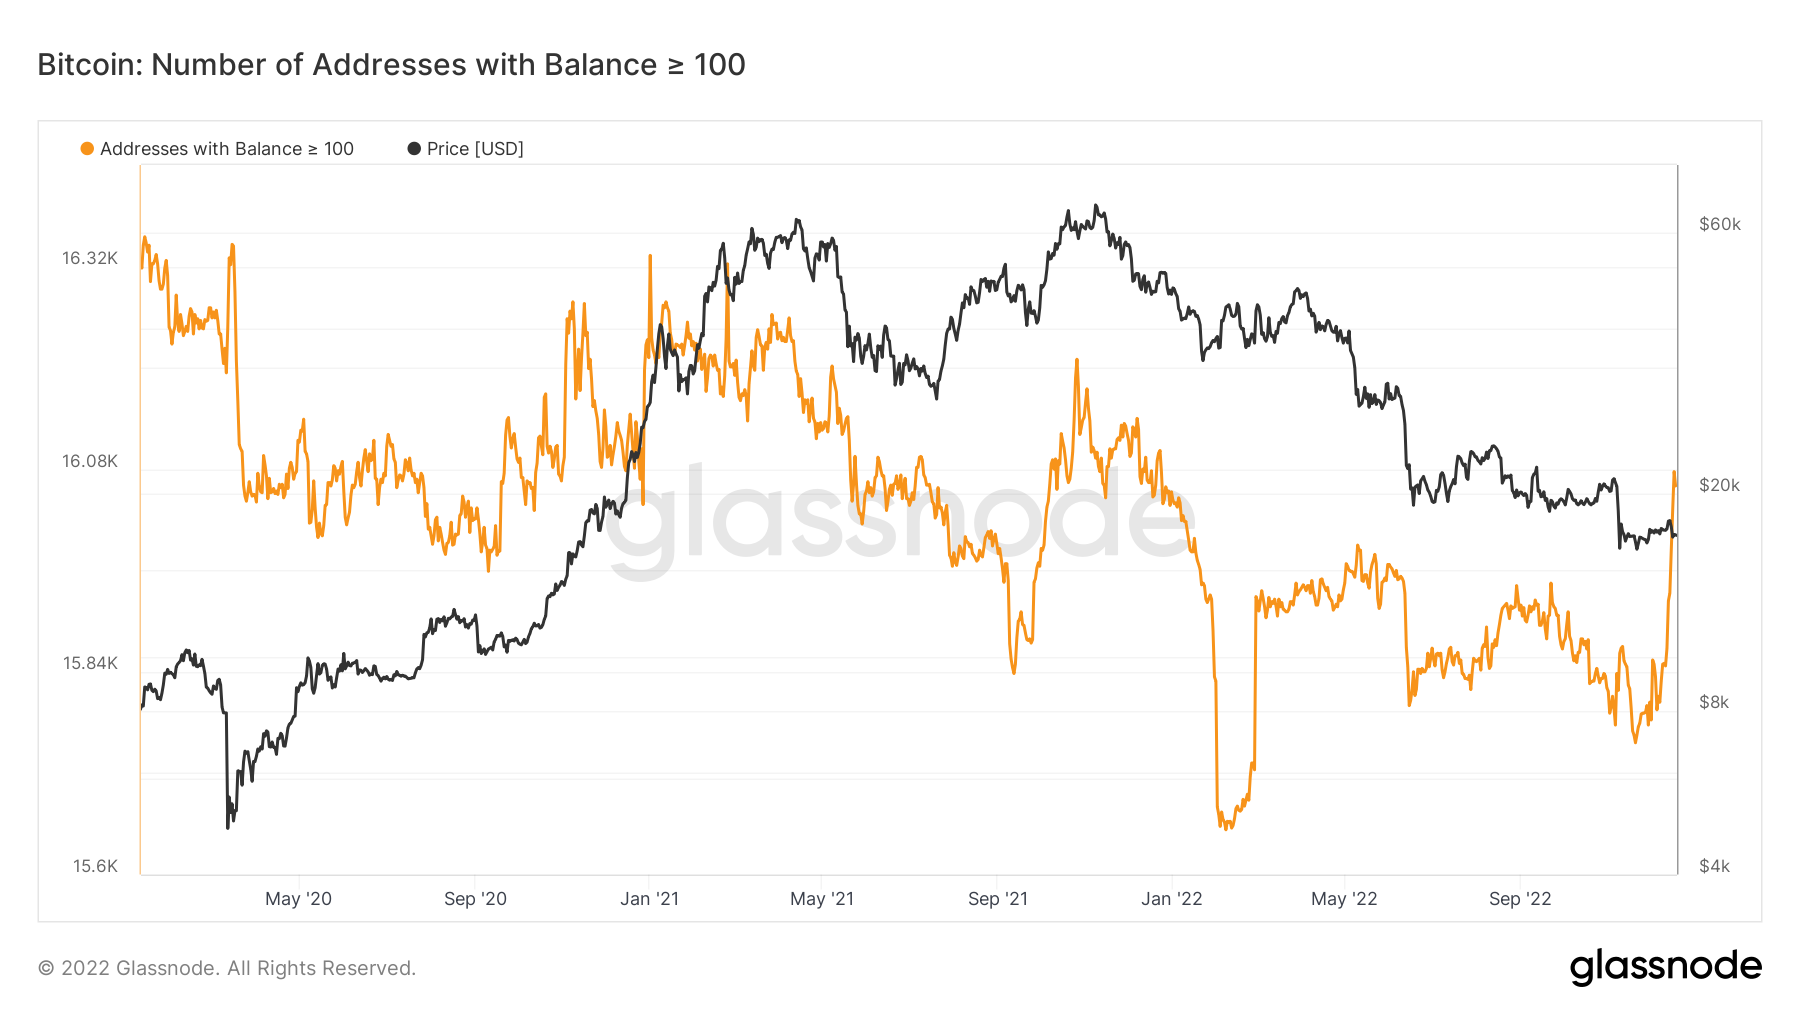
As we move through adresses, we see that the middle sized Bitcoin wallets (Addresses with Balance > 1, 10, and 100 Bitcoin) had more dramatic increases in their wallet numbers.
Adresses with Balance > 1 Bitcoin | BTC
 Adresses with Balance > 10 Bitcoin | BTC
 Adresses with Balance > 100 Bitcoin | BTC
Unfortunately, the biggest Bitcoin wallets did not see a similar willingness to risk-on (add coins to their balances) over the past week.
Adresses with Balance > 1,000 Bitcoin | BTC
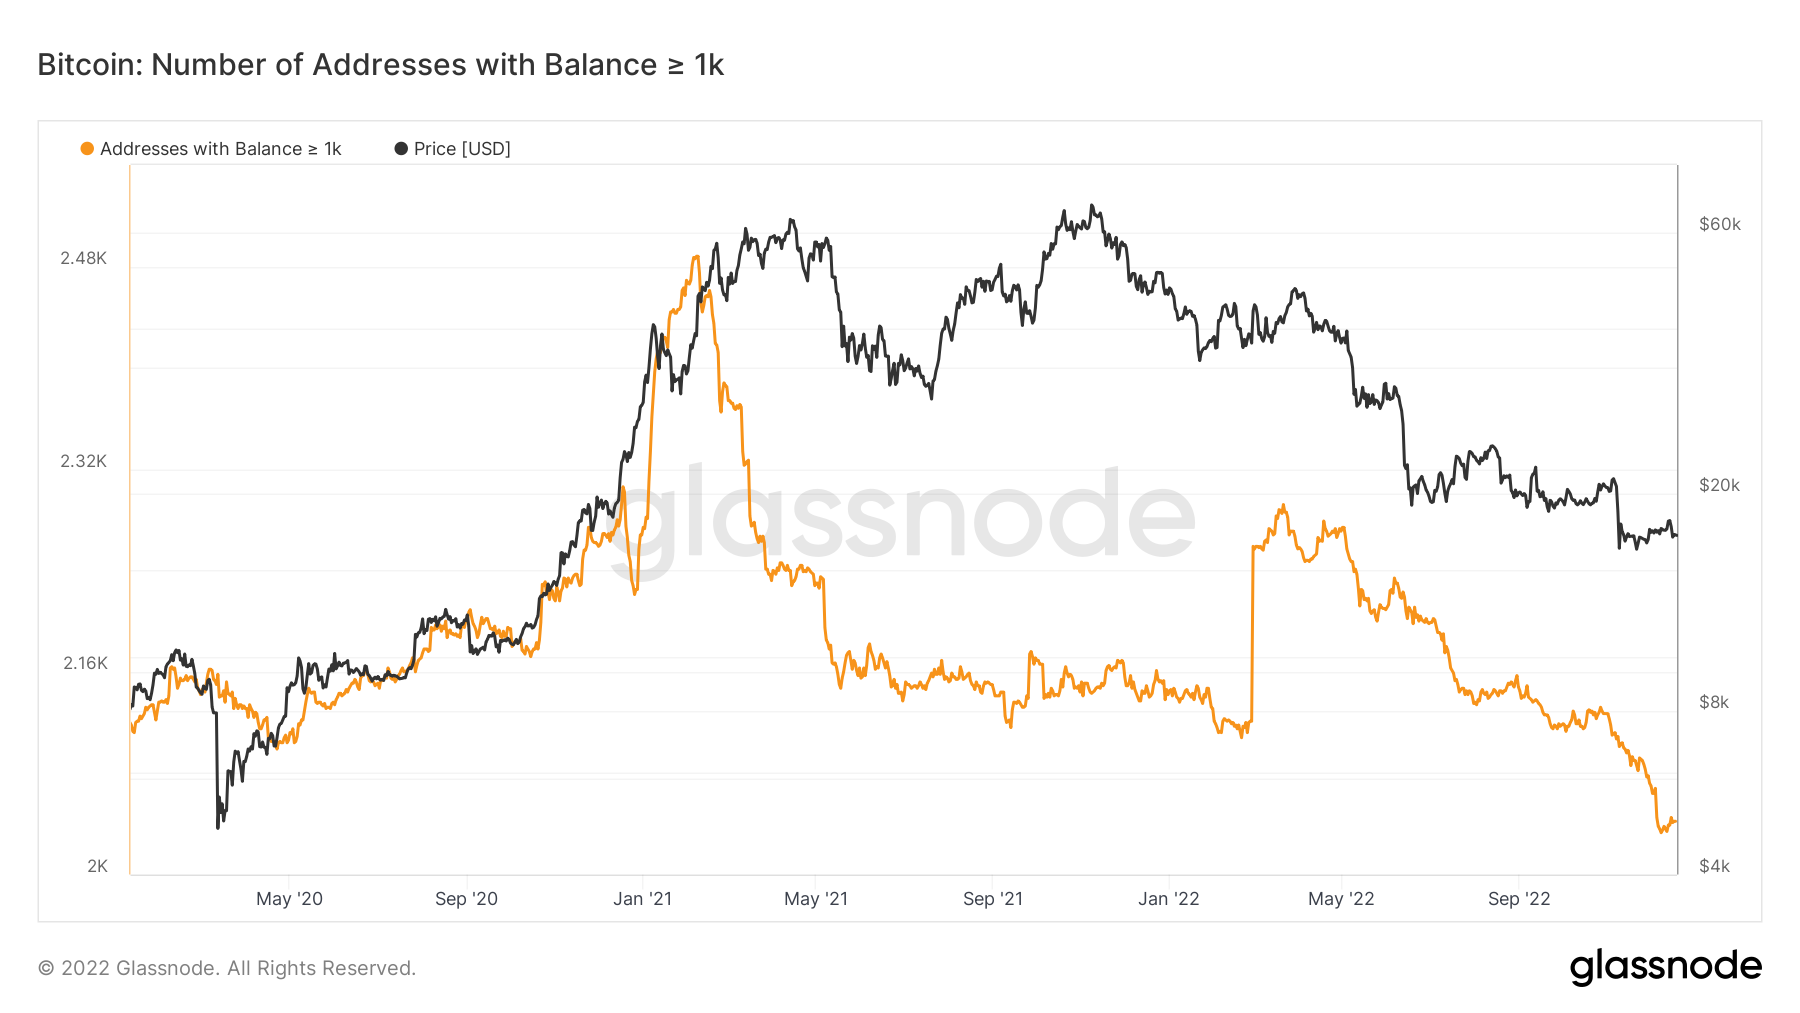
The 1K cohort is seen as the most profitable and has been the best at knowing when to buy or sell. We should wait for this cohort to show greater spikes and therefore be more cautious for the time being.
Percent Supply in Profit | BTC
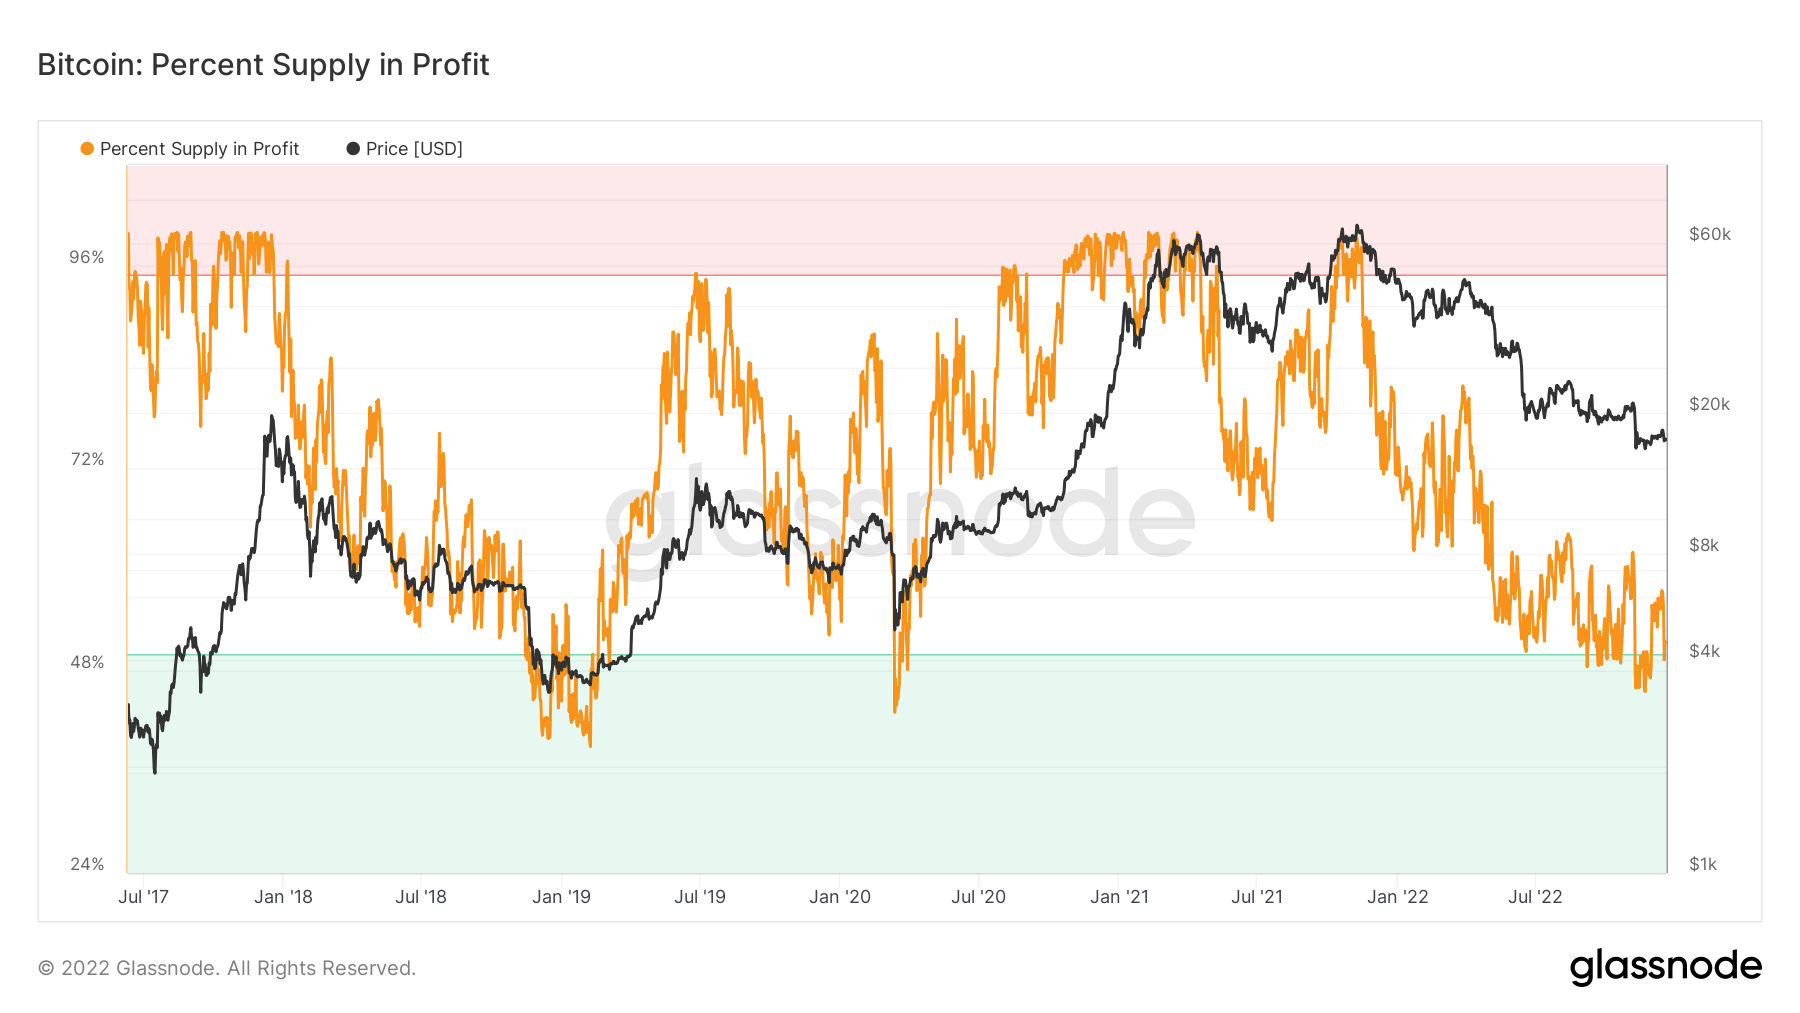 The Percent Supply in Profit shows the percentage of circulating supply in profit. In prior bear markets, price bottoms occur when the percentage of circulating supply in profit falls below the 45-50% level. We can see at the most recent lows of $15,500 for Bitcoin that this was the case.
RHODL Ratio | BTC
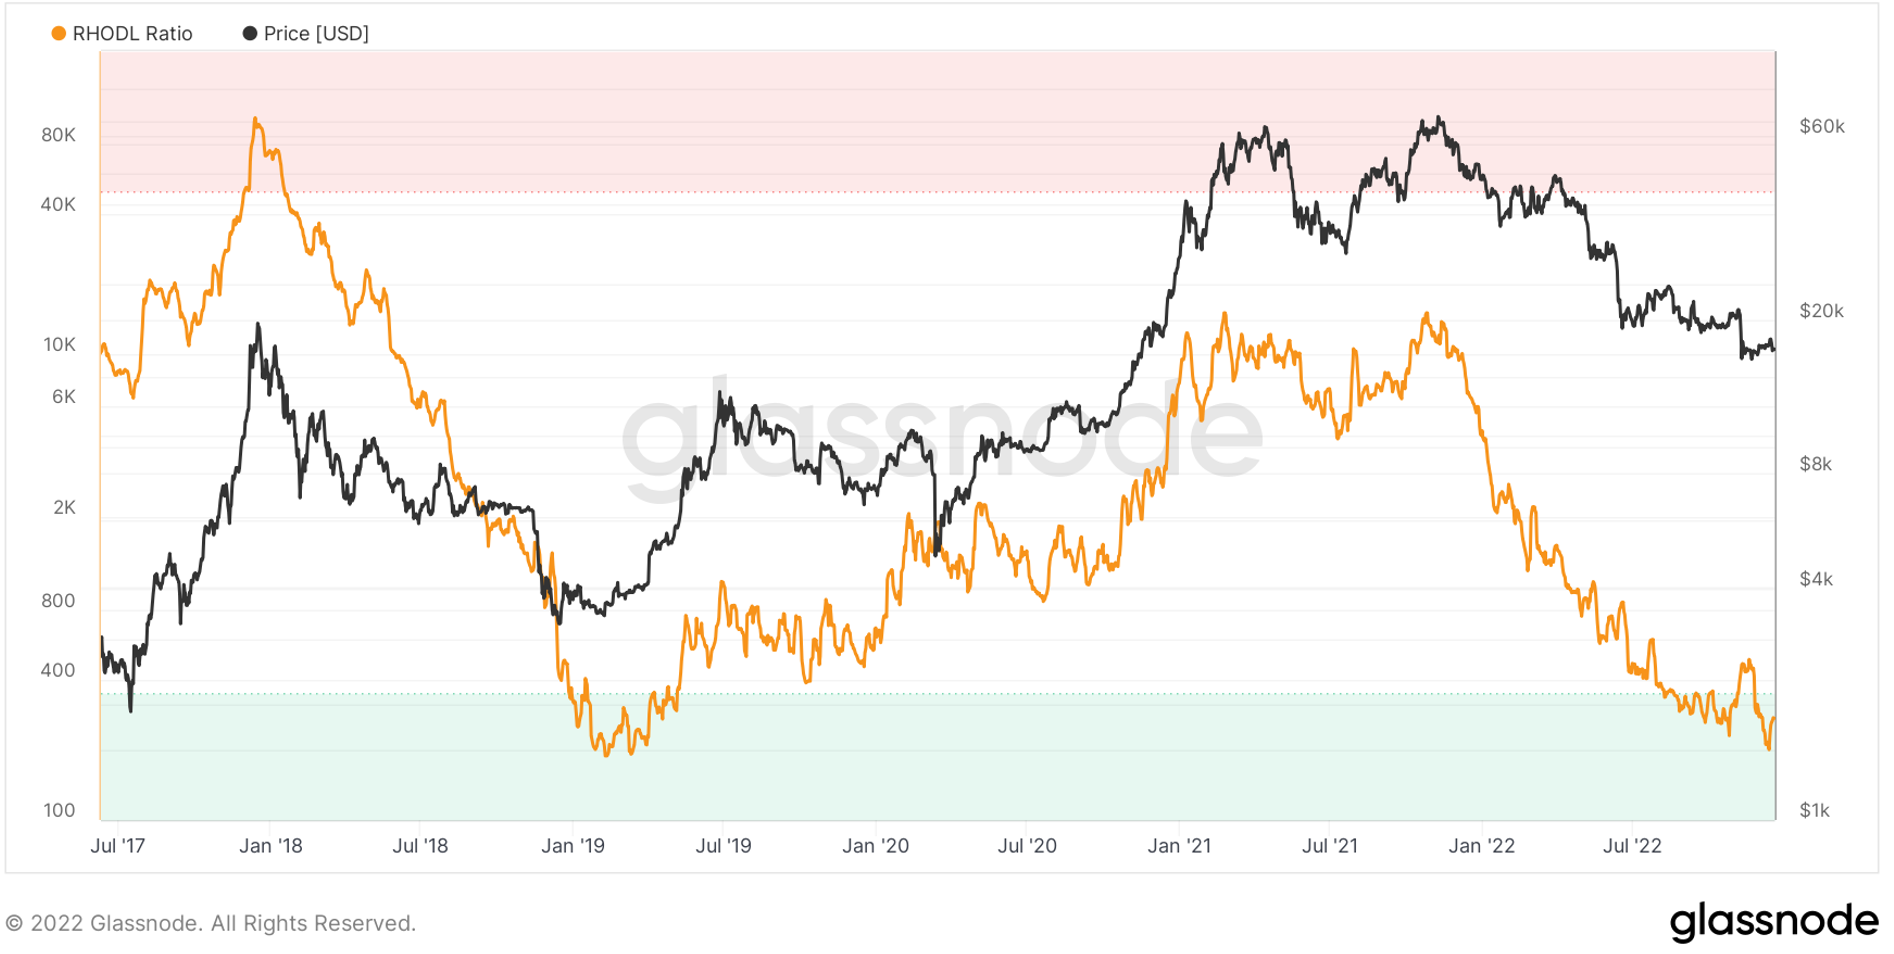
A high ratio is a sign of an overheated market. We can see in the below that this metric is in the green zone and has recently been as low as 200. The last time this metric was as low as 200 was Q1 2019, just after the price bottom of the last bear market.
Market Value to Realised Value Temperature | BTC
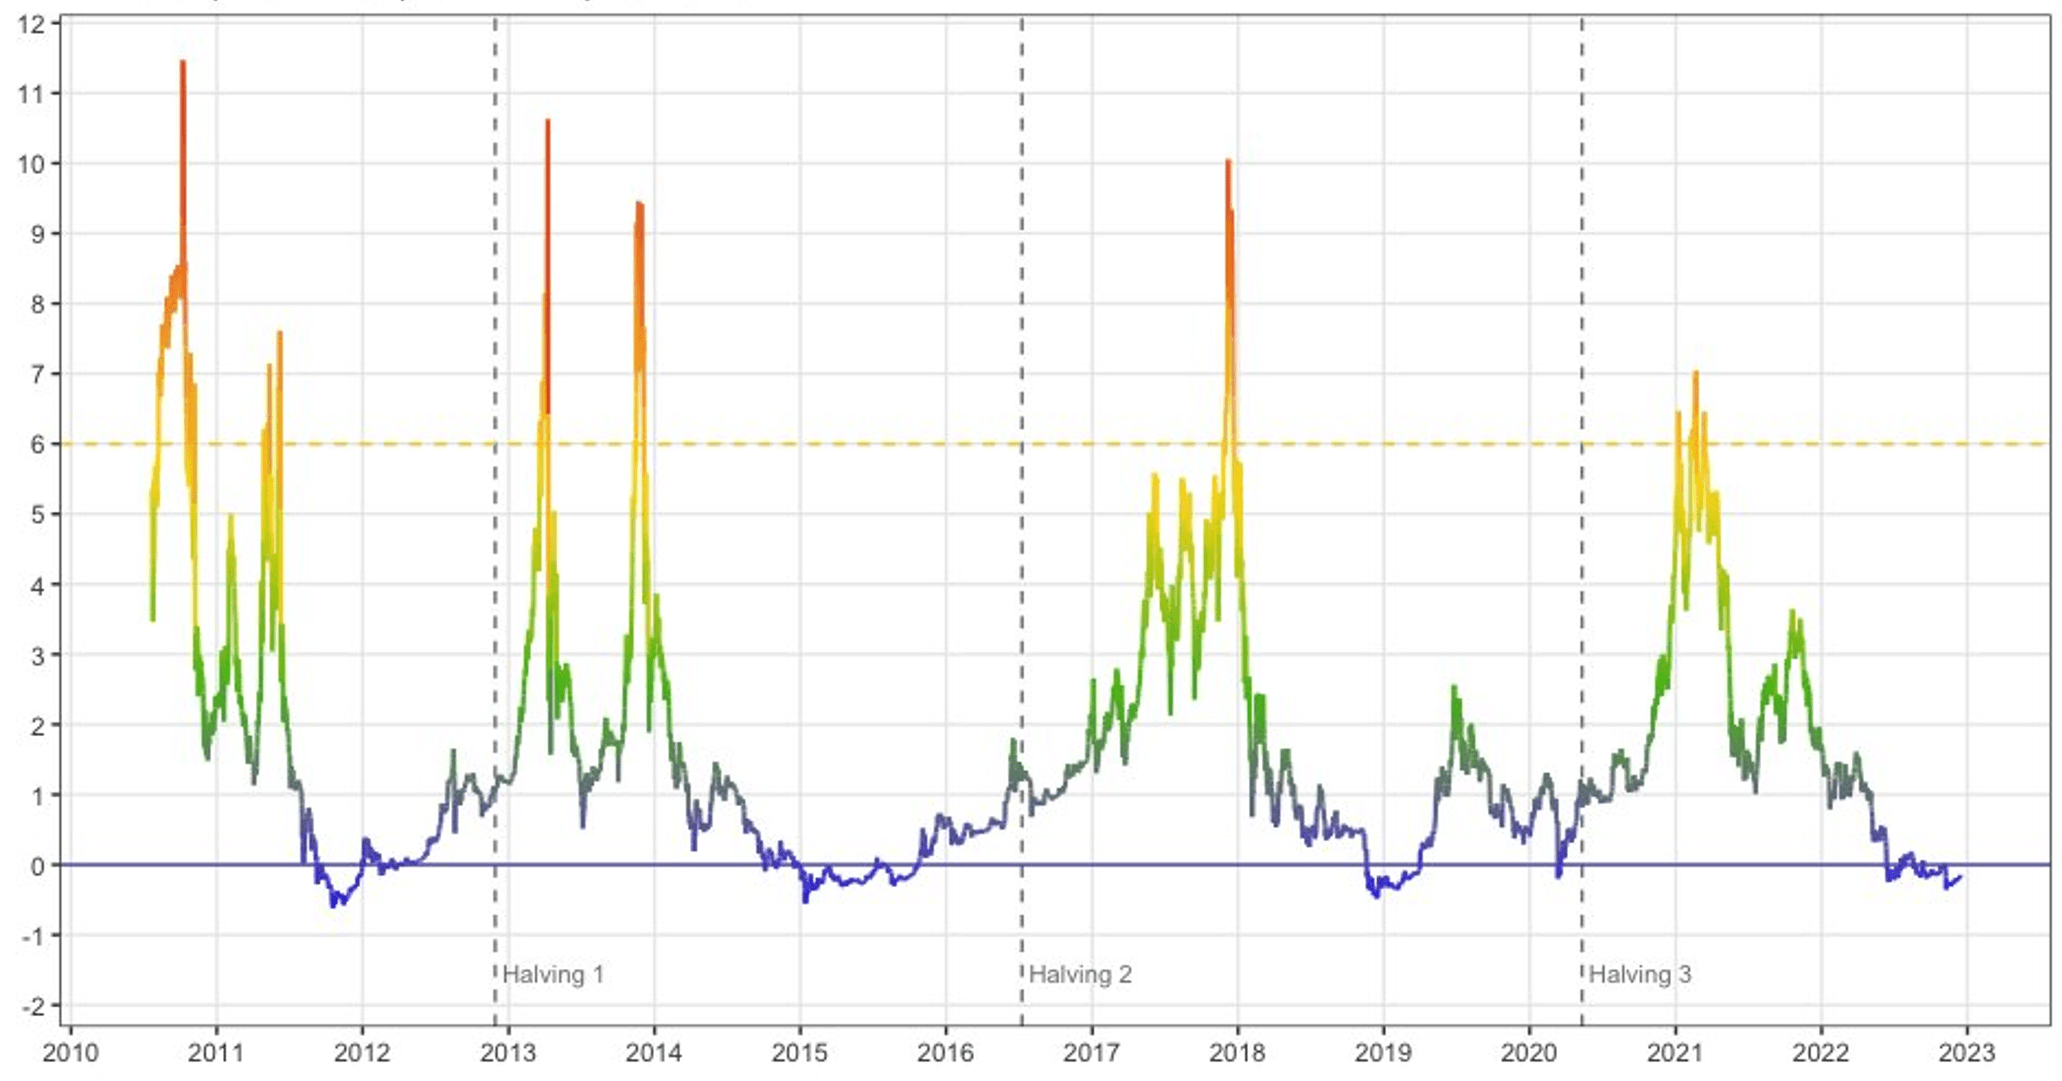
The MVRVT metric measures the distance between the daily closing price and realised price in number of standard deviations. Values sub 0 have historically been an excellent time to buy Bitcoin.
ETH | Ethereum
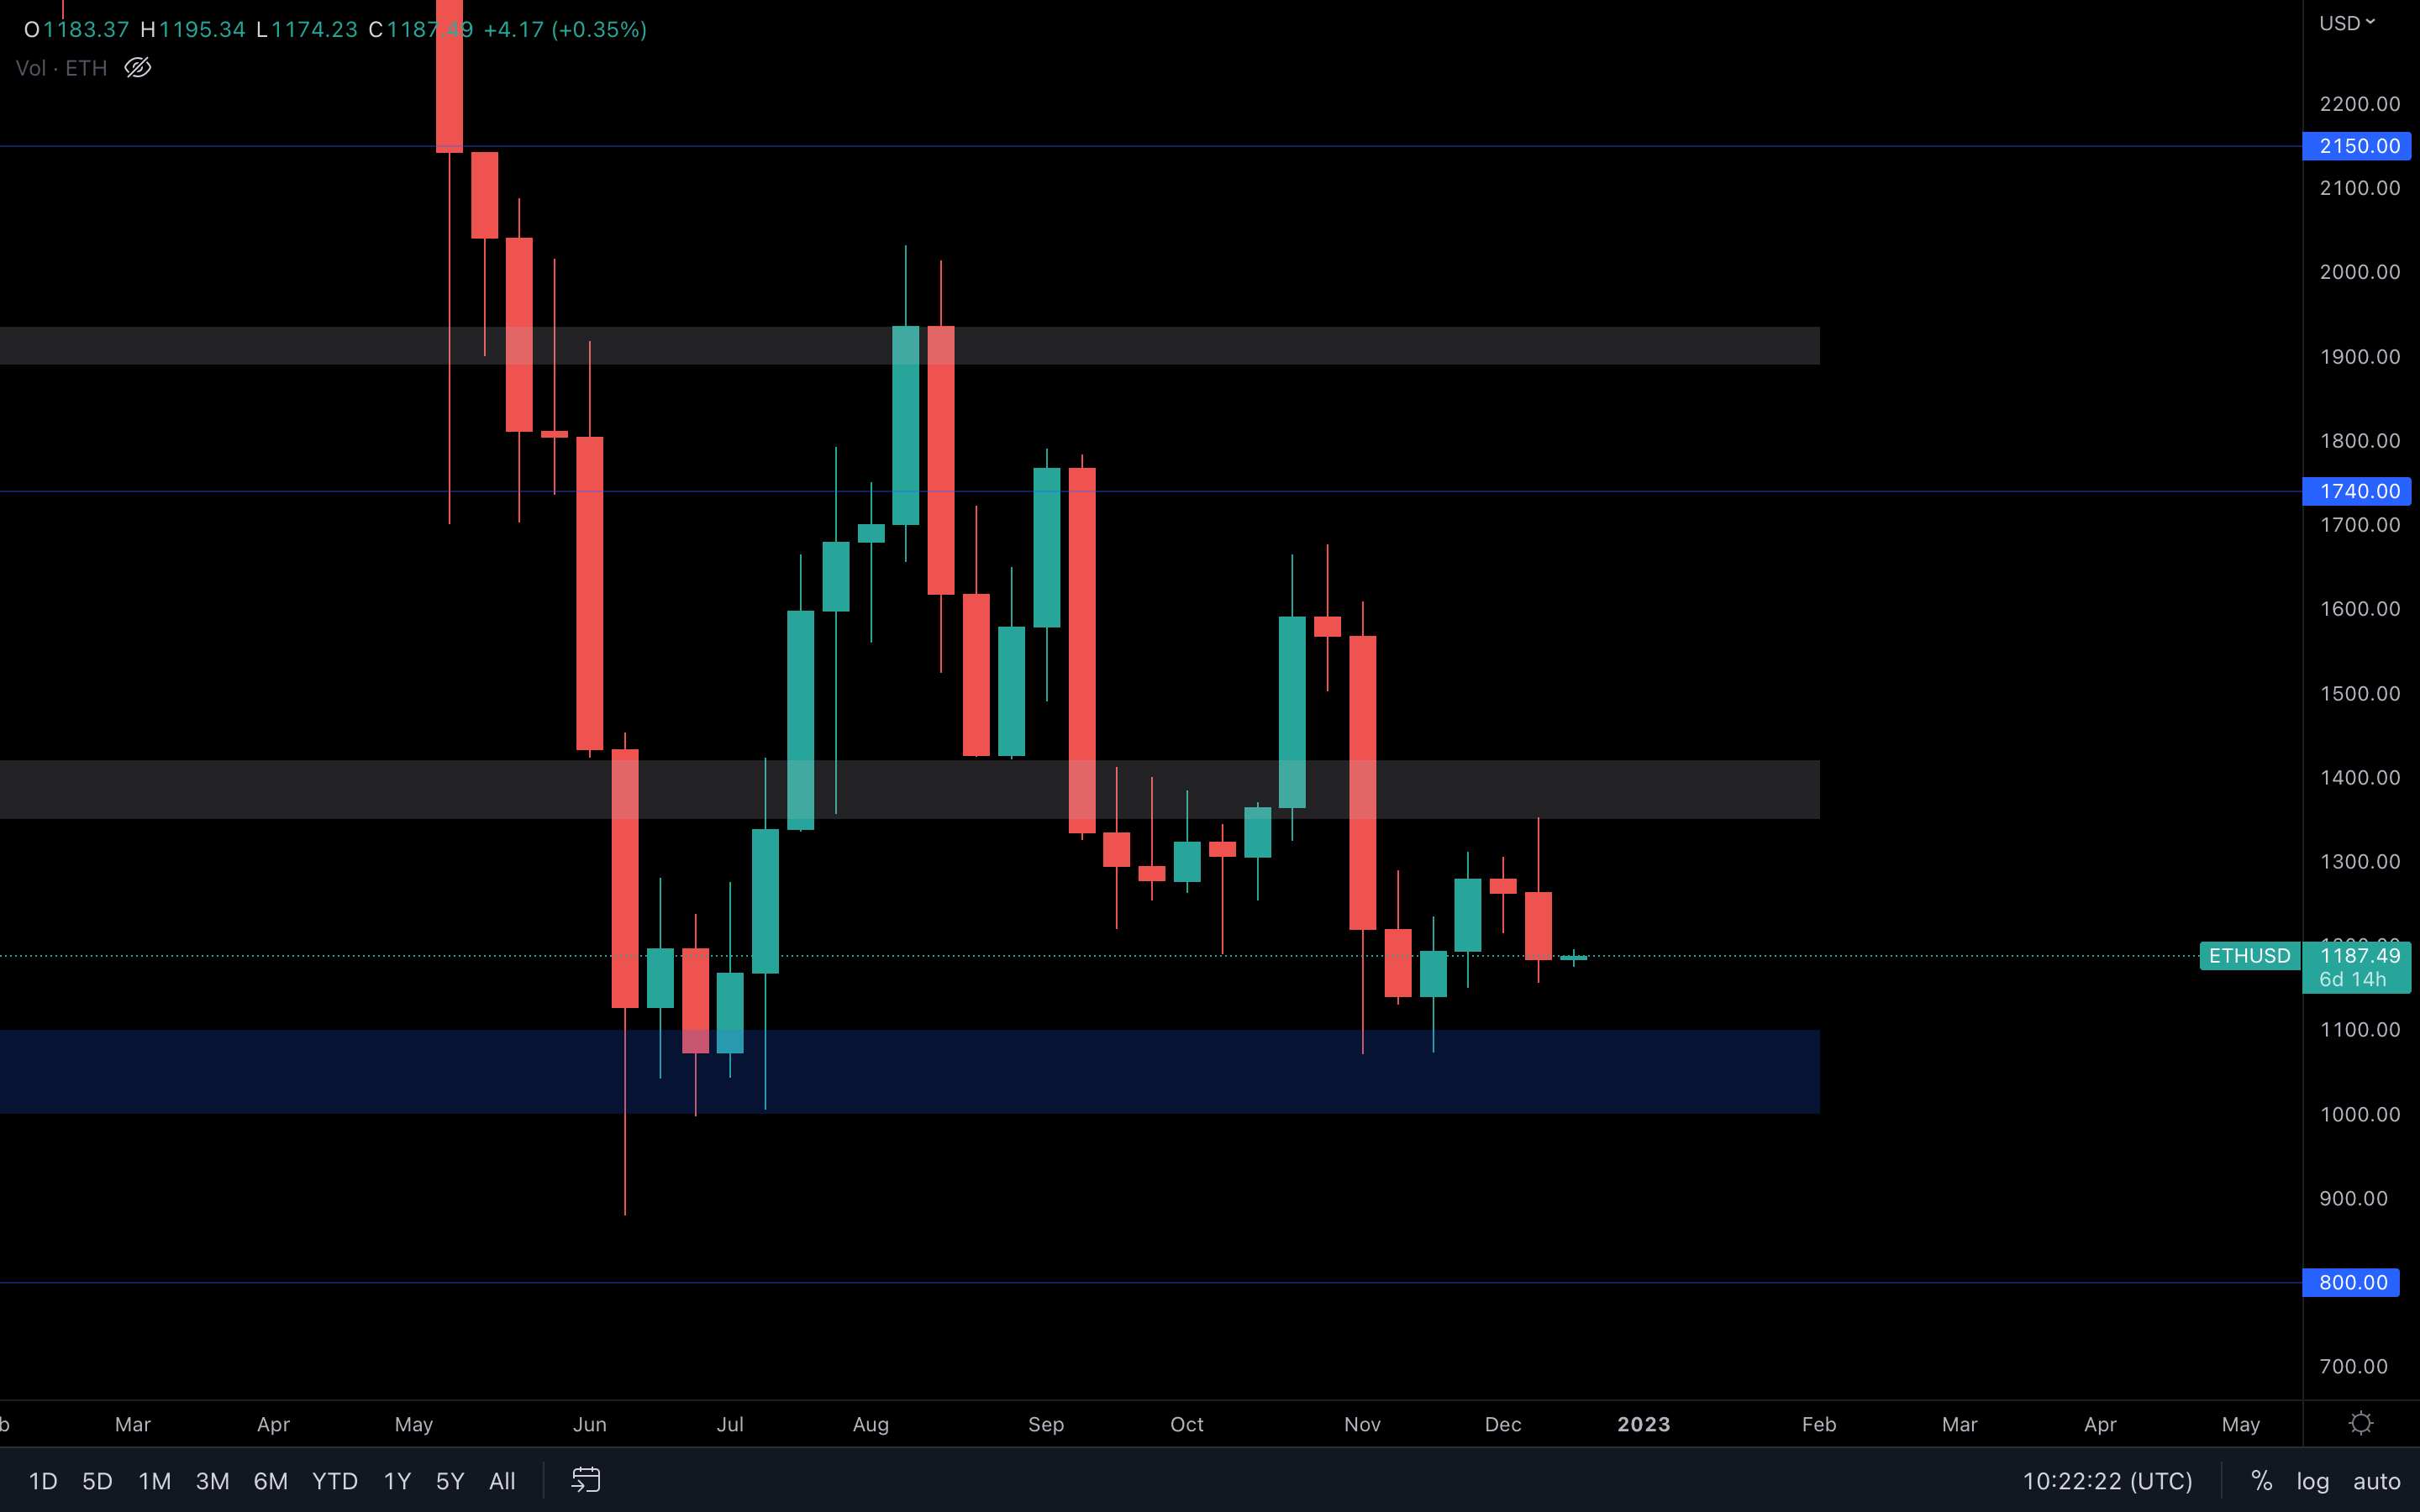
Ether has experienced rejection after testing the $1350 - $1400. The market structure remains bearish, and a test of $1100 will likely occur soon.
SOL | Solana
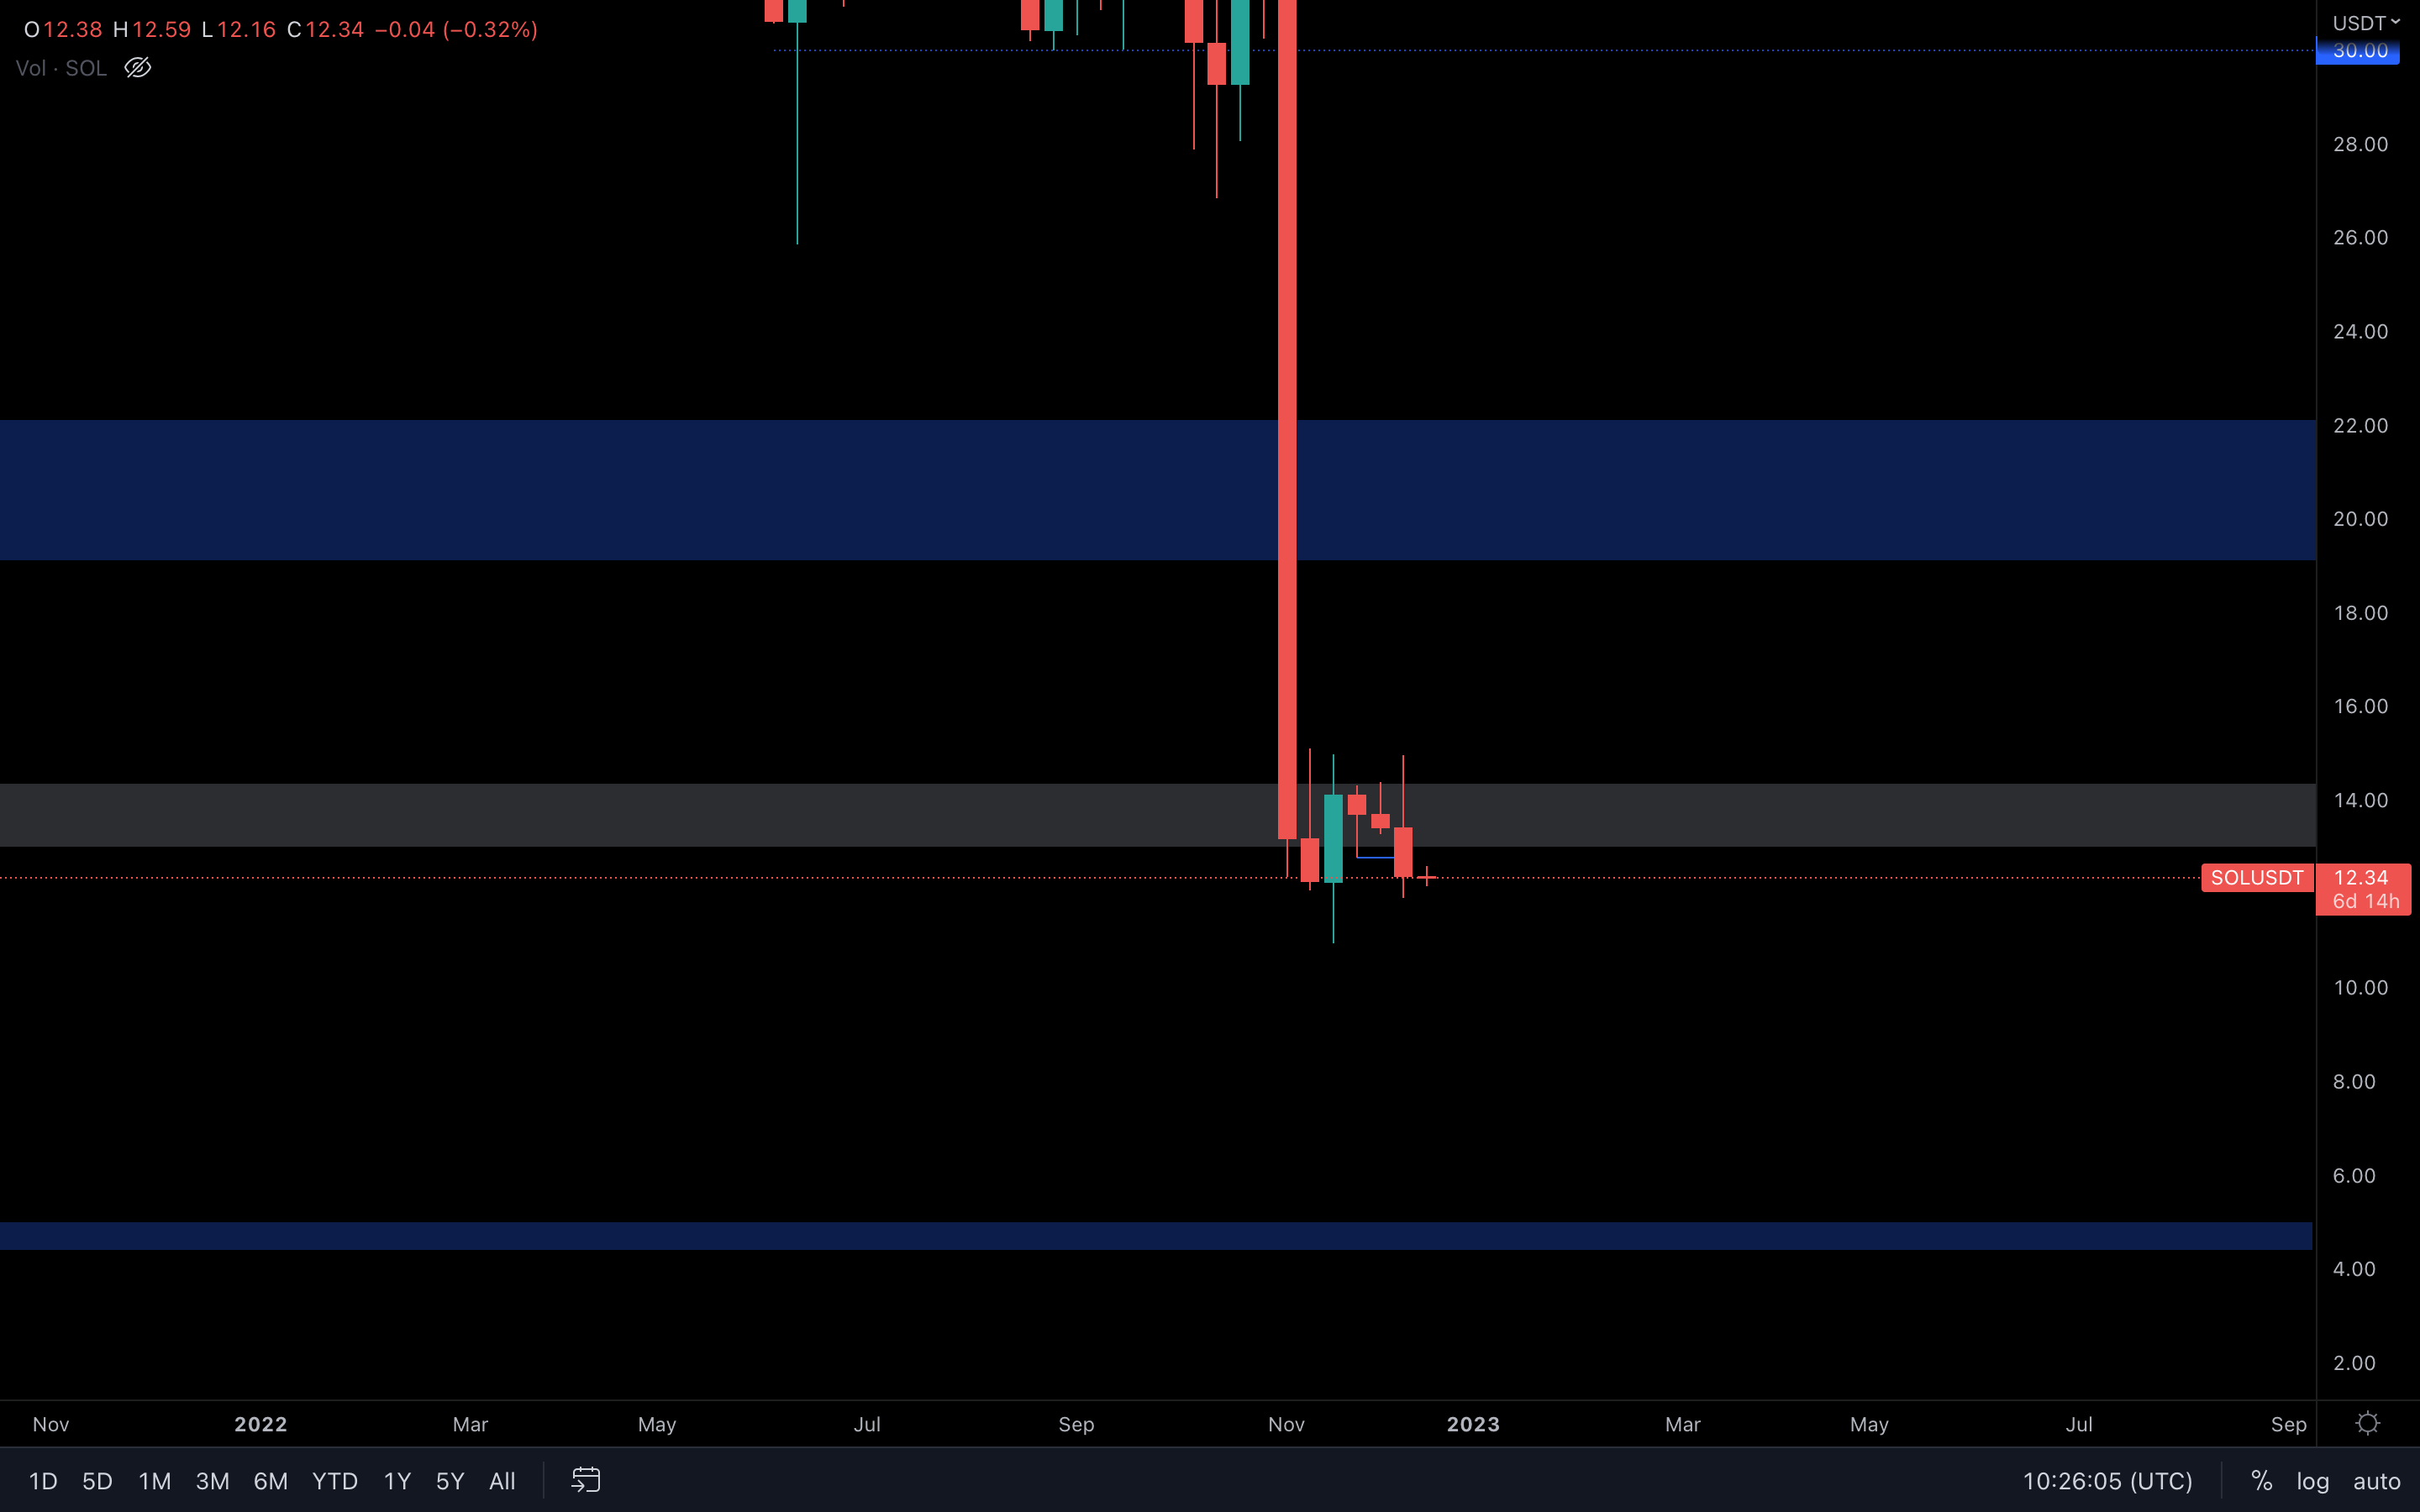
This weekly support level is now lost, so unless SOL manages to reclaim $13, we could be heading lower ($11, $10, and so on). There are zero solid technical levels from which buyers could step in until $5.
RUNE | THORChain
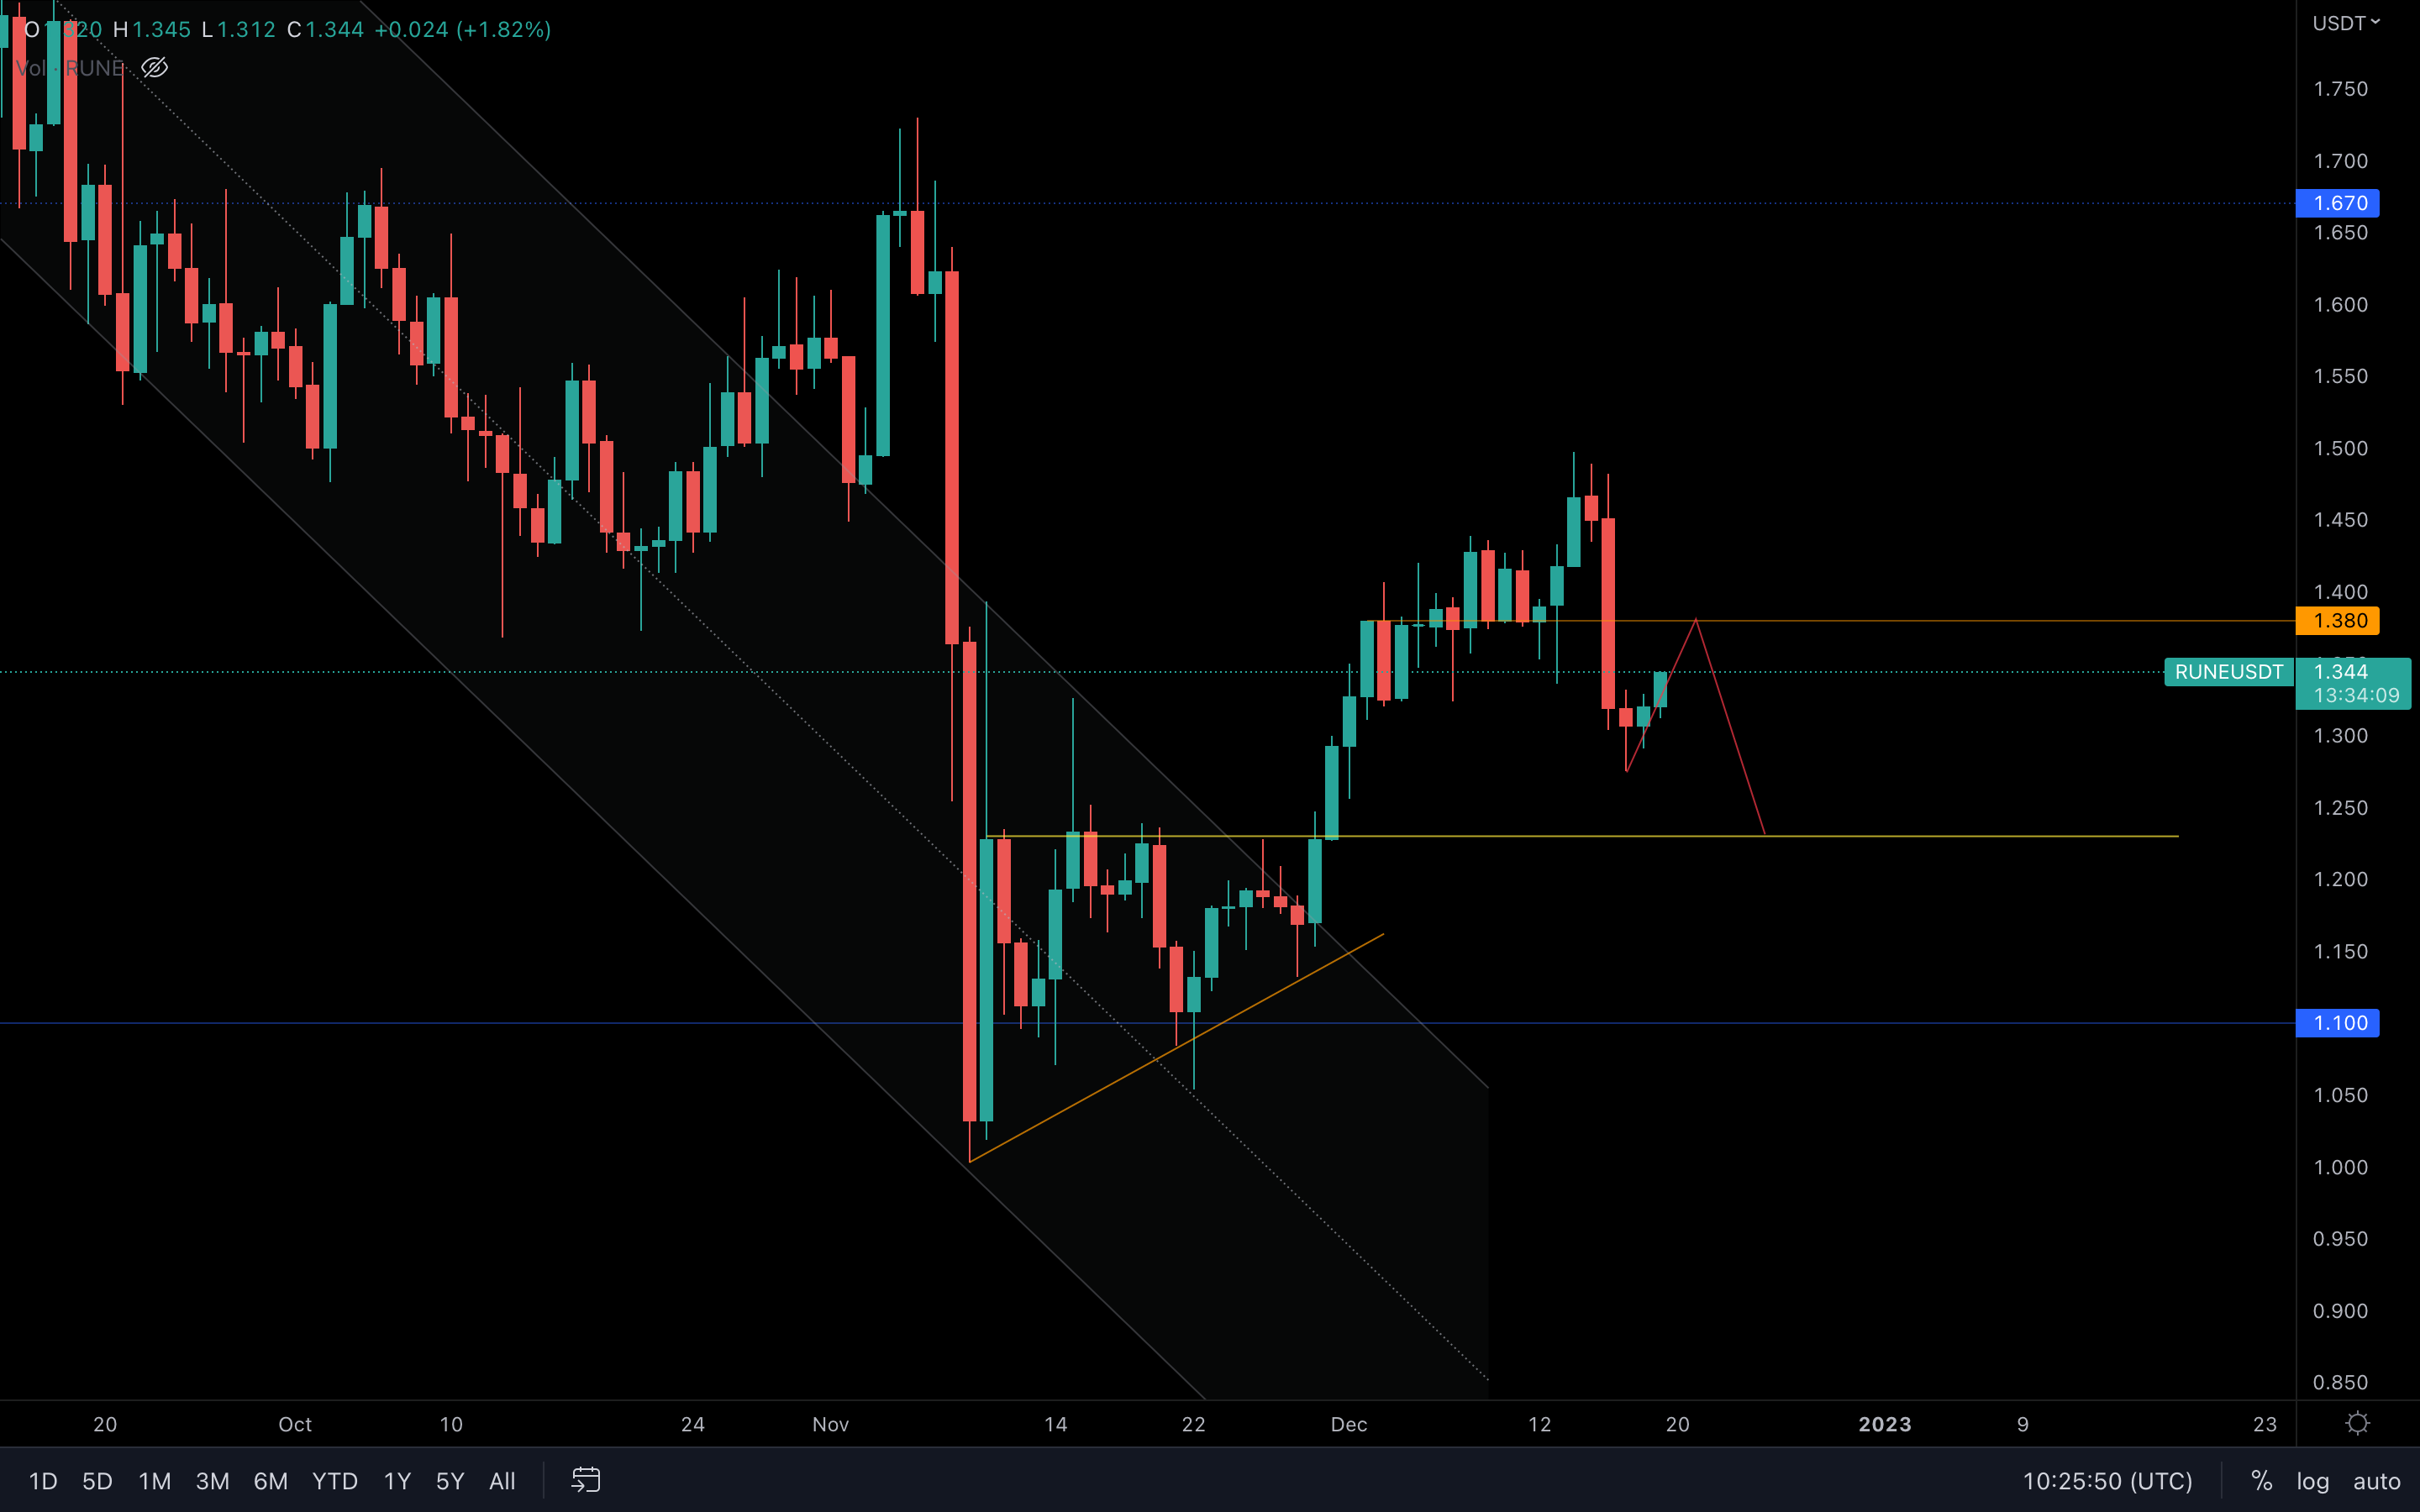
(Daily chart was used) After the loss of $1.38, RUNE is now aiming for a retest which will likely get rejected and push its price toward $1.25 - $1.23.
SNX | Synthetix
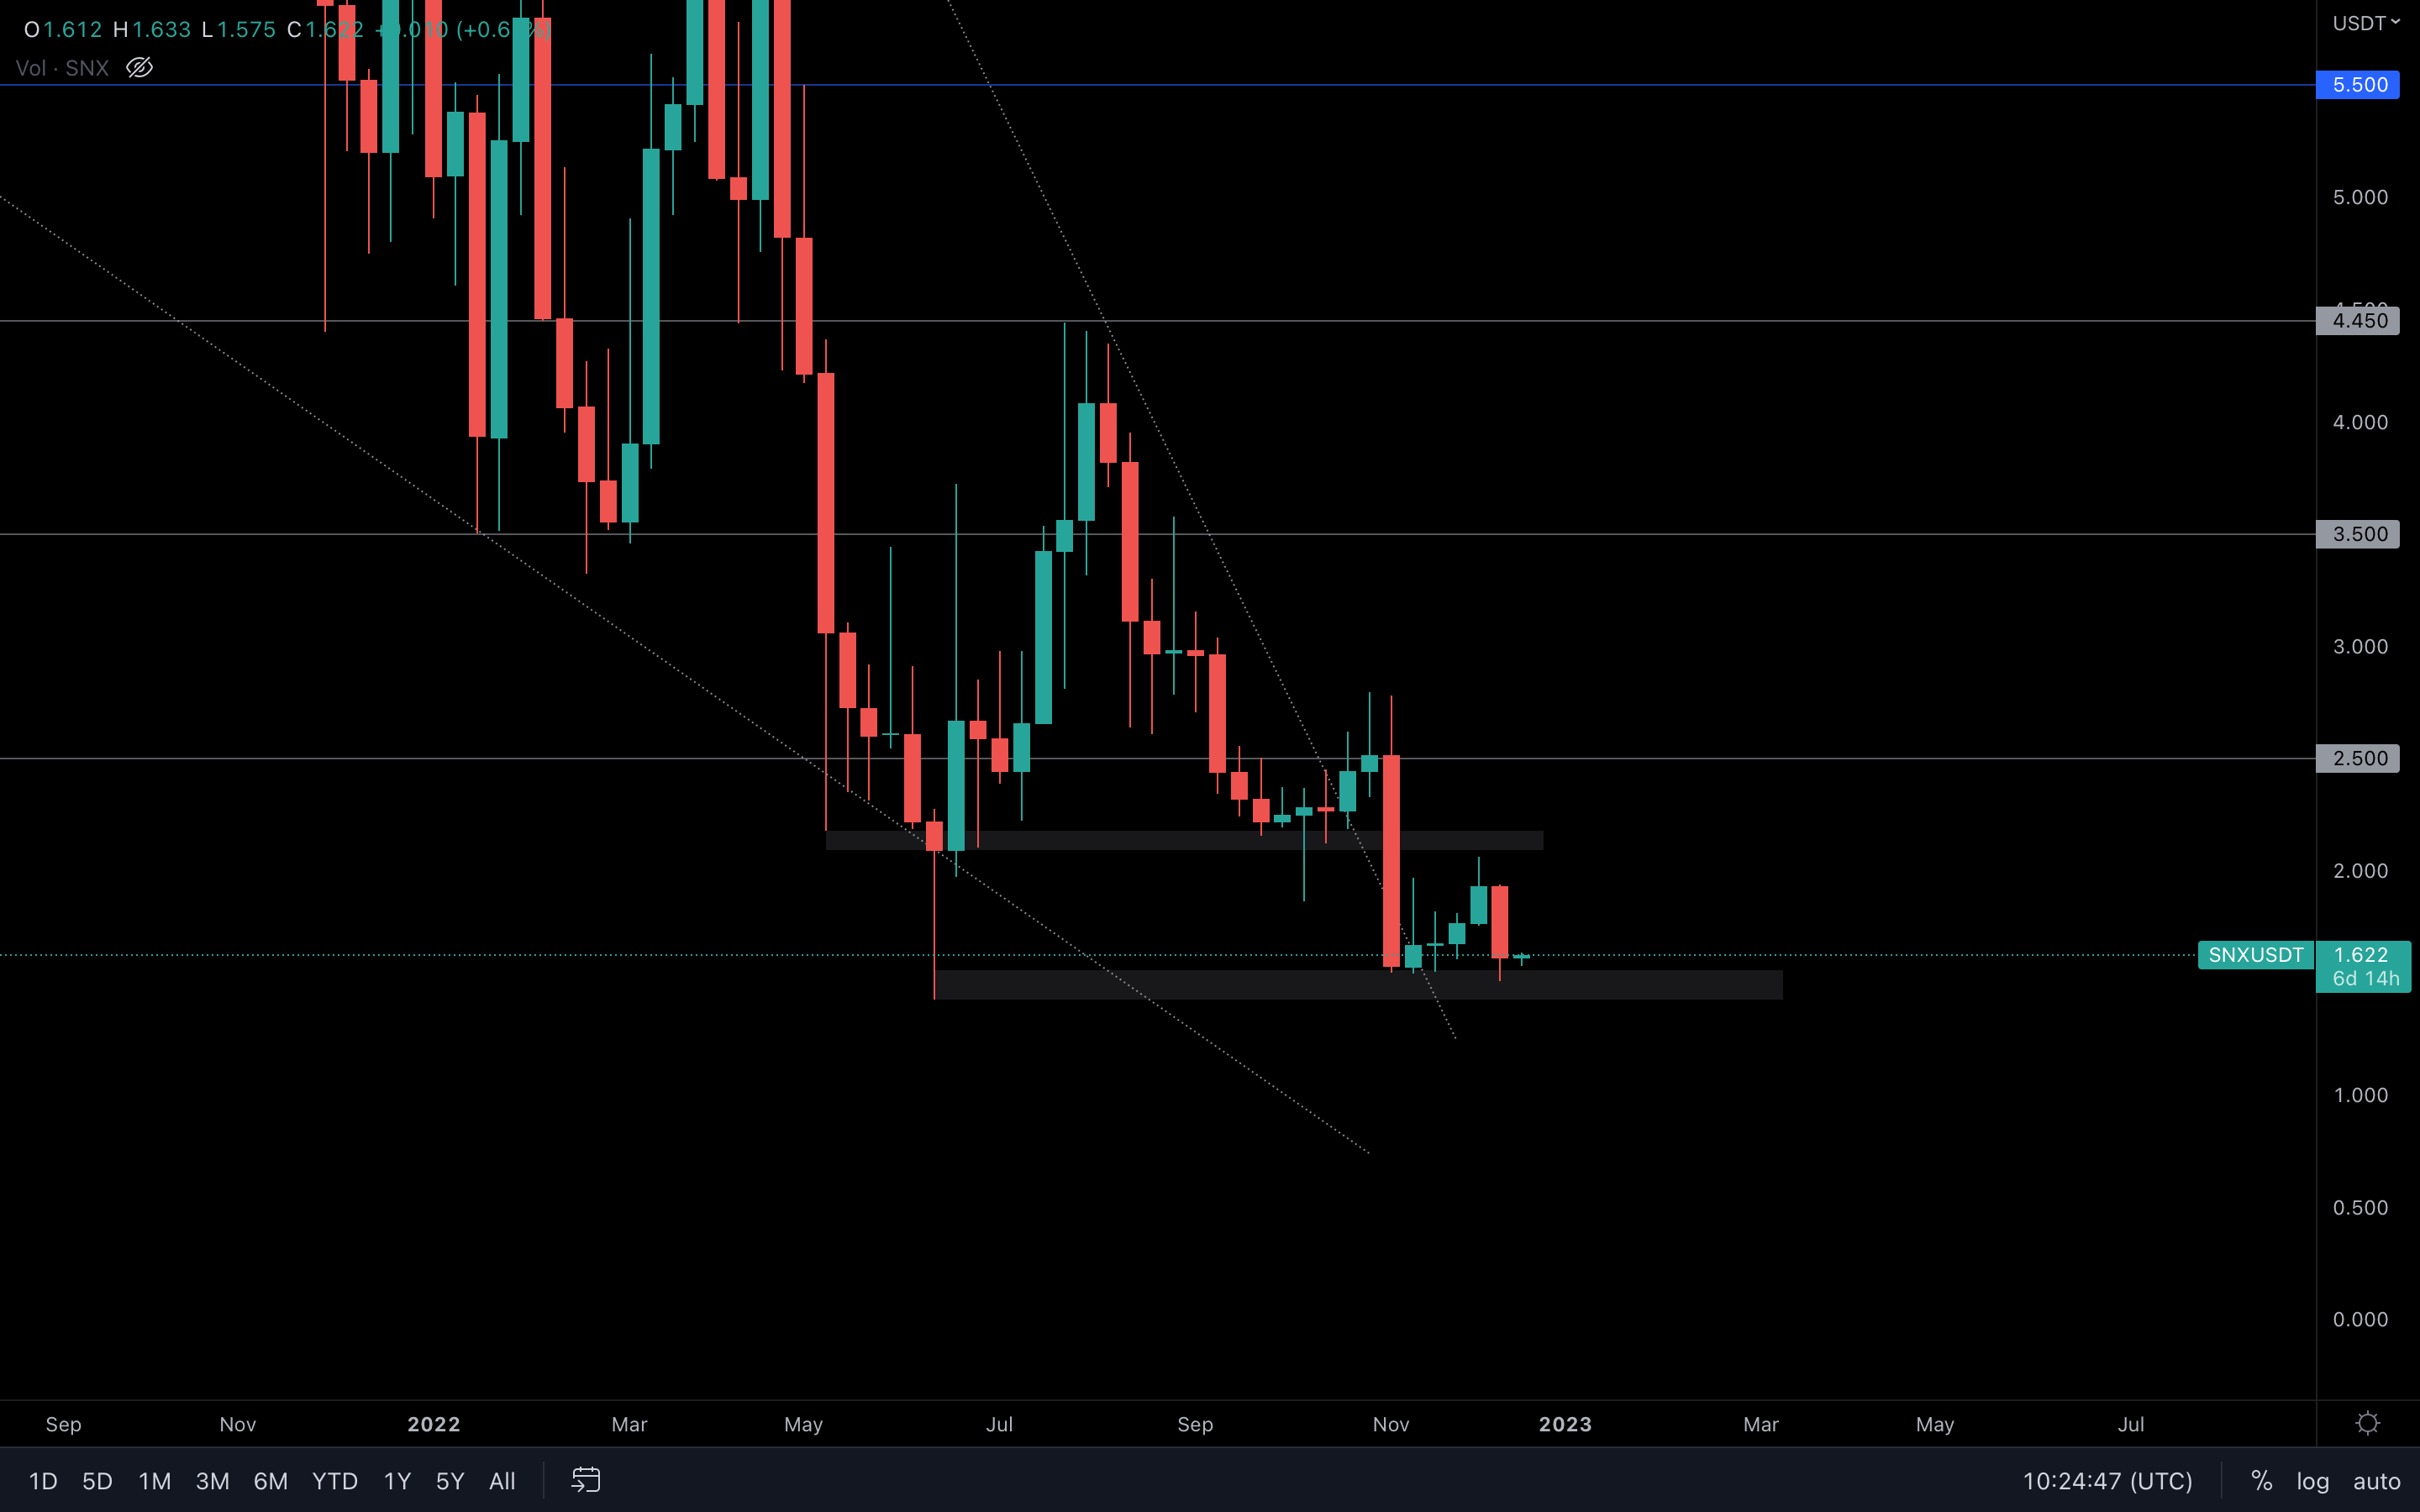 Bearish engulfing candle registered last week, right into support - indecision 101. When a bearish candle closes into support, the selling pressure is canceled out by the possibility of buyers stepping in. Because this has been an essential level throughout Q2 - Q4, we cannot assume the asset will lose this support until it happens. A short-term relief might be on the cards.
Alpha-DAO & Cryptonary Watchlist
DOT | Polkadot
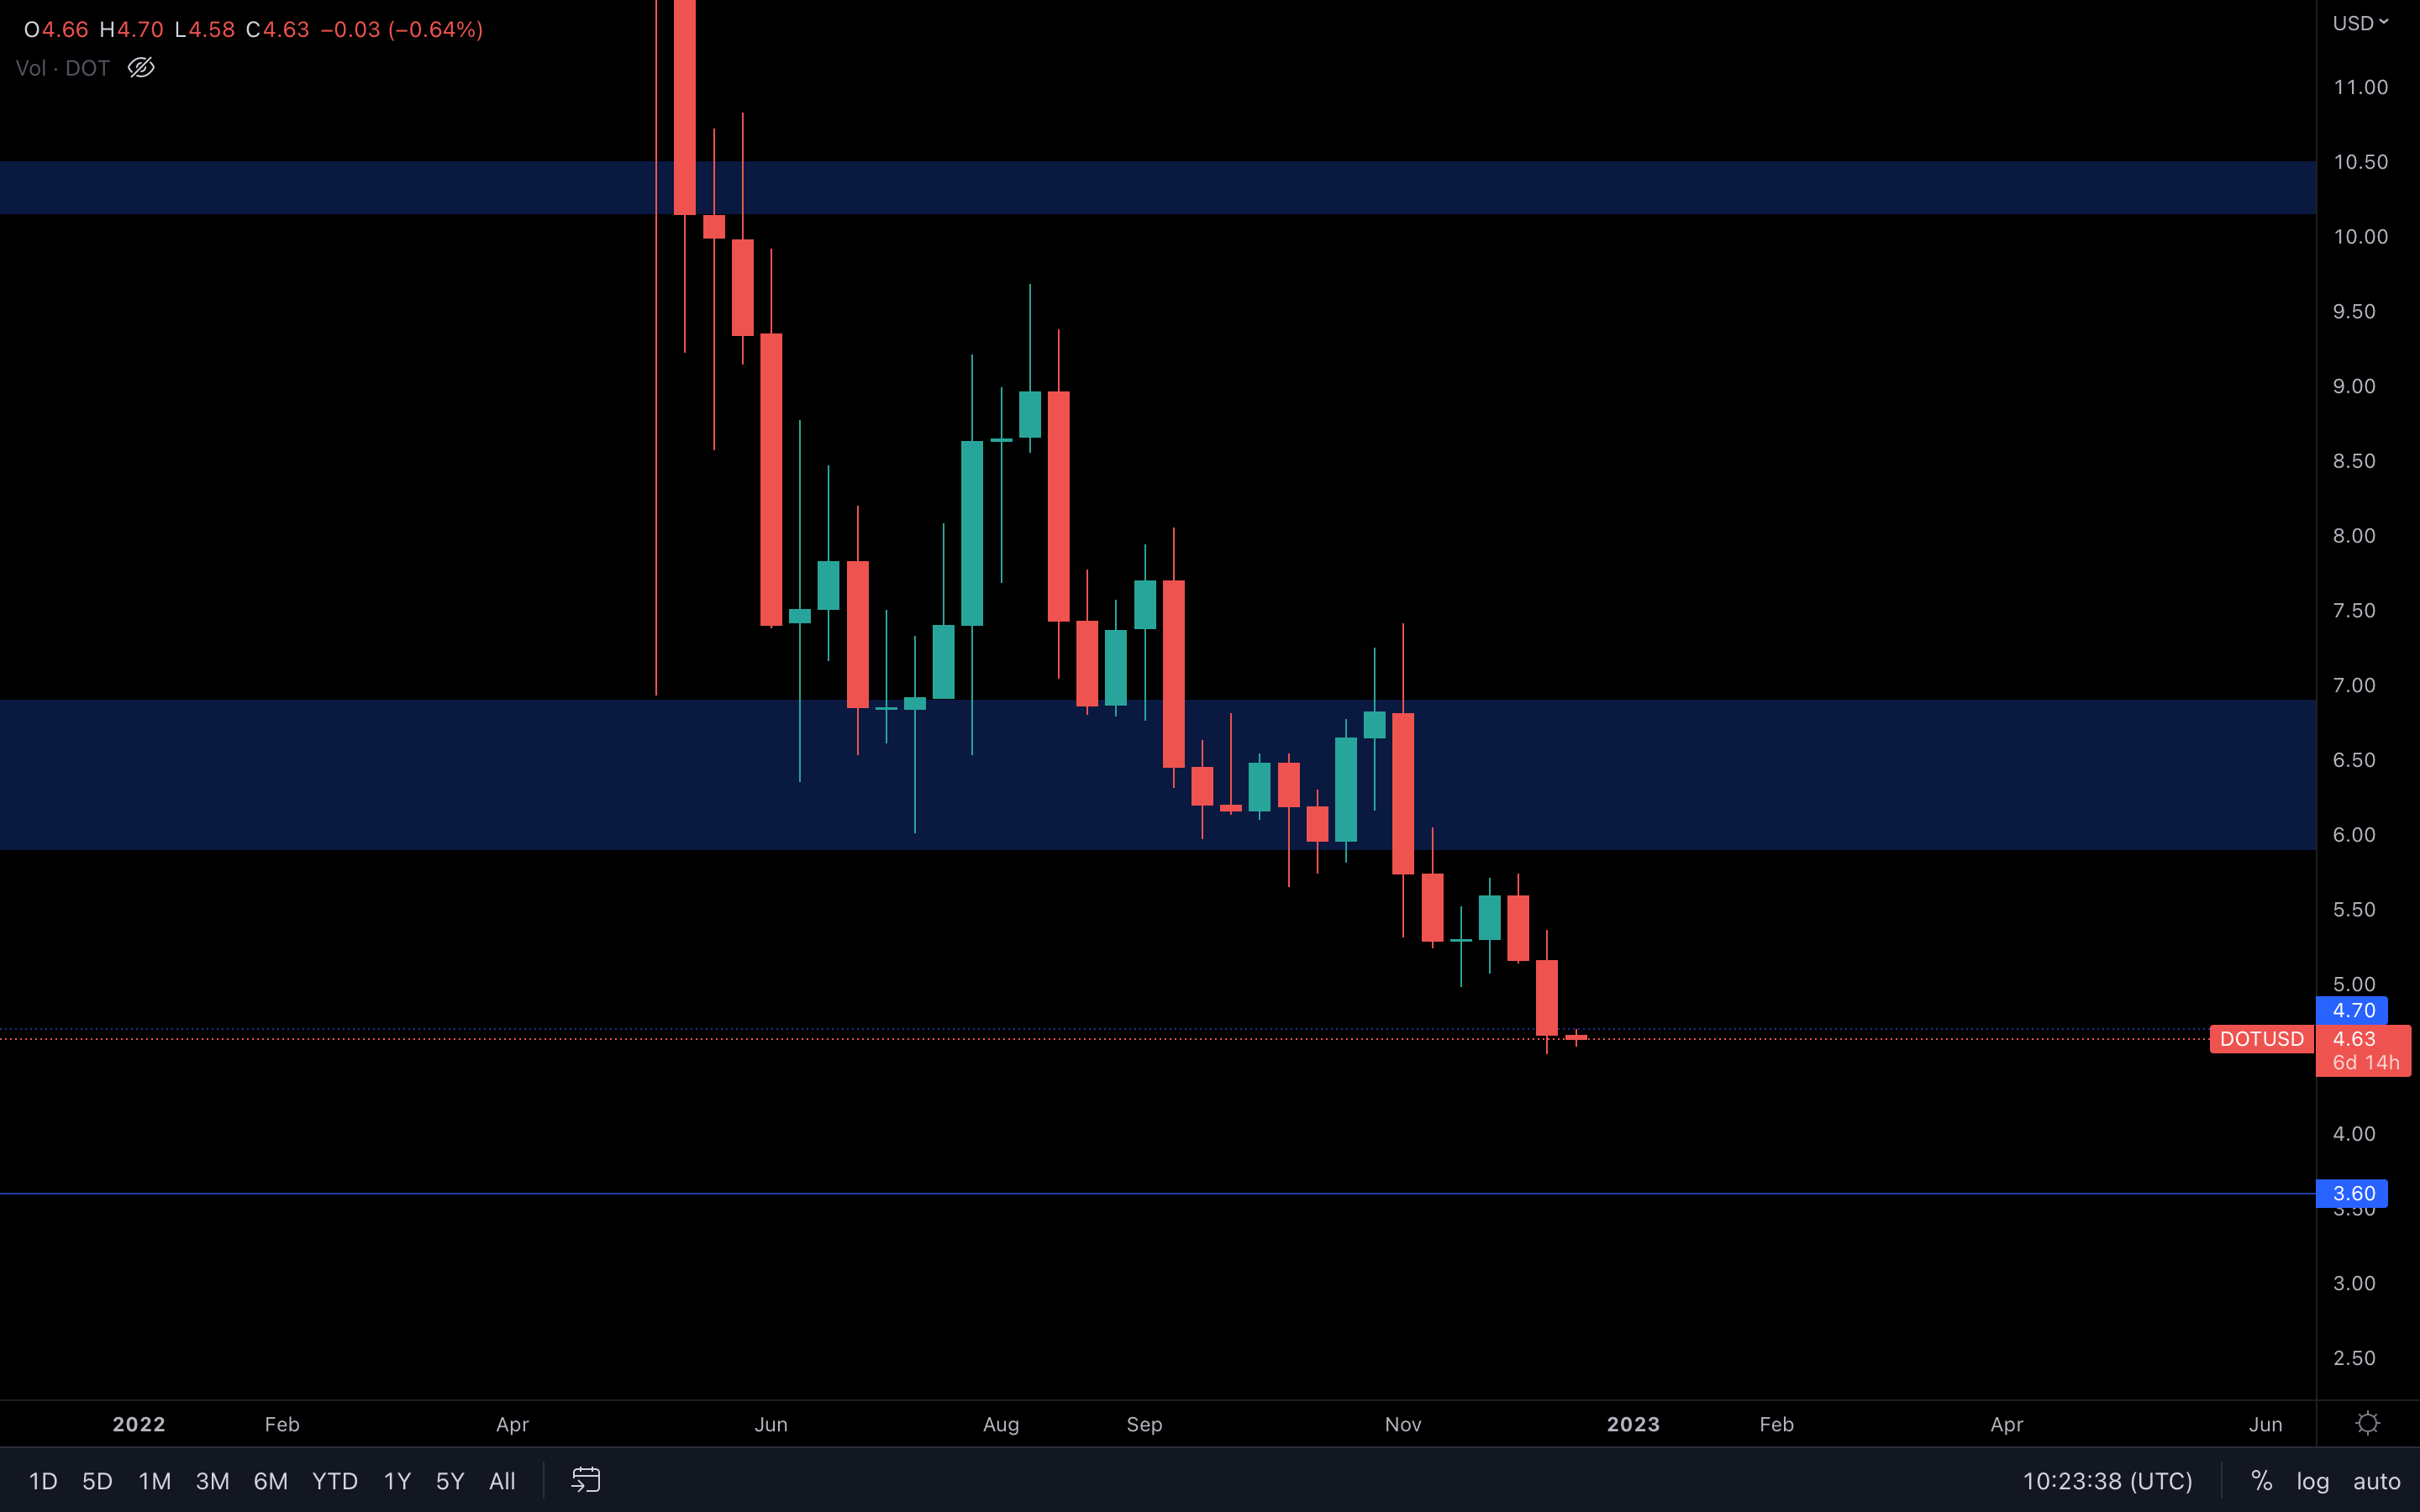
Slight weekly closure under the $4.70, which could be reclaimed this week. We need to see a stronger loss of this level to put $3.60 on the table. DOT will continue to follow the majors' price action, so it's best to track those at all times.
SYN | Synapse
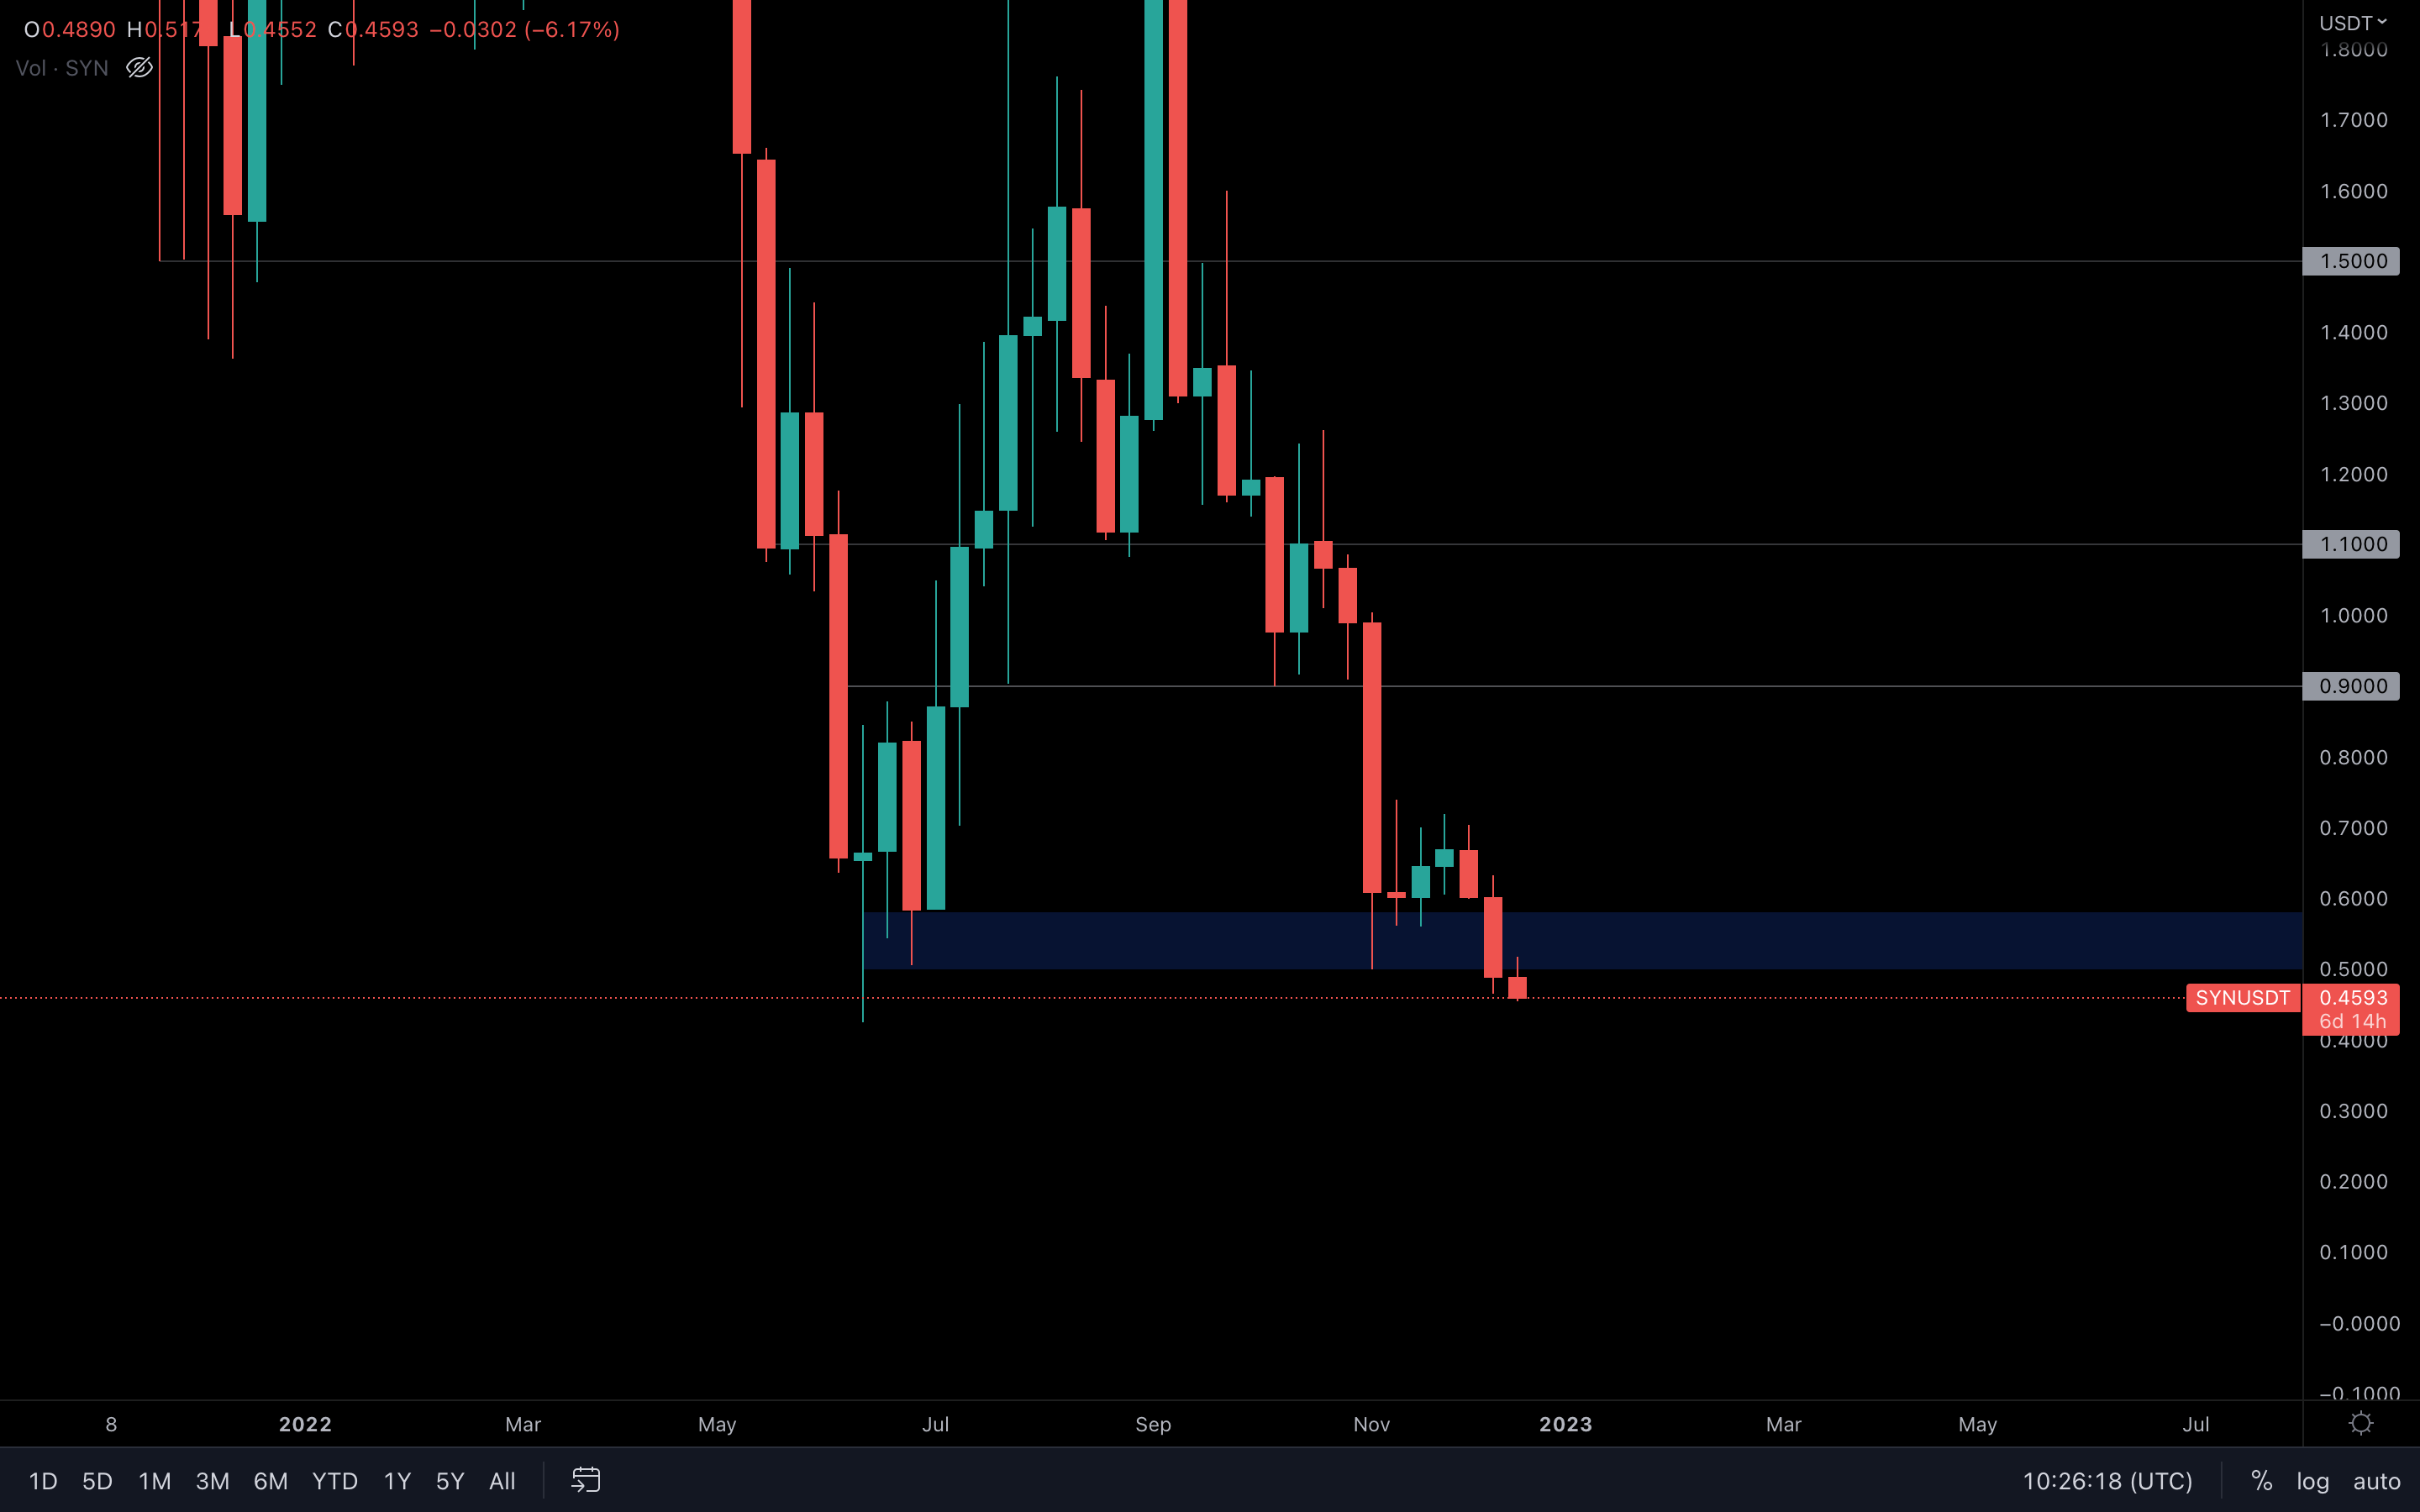
SYN has registered its lowest weekly closure - ever. This is an obvious sign of weakness and reinforces the possibility of heading into downside price discovery. Reclaiming $0.50 is necessary to invalidate this scenario.
OP | Optimism
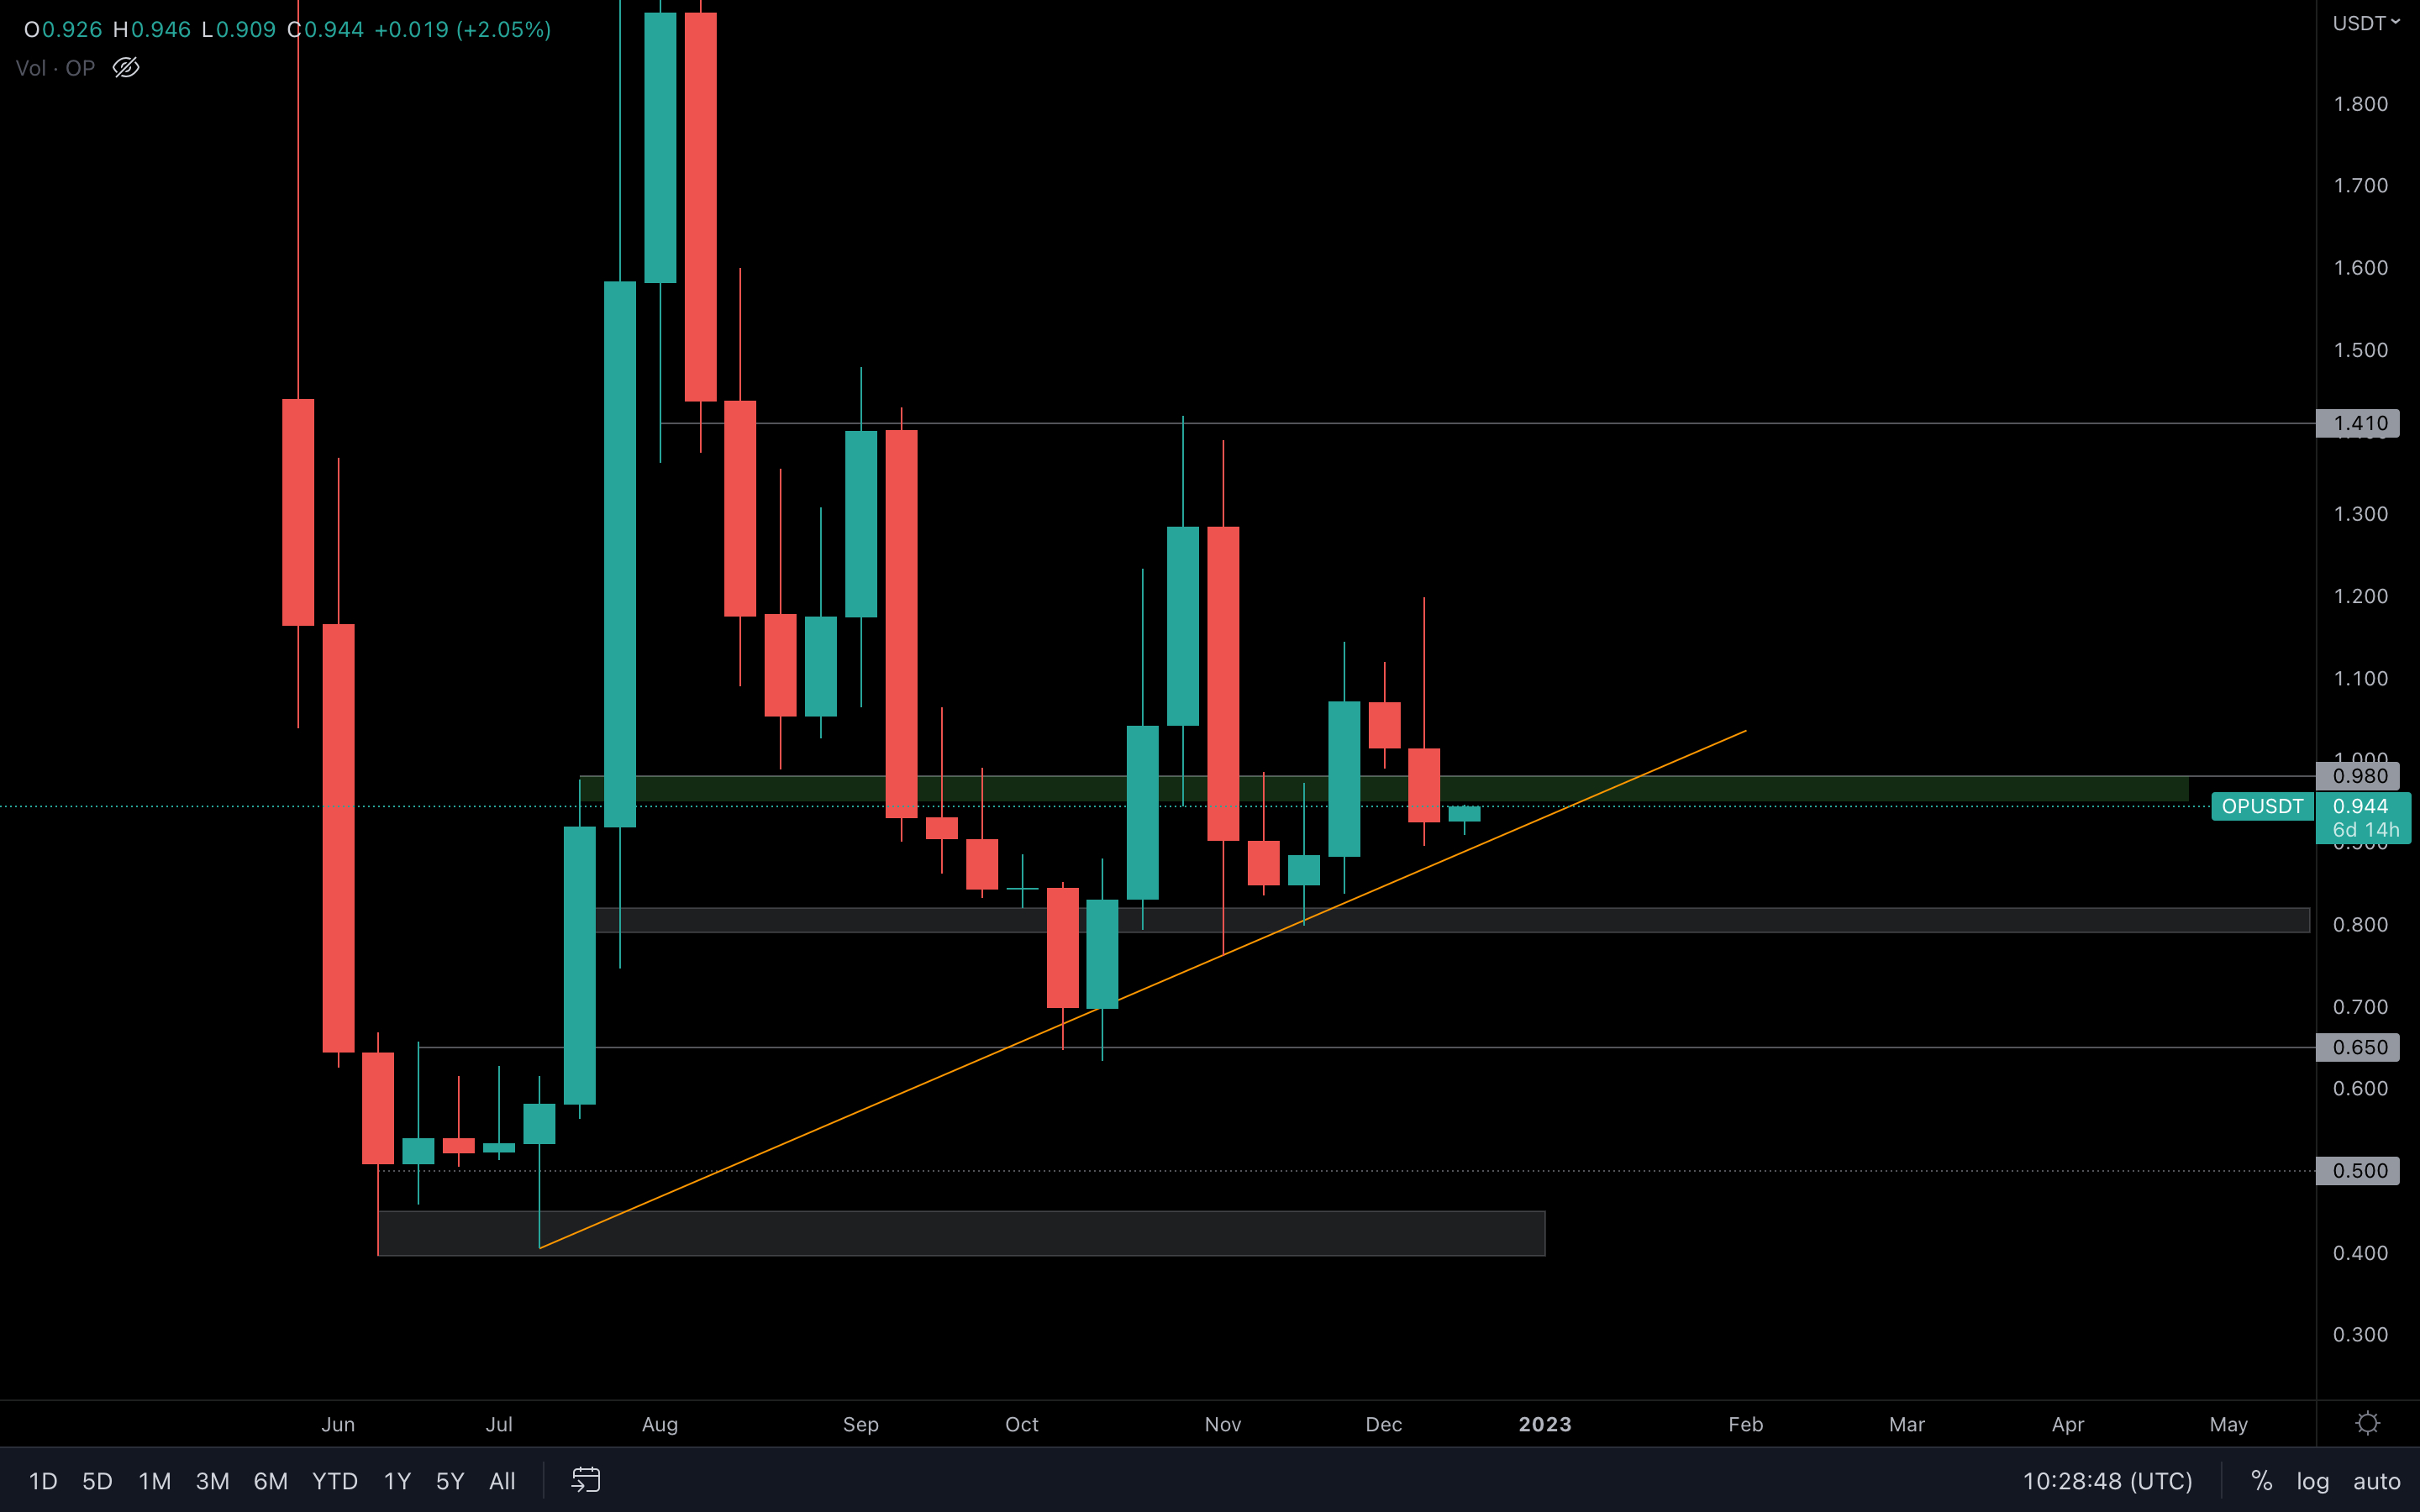
OP is sitting above this diagonal support trend line which has been precise in the past. The asset is also under the $0.98 - $0.95 resistance area, so we need more data to pick a direction. For now, we could first see a proper retest of the orange trend line before taking a swing at higher prices.
LDO | Lido DAO
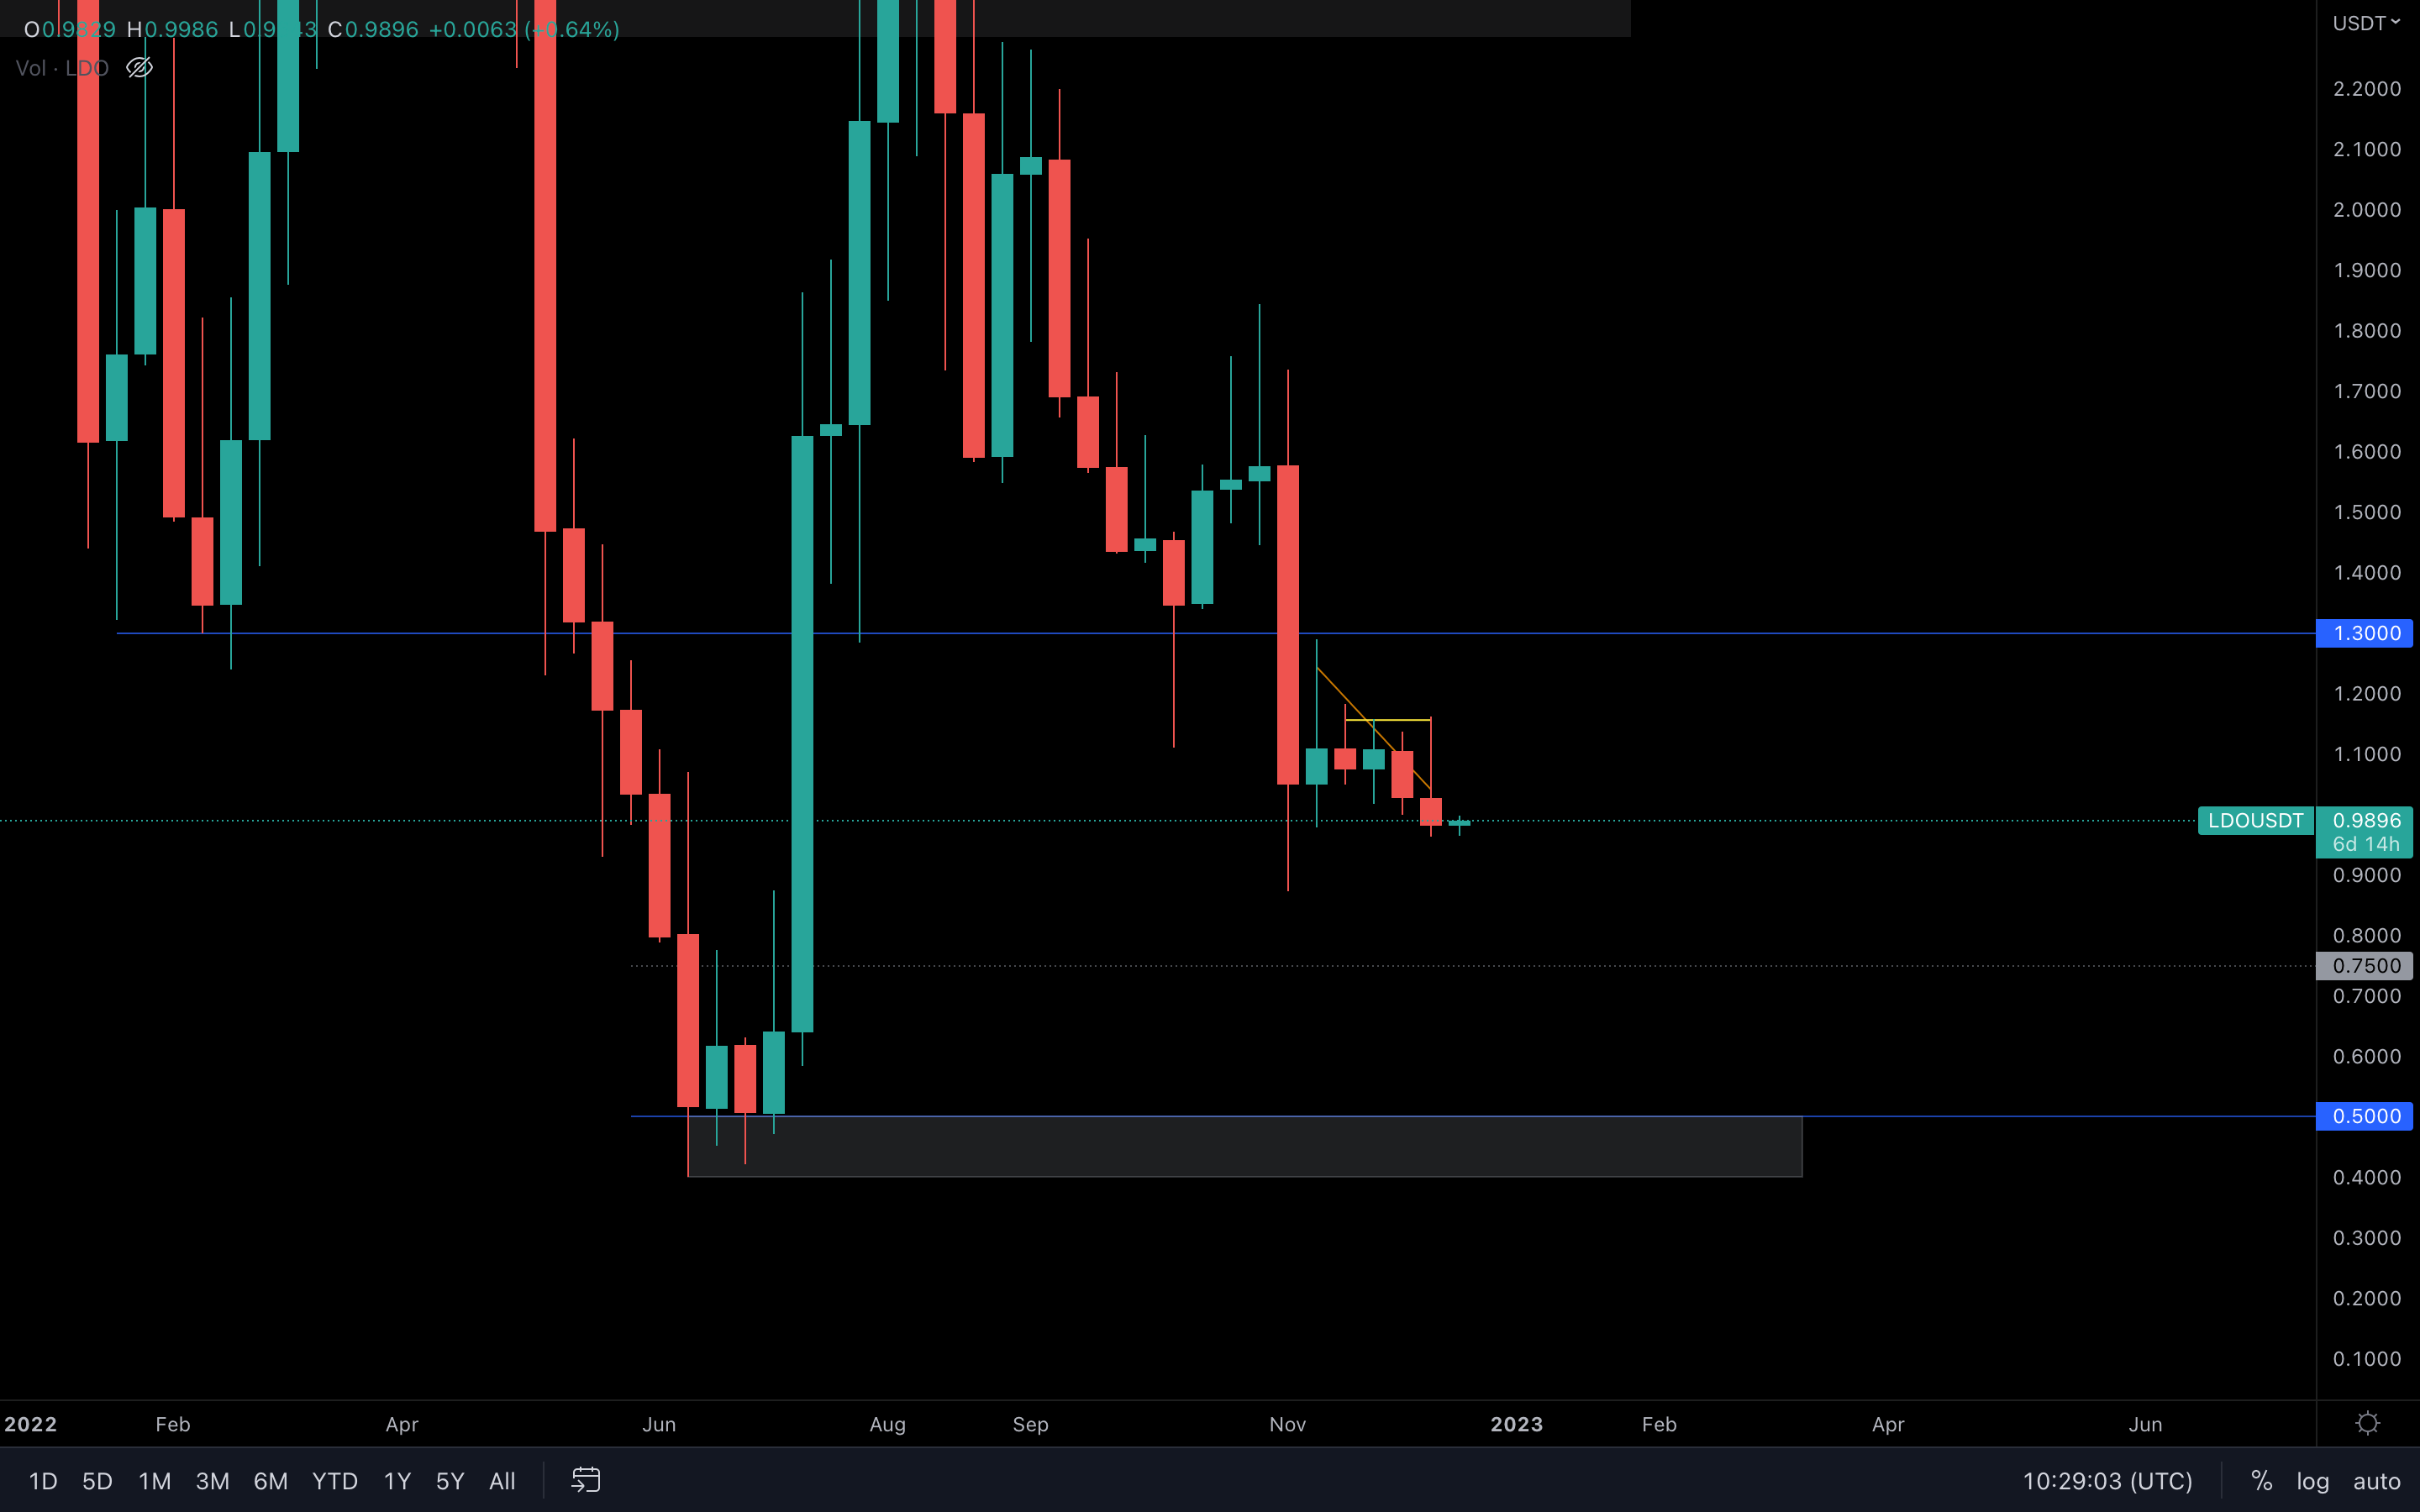 Bearish market structure, with continuous lower lows. The asset has lost $1 on the daily timeframe, so unless we see a reclaim of this level, LDO could be heading toward $0.75.
THOR | THORSwap
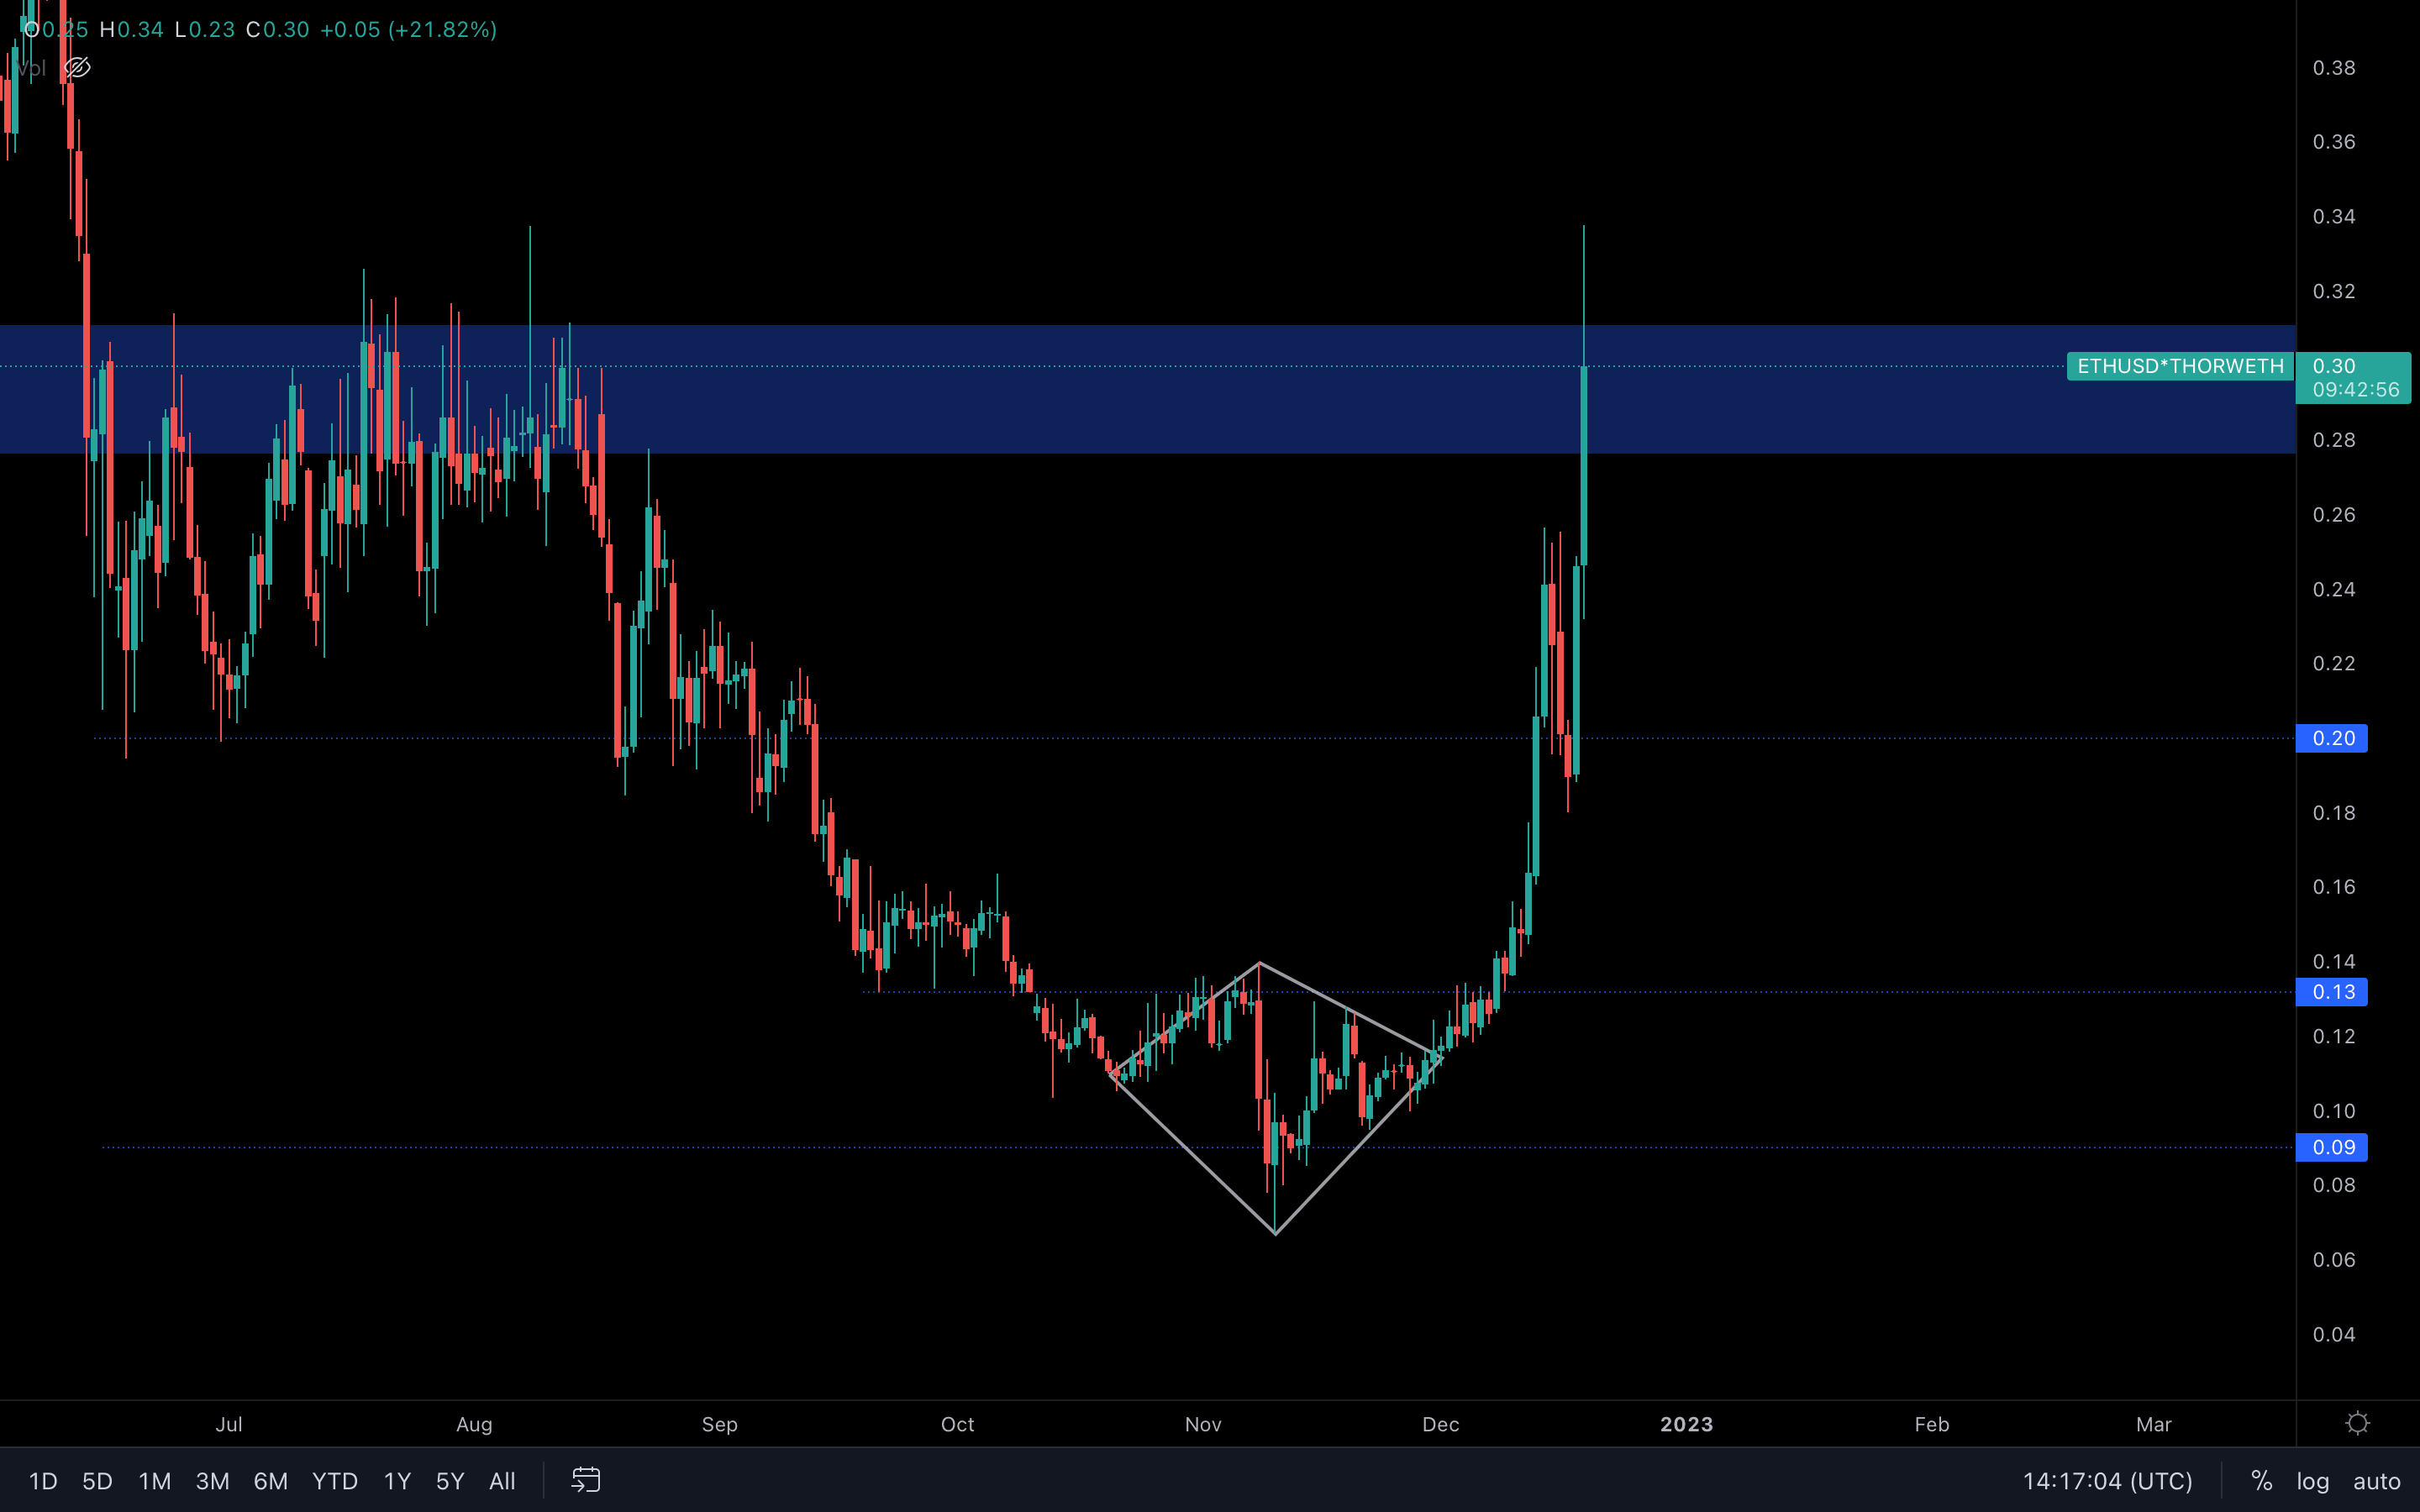
(Daily chart was used) THOR managed to hold $0.20 on the weekly timeframe and, as a result, exploded toward $0.31. Although THOR's buying pressure could break through this resistance, we need a weekly closure above $0.31 for proper confirmation. For now, the risk of rejection has increased as we've already seen THOR rise significantly in the past few weeks - it's a bullish chart, but the buying pressure cannot continue forever.
MINA | Mina Protocol
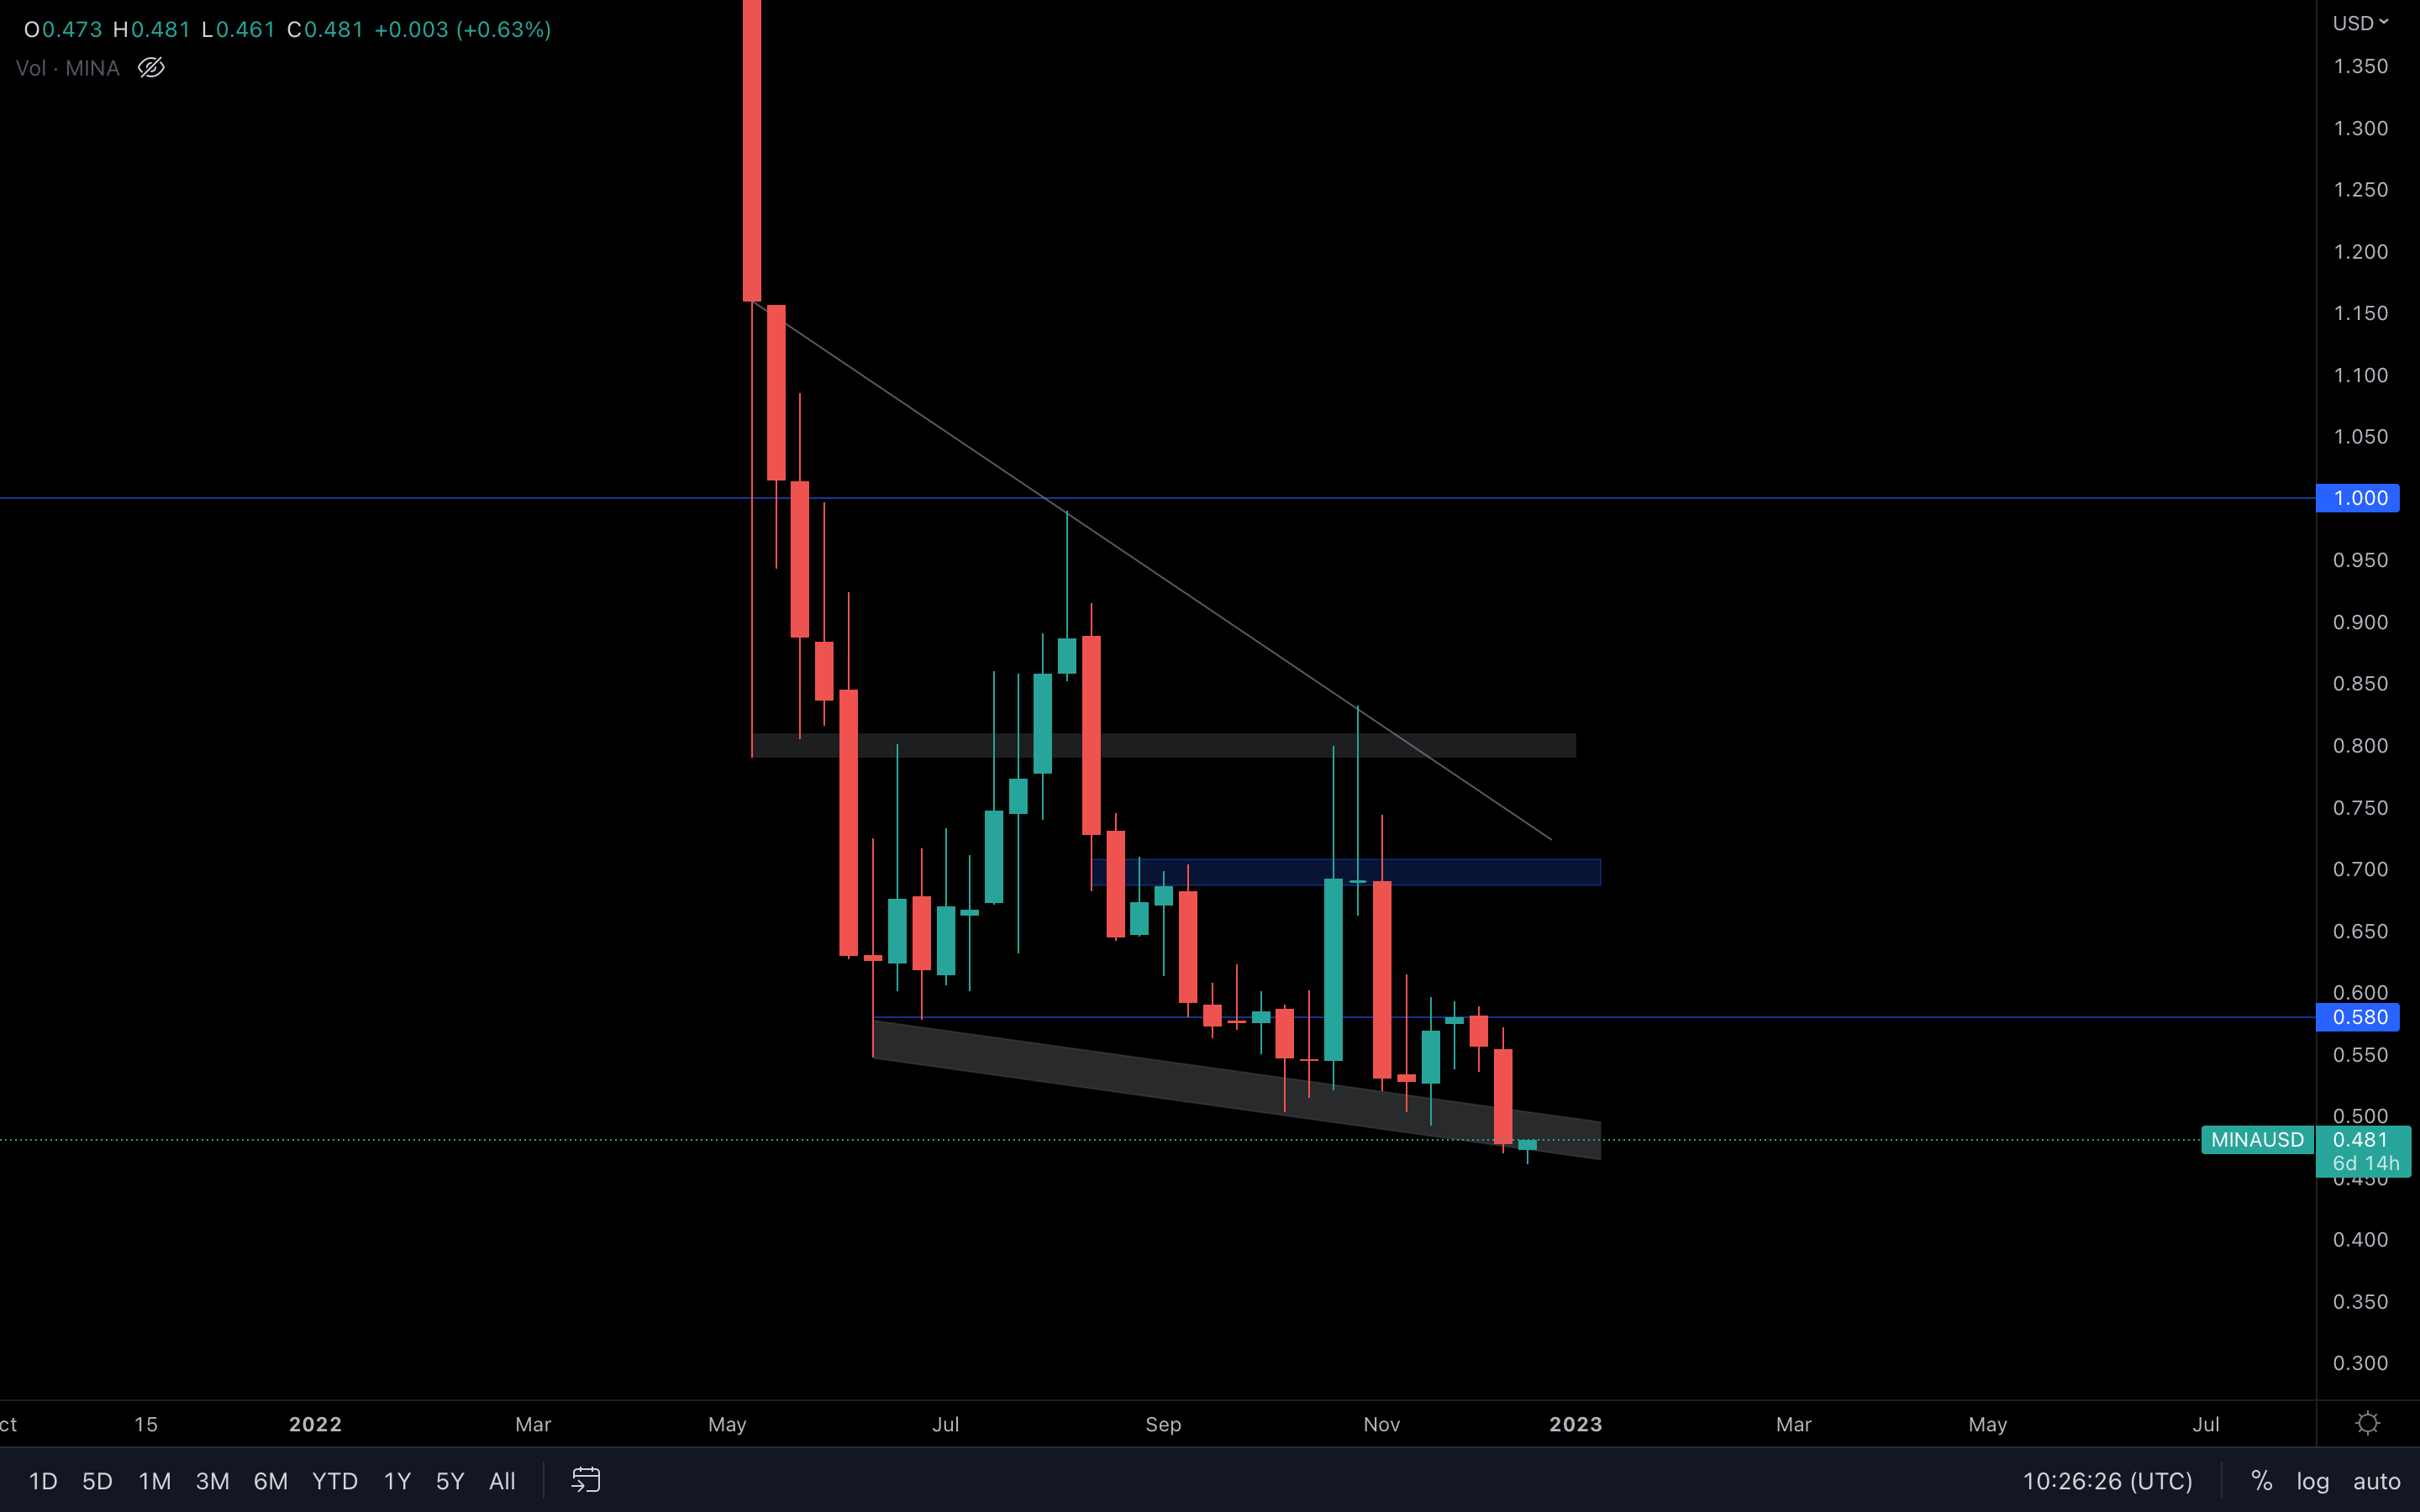
Even with an all-time low, MINA is still trading above this support channel. Some buying pressure could be coming in in the short term. But, the chart remains bearish and doesn't present any exciting opportunities.
DYDX | dYdX
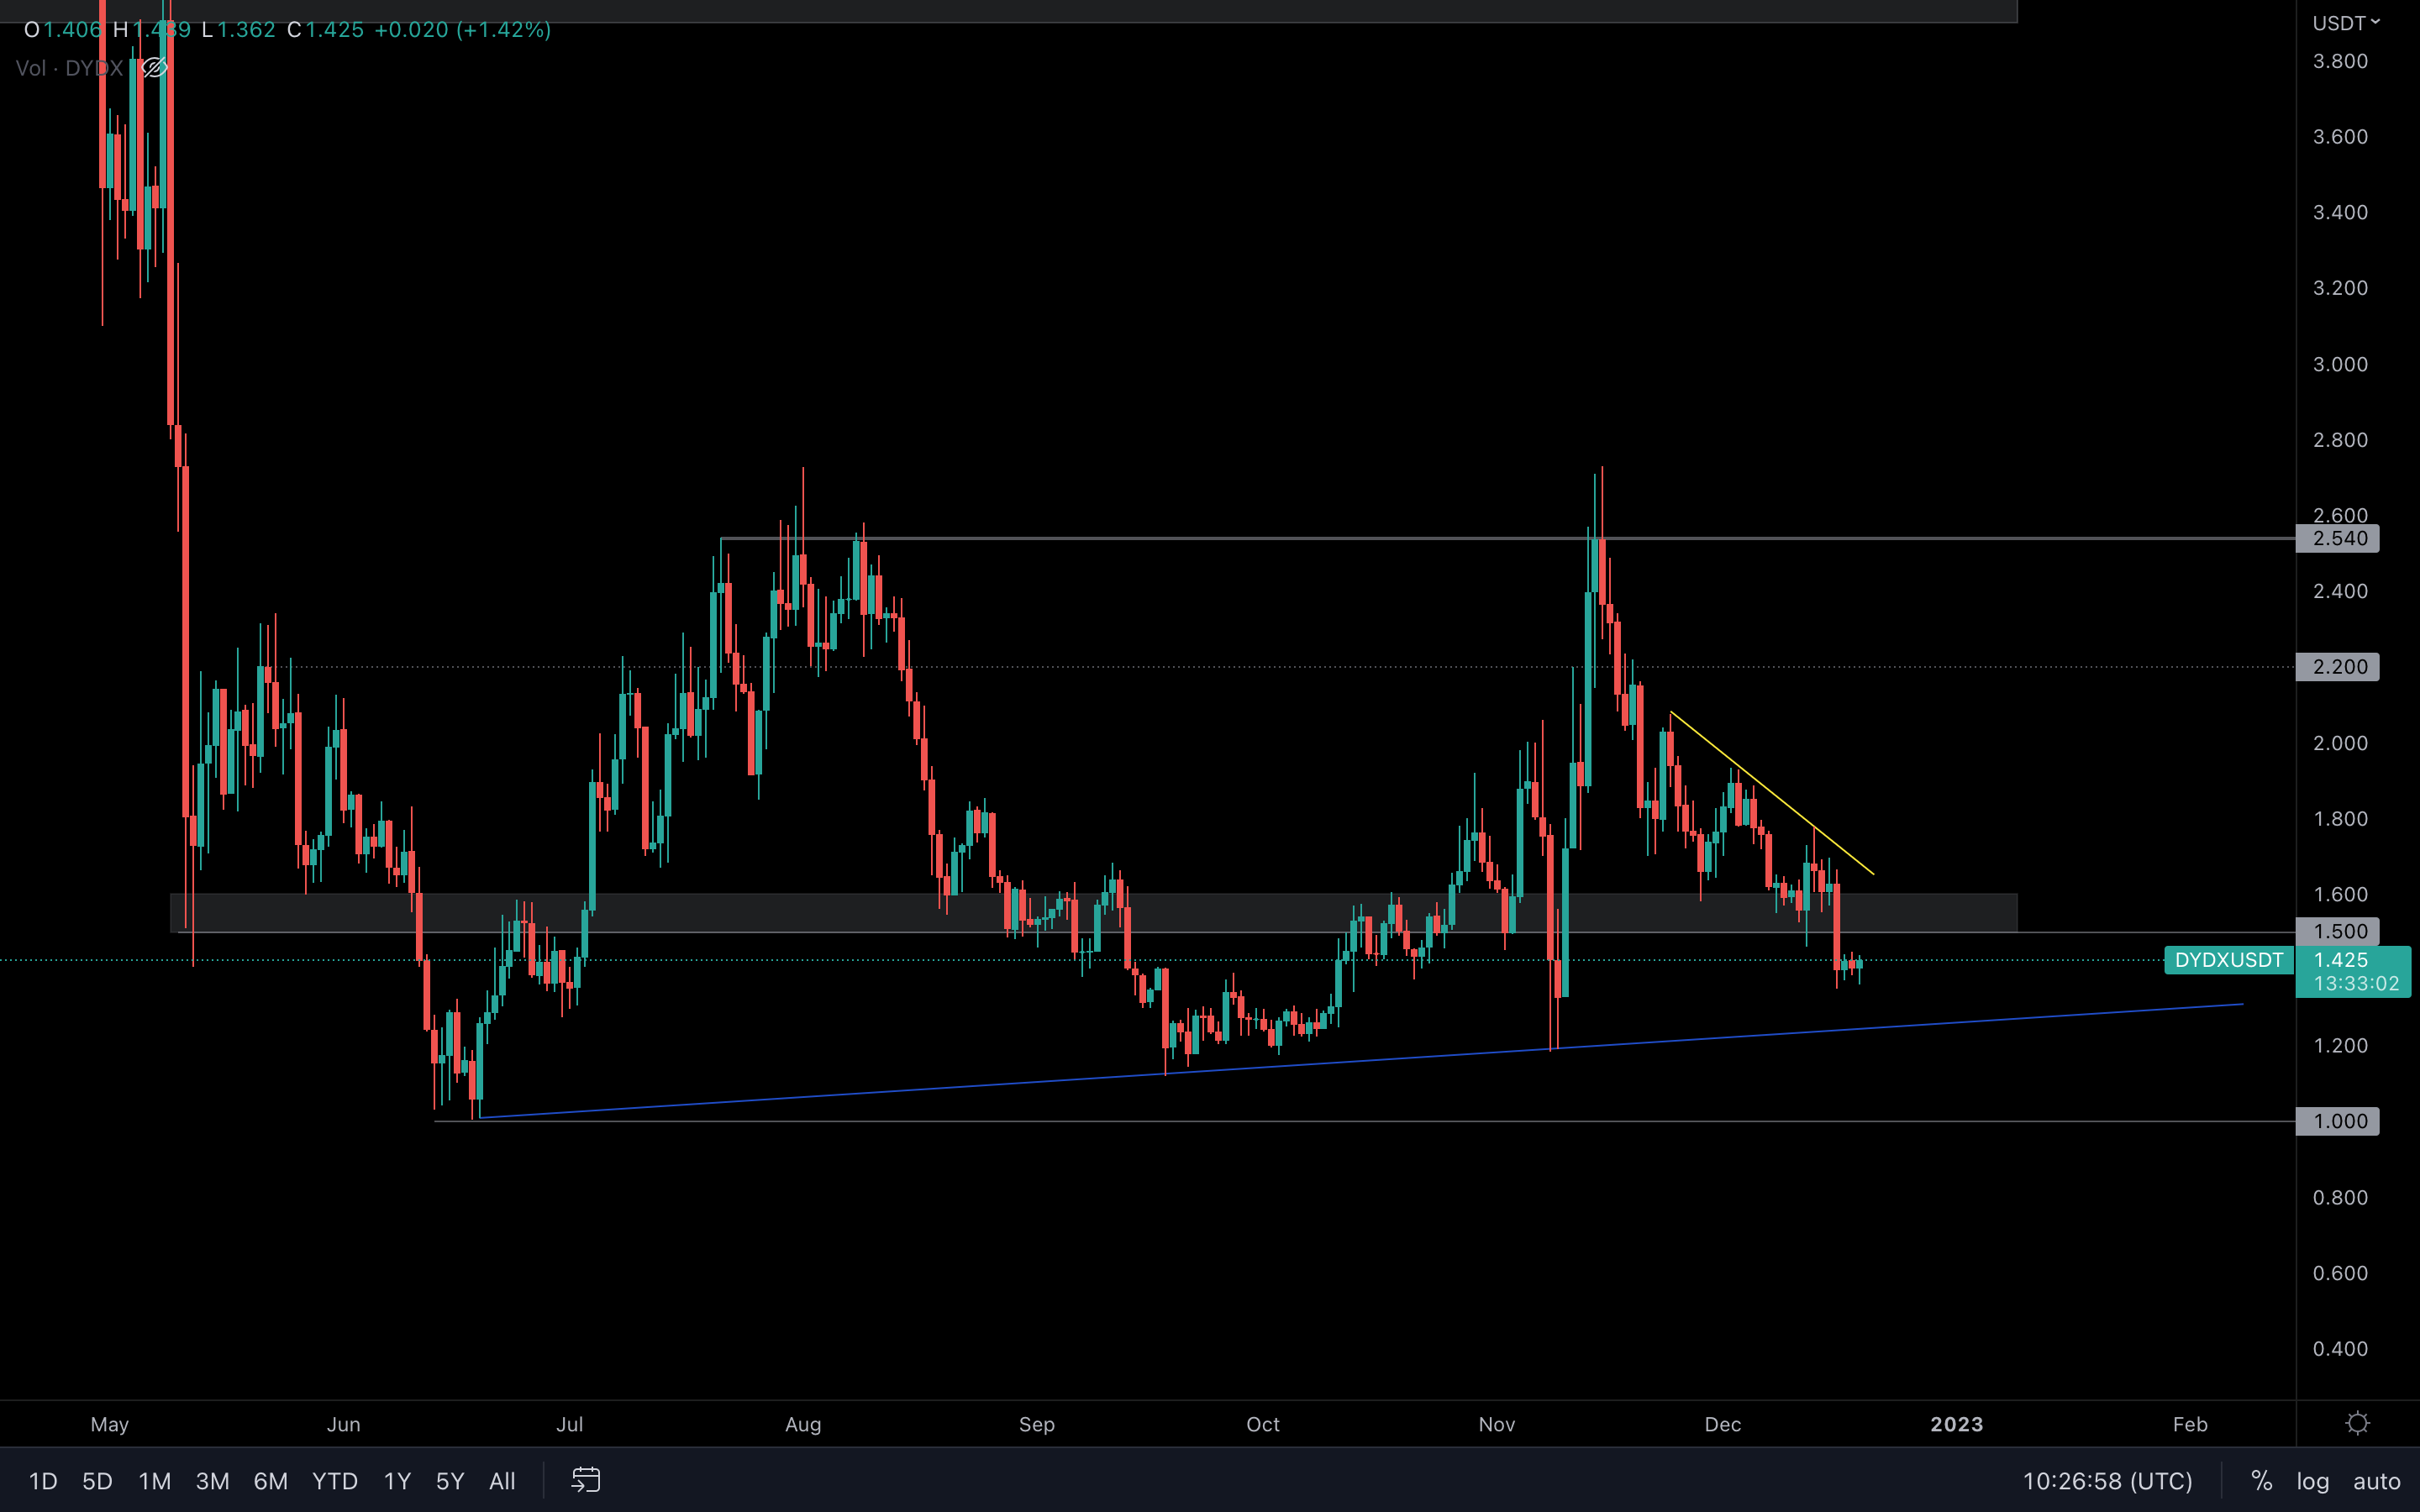
(Daily chart was used) A retest of the blue diagonal trend line is still on the cards unless dYdX reclaims $1.50. As for the larger timeframe, dYdX will continue to trade in the $2.50 - $1 range until either of these levels are broken. The only thing we can do here is to spot opportunities as they emerge and take advantage of the volatility.
Summary
The Crypto Market remains in "limbo land". From our perspective, we remain of the opinion that the market has either bottomed or is very near bottoming. The macro provides some significant headwinds, although Bitcoin is in fair value territory. The macro headwinds will lighten moving into 2023.
A Dollar-Cost-Averaging approach would be wise, although a flush lower may still be possible.
Recommended from Cryptonary


