Save 23% ($351) & Get a Free 1-1 Call with our Team ⏰ : 0d 2h 59m 43s
Did ??? just do this...? | Jan 23
Q1 and potentially Q2 of 2023 will bring significant returns across the market. In these times, it’s critical to understand which assets will likely outperform and give you the best returns. Luckily, we’re already doing that for you.
Disclaimer: Not financial or investment advice. You are responsible for any capital-related decisions you make, and only you are accountable for the results.
TLDR
- The Total Market Cap has reached $1T, an important level for the entire market. Keep reading to find out what’s next.
- A breakout is confirmed for SNX. Higher prices will follow.
- ASTR is close to breaking a 7-month-old accumulation area.
Total Market Cap
The Total Market Cap index represents the entire valuation of the cryptocurrency market. We track this index to understand where the market is now and where it will be going.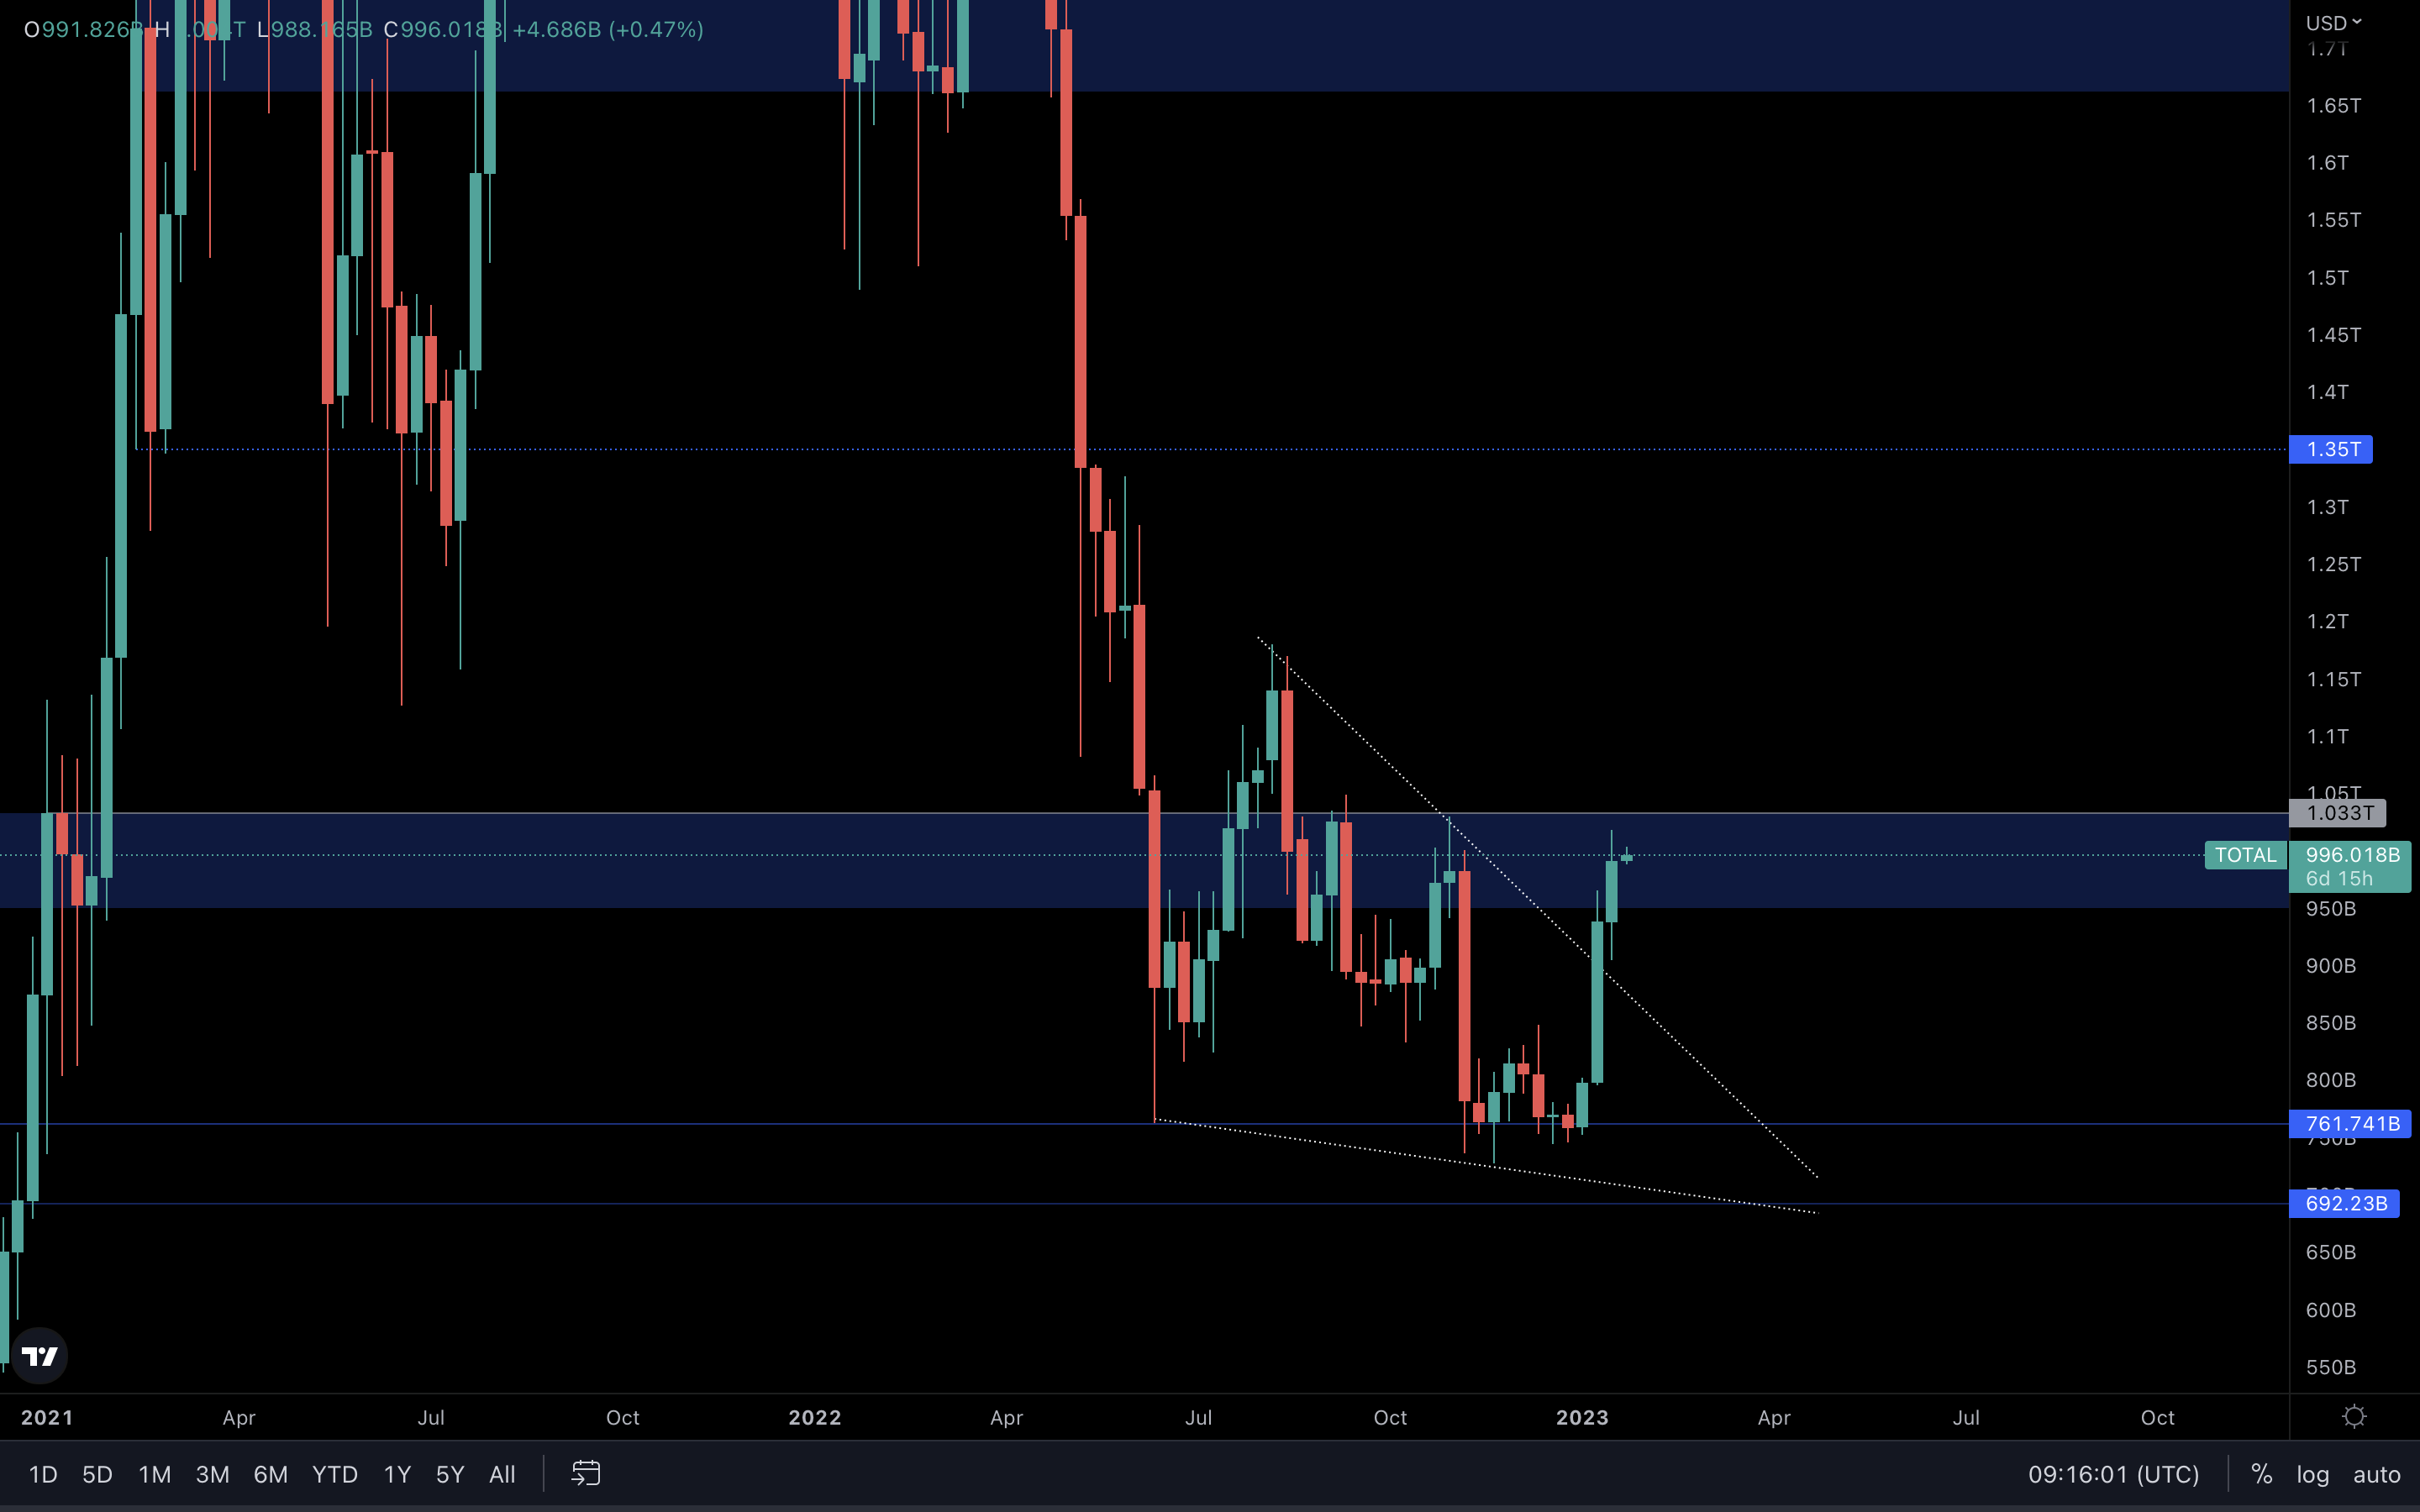
The Total Market Cap has reached the psychological level of $1T. The reason we have $1.03T as resistance on our chart is that it’s a more accurate resistance line than $1T alone.
This is a critical level on higher timeframes, not just because it’s a historically-tested level, but because it’s a psychological level. We must see the Total Market Cap reclaim $1.03T so upside can continue. Otherwise, we could see a rejection here in the short term that could affect the entire market.
Our take? We believe $1.03T will be broken at some point in Q1 or Q2, and the Total Market Cap will take a swing at $1.35T after
Altcoins Market Cap
The Altcoins Market Cap index represents the entire evaluation of the altcoins market.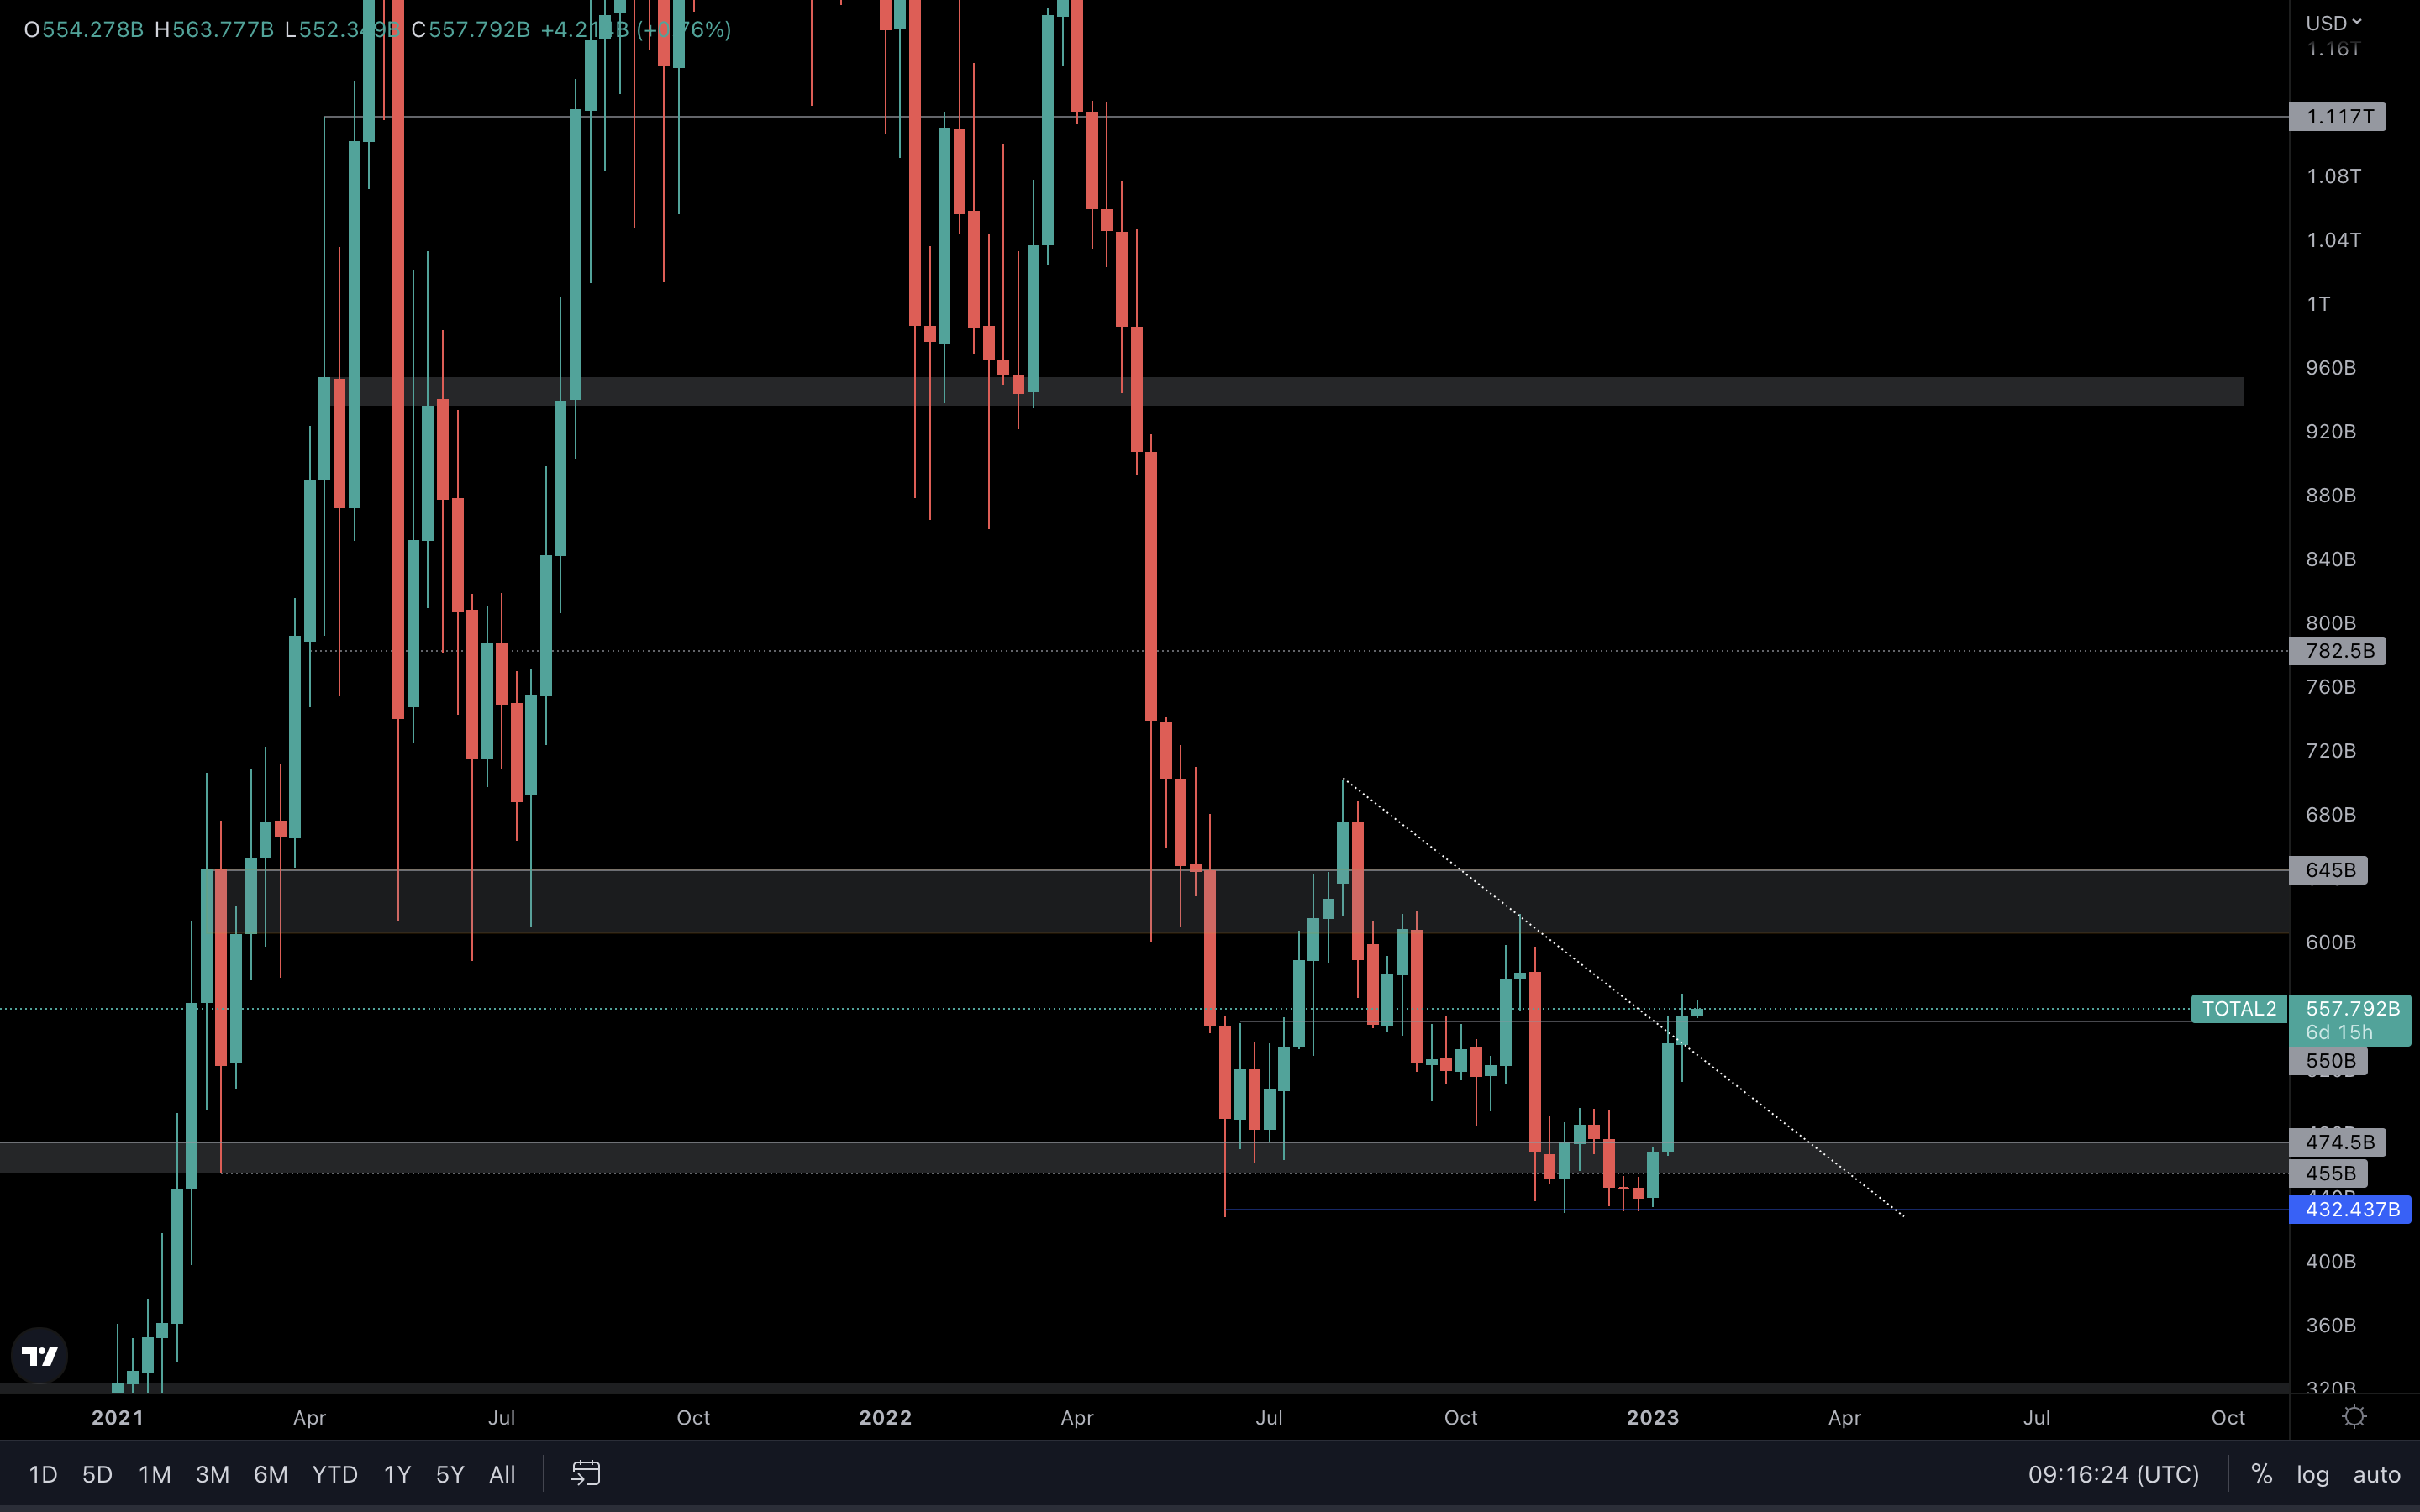
The Altcoins Market Cap index closed above $550B, reclaiming this level on the weekly timeframe. Unless we see a loss of this level, $645B is next. This will positively affect most altcoins’ price actions.
However, the Total Market Cap is at resistance. This means the indexes are in contradiction, with one being at support and the other at resistance. Of the two, the Total Market Cap index is the one that matters most, so we will be tracking that chart to understand where the Altcoins Market Cap may go.
BTC | Bitcoin
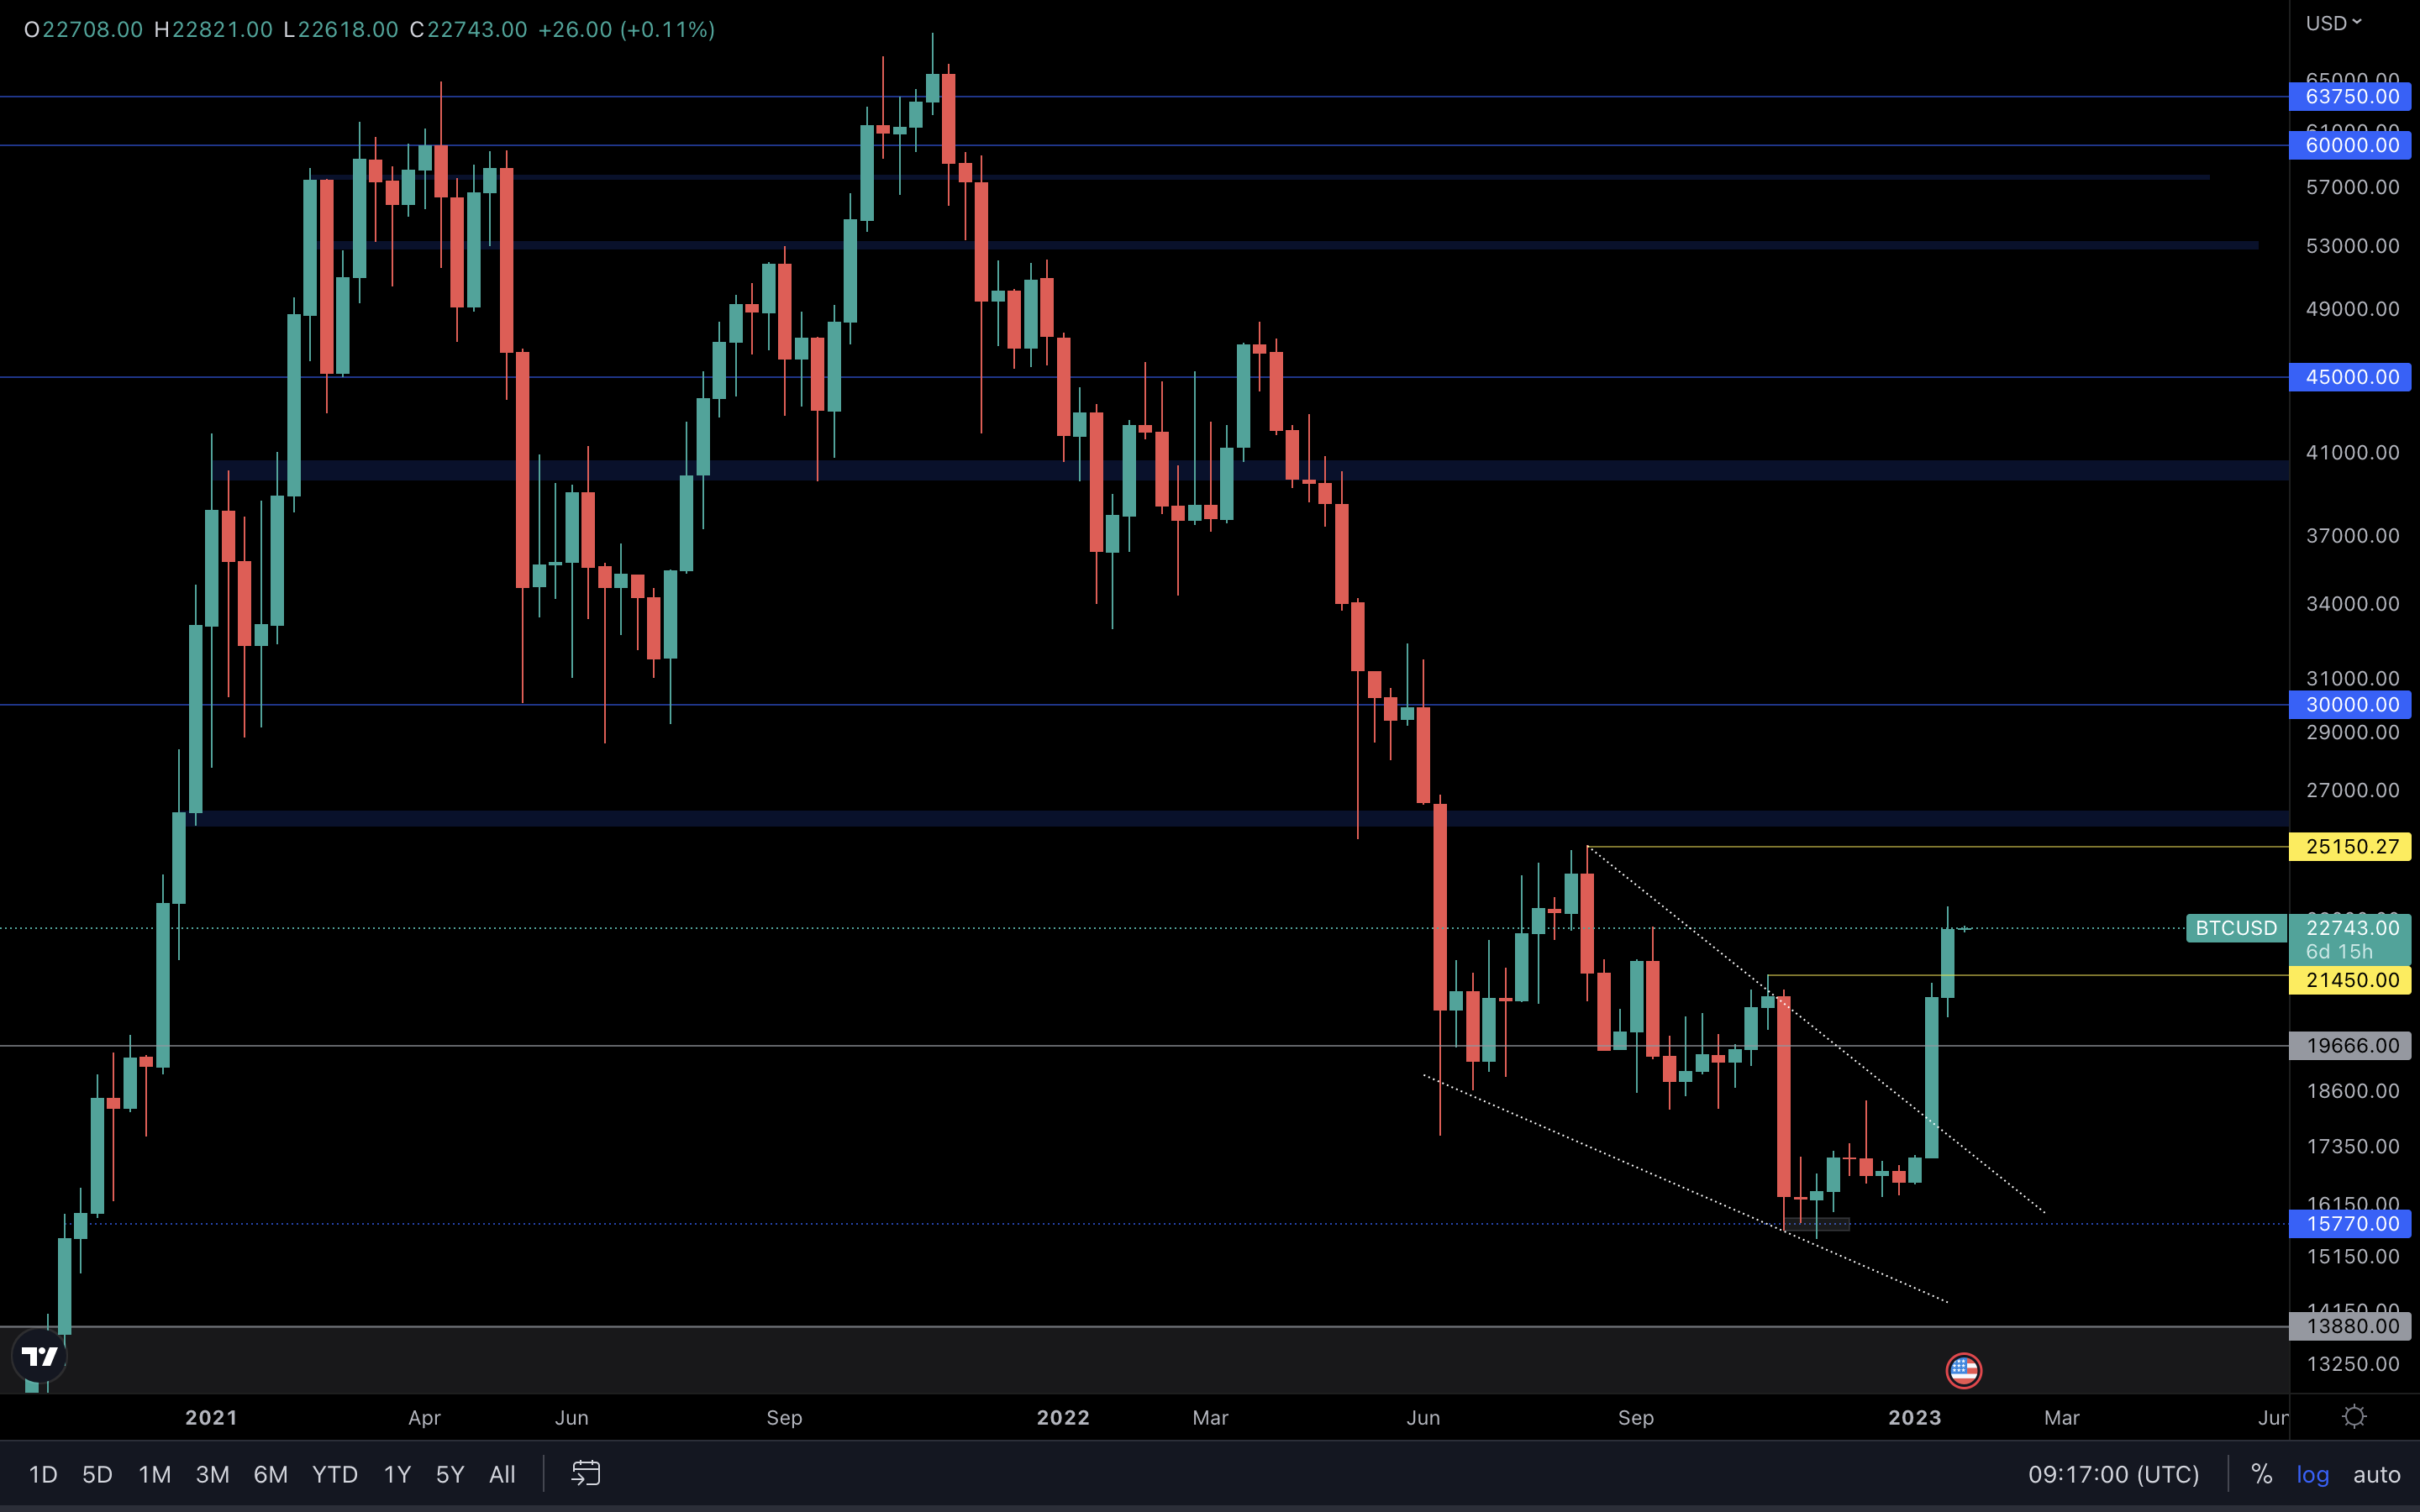
In the meantime, we could be looking at a retest of $21,450 as support before continuing to the upside. There’s no denying that Bitcoin could sky-rocket directly to $25k, but we always like to take the safer approach, which includes less risk and more reward.
If Bitcoin does retest $21,450 and successfully holds it as support, most altcoins will offer great entries for new trades, which we’ll spot as soon as they emerge.
ETH | Ethereum
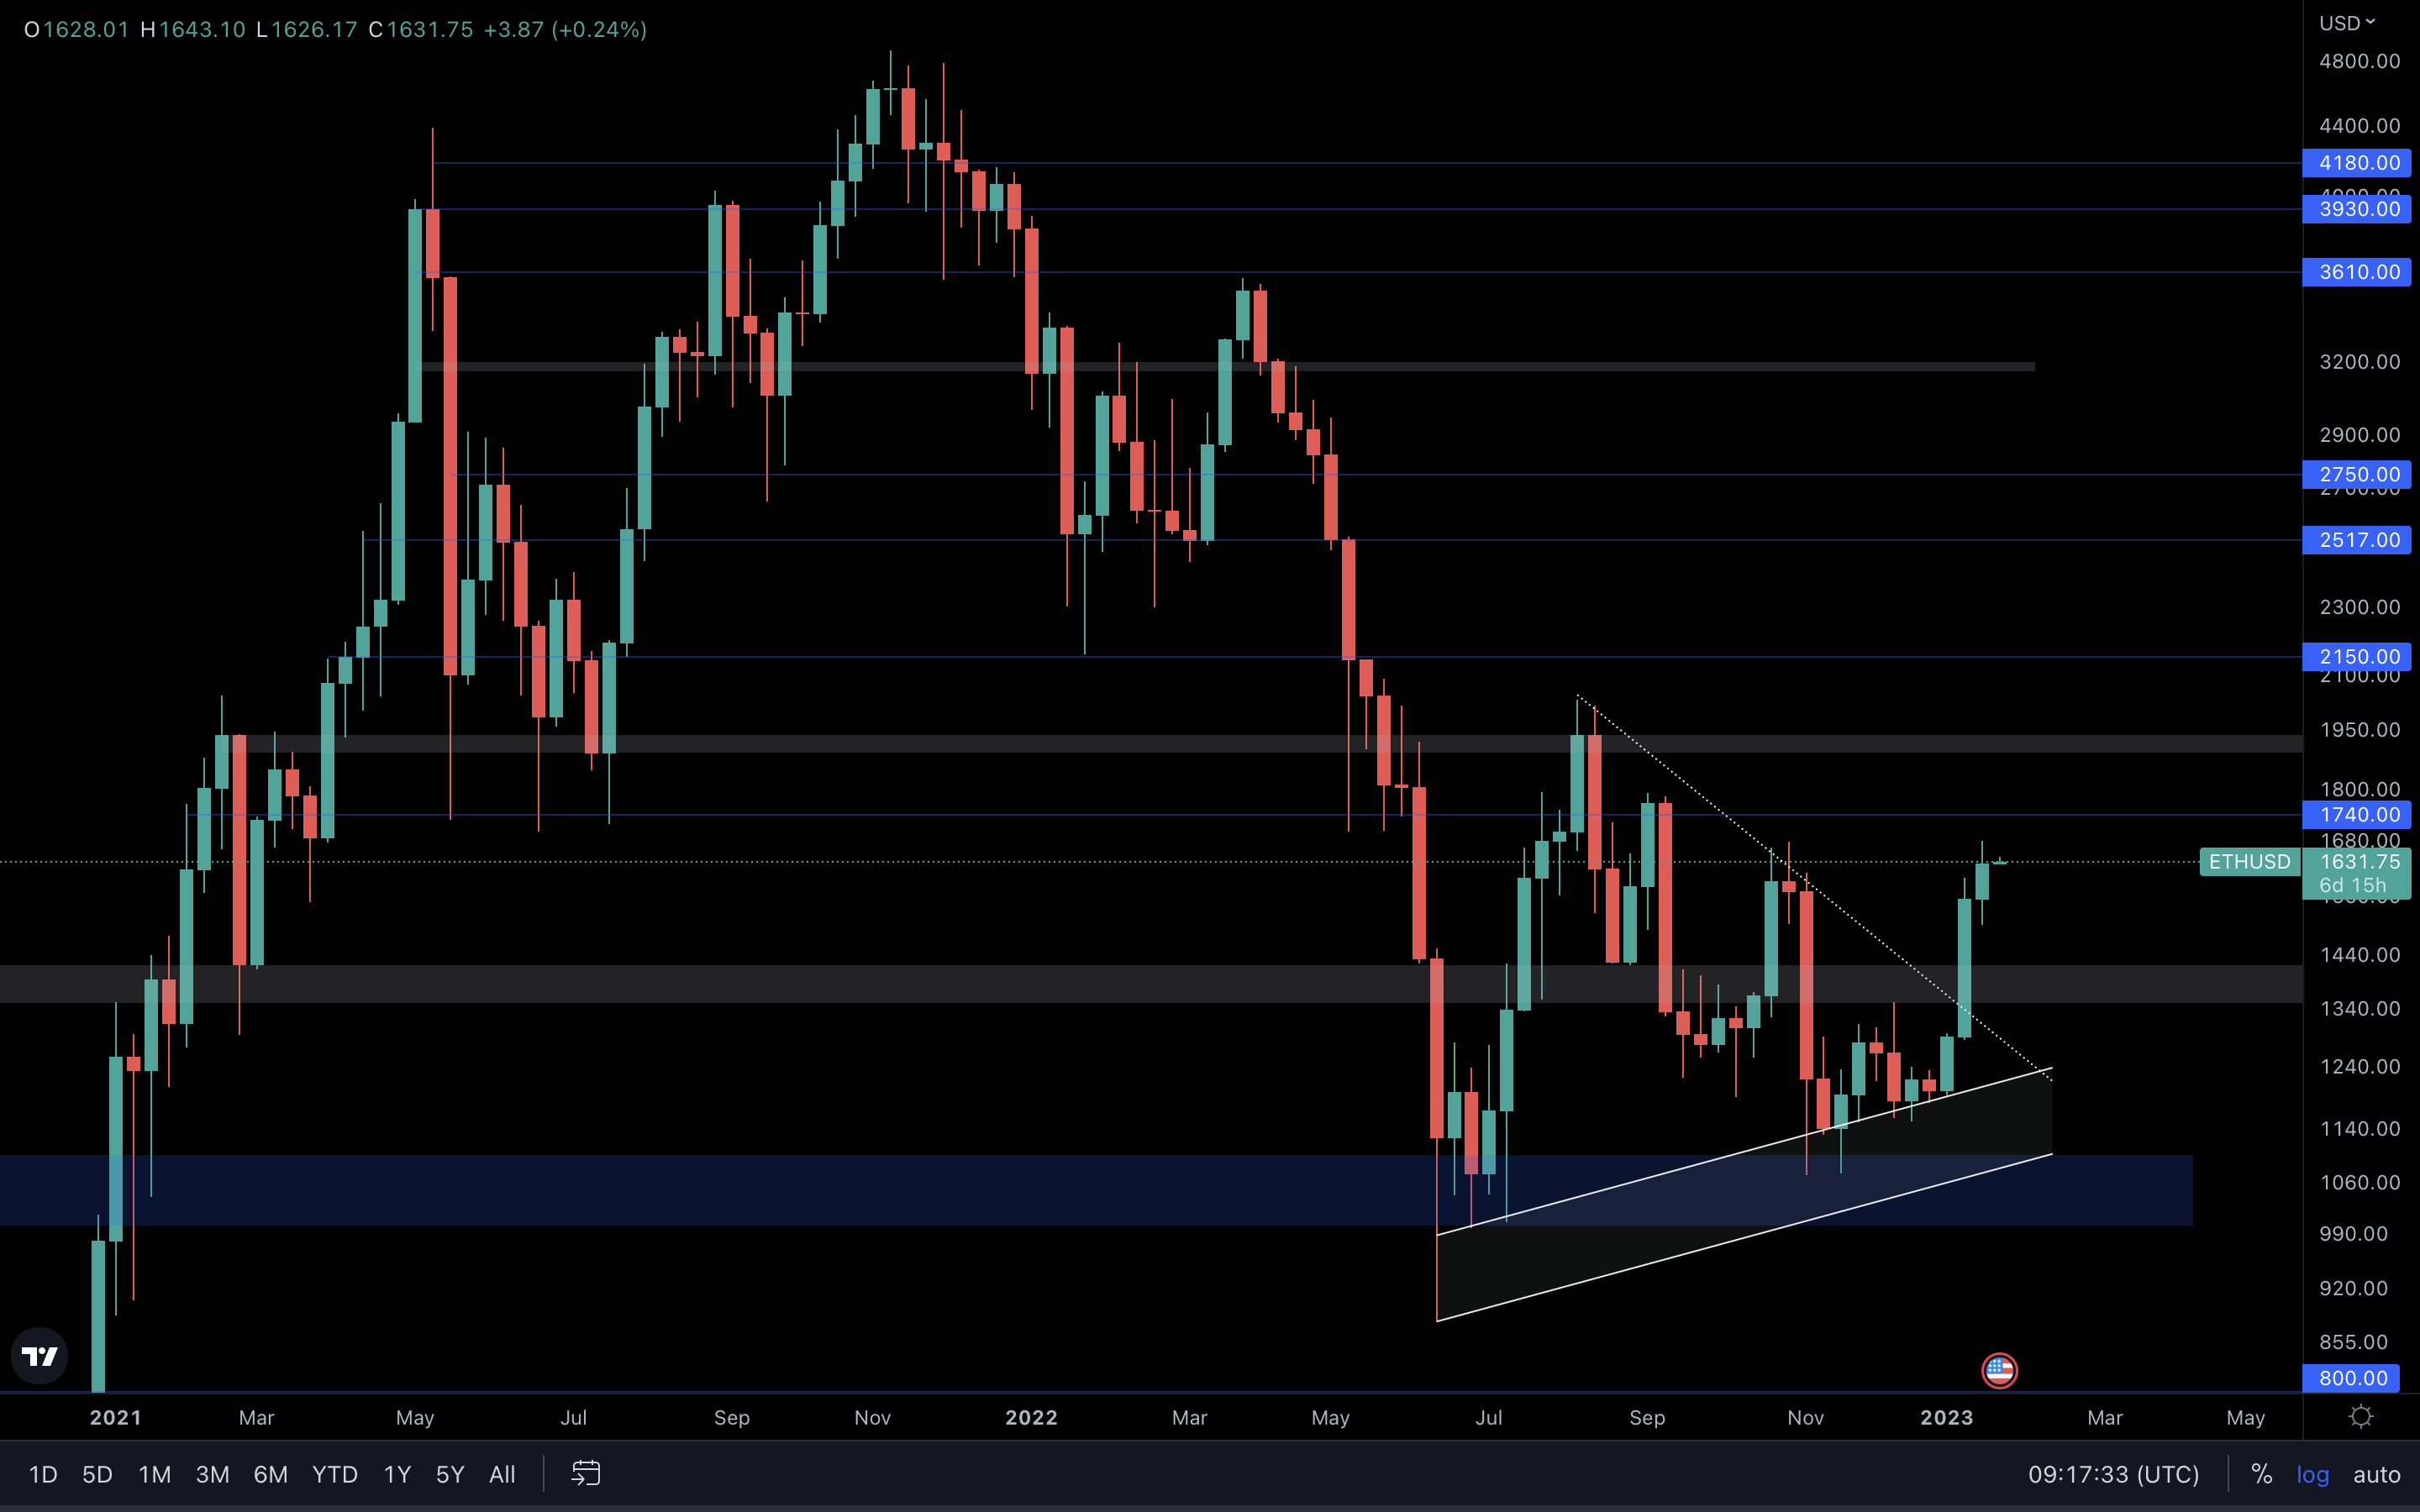
Ether is approaching $1740, the first line of resistance. We’ve said this before - we chose to have $1740 and $1900 (thin grey box) as resistance levels instead of the lower highs inside the wedge because those two levels have a much more critical role on higher timeframes. We’ve seen $1740 and $1900 tested multiple times in the past as both support & resistance.
If Bitcoin retests its nearest support before continuing to the upside, we could also see Ether coming down before or after reaching $1740.
On a larger scale, we’re confident Ether will reach $1900 in Q1 of 2023.
SOL | Solana
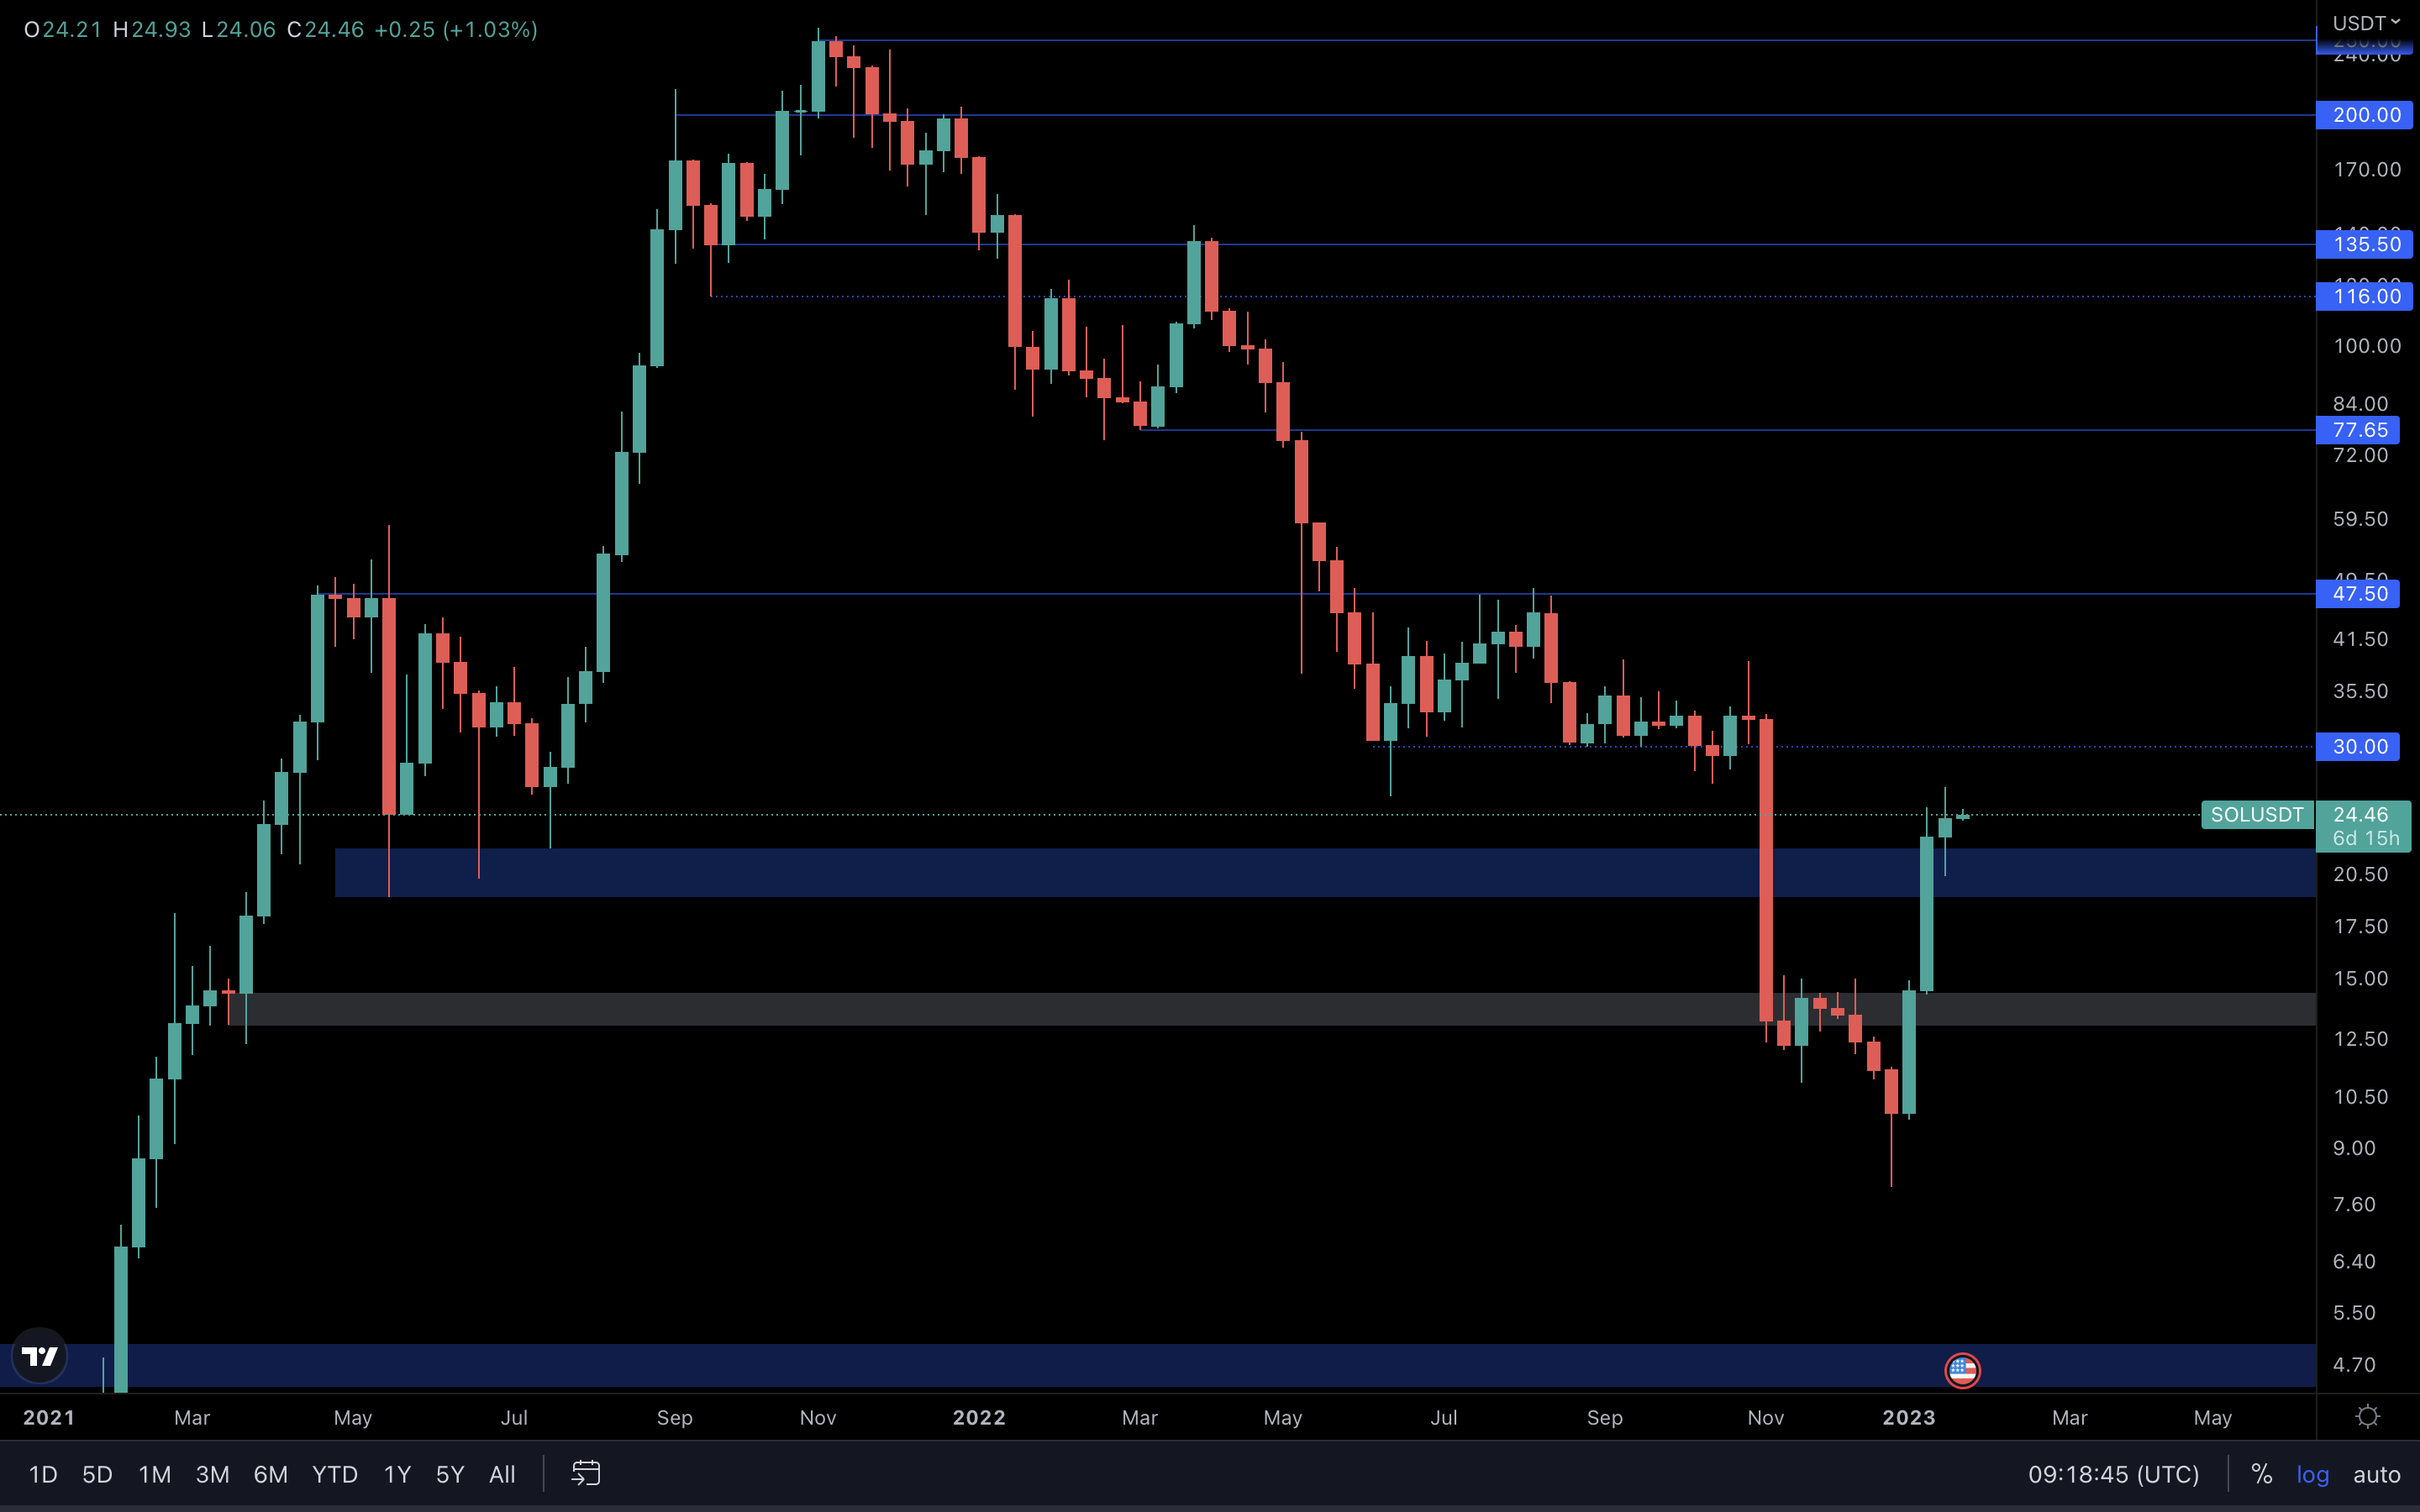
The $19 - $22 area was retested as support last week, and SOL reacted well. This now reinforces a move to $30. The majors (BTC & ETH) must perform well for SOL to reach our target. Otherwise, it will come back down.
RUNE | THORChain
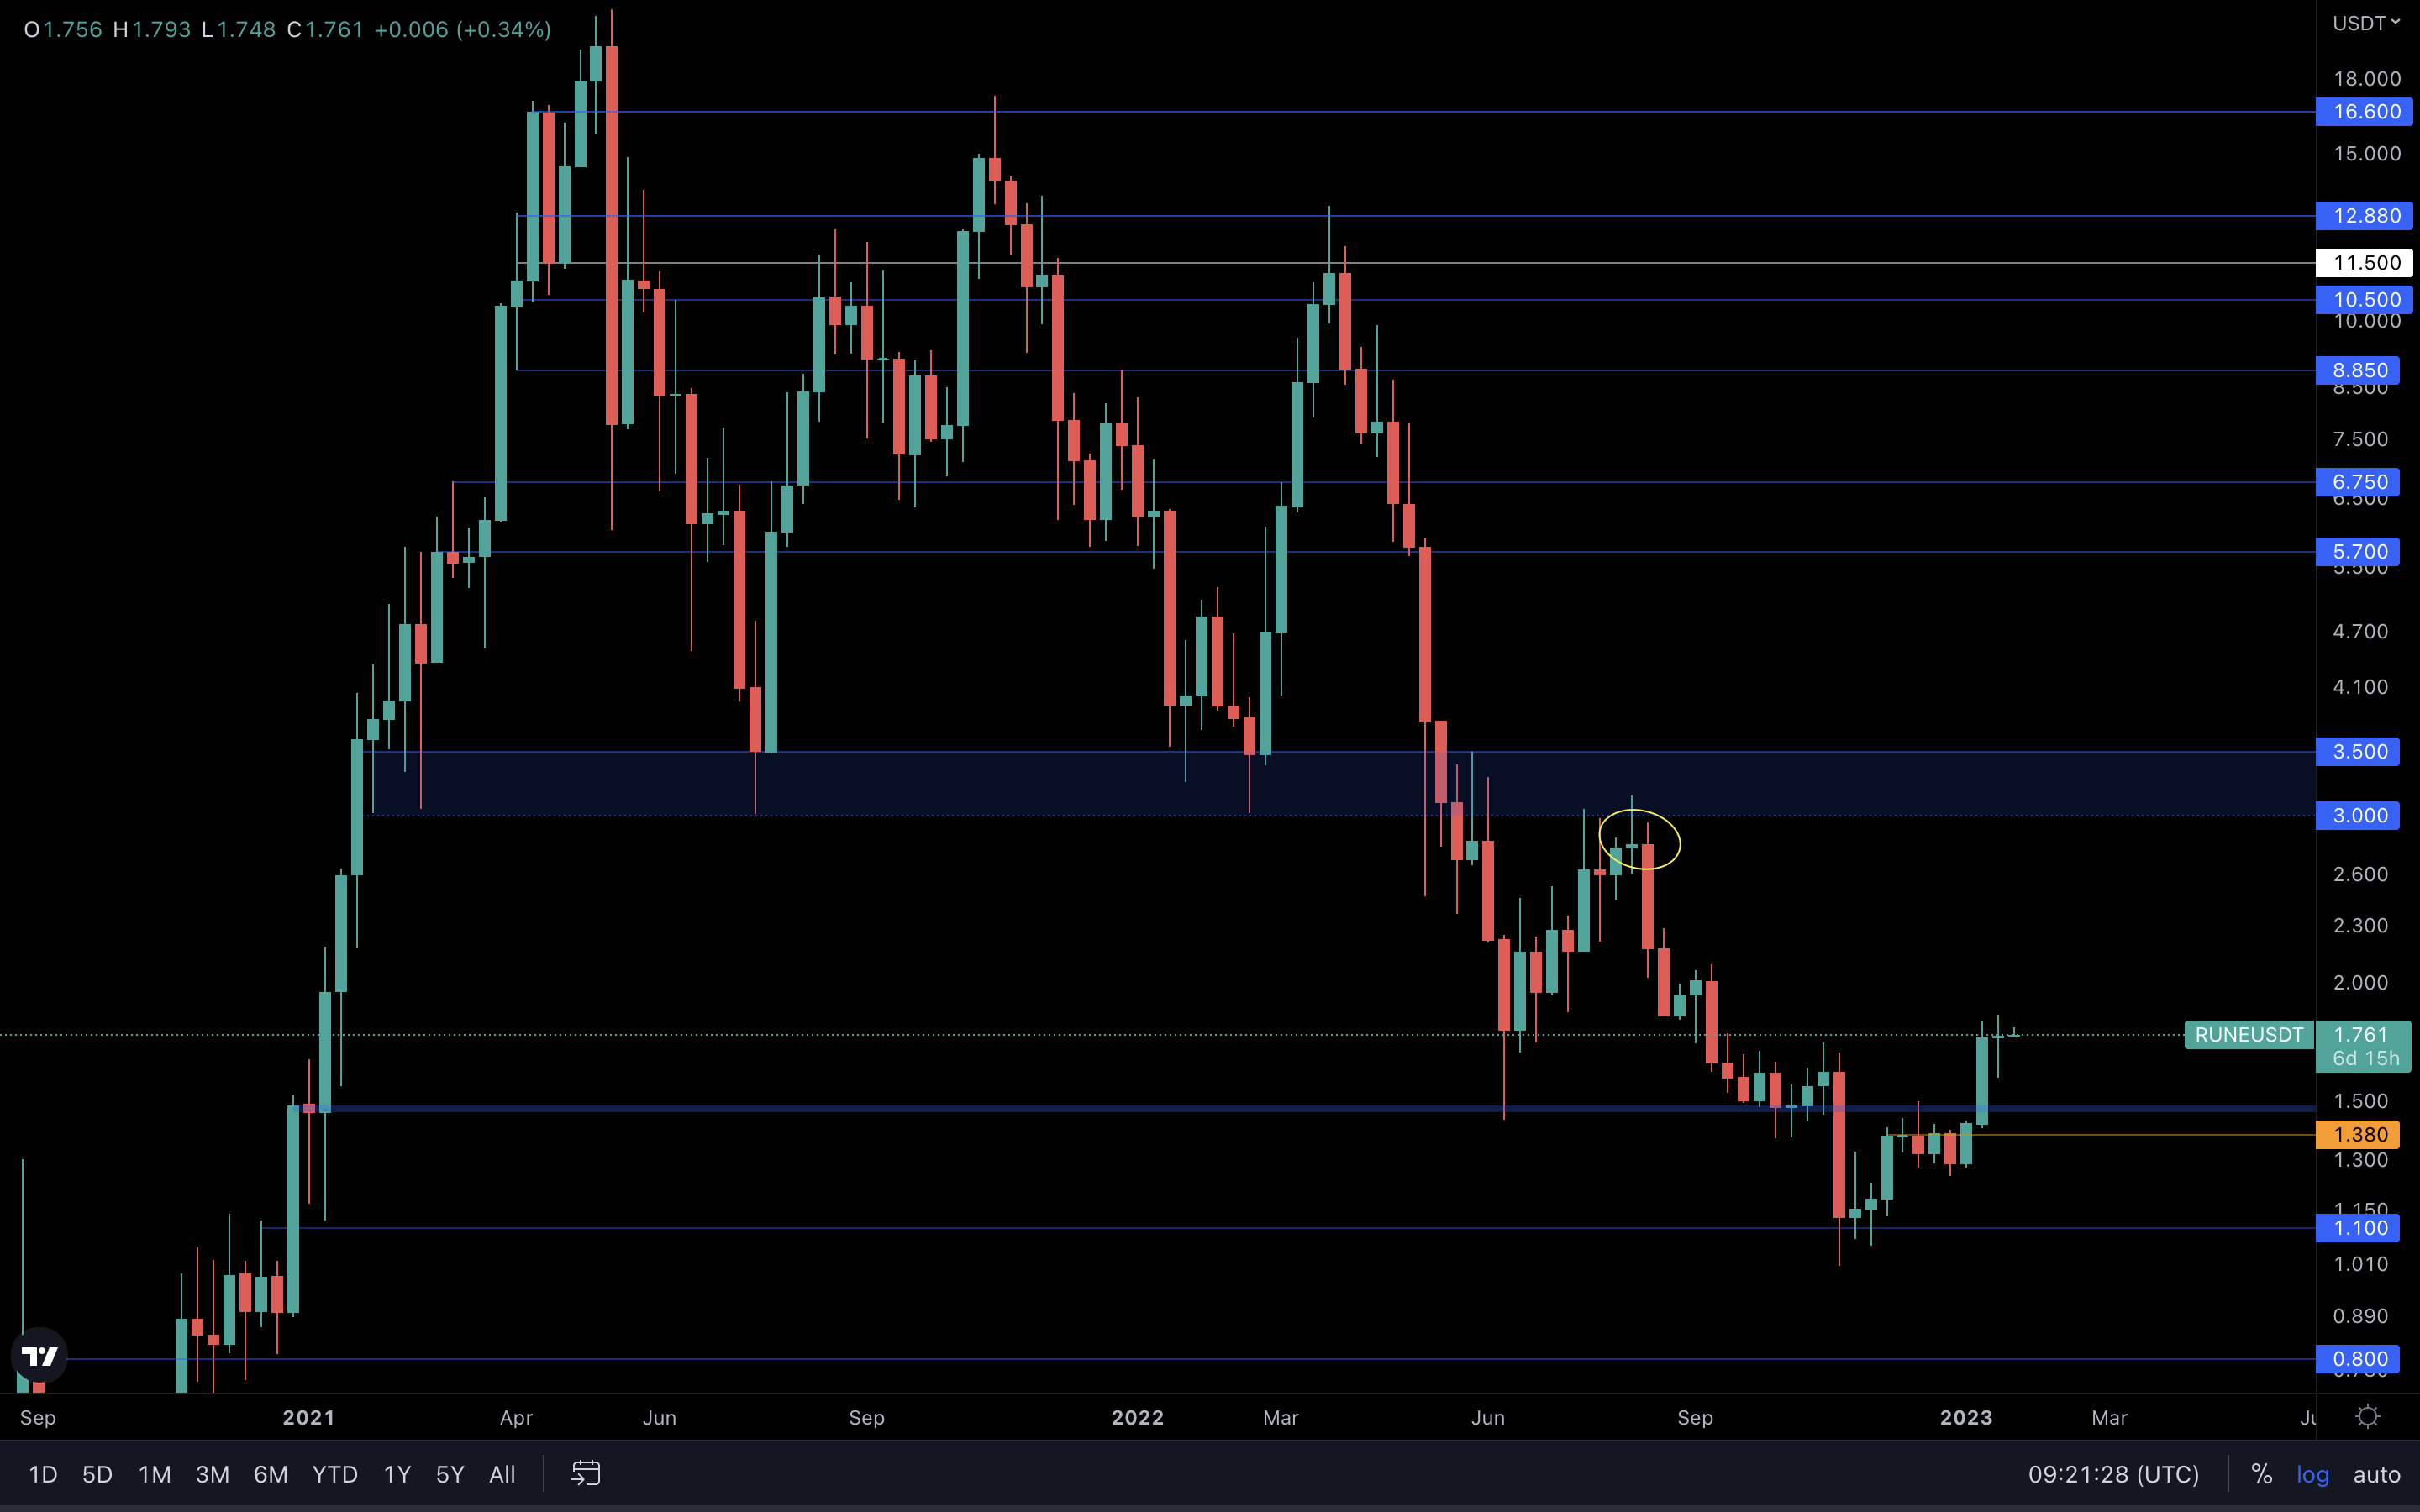
Last week, a Doji candle was registered on RUNE’s weekly timeframe. Doji candles usually signal indecisiveness or trend reversals, which means the asset is potentially at risk of heading lower. As an example, we’ve highlighted a previous weekly Doji candle that led to downside at the yellow circle on the chart. However, there’s one notable difference here - the market is performing well, unlike the last time, when the entire market went downhill and saw a lot more downside. This means that RUNE’s Doji candle could have little to no importance if the majors perform well. However, as far as opportunities go, this one isn’t even close to some we have in store - keep reading to find out which ones we spotted.
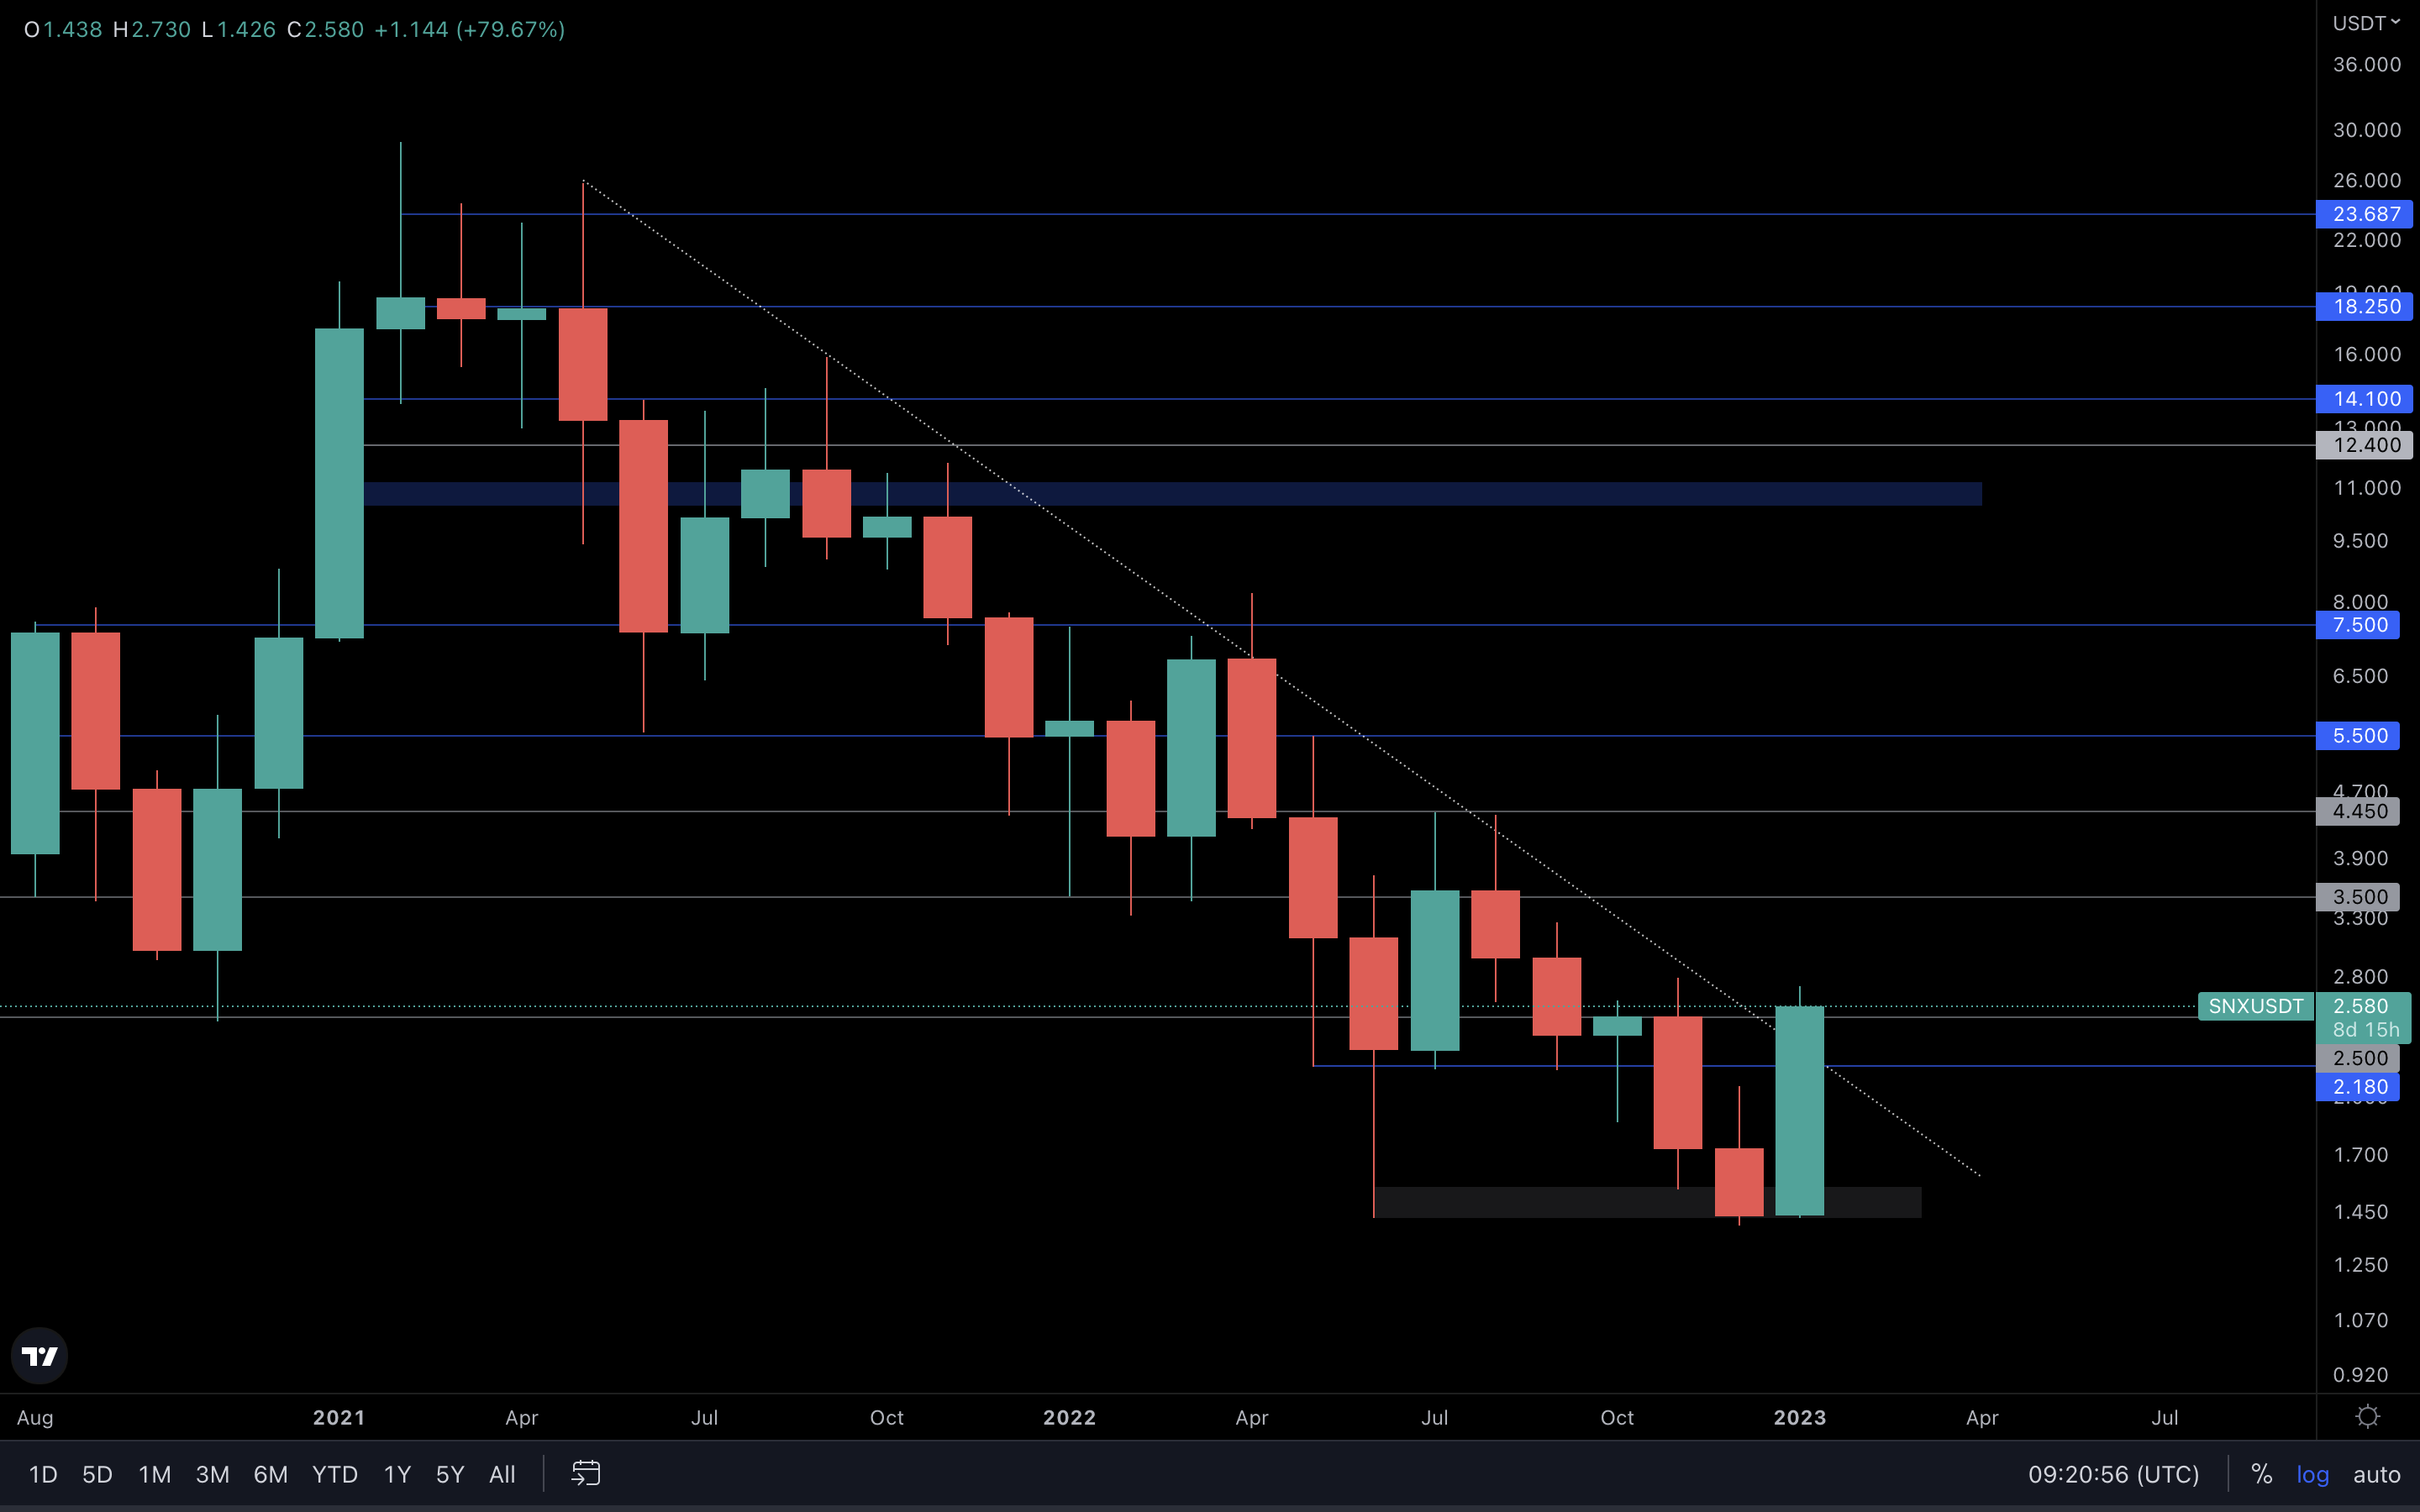
SNX | Synthetix (Weekly timeframe)
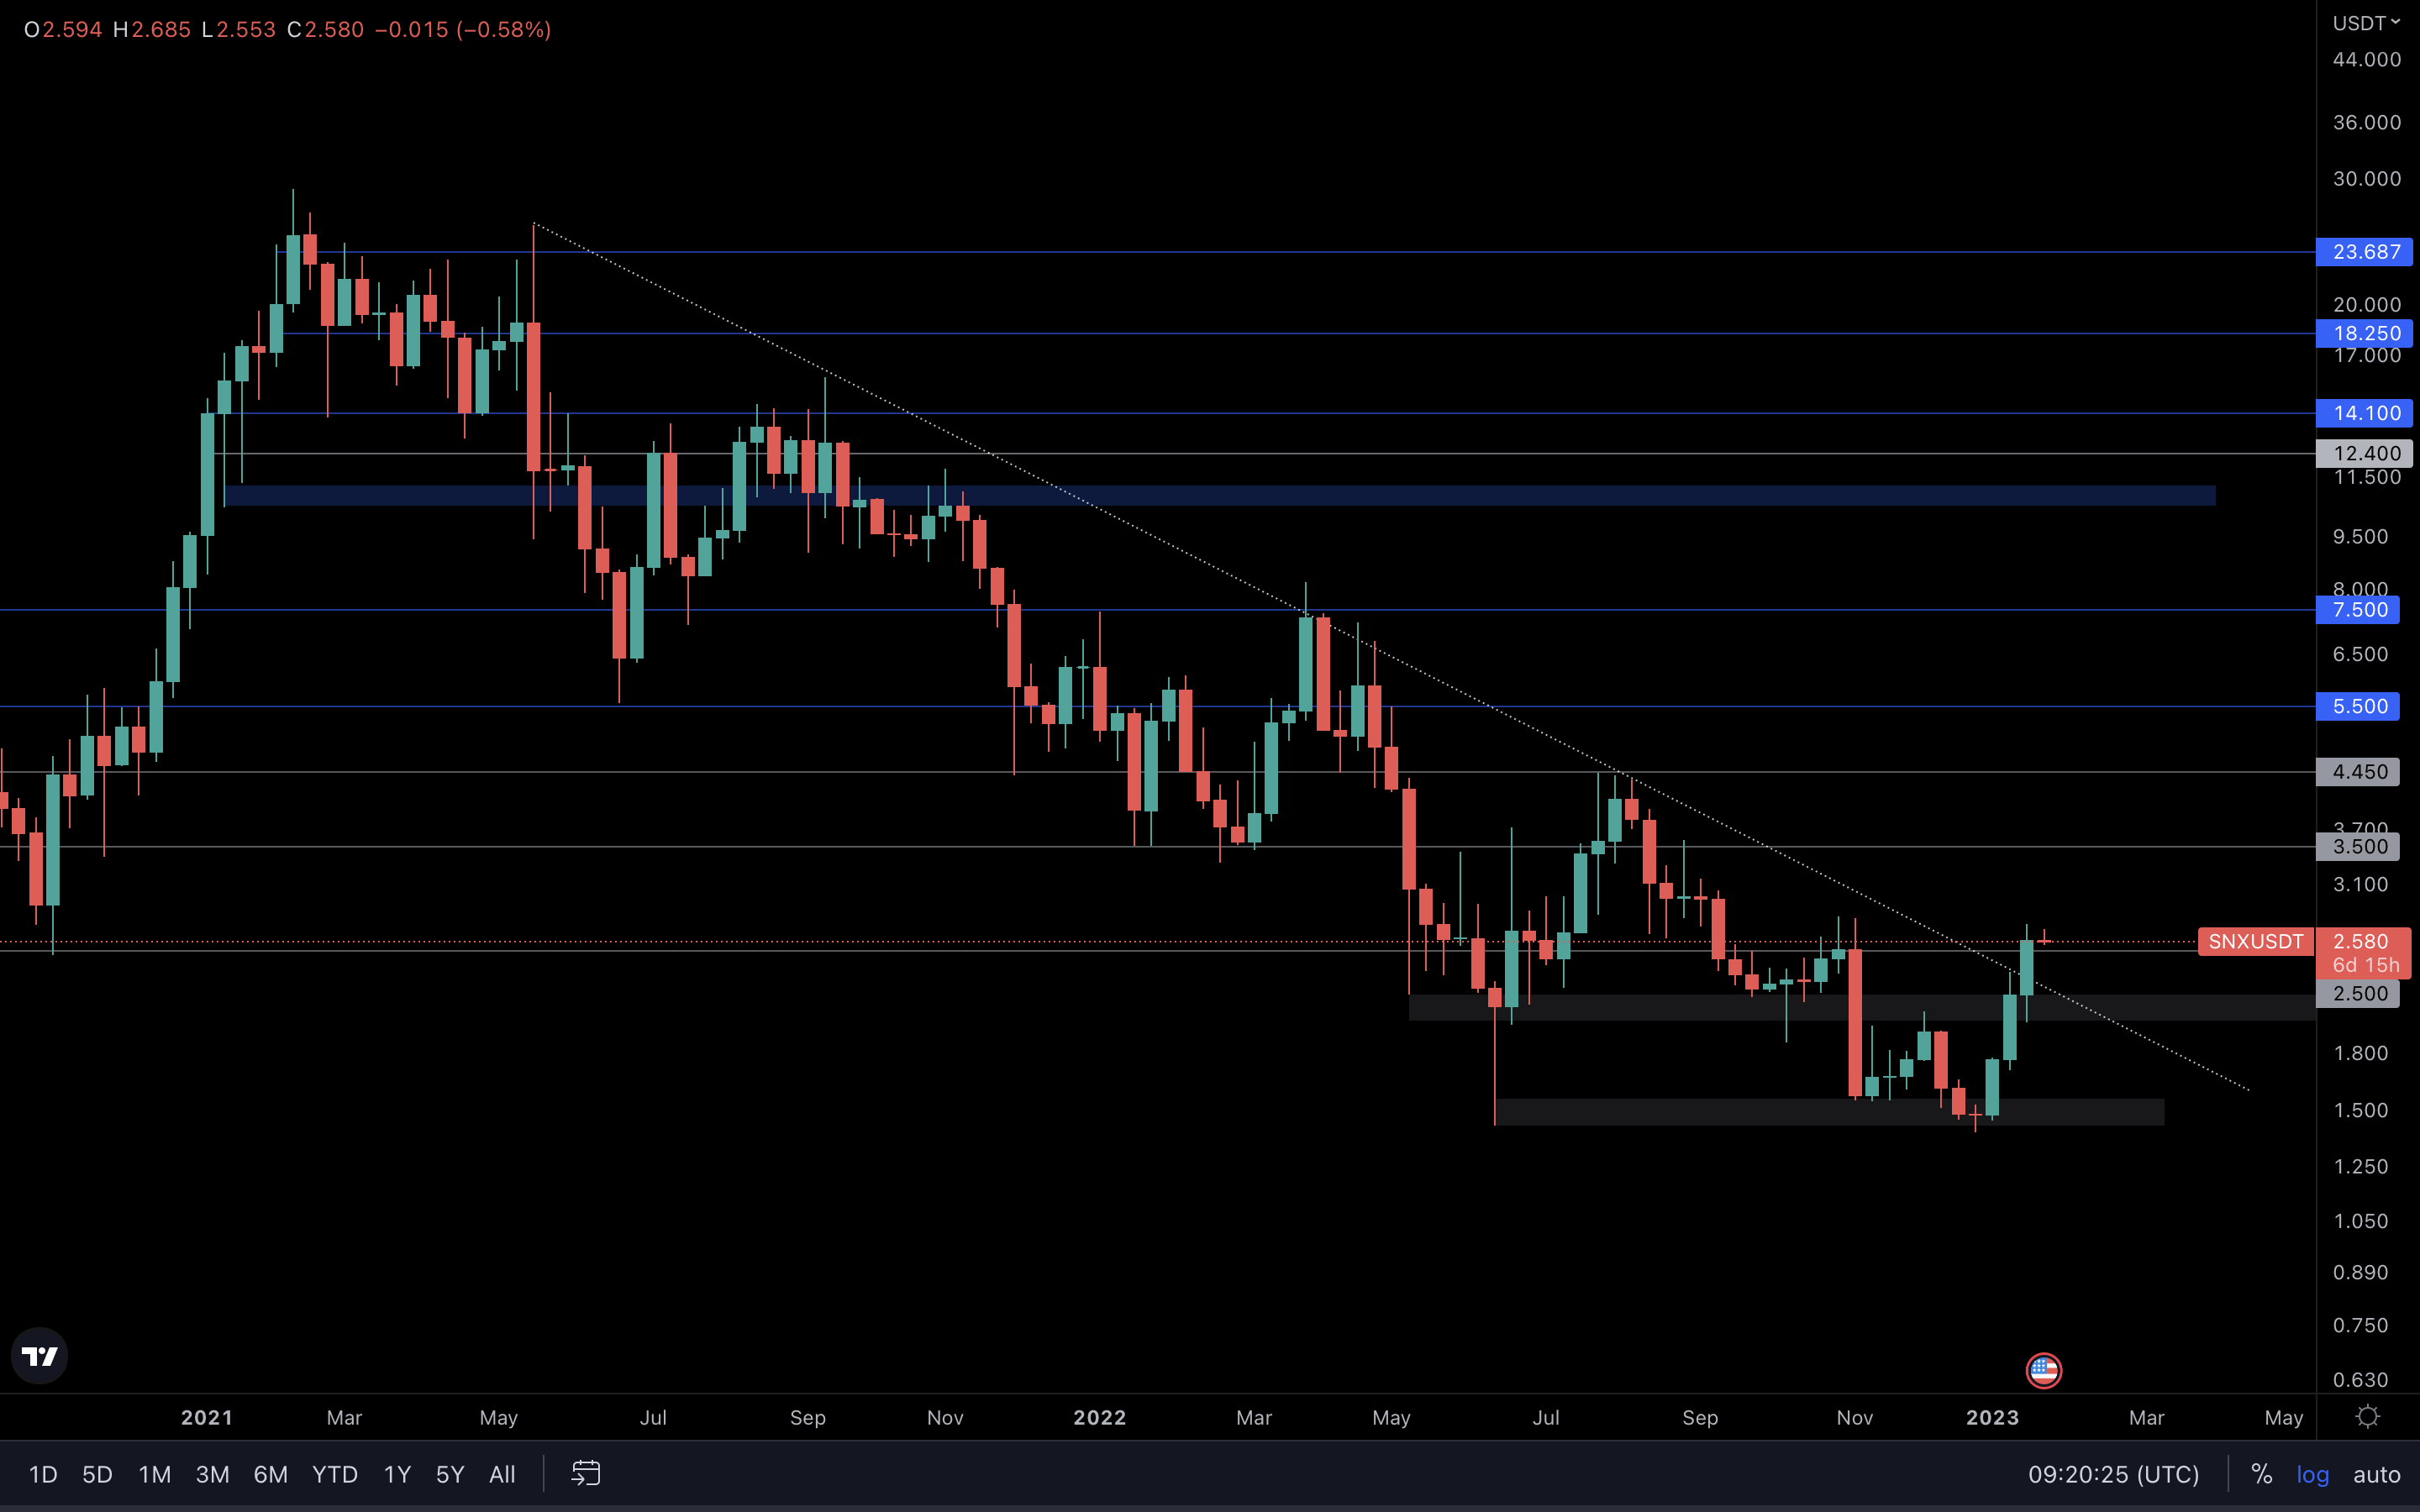
This is the weekly chart for SNX. What you see here is a confirmed breakout after SNX closed the week above its $2.50 resistance level. From a technical standpoint, SNX is now headed for $3.50, our first line of resistance on the way up. This is a really important breakout. The trend line you’re seeing on this chart is a +600-day-old resistance. A breakout this big usually leads to good returns, and in the current market, we’re sure that this is what 99% of us want.
SNX | Synthetix (Monthly timeframe)
This is the monthly timeframe for SNX. Not only do we have a potential bullish engulfing candlestick forming here, but we also have it forming above the $2.50 support and breaking above the +600-day-old resistance trend line. A monthly closure above $2.50 will confirm a much stronger rally for SNX, and we could even see it reach higher and higher levels throughout Q1 and Q2. This is, at the current time, the most exciting chart out of them all.
dYdX | DYDX
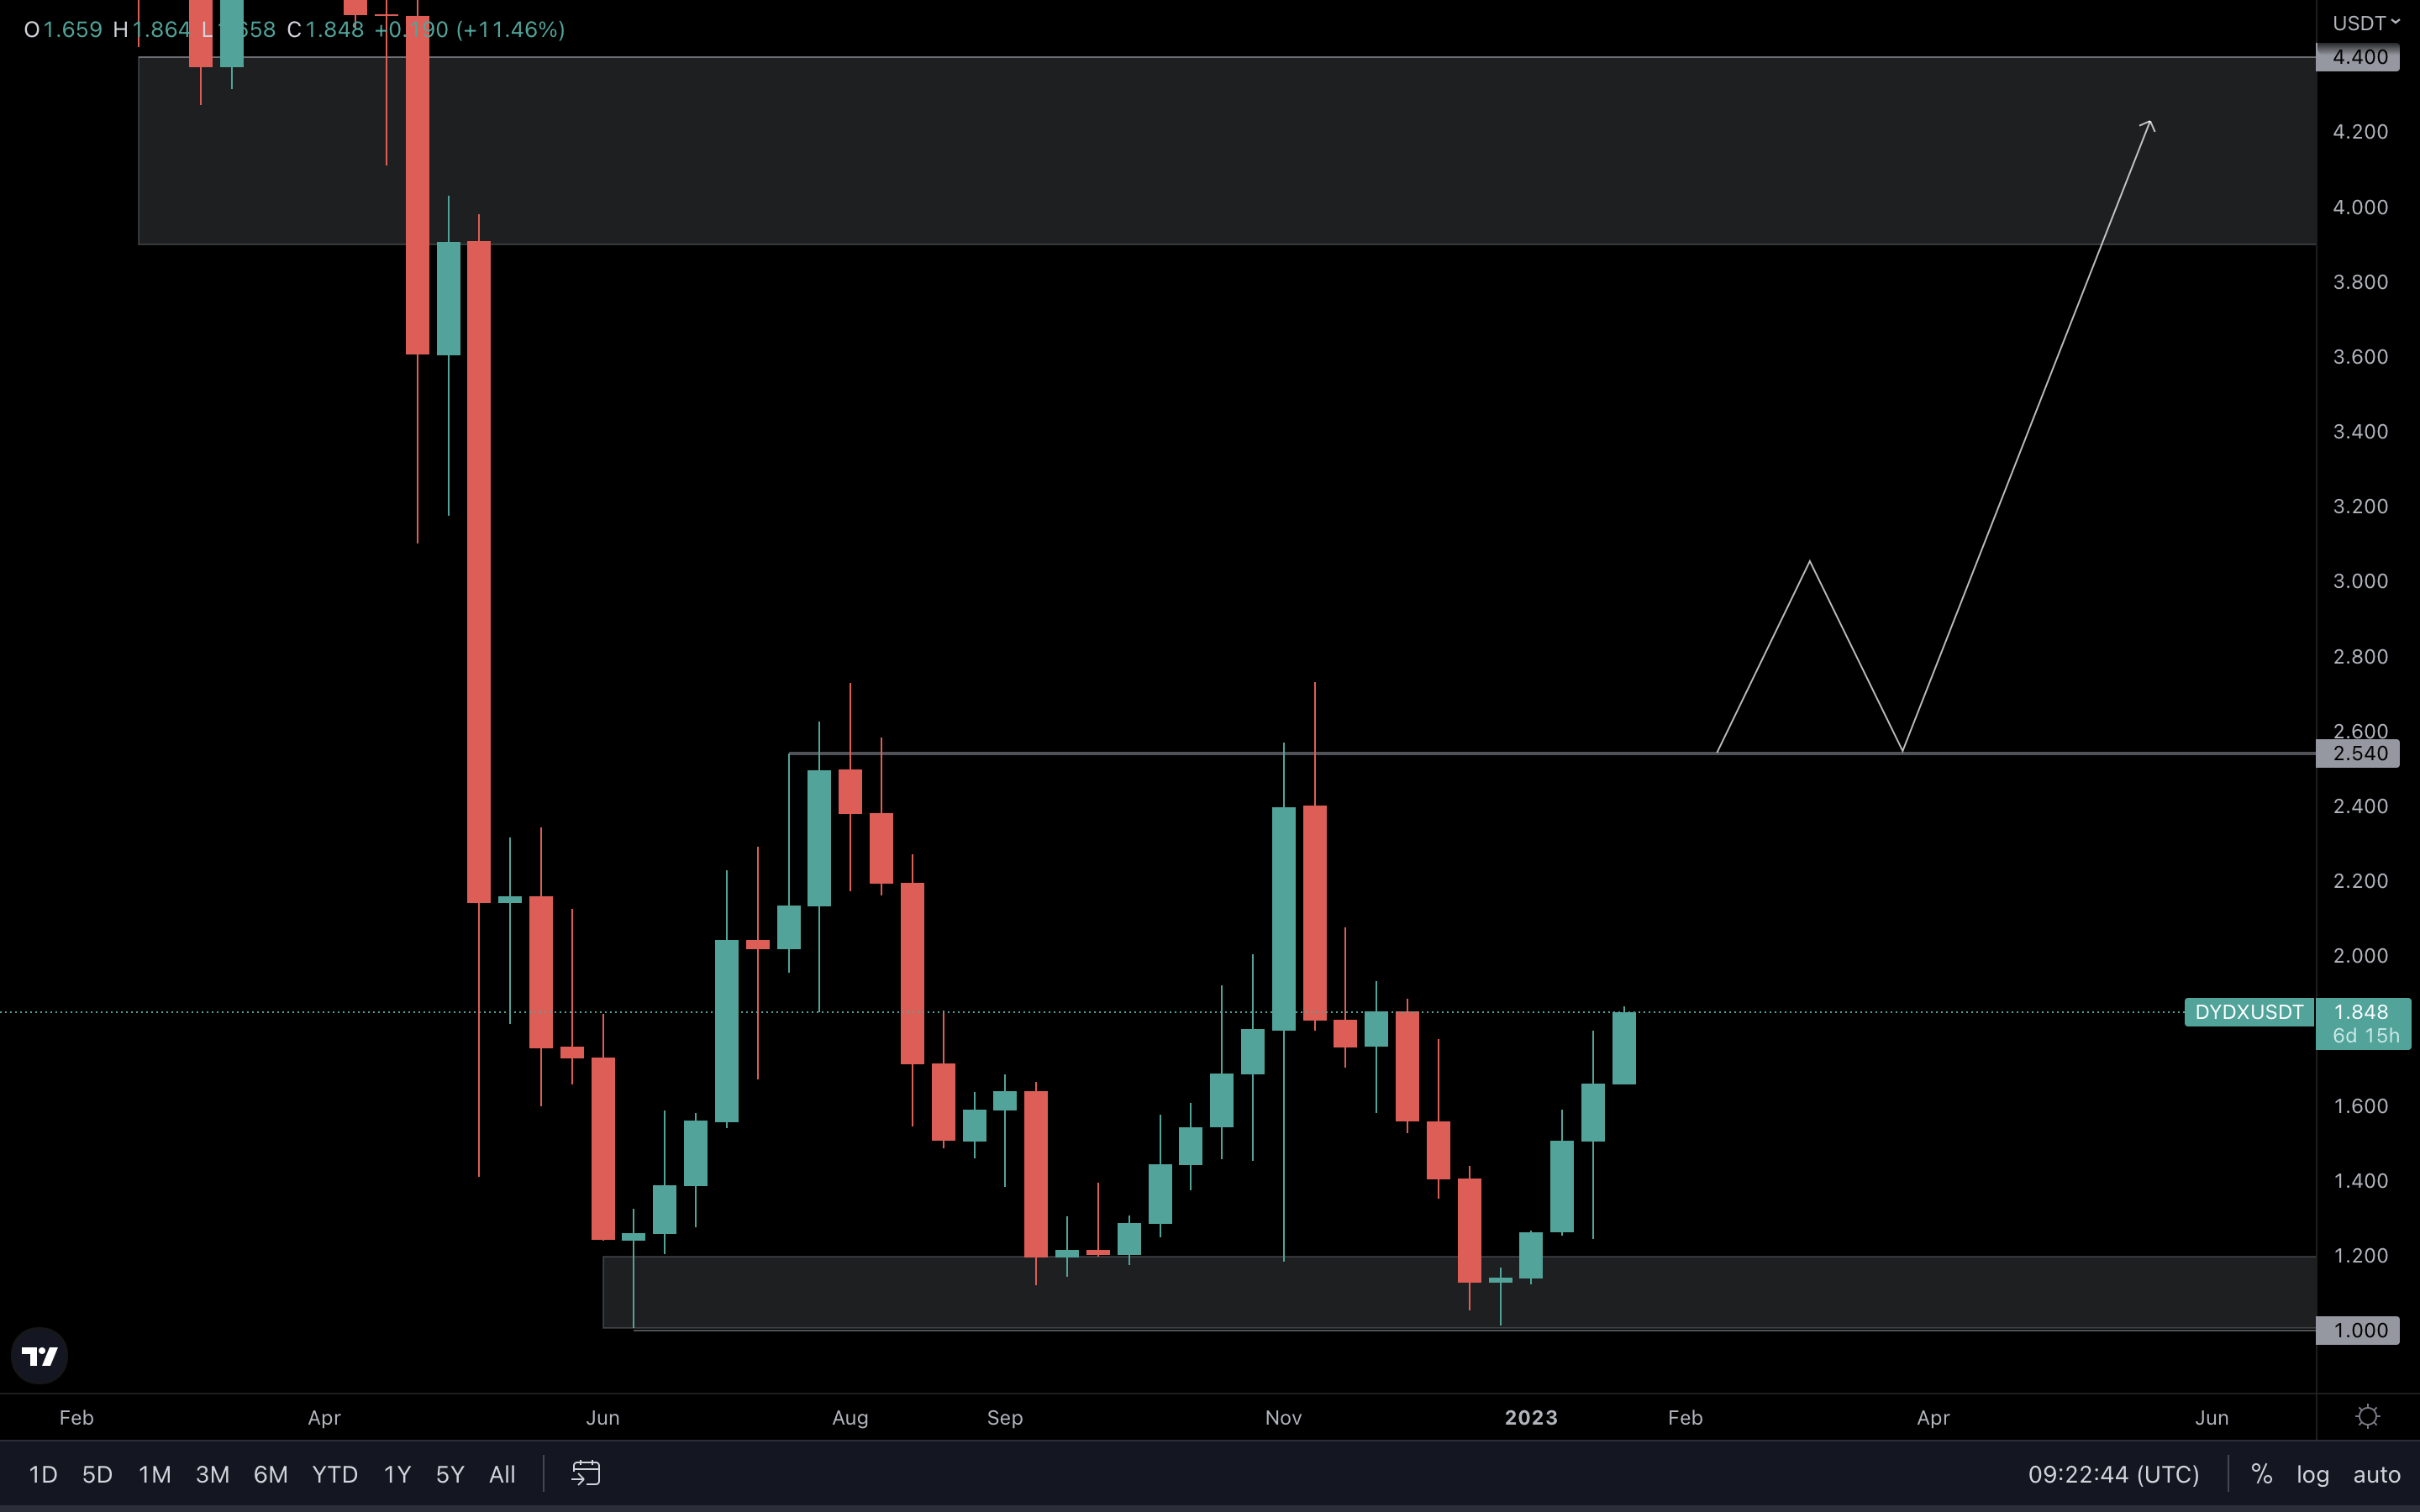
What you see on this chart is a potential triple bottom formation. For this pattern to be validated, $2.50 must be reclaimed and turned into support. This will confirm the grey box between $3.90 and $4.40 as our next target for DYDX. We’ve been sharing the possibility of this pattern playing out even when DYDX was trading near $1. If you’ve missed the move, there’s no point in entering at this current time. It would be best to wait for the price to retrace/slow down because you could buy the top without even knowing it. After all, one can never be certain in crypto.
Cryptonary's Watchlist
DOT | Polkadot
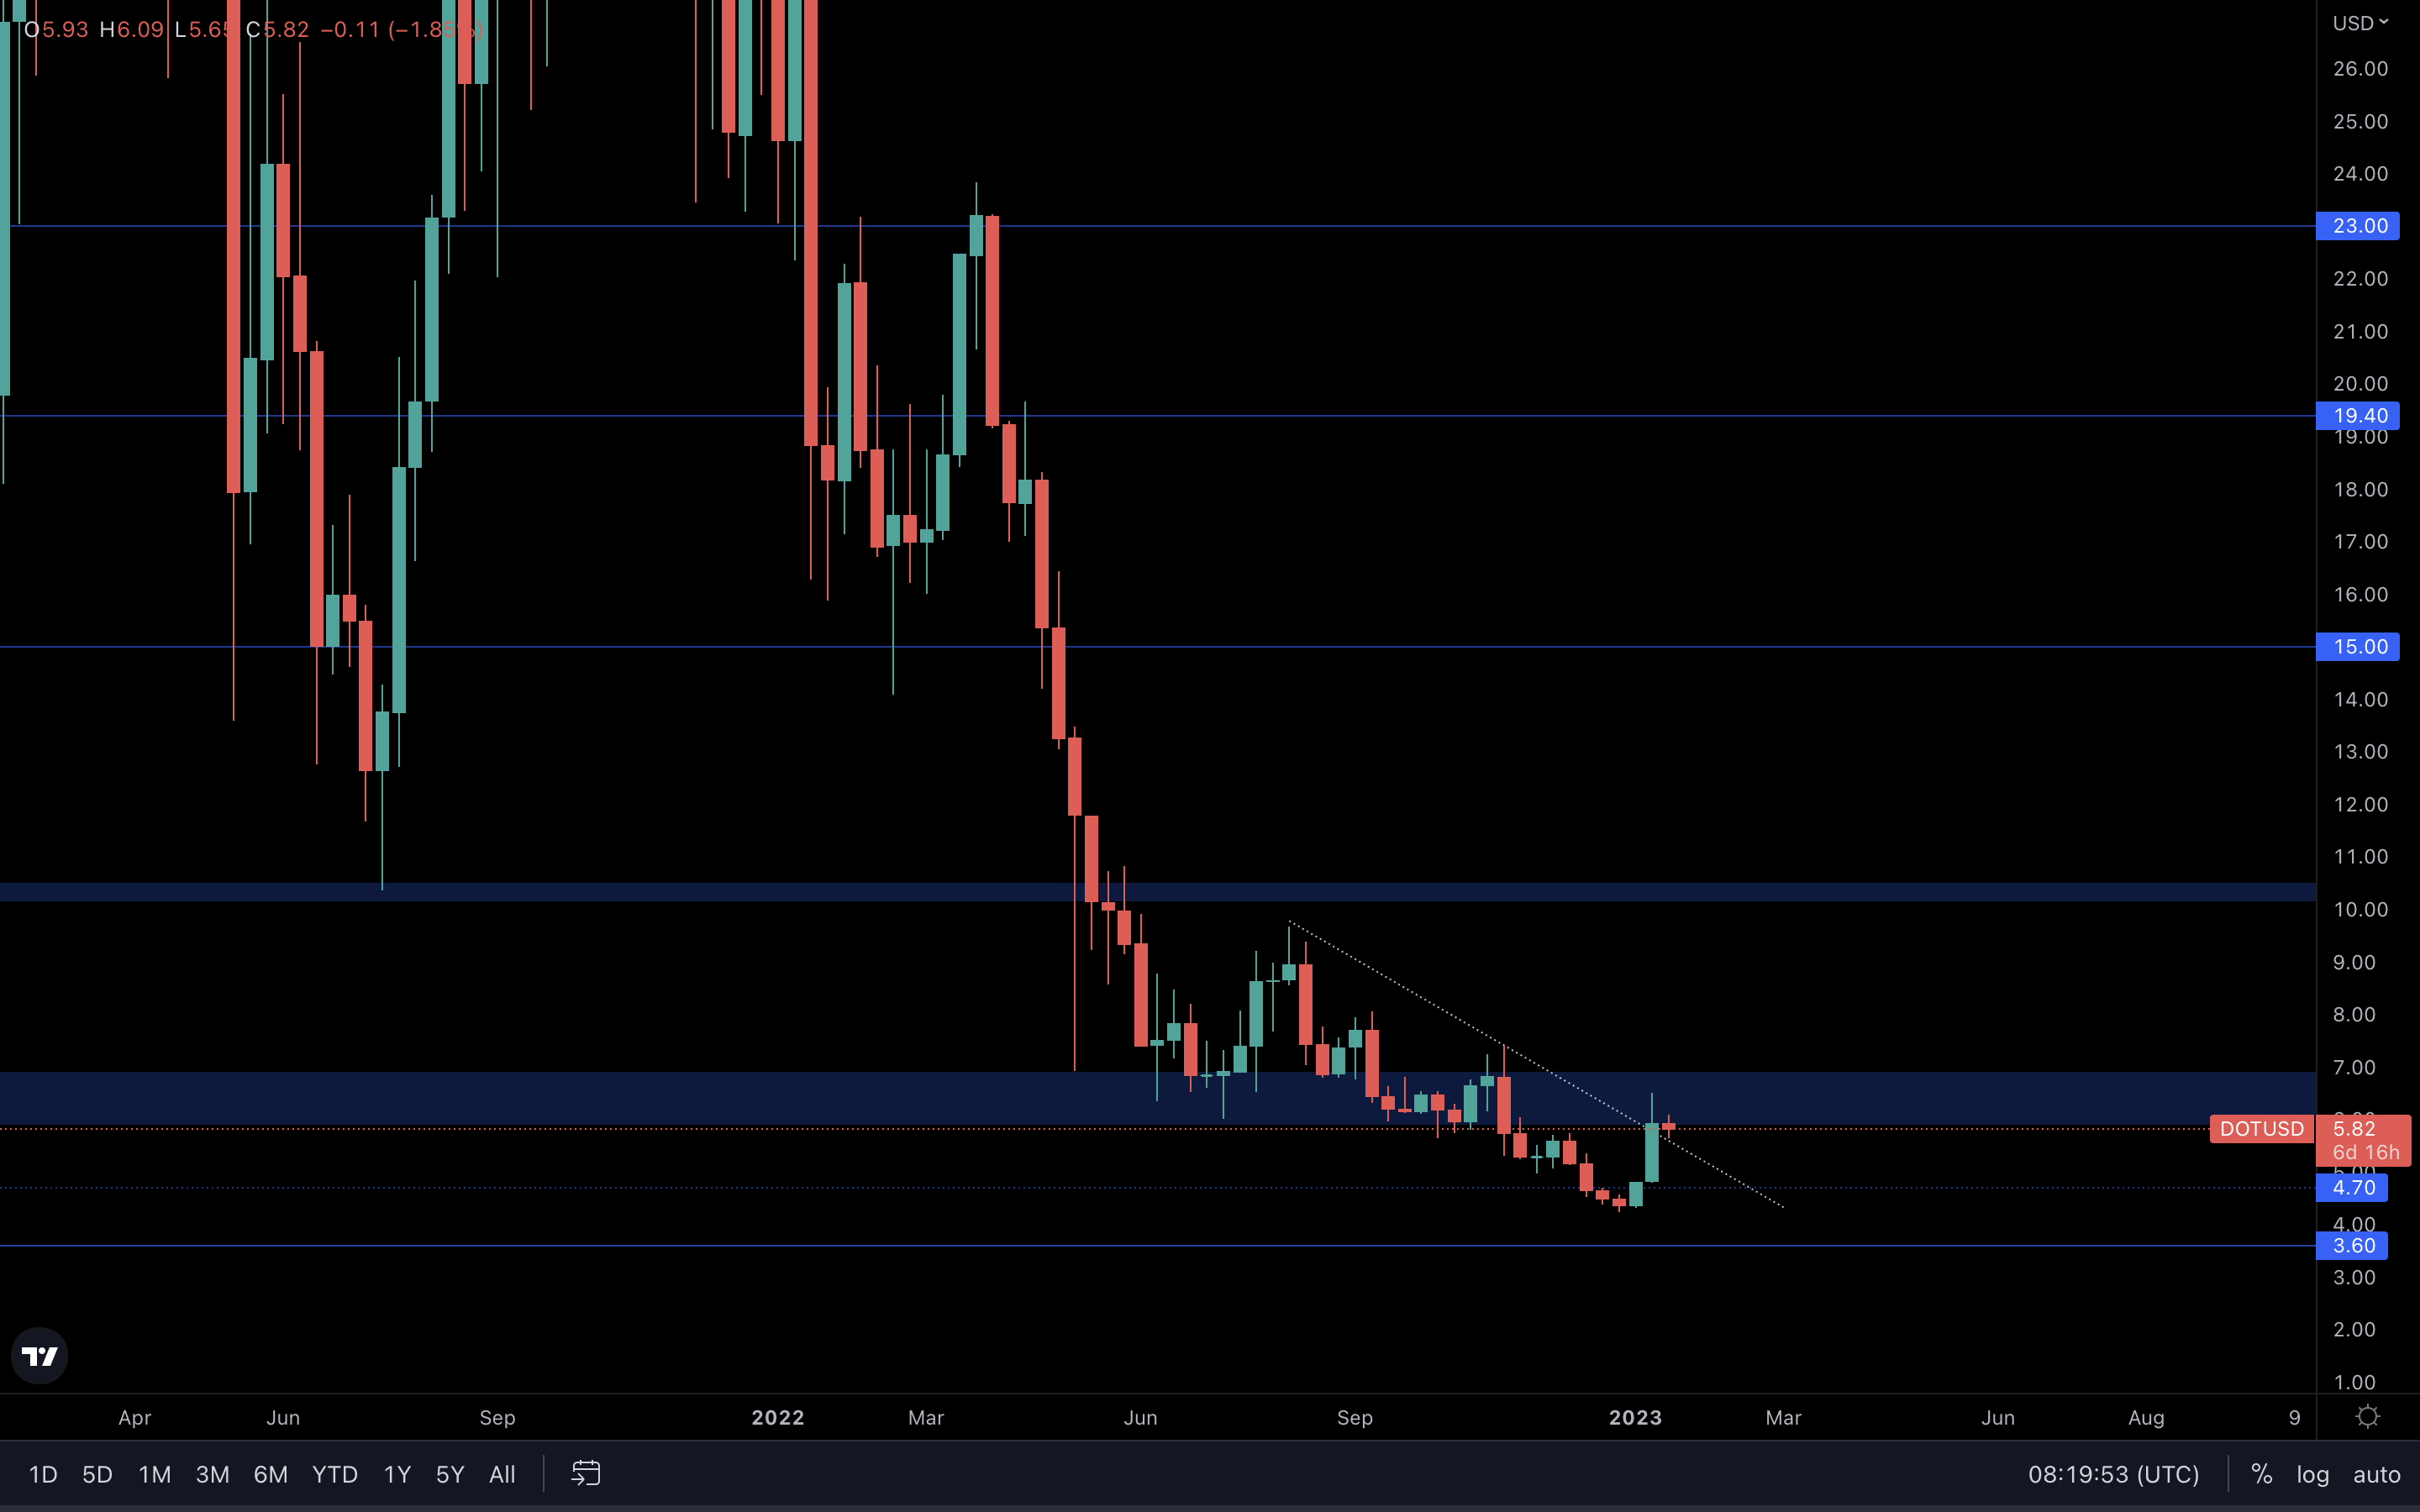
DOT has a clear path toward $7 unless the level of $6 is lost by a weekly closure under it.
SYN | Synapse
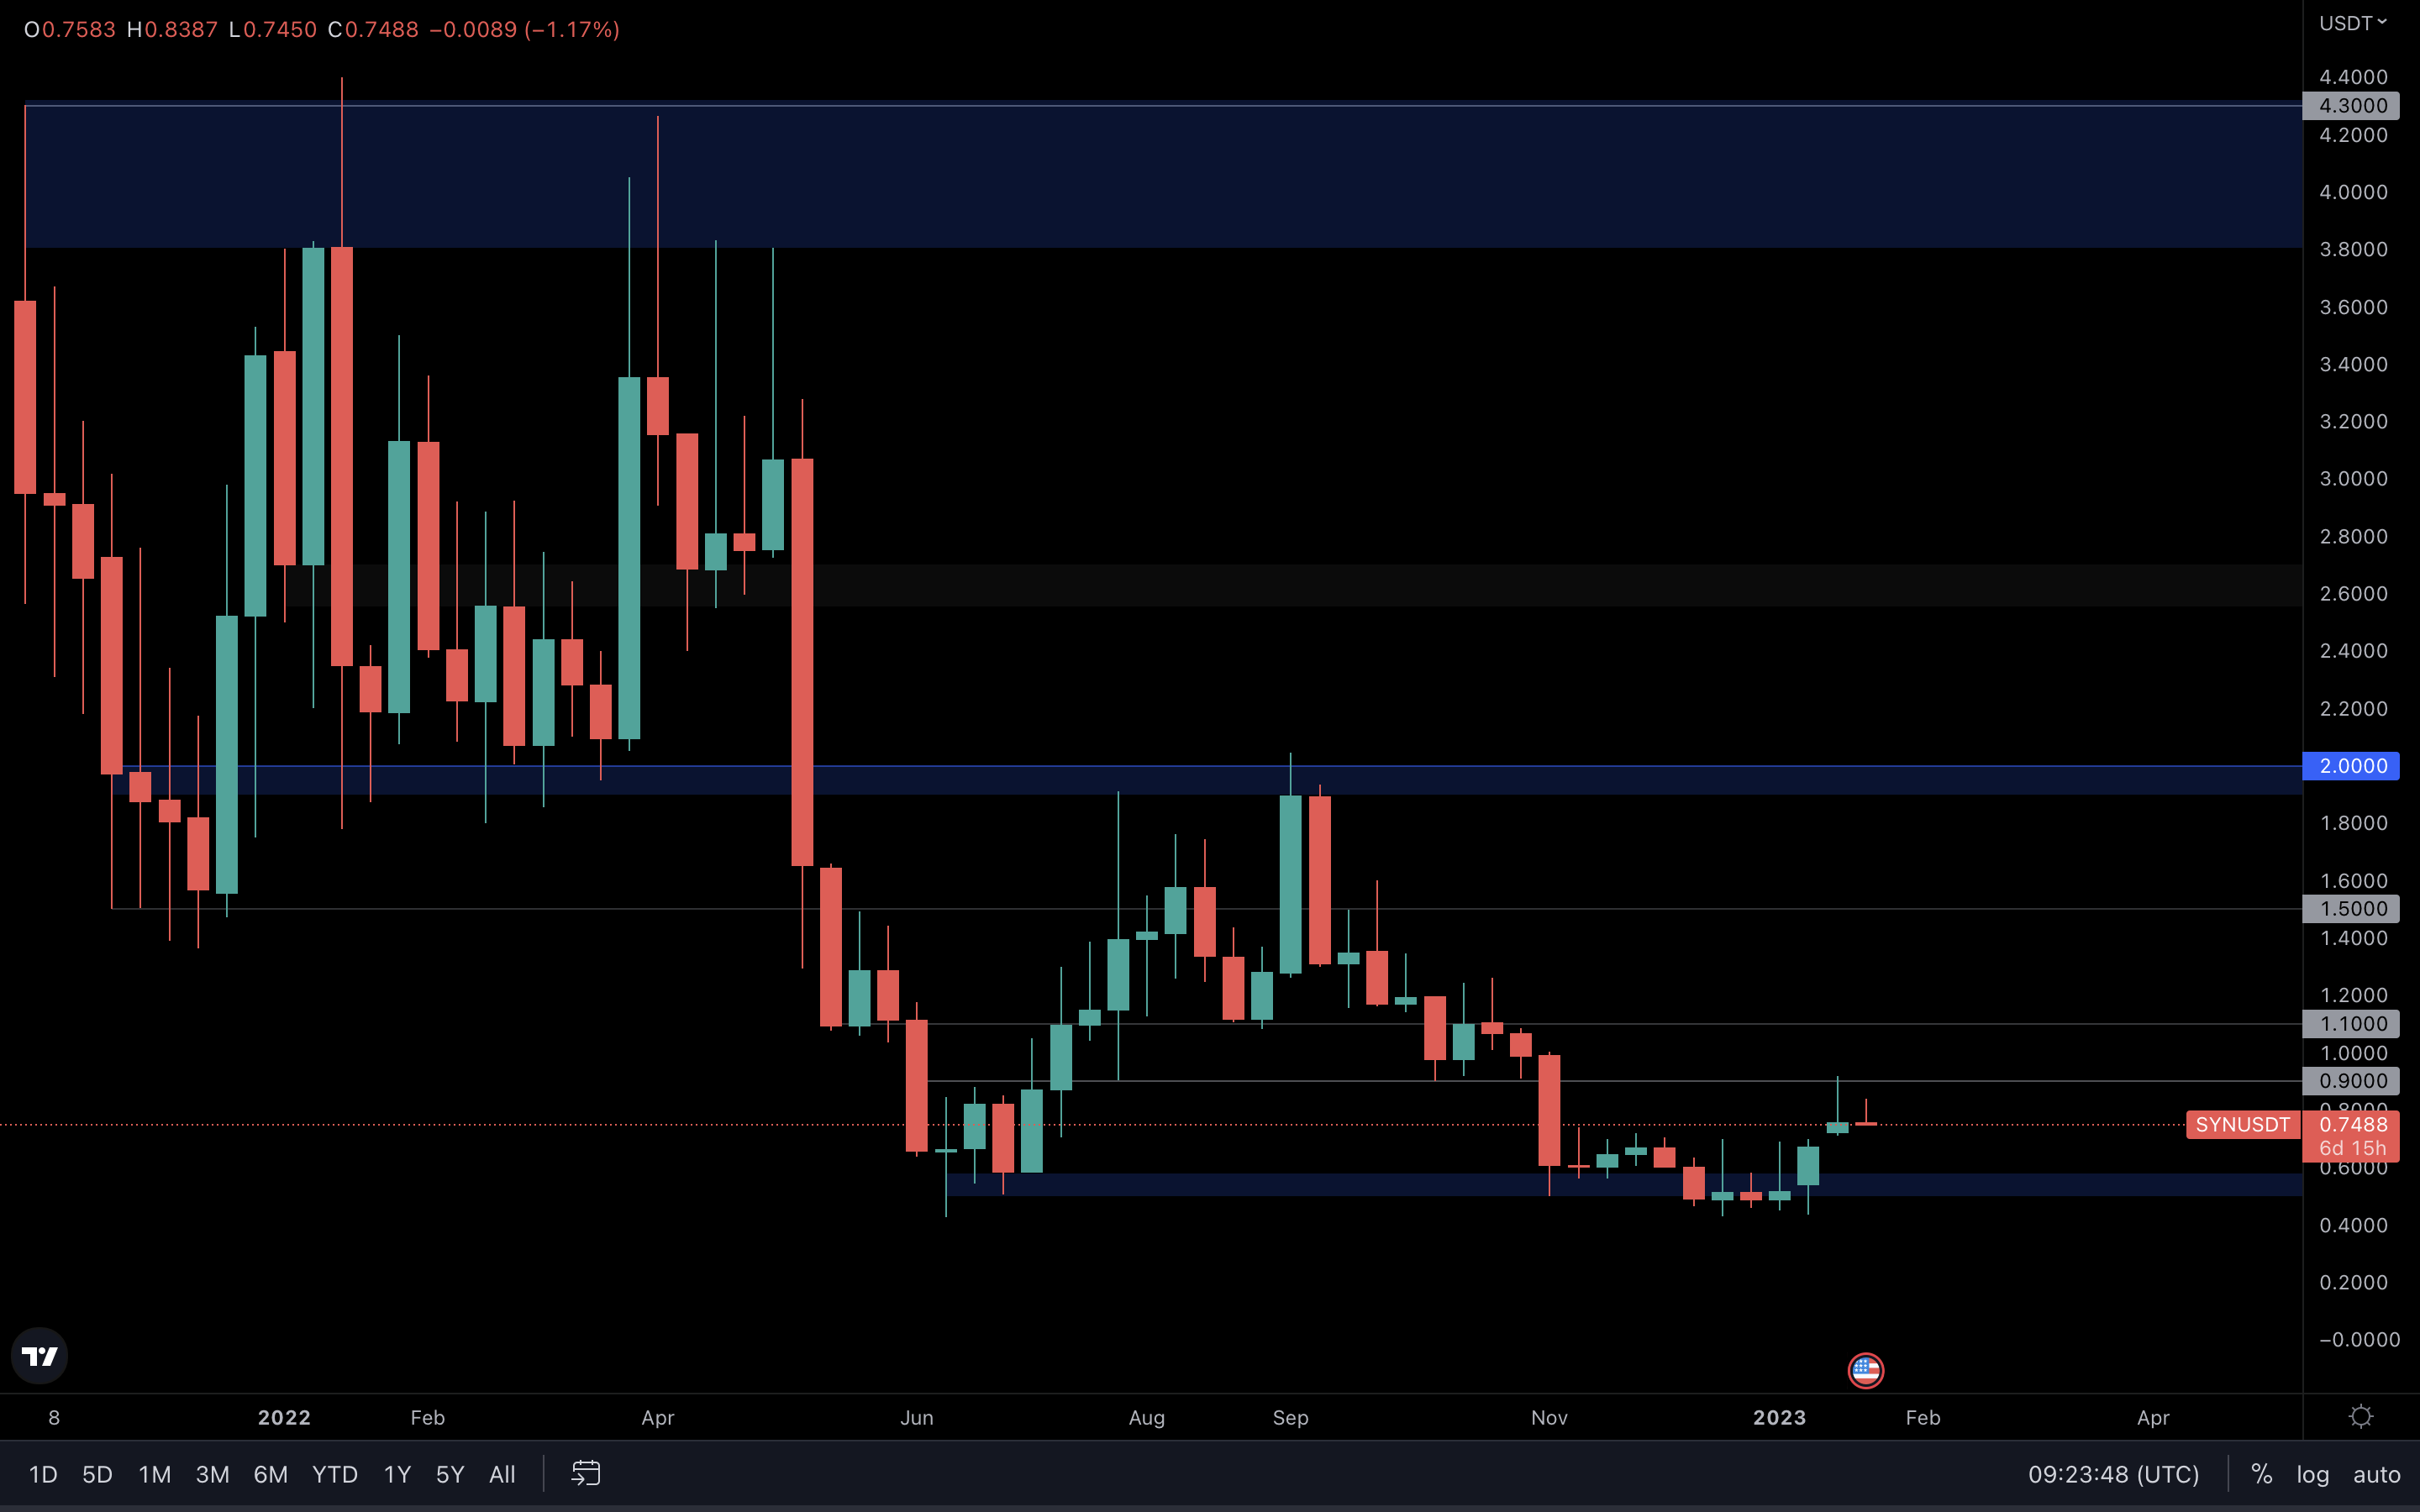
If we do not see SYN break above $0.90, the asset may range between $0.90, and $0.60 (top of the blue box at the bottom of the chart). For further upside to be confirmed, we’ll need to wait for a break and reclaim of $0.90.
OP | Optimism
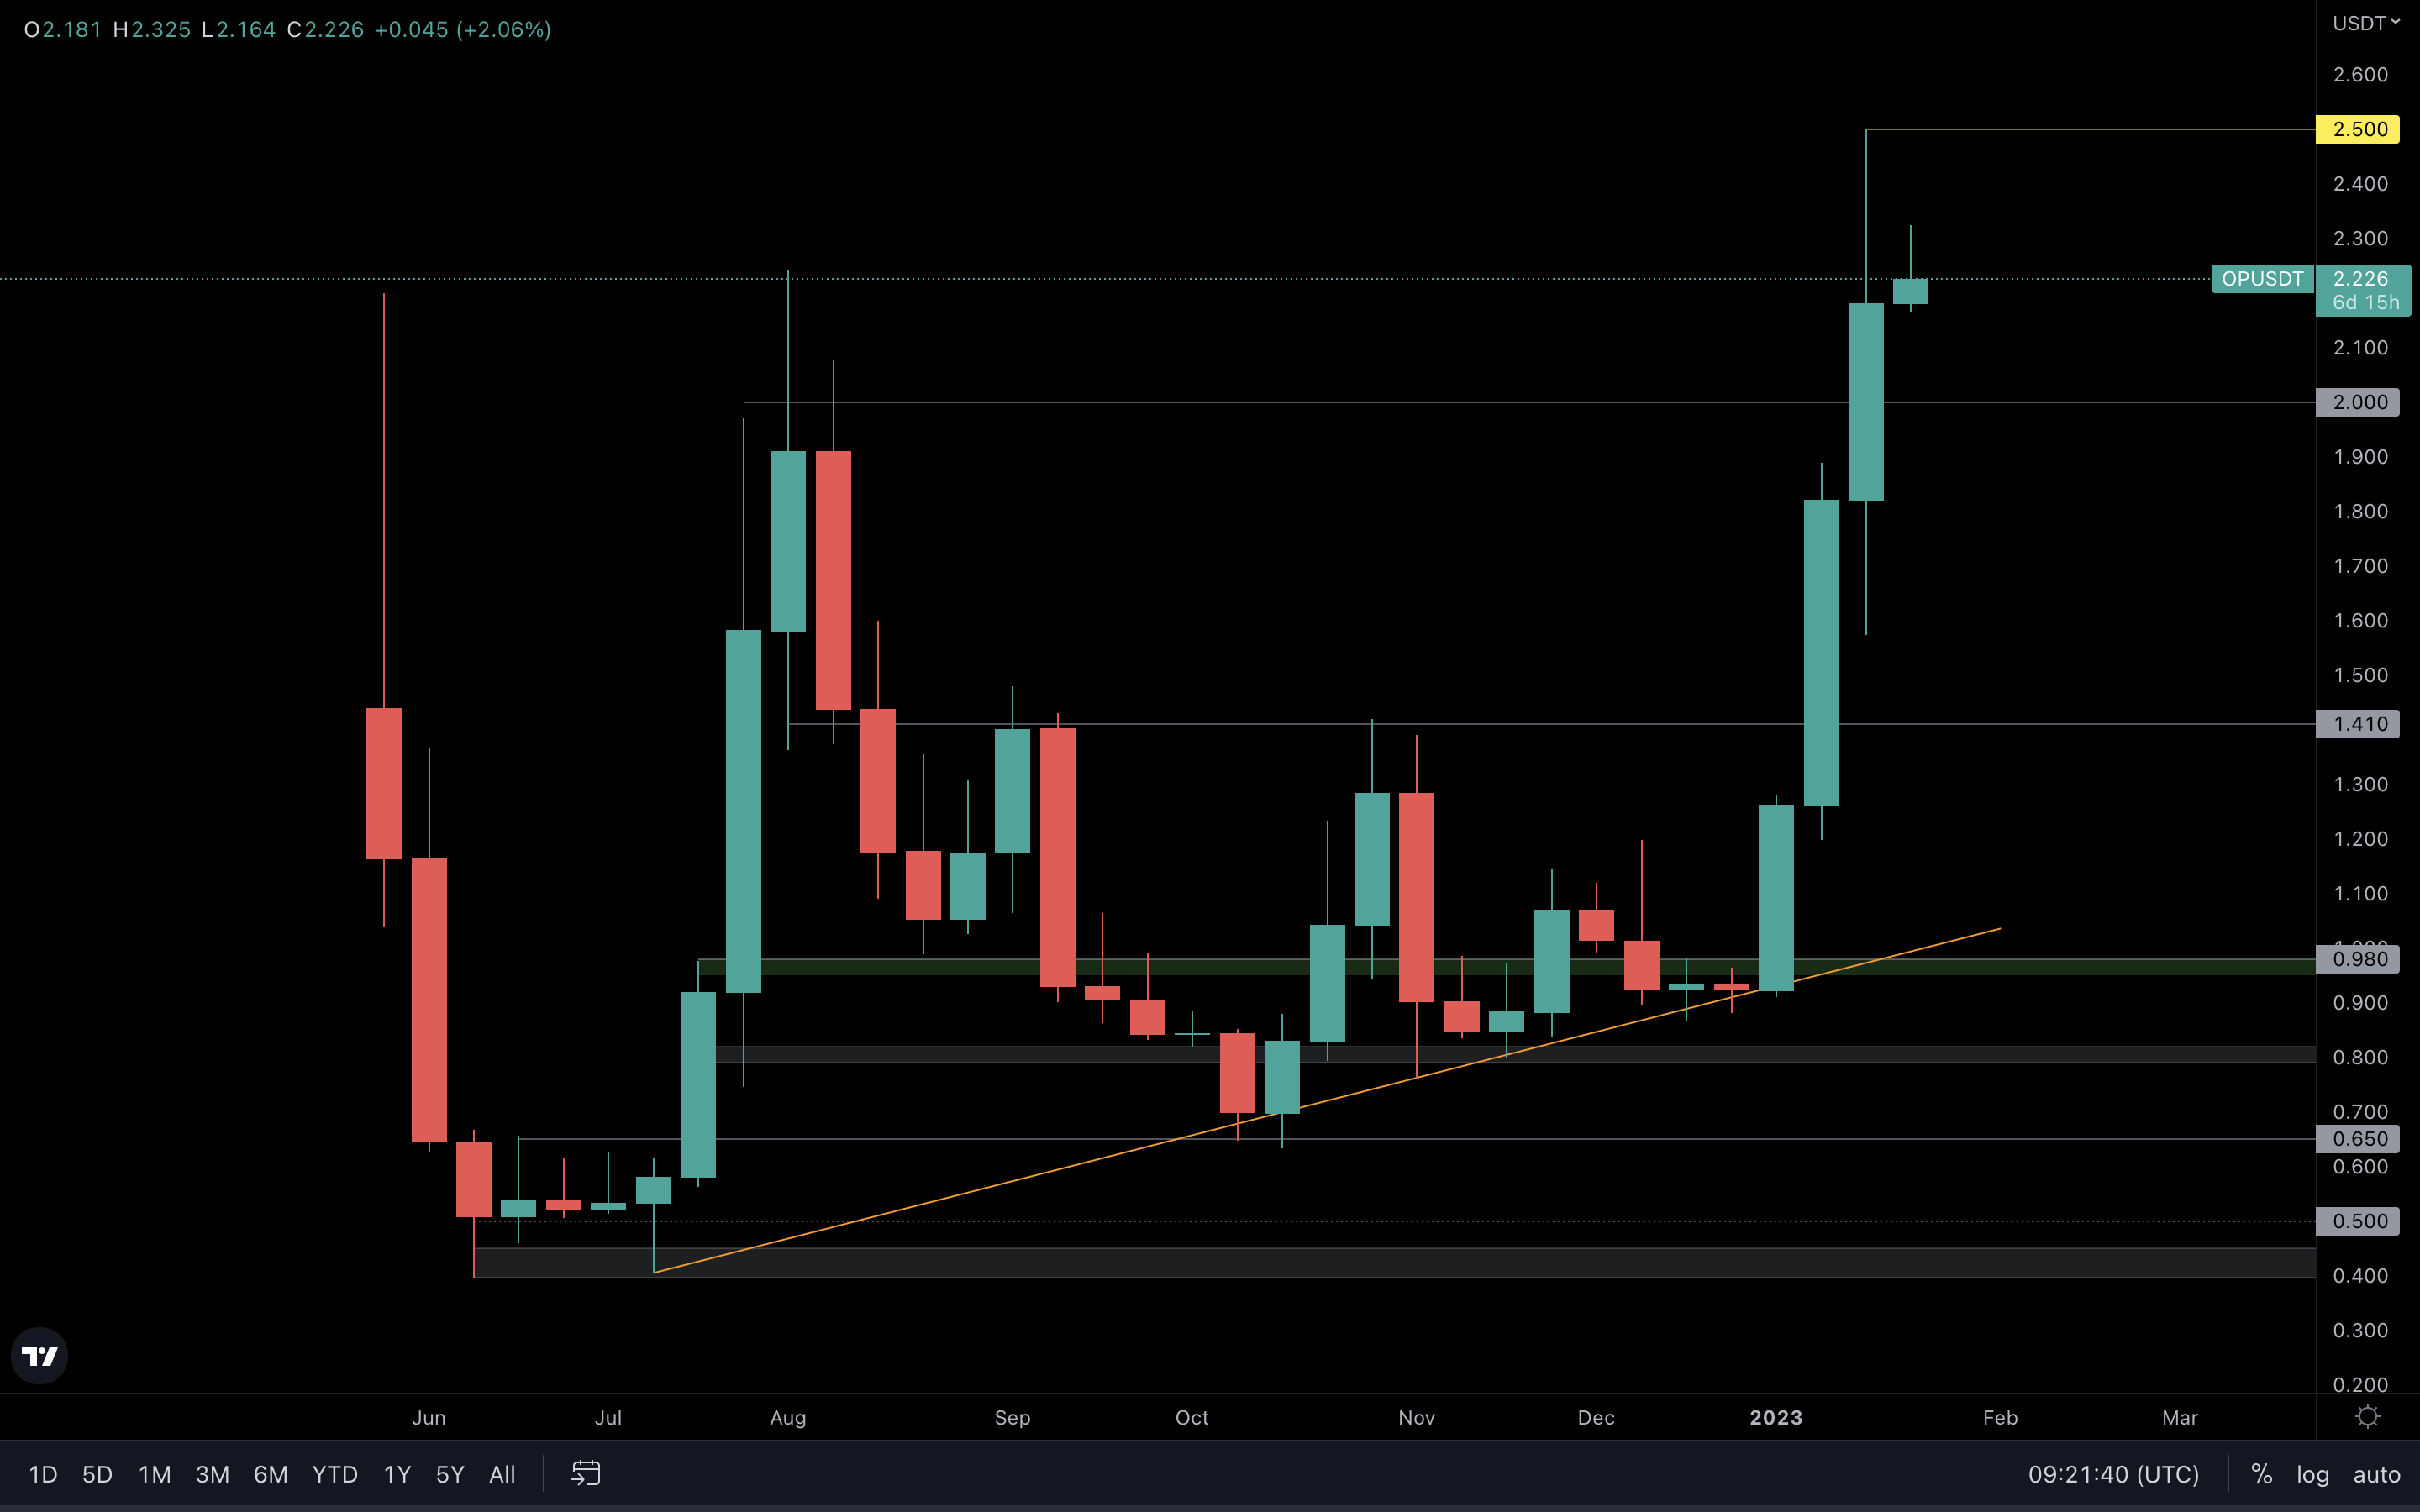
OP has reclaimed $2 on the weekly timeframe, flipping it into support. If you check Optimism charts on all exchanges, you’ll see that the last technical resistance was, in fact, $2. This means that on the way up, OP will encounter psychological levels as resistance, such as $2.50, $3, $3.50, and so on, instead of historically-tested levels.
The first psychological level was tested last week at $2.50, and it’s likely OP will range between $2 and $2.50 for some time before picking a direction. A loss of $2 or a break above $2.50 are the only things of interest to us right now.
LDO | Lido DAO
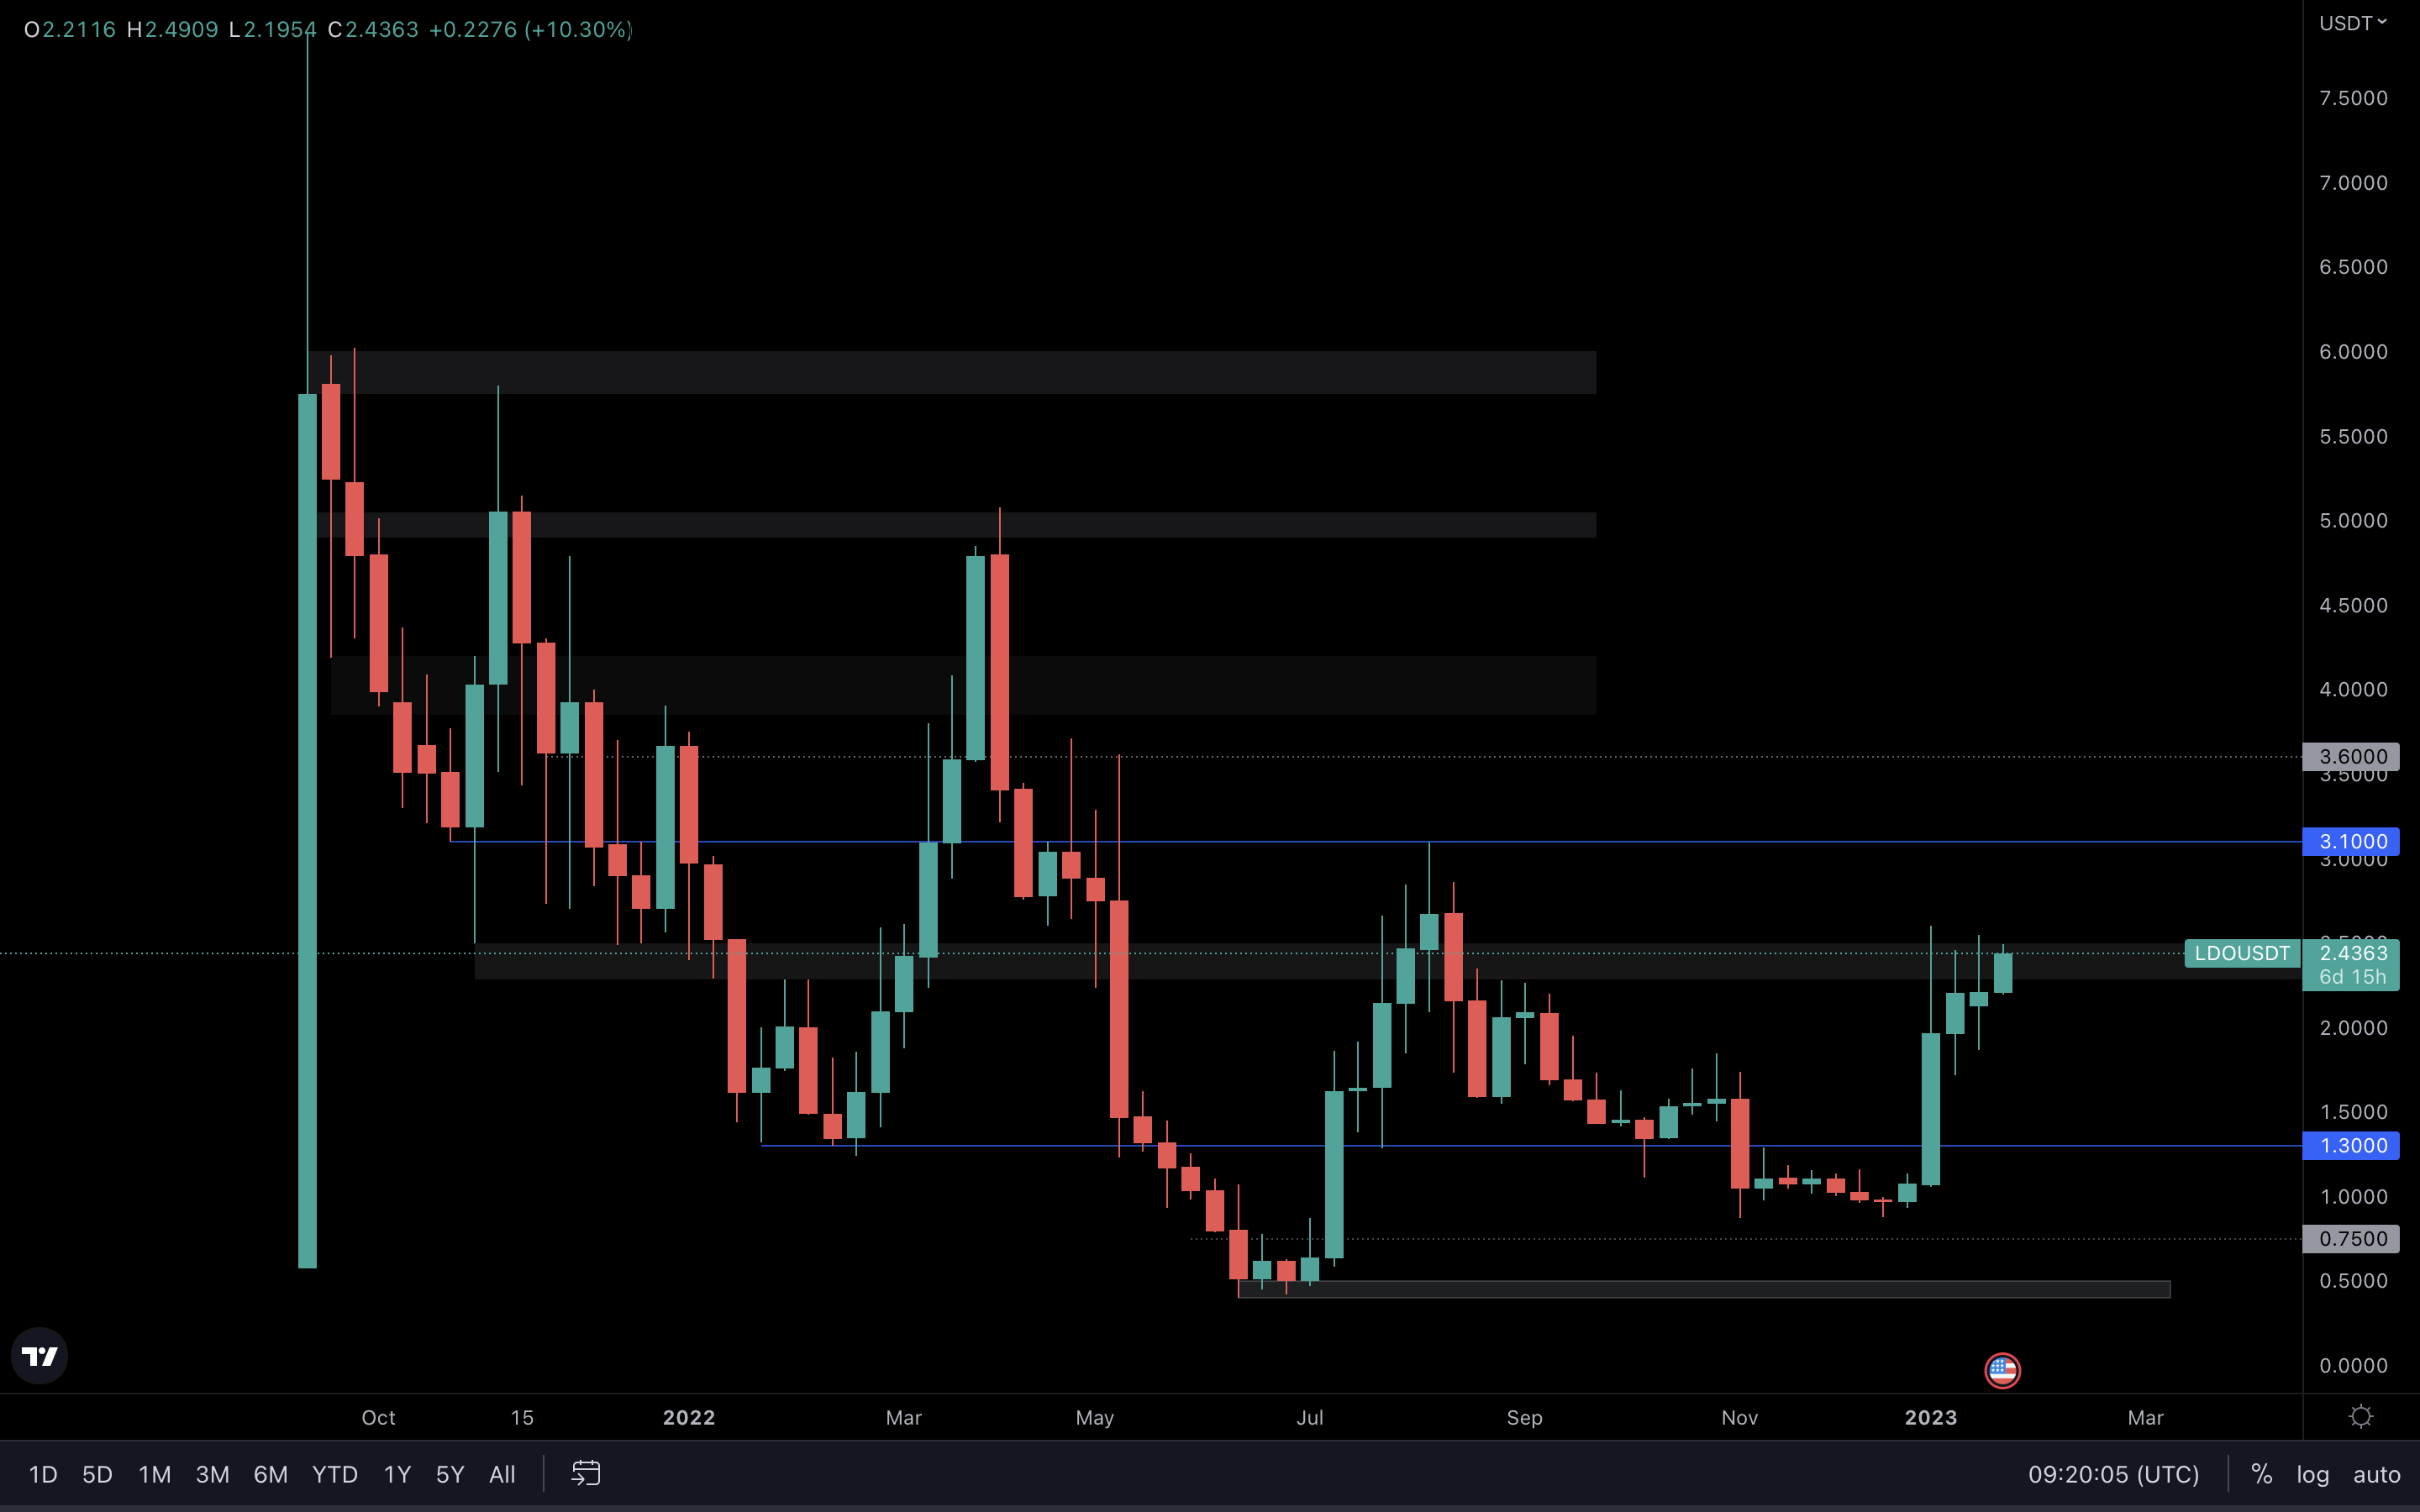 LDO is currently in resistance territory. Once we see a weekly closure above $2.50 (grey box), a move to $3.10 will be confirmed, which is the next line of resistance. A weekly closure is necessary for this target to be confirmed. Otherwise, LDO is at risk of rejection.
HEGIC | Hegic
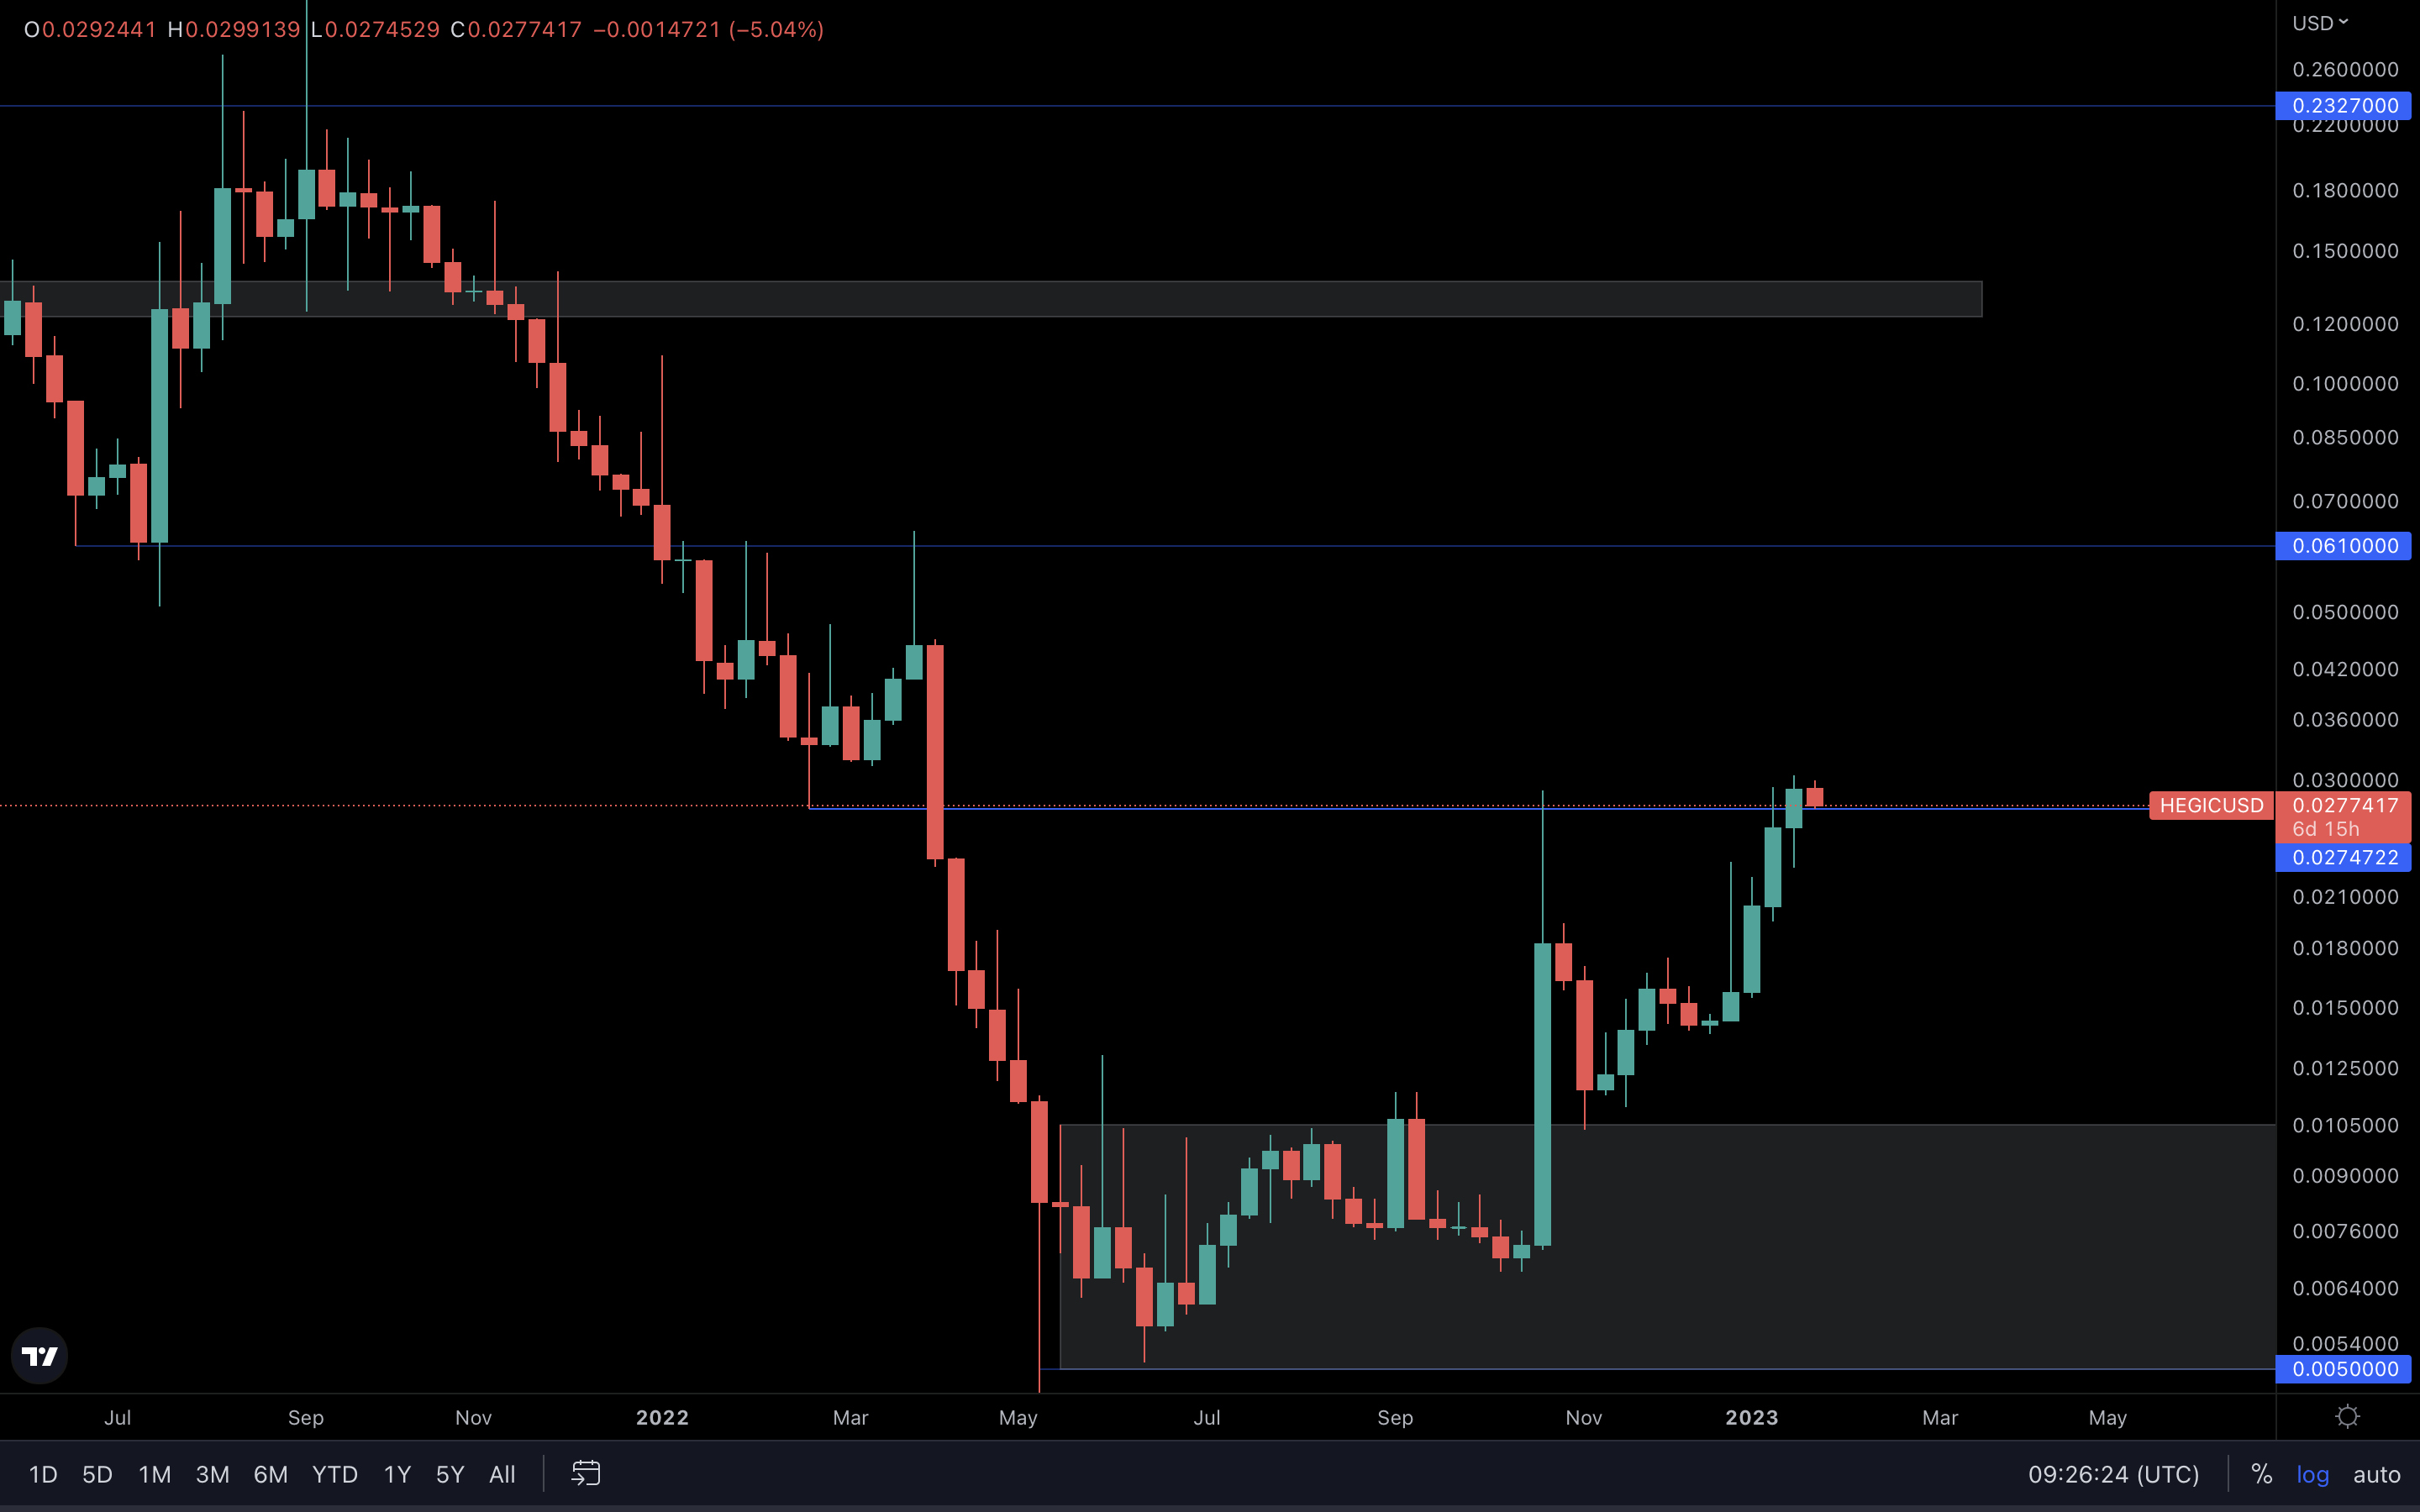
HEGIC closed the week above resistance - holding it as support is necessary if we were to look for higher targets, such as $0.061. The asset is already testing the current level as support, so we should watch the daily timeframe for a better view at this level in the short term. If lost on the daily timeframe, things might take a different turn and reverse to the downside. At this current time, the chart is indecisive, and there are far better opportunities out there.
PREMIA | Premia
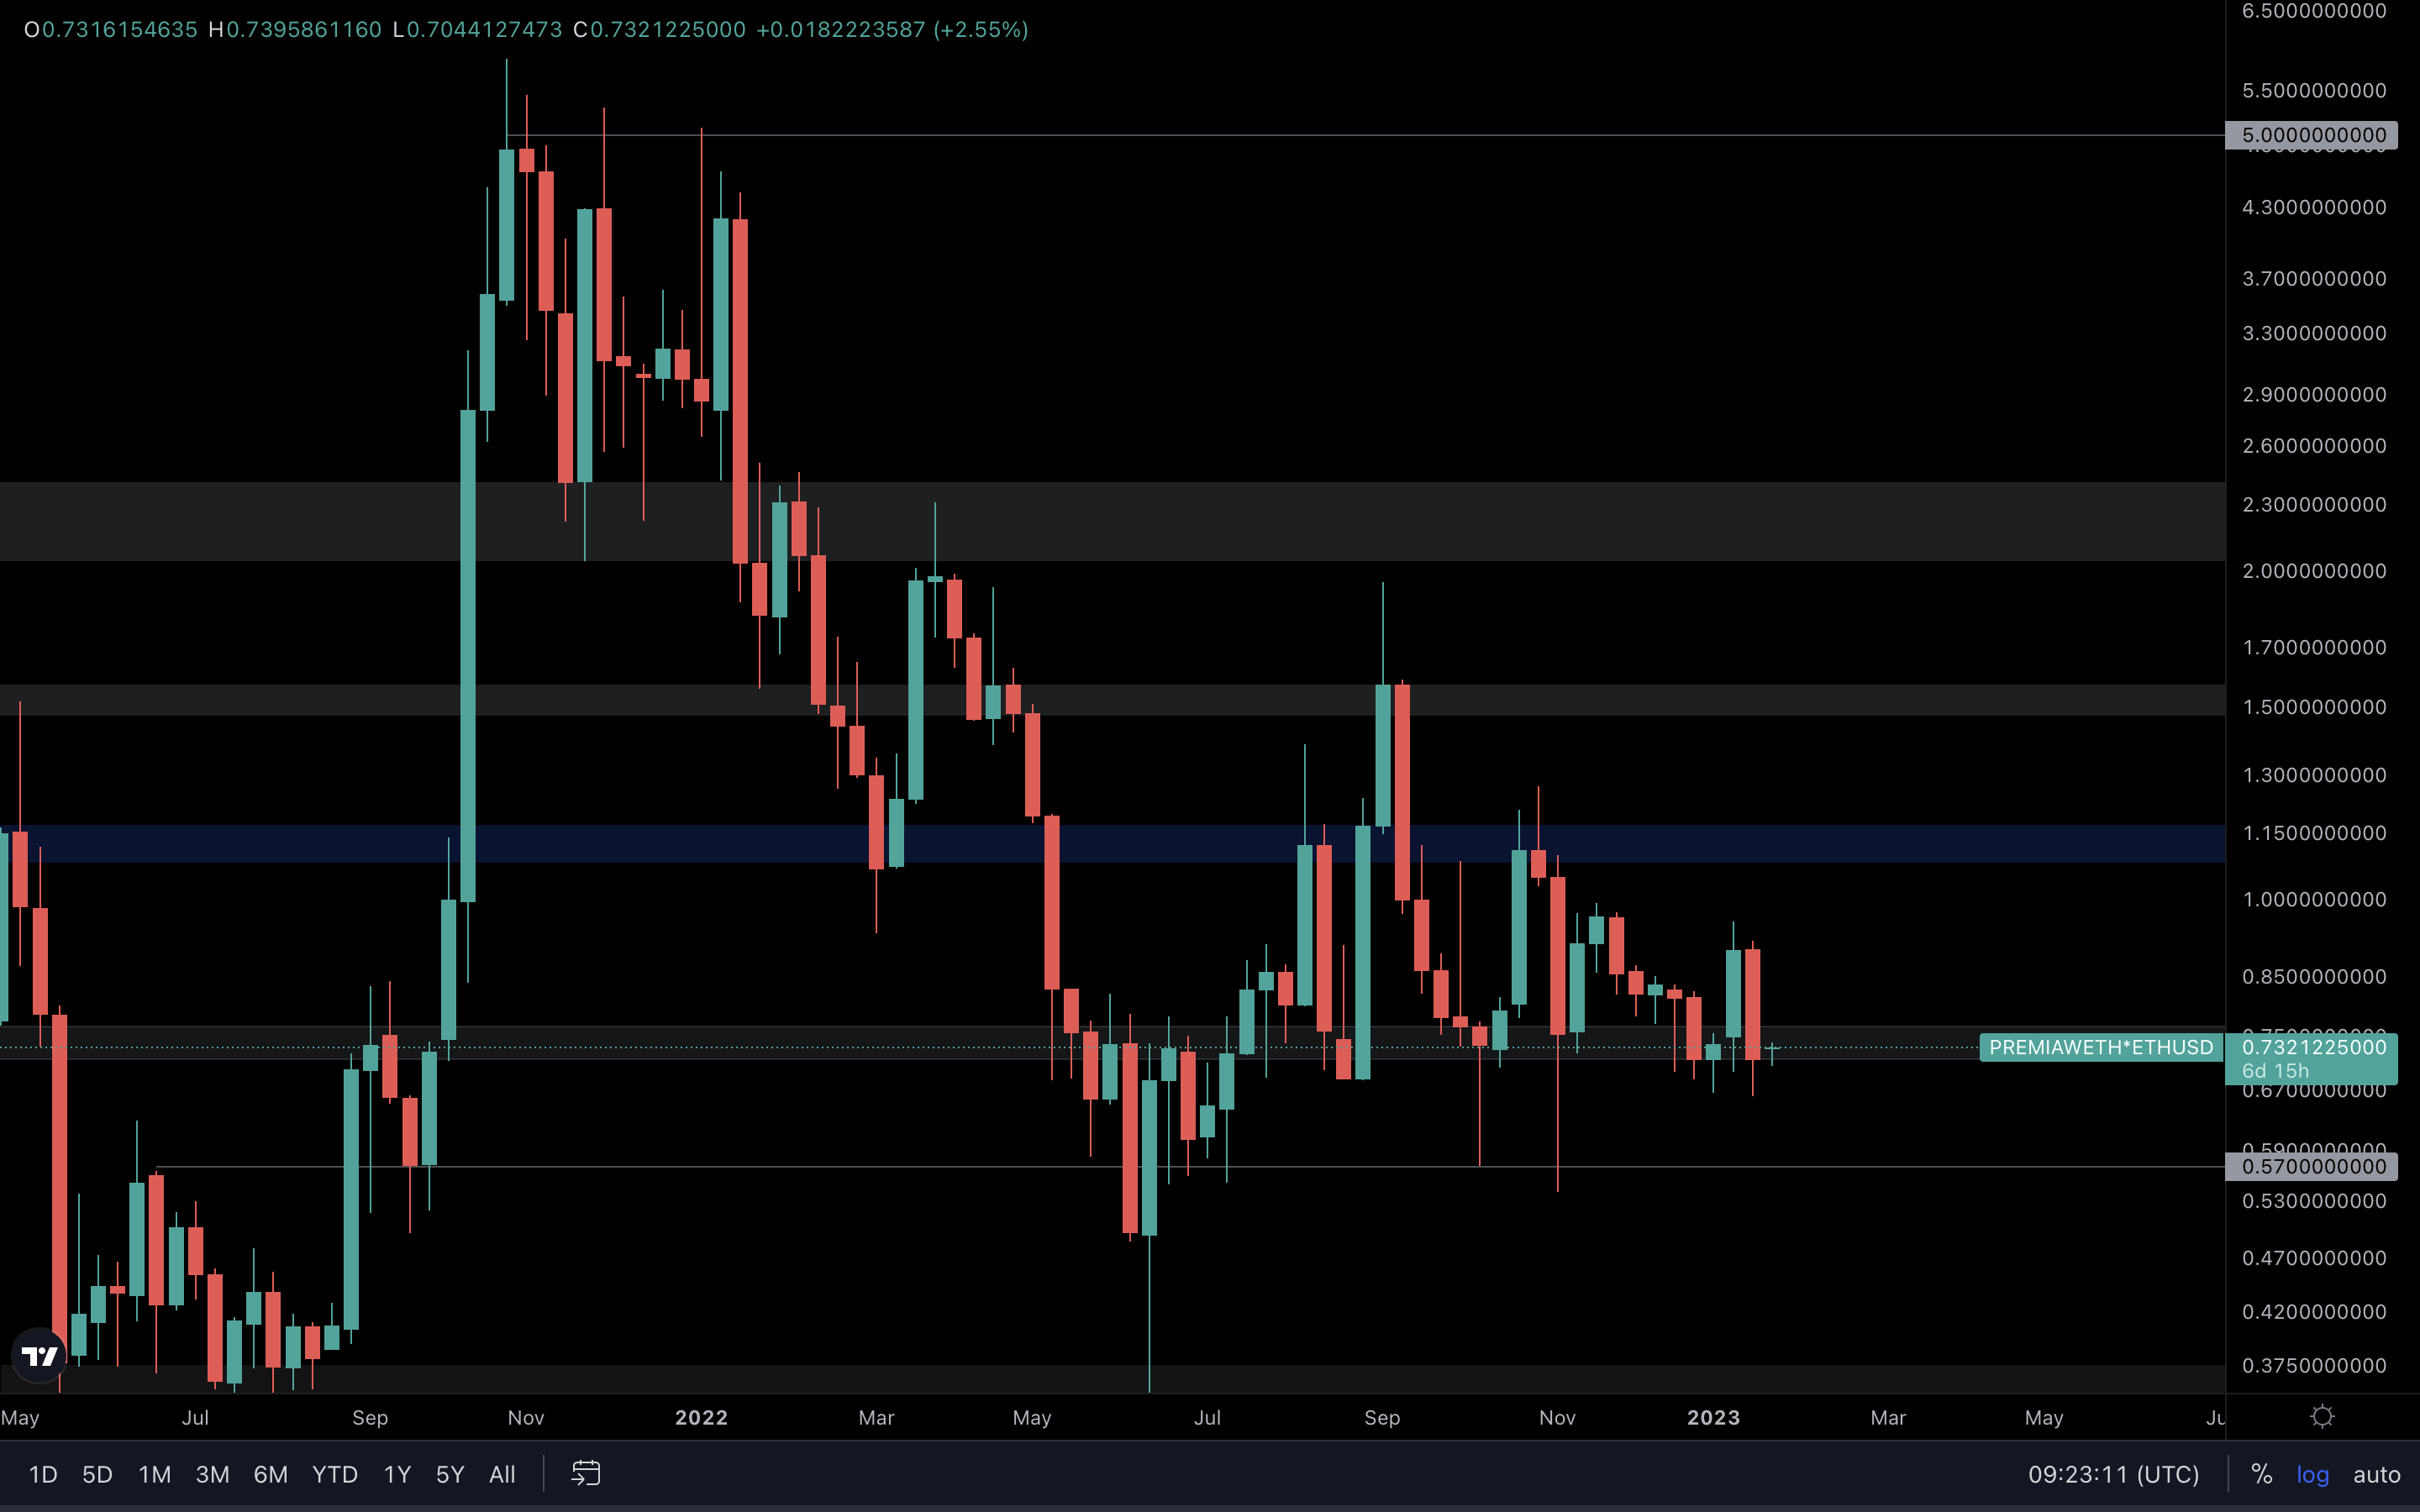
Last week, PREMIA closed as a bearish engulfing candle into support. Engulfing candles are extremely accurate at predicting future movements; engulfing candles formed into support/resistance, however, are not. In this case, PREMIA formed a bearish engulfing candle into support. The possibility of buyers stepping in and invalidating this candlestick is high, which makes it unreliable, and indecisive. With that said, we’ll need to wait for this week’s closure for more confirmation.
ASTR | Astar
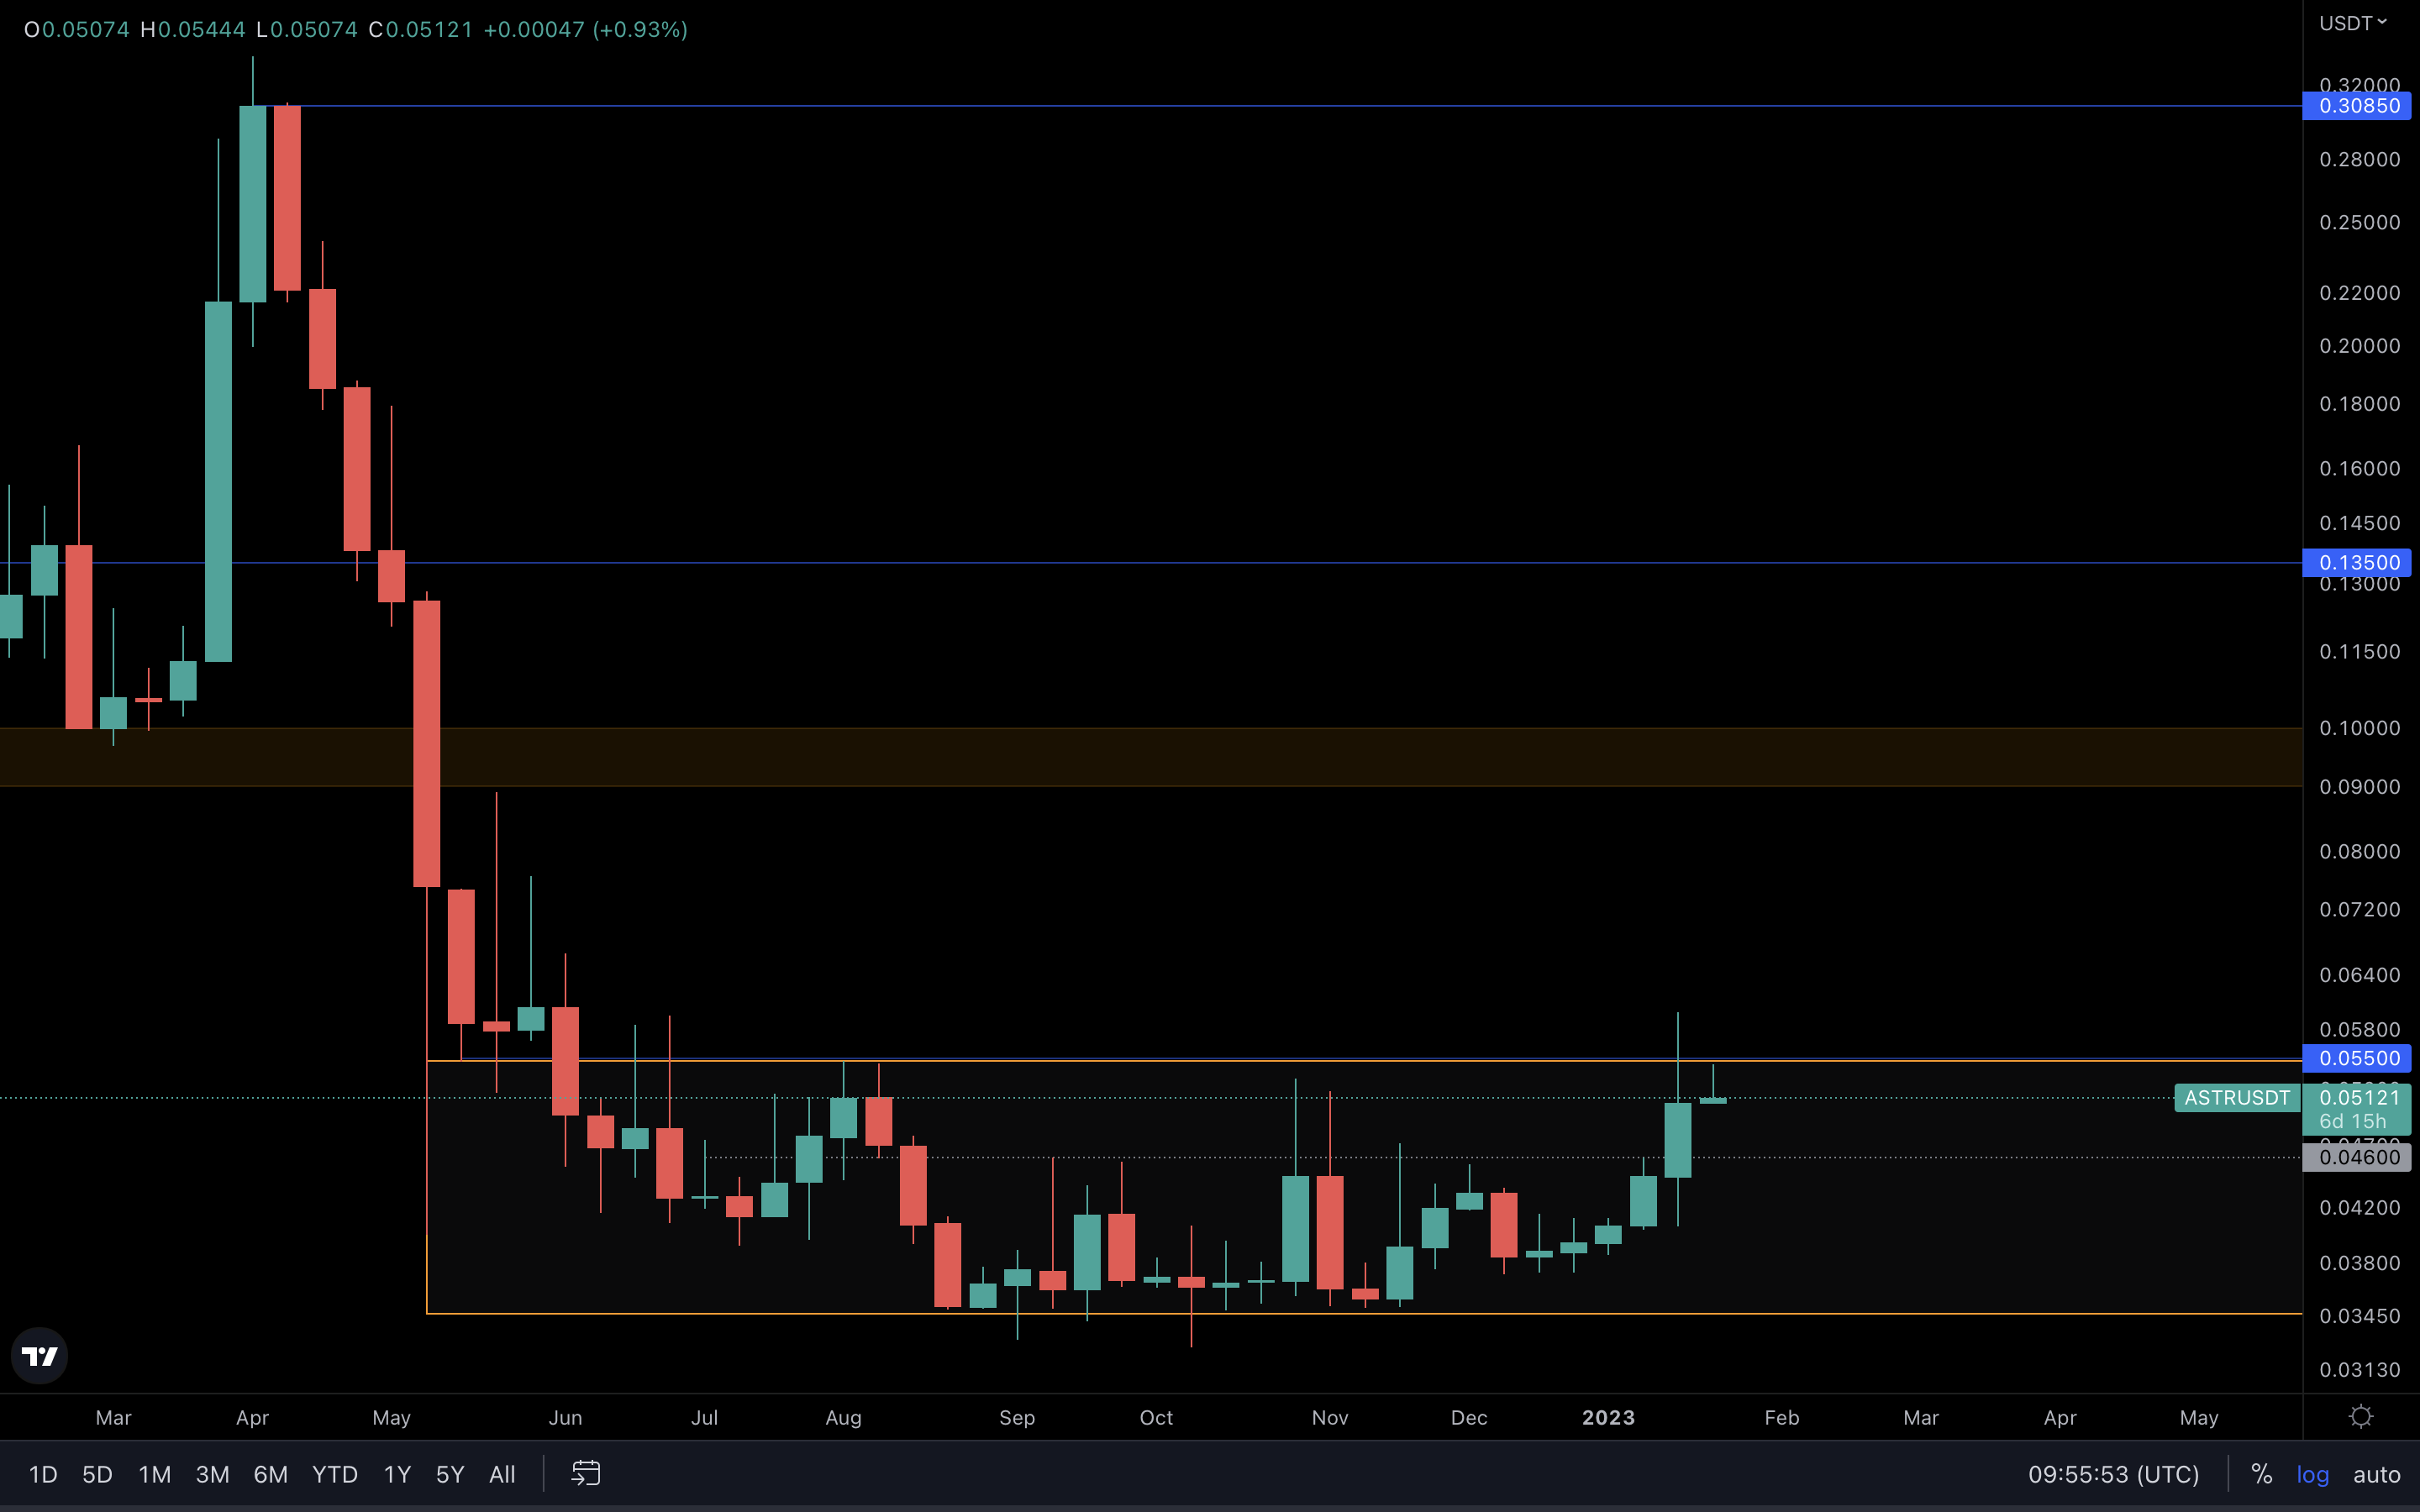
The orange box on this chart is an accumulation area in which ASTR has been trading for the past 7+ months. Last week, we saw buyers step in and push the price above the box, but they could not close the week above it.
We’ll need more data to confirm, but we could be looking at a potential breakout from this accumulation area that could lead ASTR to the orange box above, between $0.09 and $0.10.
THOR | THORSwap
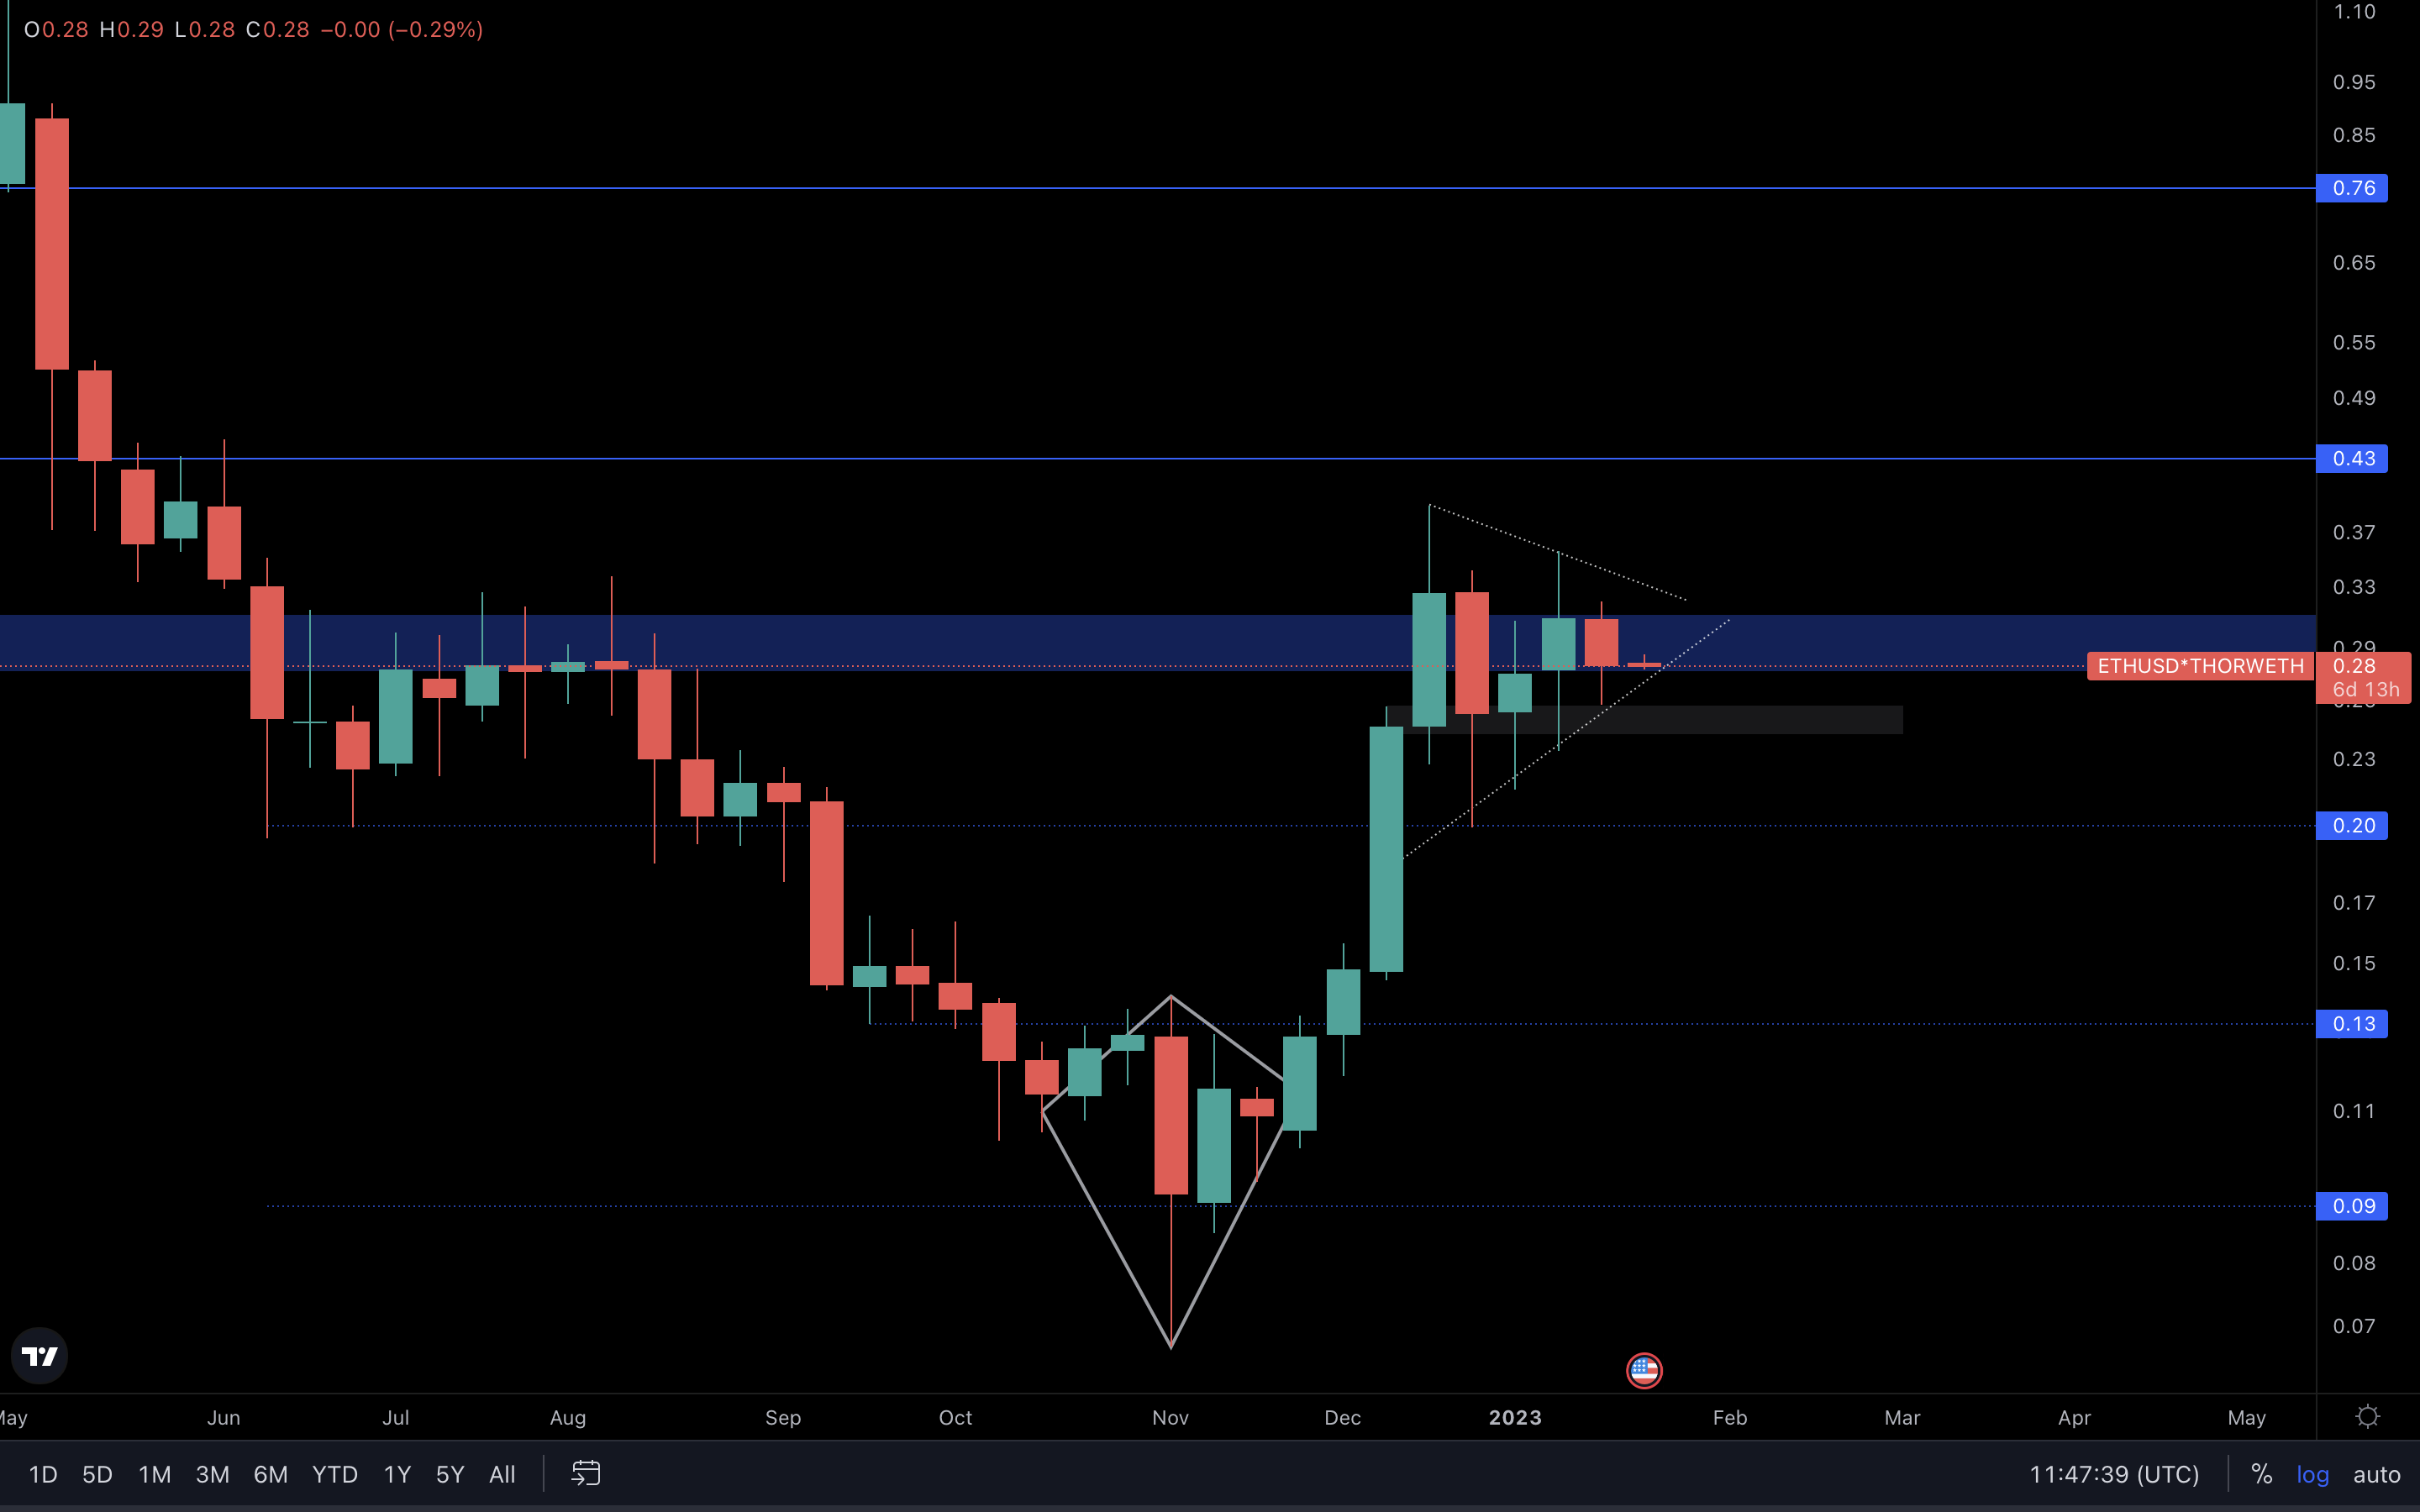
THOR has been ranging near the blue box for five weeks and looks to be a symmetrical triangle. A better view of this pattern can be seen on the daily timeframe, which we’ll share as context below.
At this time, there’s nothing to see on this chart other than a potential break from the triangle. Symmetrical triangles are known as neutral patterns. A break can occur in either direction based on the current market conditions, so the break will mainly be influenced by the majors’ price action.
If THOR breaks to the upside, $0.43 is our first resistance line. If THOR breaks to the downside, $0.20 is our first significant line of support, as the little grey box you’re seeing will likely be broken easily.
MINA | Mina Protocol
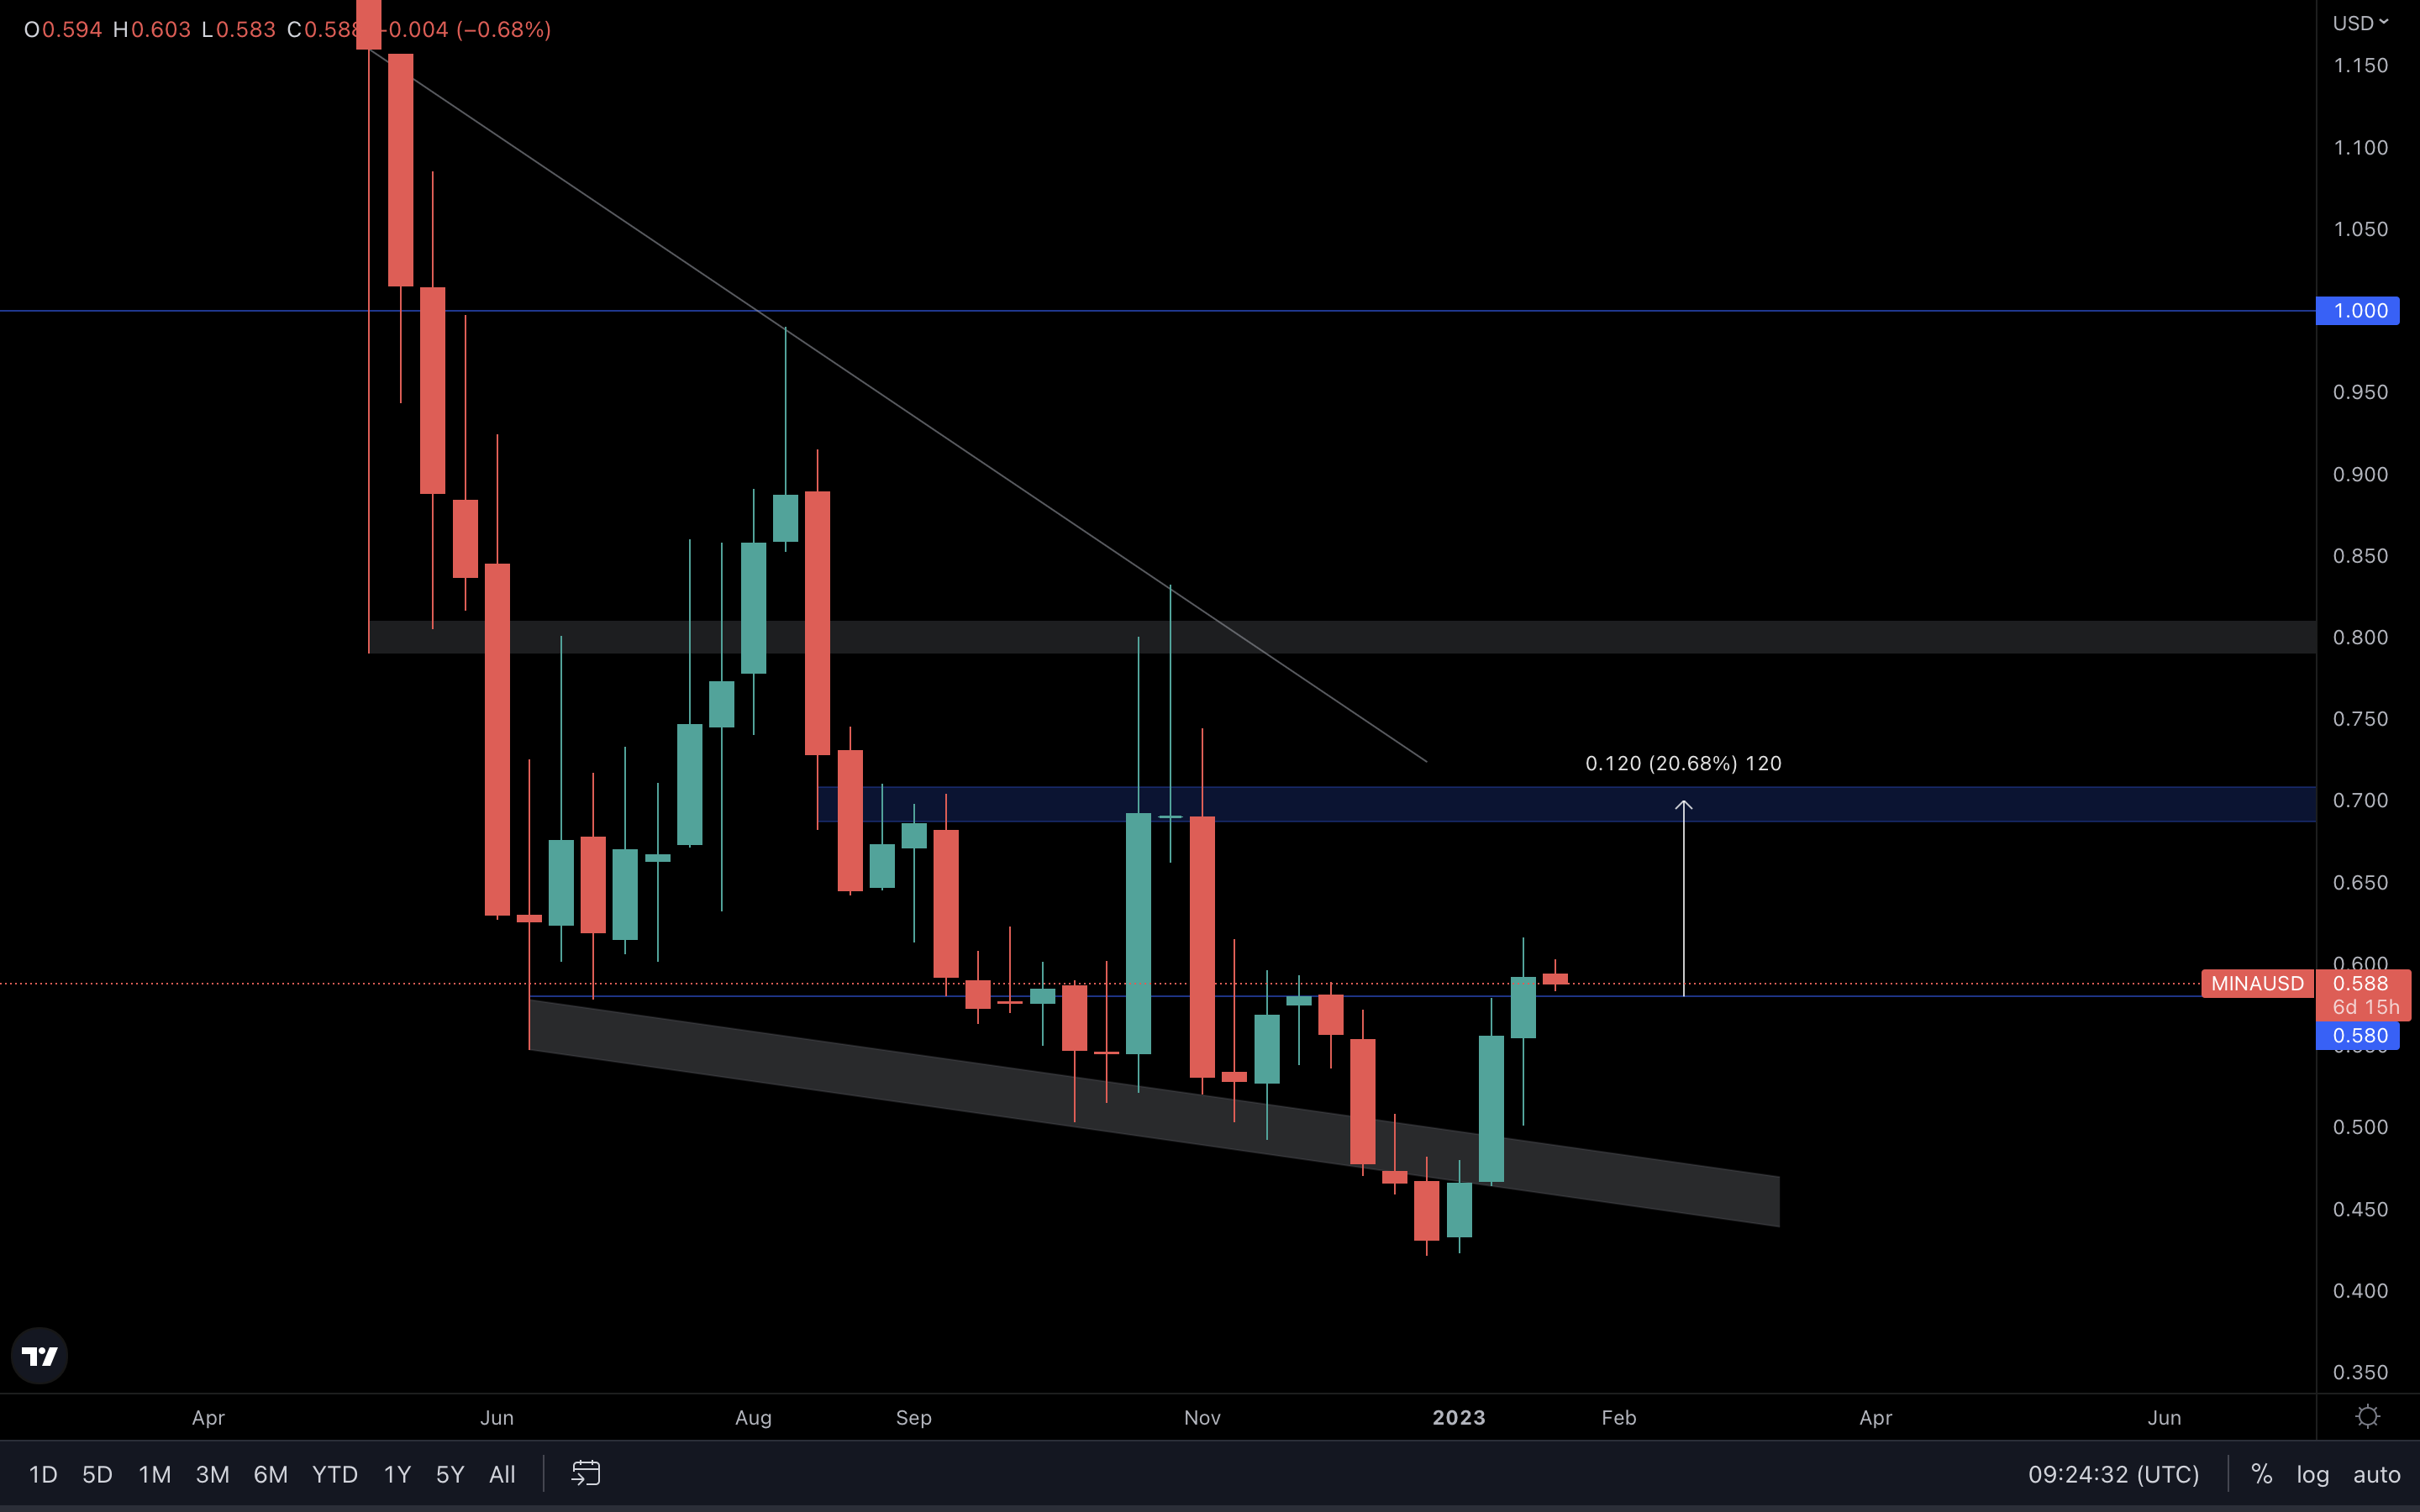
Last week, MINA closed above the $0.58 resistance level. For MINA to continue going to the upside, specifically to the first resistance of $0.70 (~20% away from $0.58), the asset needs to hold $0.58 as support successfully.
We’ll need to see MINA bounce from this level to validate a move toward $0.70. Otherwise, a bad-performing BTC could push the price of MINA under the support and invalidate the reclaim.
Cryptonary’s take
Q1 and potentially Q2 of 2023 will bring significant returns across the market. In these times, it’s critical to understand which assets will likely outperform and give you the best returns. Luckily, we’re already doing that for you.
- The bottoming process will span over multiple months, and this rally will definitely not bring us to all-time highs.
- Opportunities may arise from time to time, but they won’t be there waiting for you forever. Make sure you grab them while you can.
- Take profits on the way up. Don’t get greedy. Stay humble.
Recommended from Cryptonary


