Save 23% ($351) & Get a Free 1-1 Call with our Team ⏰ : 0d 2h 59m 43s
Our answer is YES, but there’s still one thing that needs to happen first, and it’s essential that it does happen. Let’s see what it is…
Disclaimer: Not financial or investment advice. You are responsible for any capital-related decisions you make, and only you are accountable for the results.
TLDR
- The Total Market managed to close last week’s candle above $1.03T. From a technical standpoint, this leaves room for further upside.
- Bitcoin’s weekly market structure remains bullish. Unless we see a break in structure, we expect an upwards trajectory for the rest of Q1 and Q2.
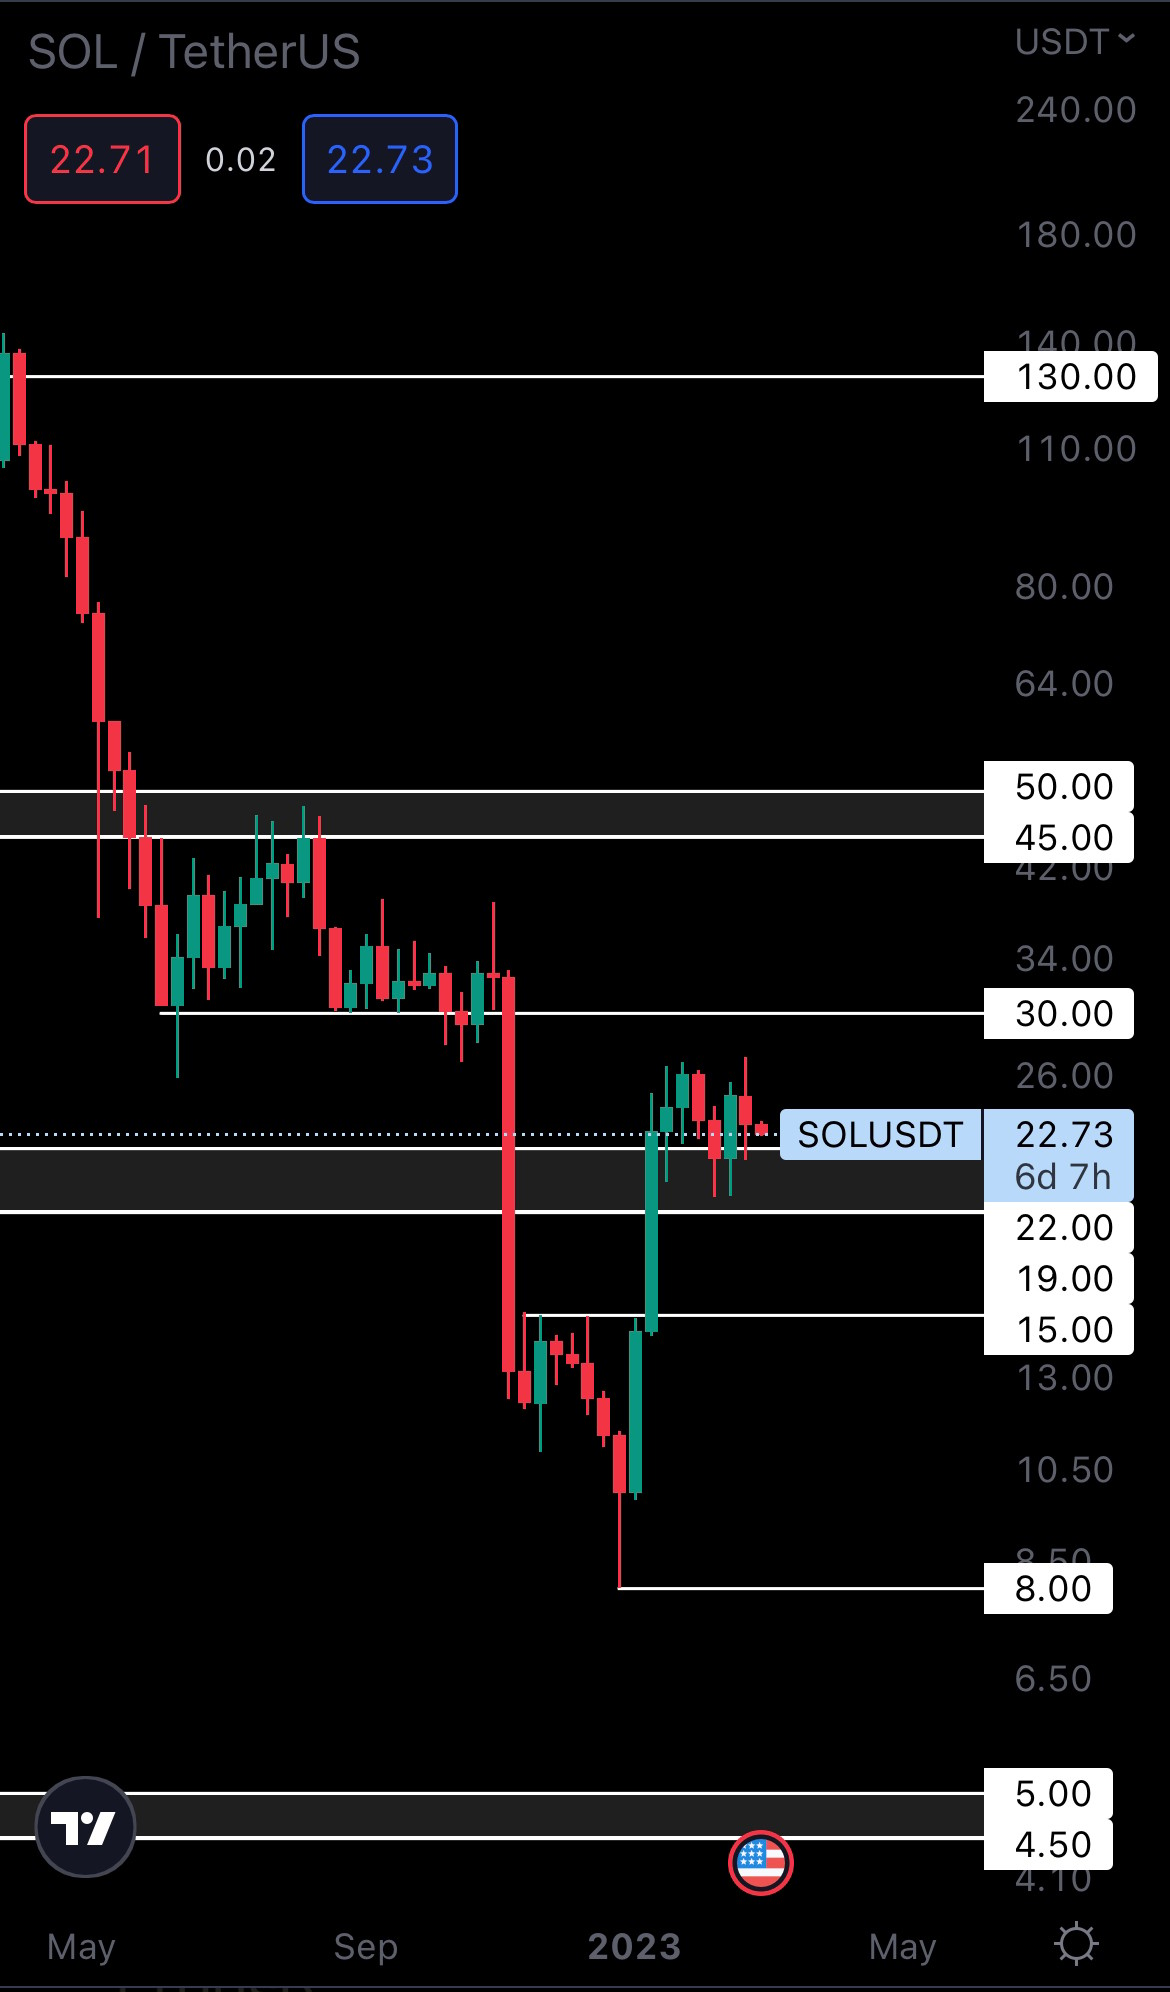
- $1.67 has been lost as support for RUNE. This opens up the road for a drop to $1.43.
- DYDX could be preparing for a breakout. All eyes on deck, as this could be a juicy opportunity in the short-term.
- SYN was unable to close above resistance ($1.50). This increases the odds of the asset going down.
- Both OP & LDO closed into resistance. We’ll need to wait for a weekly closure above their resistance levels to confirm if there’s more upside on the cards.
- HEGIC is at support ($0.02725). This is a great entry point for a swing trade.
Total Market Cap (Weekly)
The Total Market Cap index represents the entire cryptocurrency market valuation. We track this index to understand where the market is now and to predict where it will likely go next.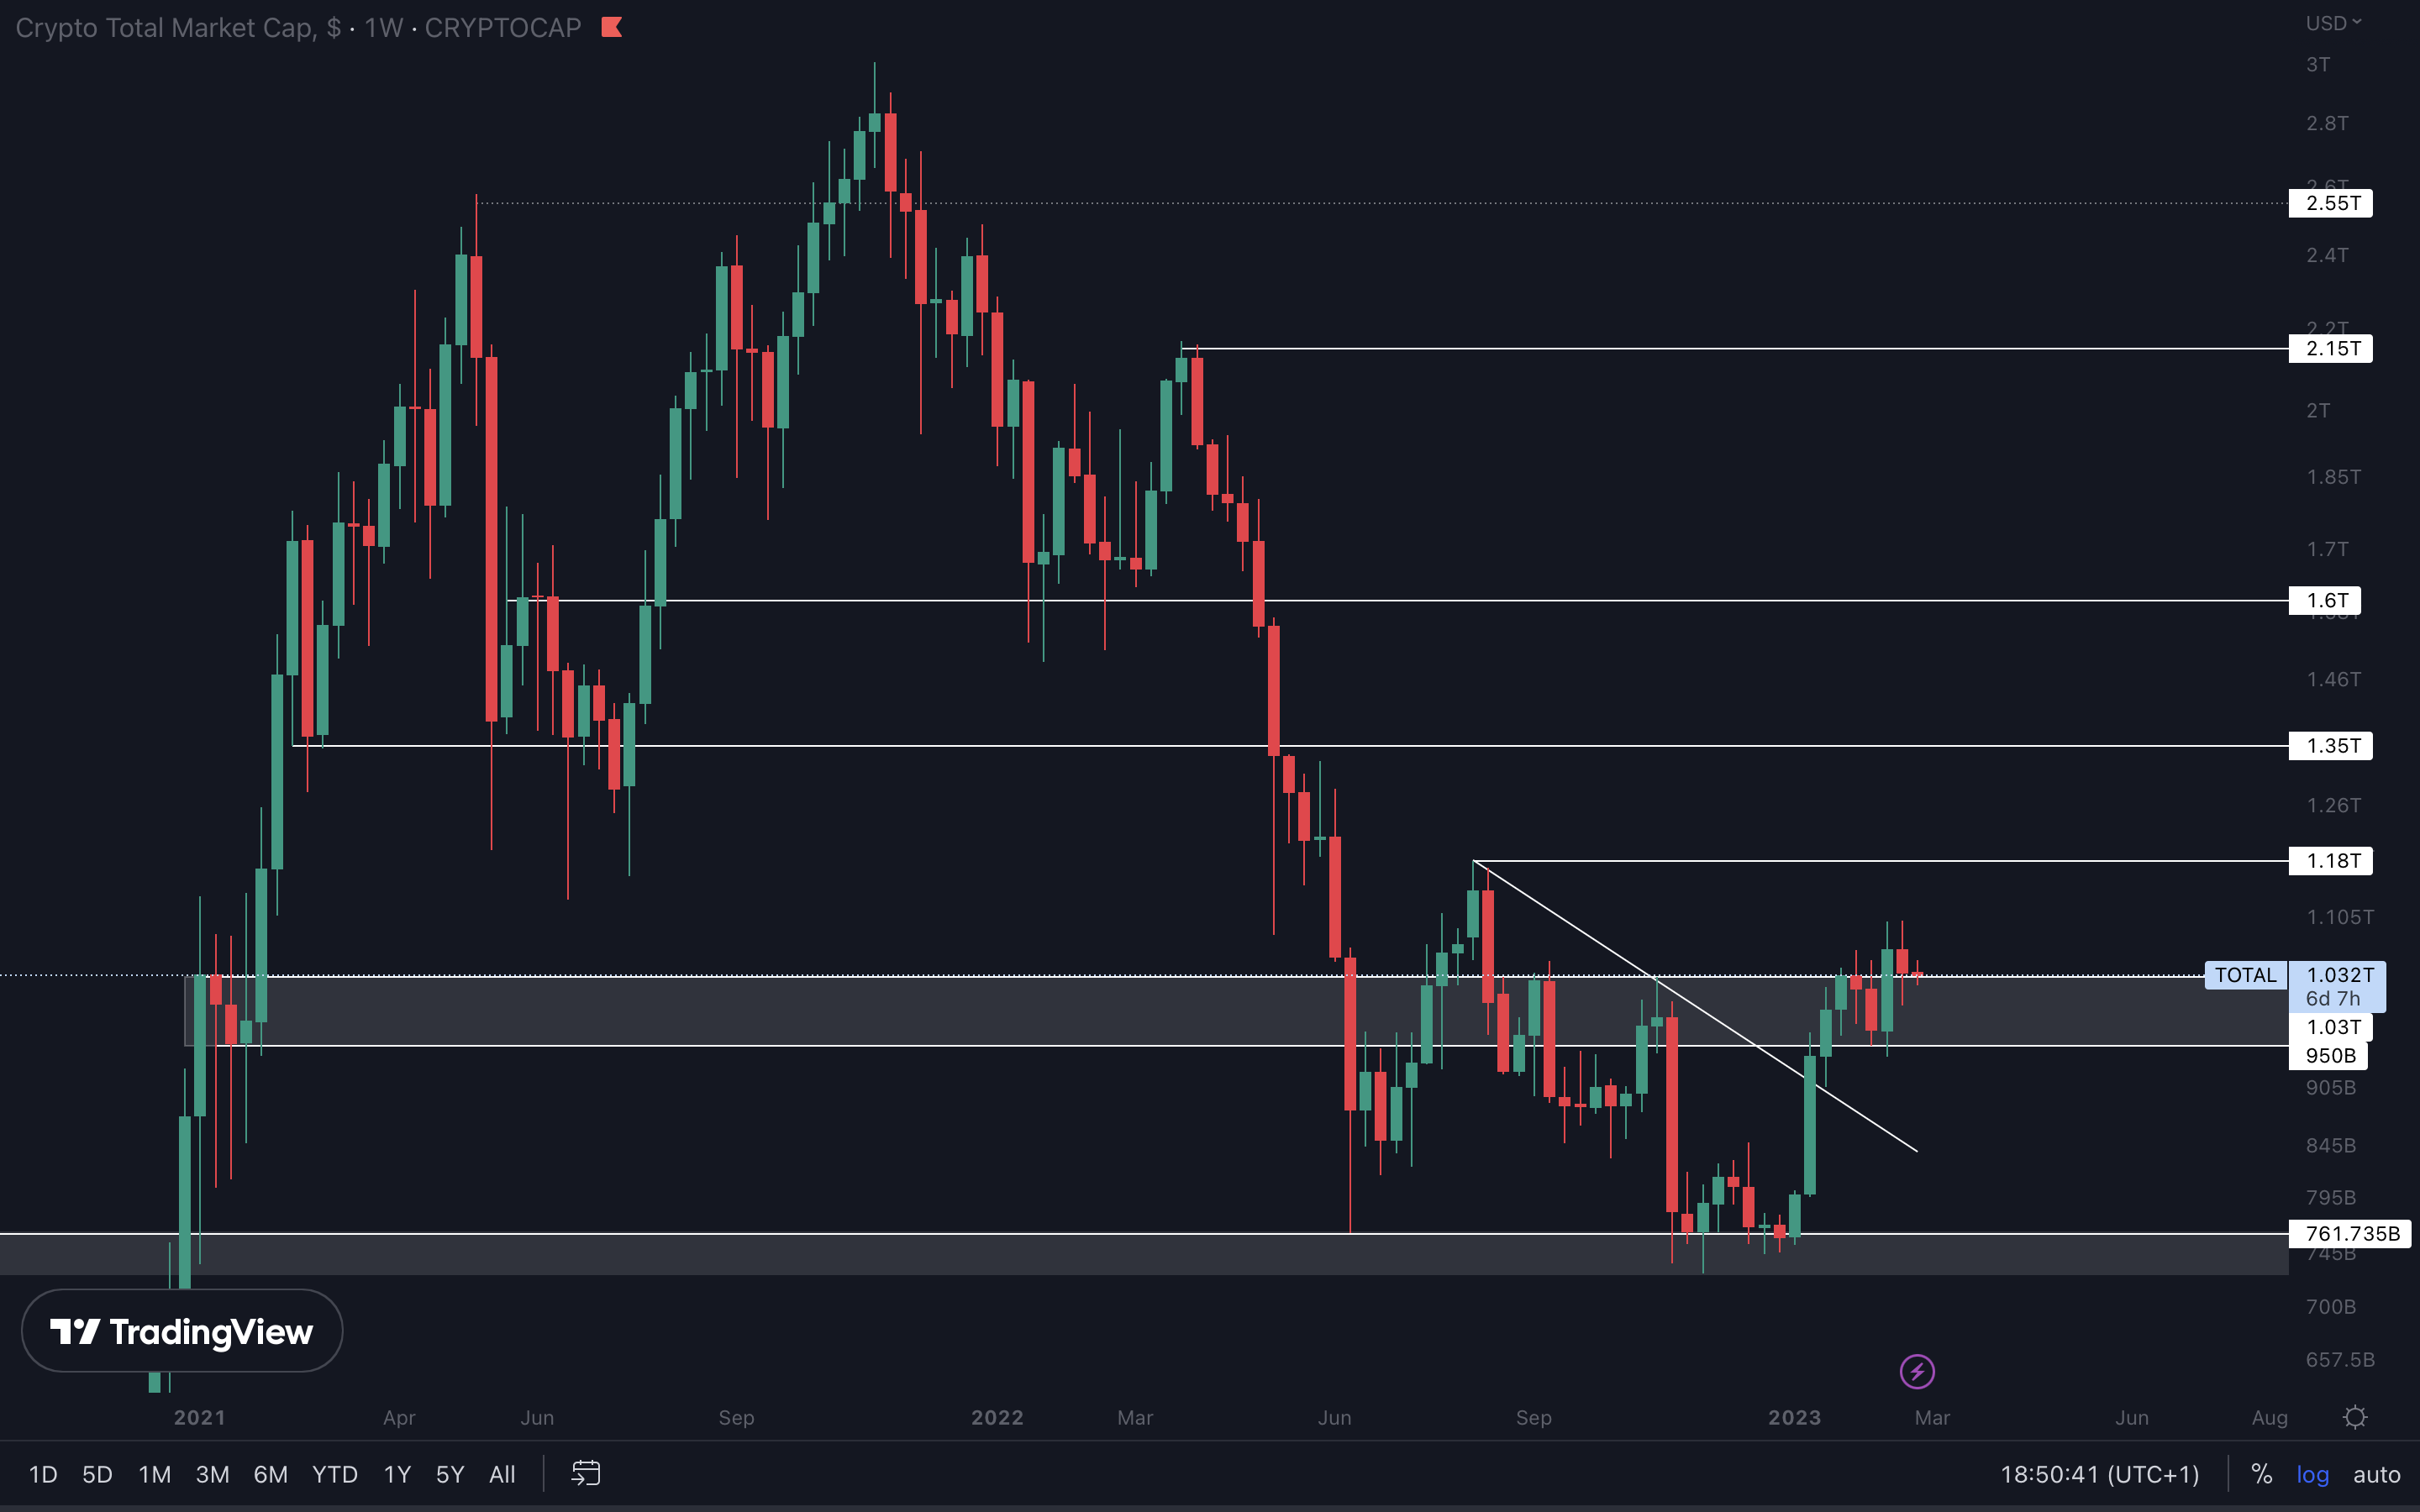
The Total Market Cap managed to close last week’s candle above $1.03T, which now flips this level into support. From a technical standpoint, the crypto market should be heading to $1.18T and $1.35T respectively. The weekly market structure will remain bullish until the index closes a weekly candle under $950B. That’s where the previous weekly low formed, so only a loss of that level will invalidate the market structure.
Altcoins Market Cap (Weekly)
The Altcoins Market Cap index represents the entire evaluation of the altcoins market (all coins other than BTC).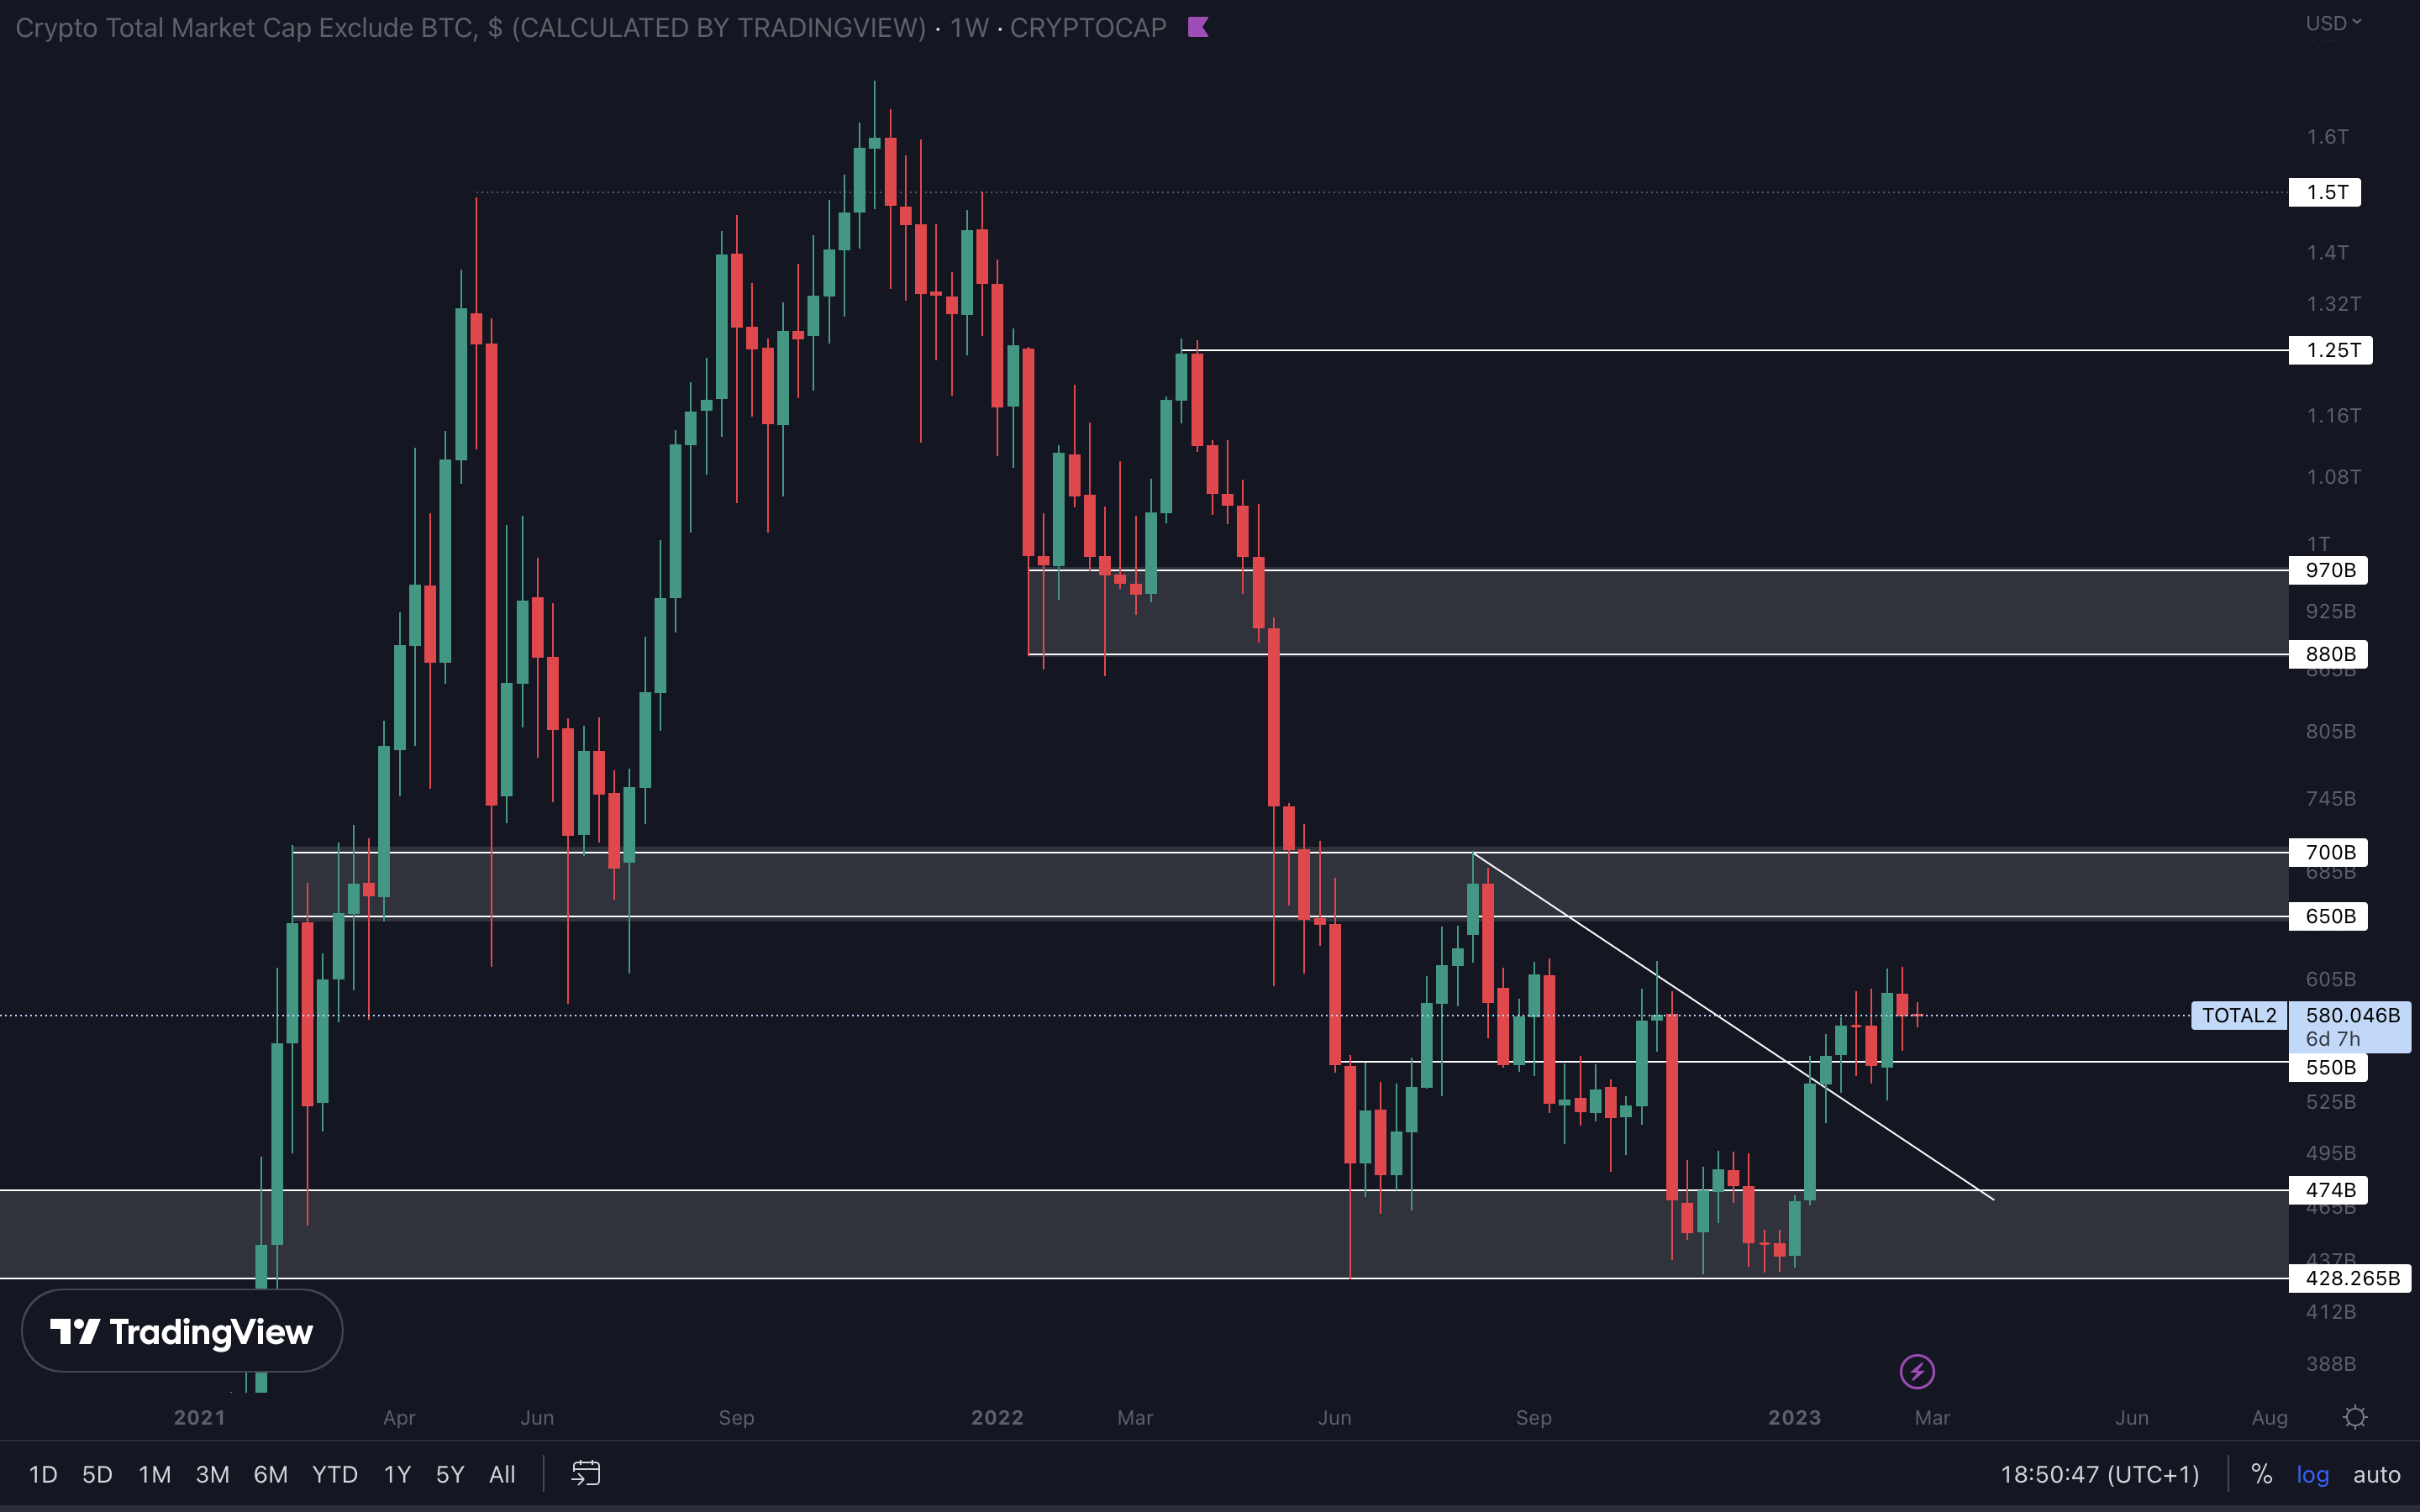
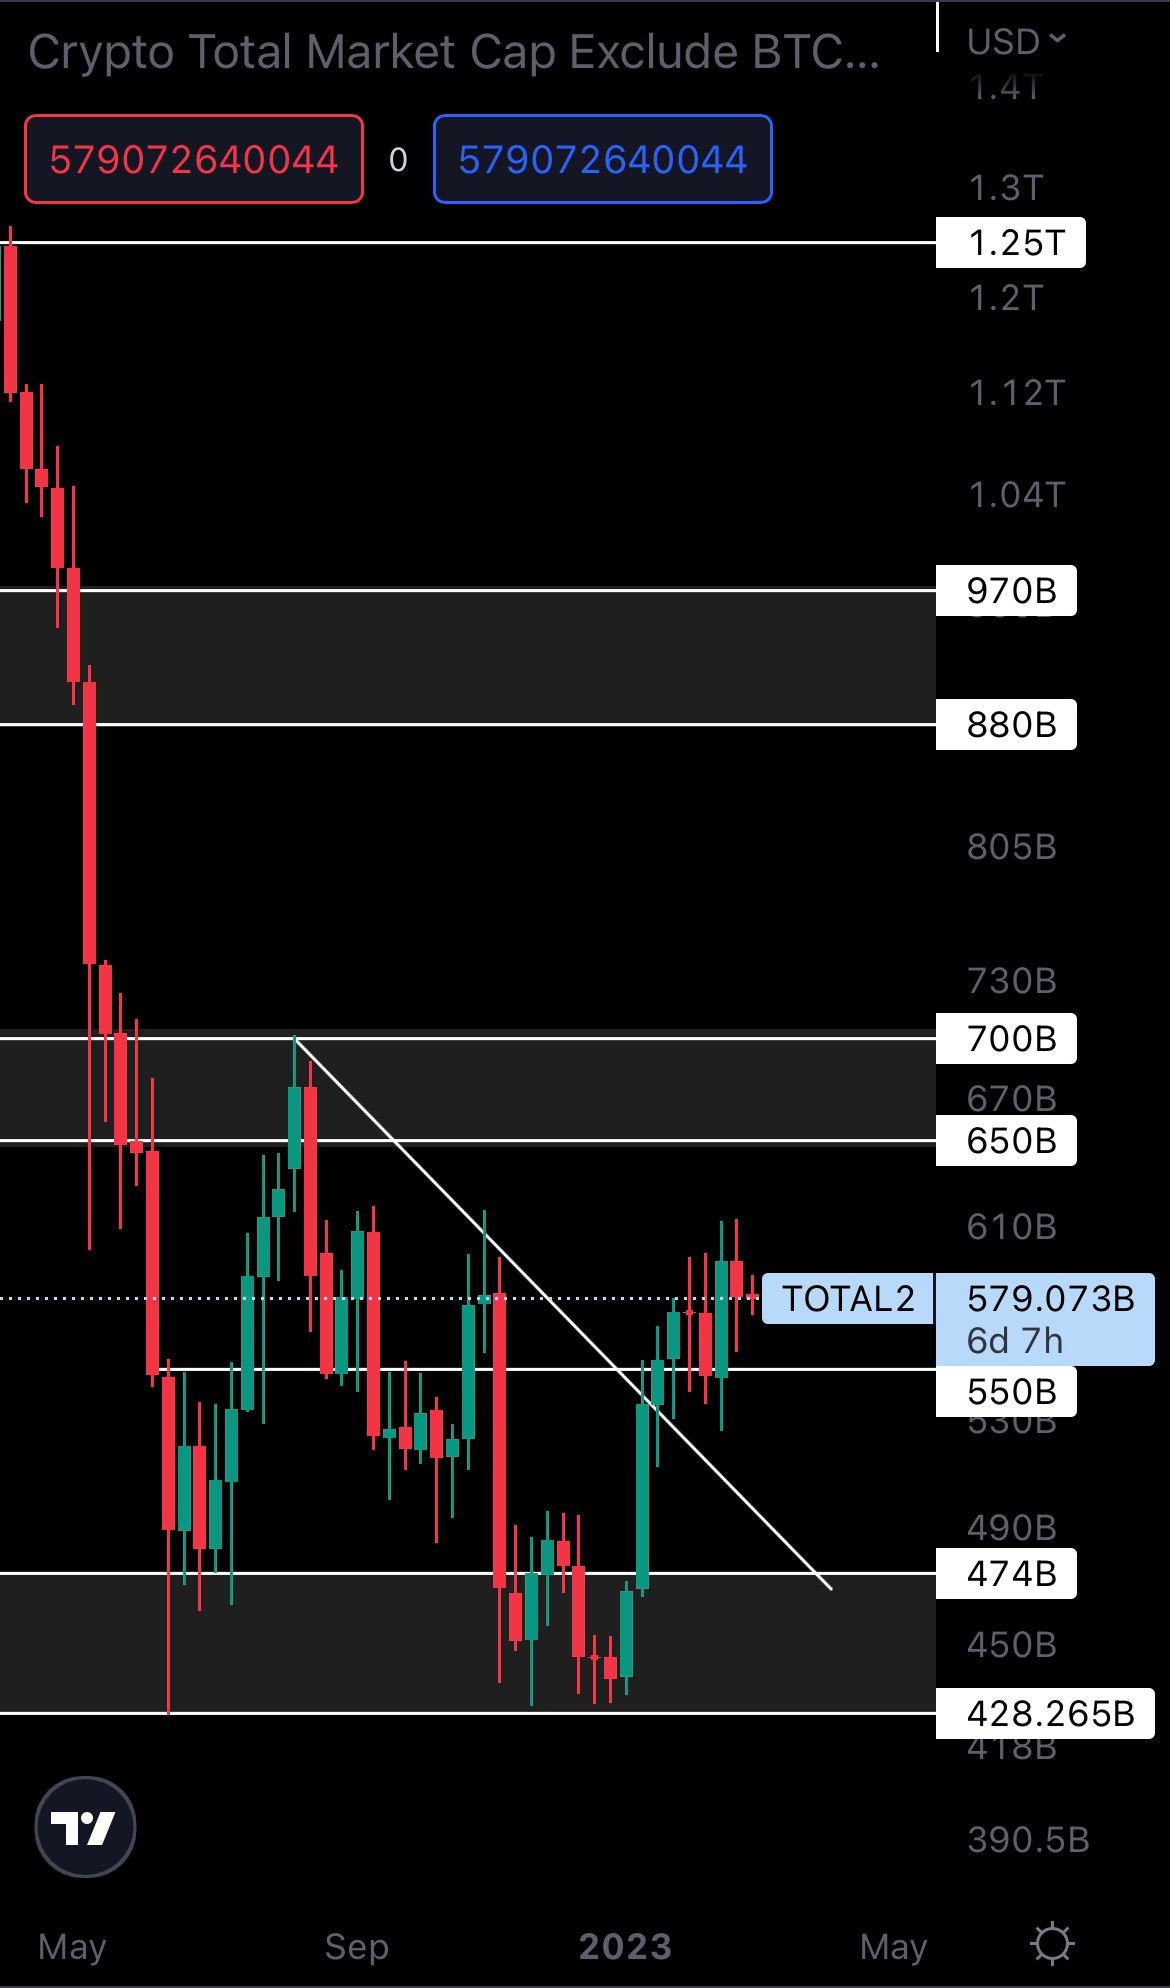
As long as $550B is support on the Altcoins Market Cap, this index will reach the $650B - $700B resistance area, if not in March, then at some point in early Q2 based on how the market is moving right now. We recommended jumping into altcoins once Bitcoin breaks resistance. That’s a much stronger confirmation that the rally will continue.
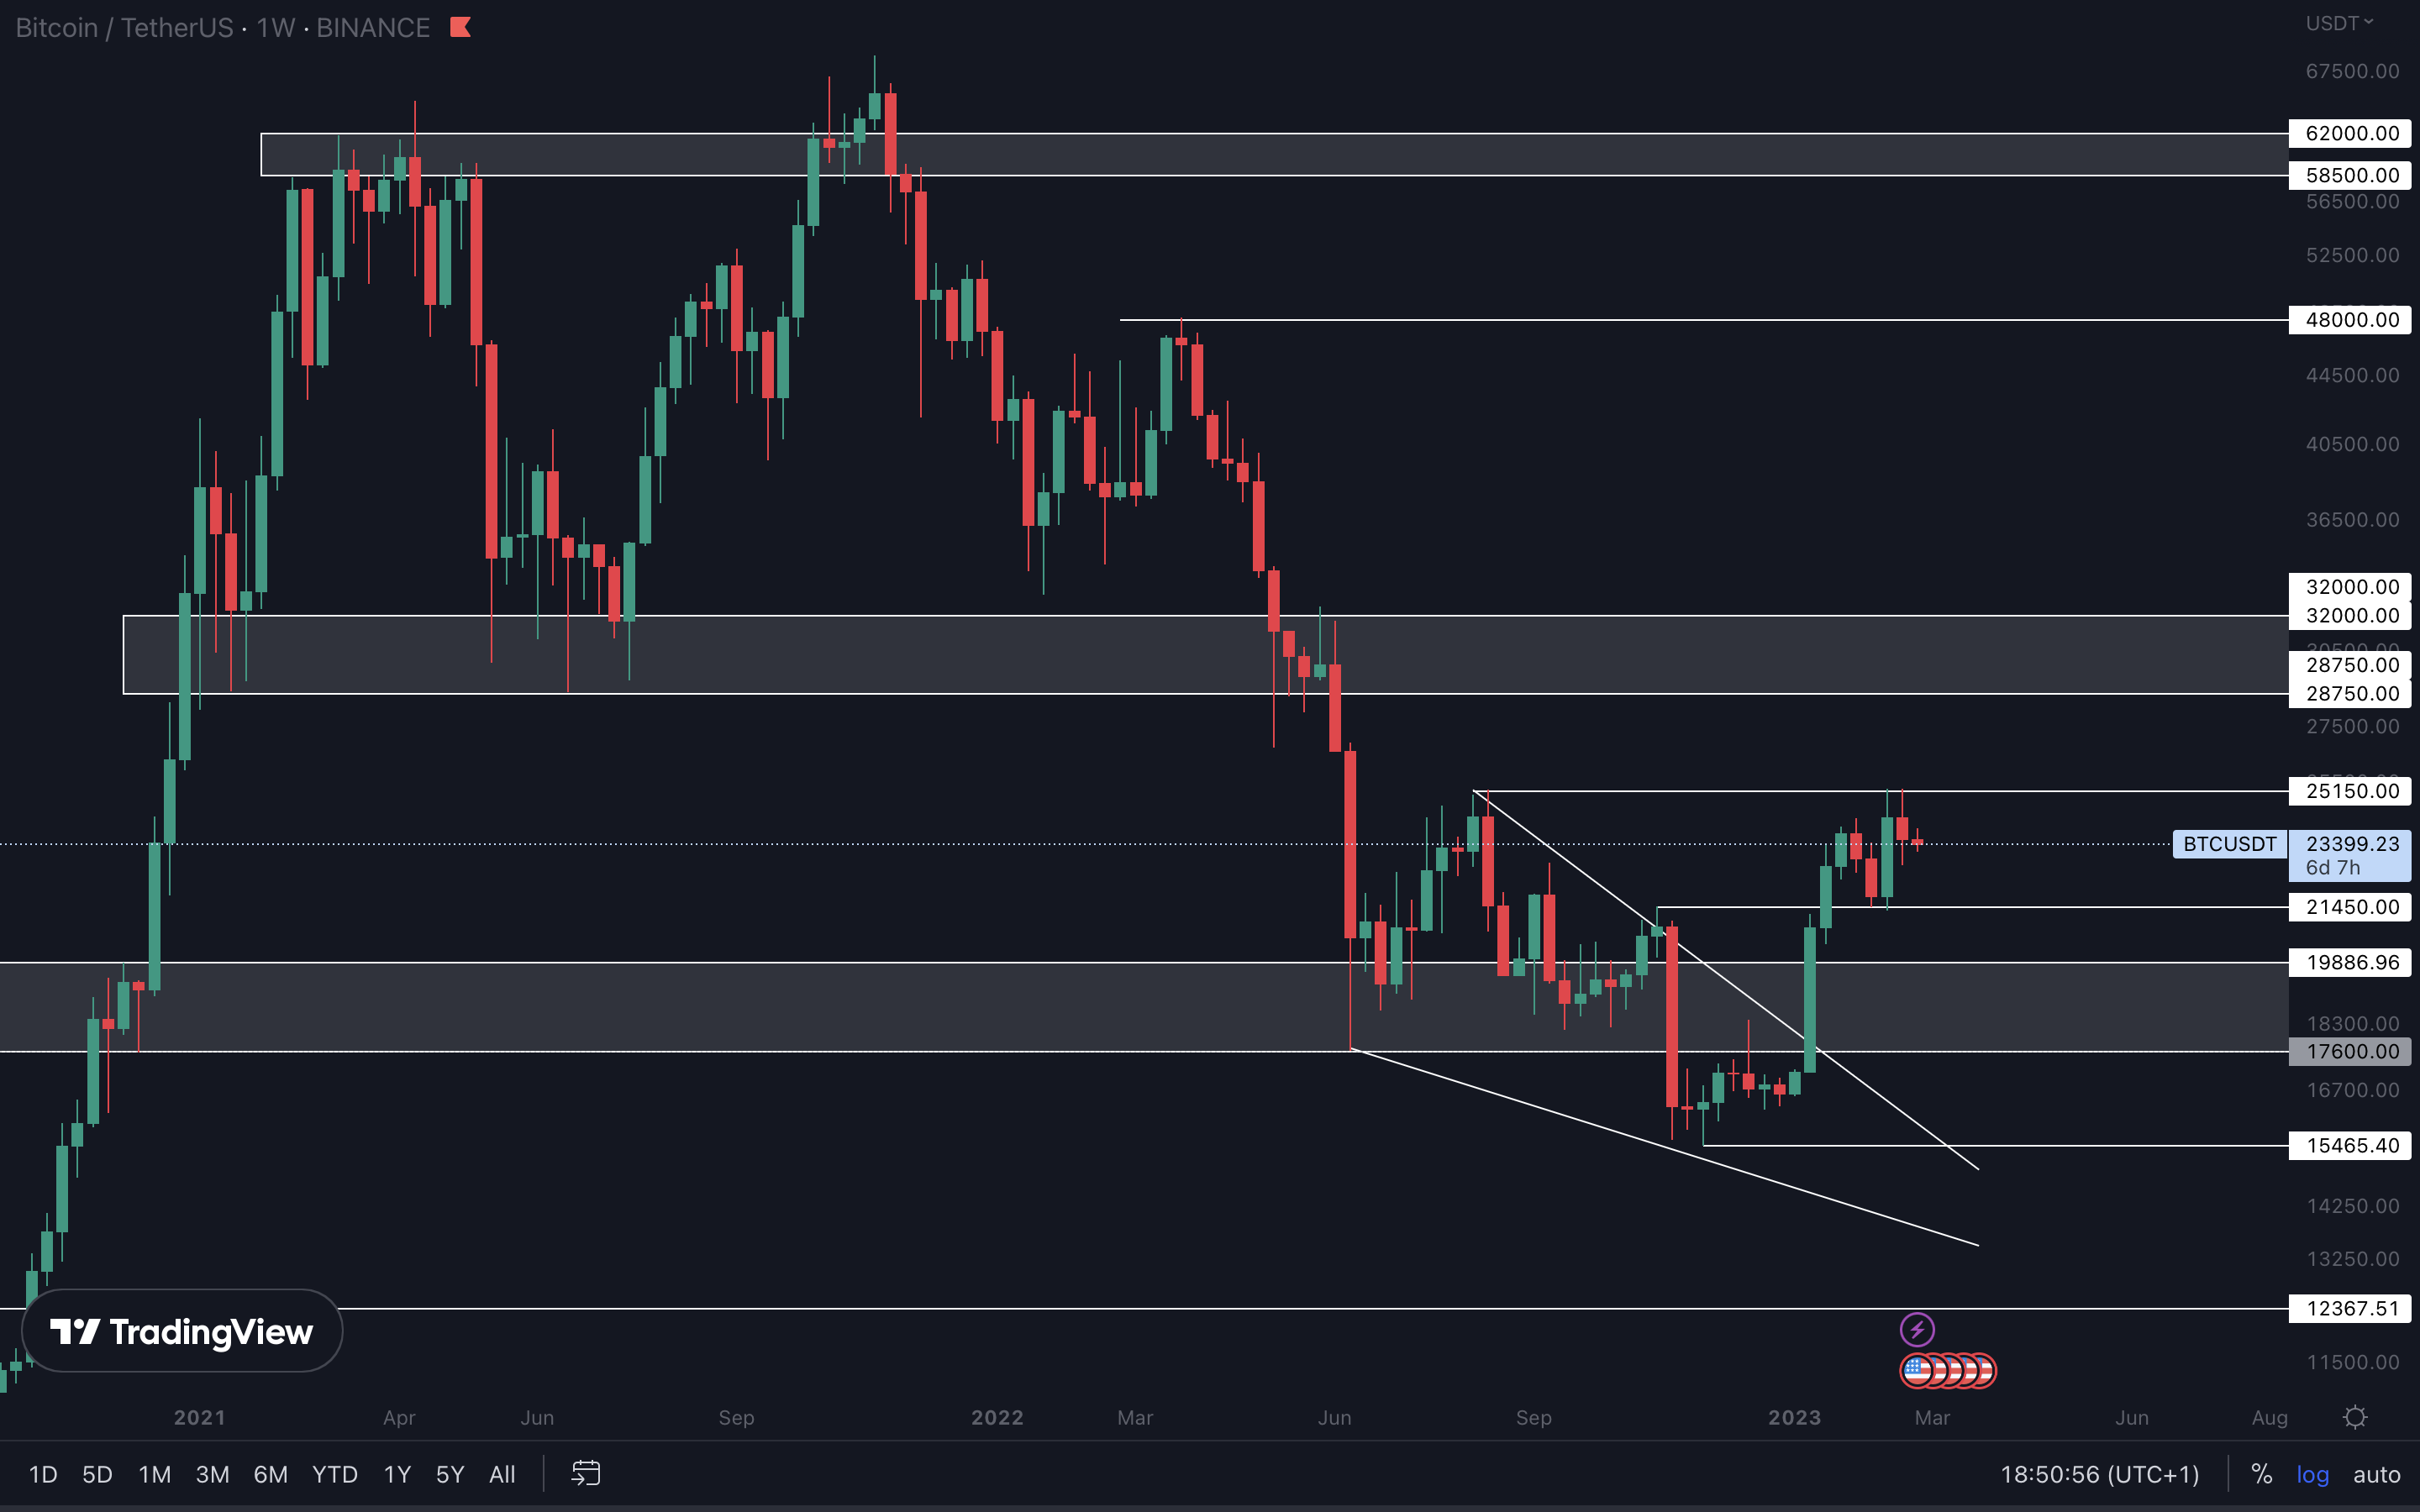
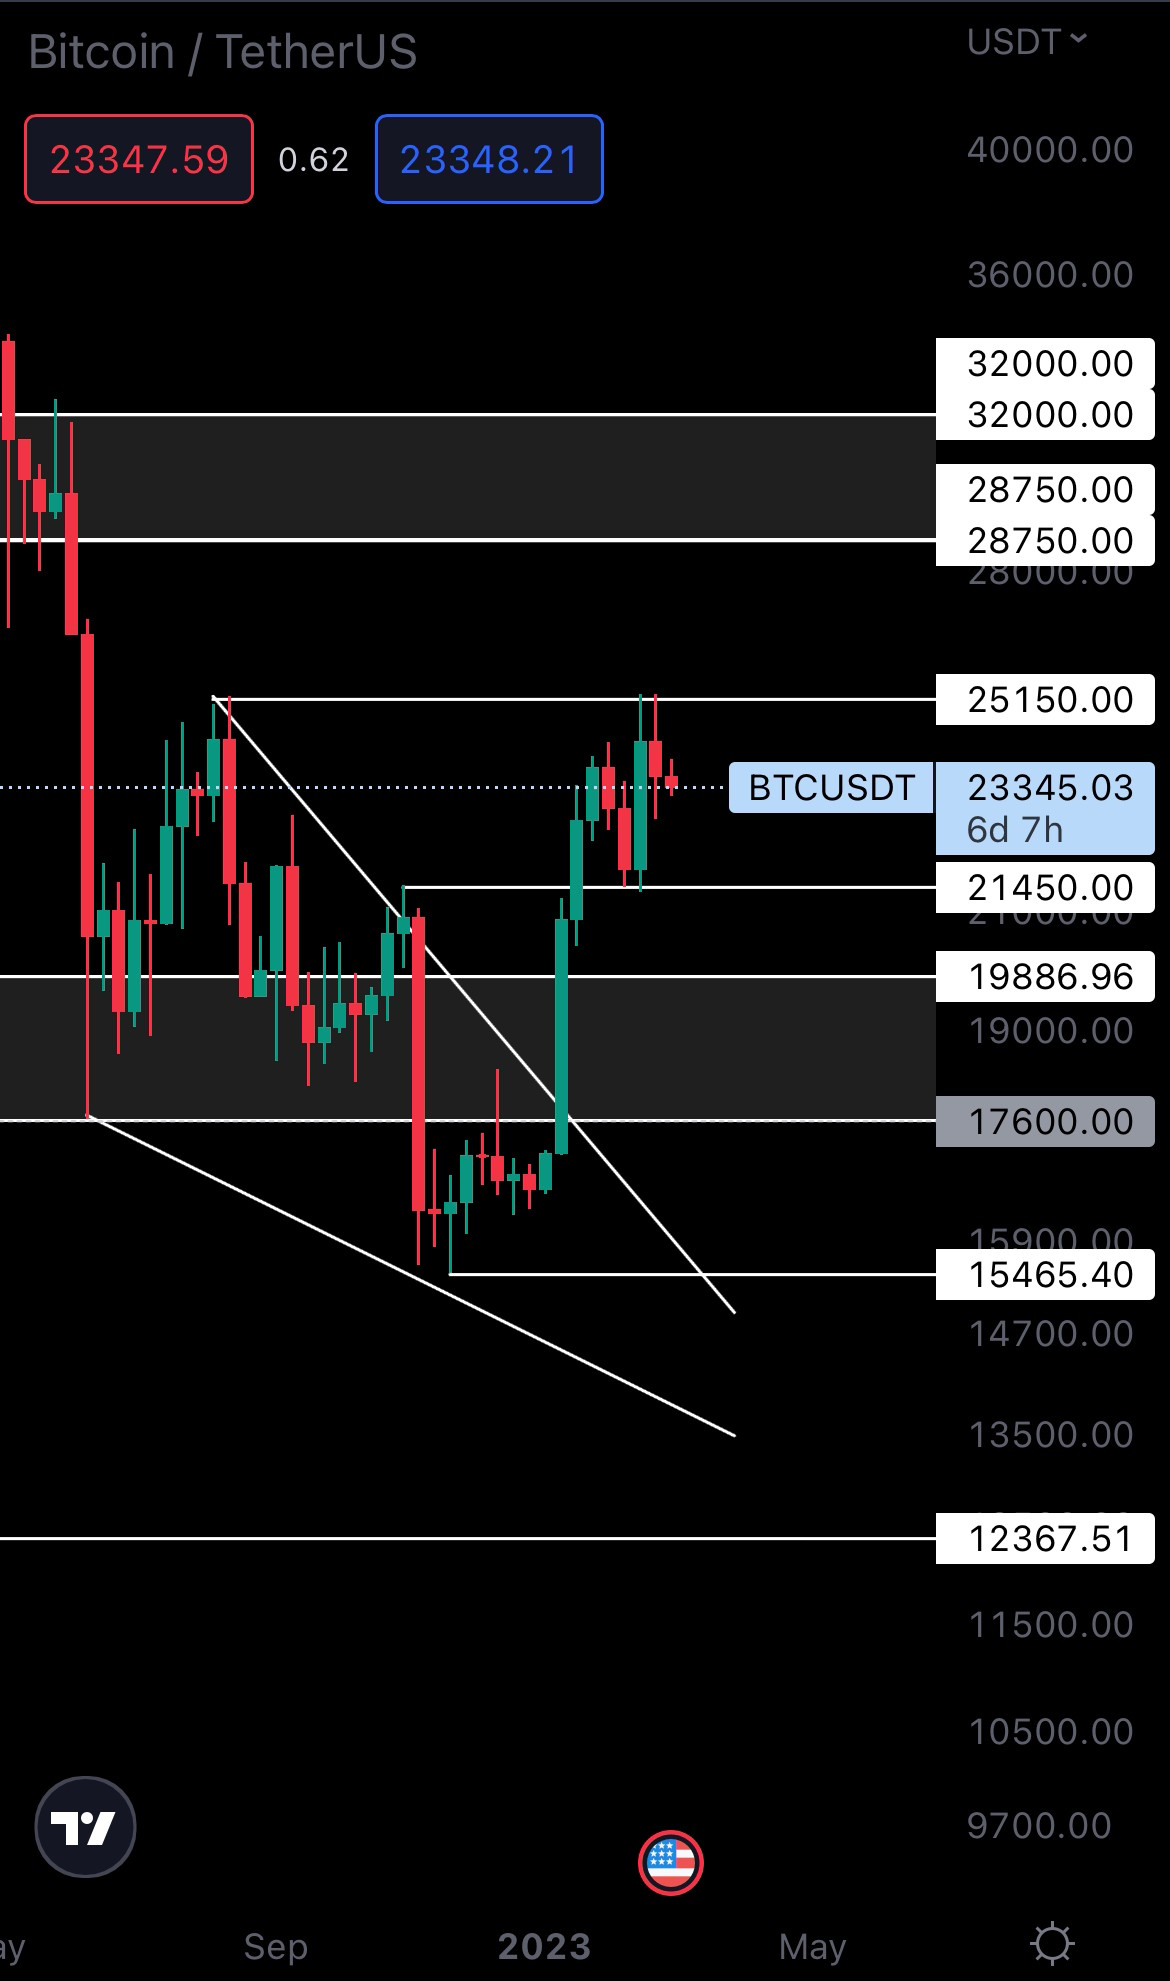
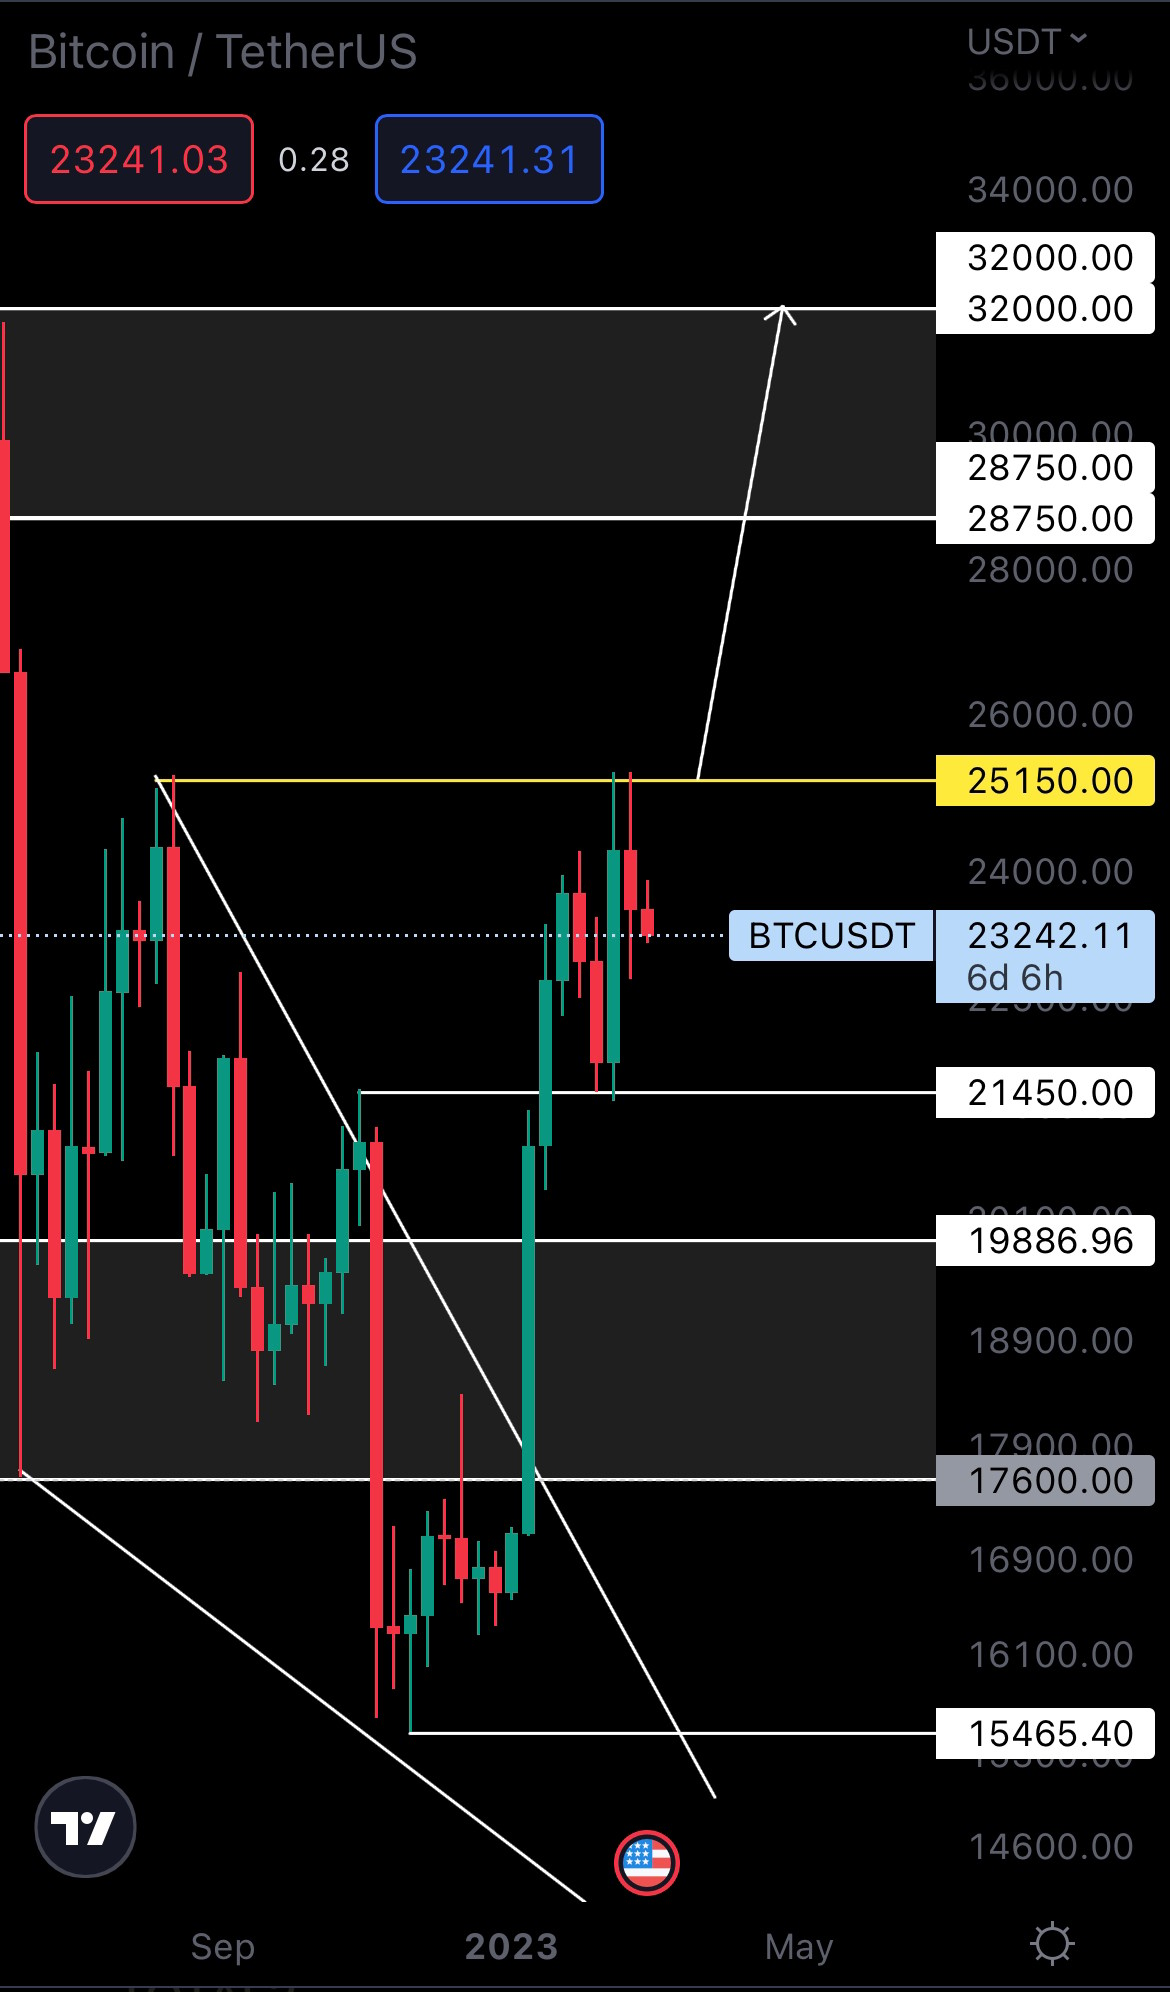
BTC | Bitcoin (Weekly)
ETH | Ethereum (Weekly)
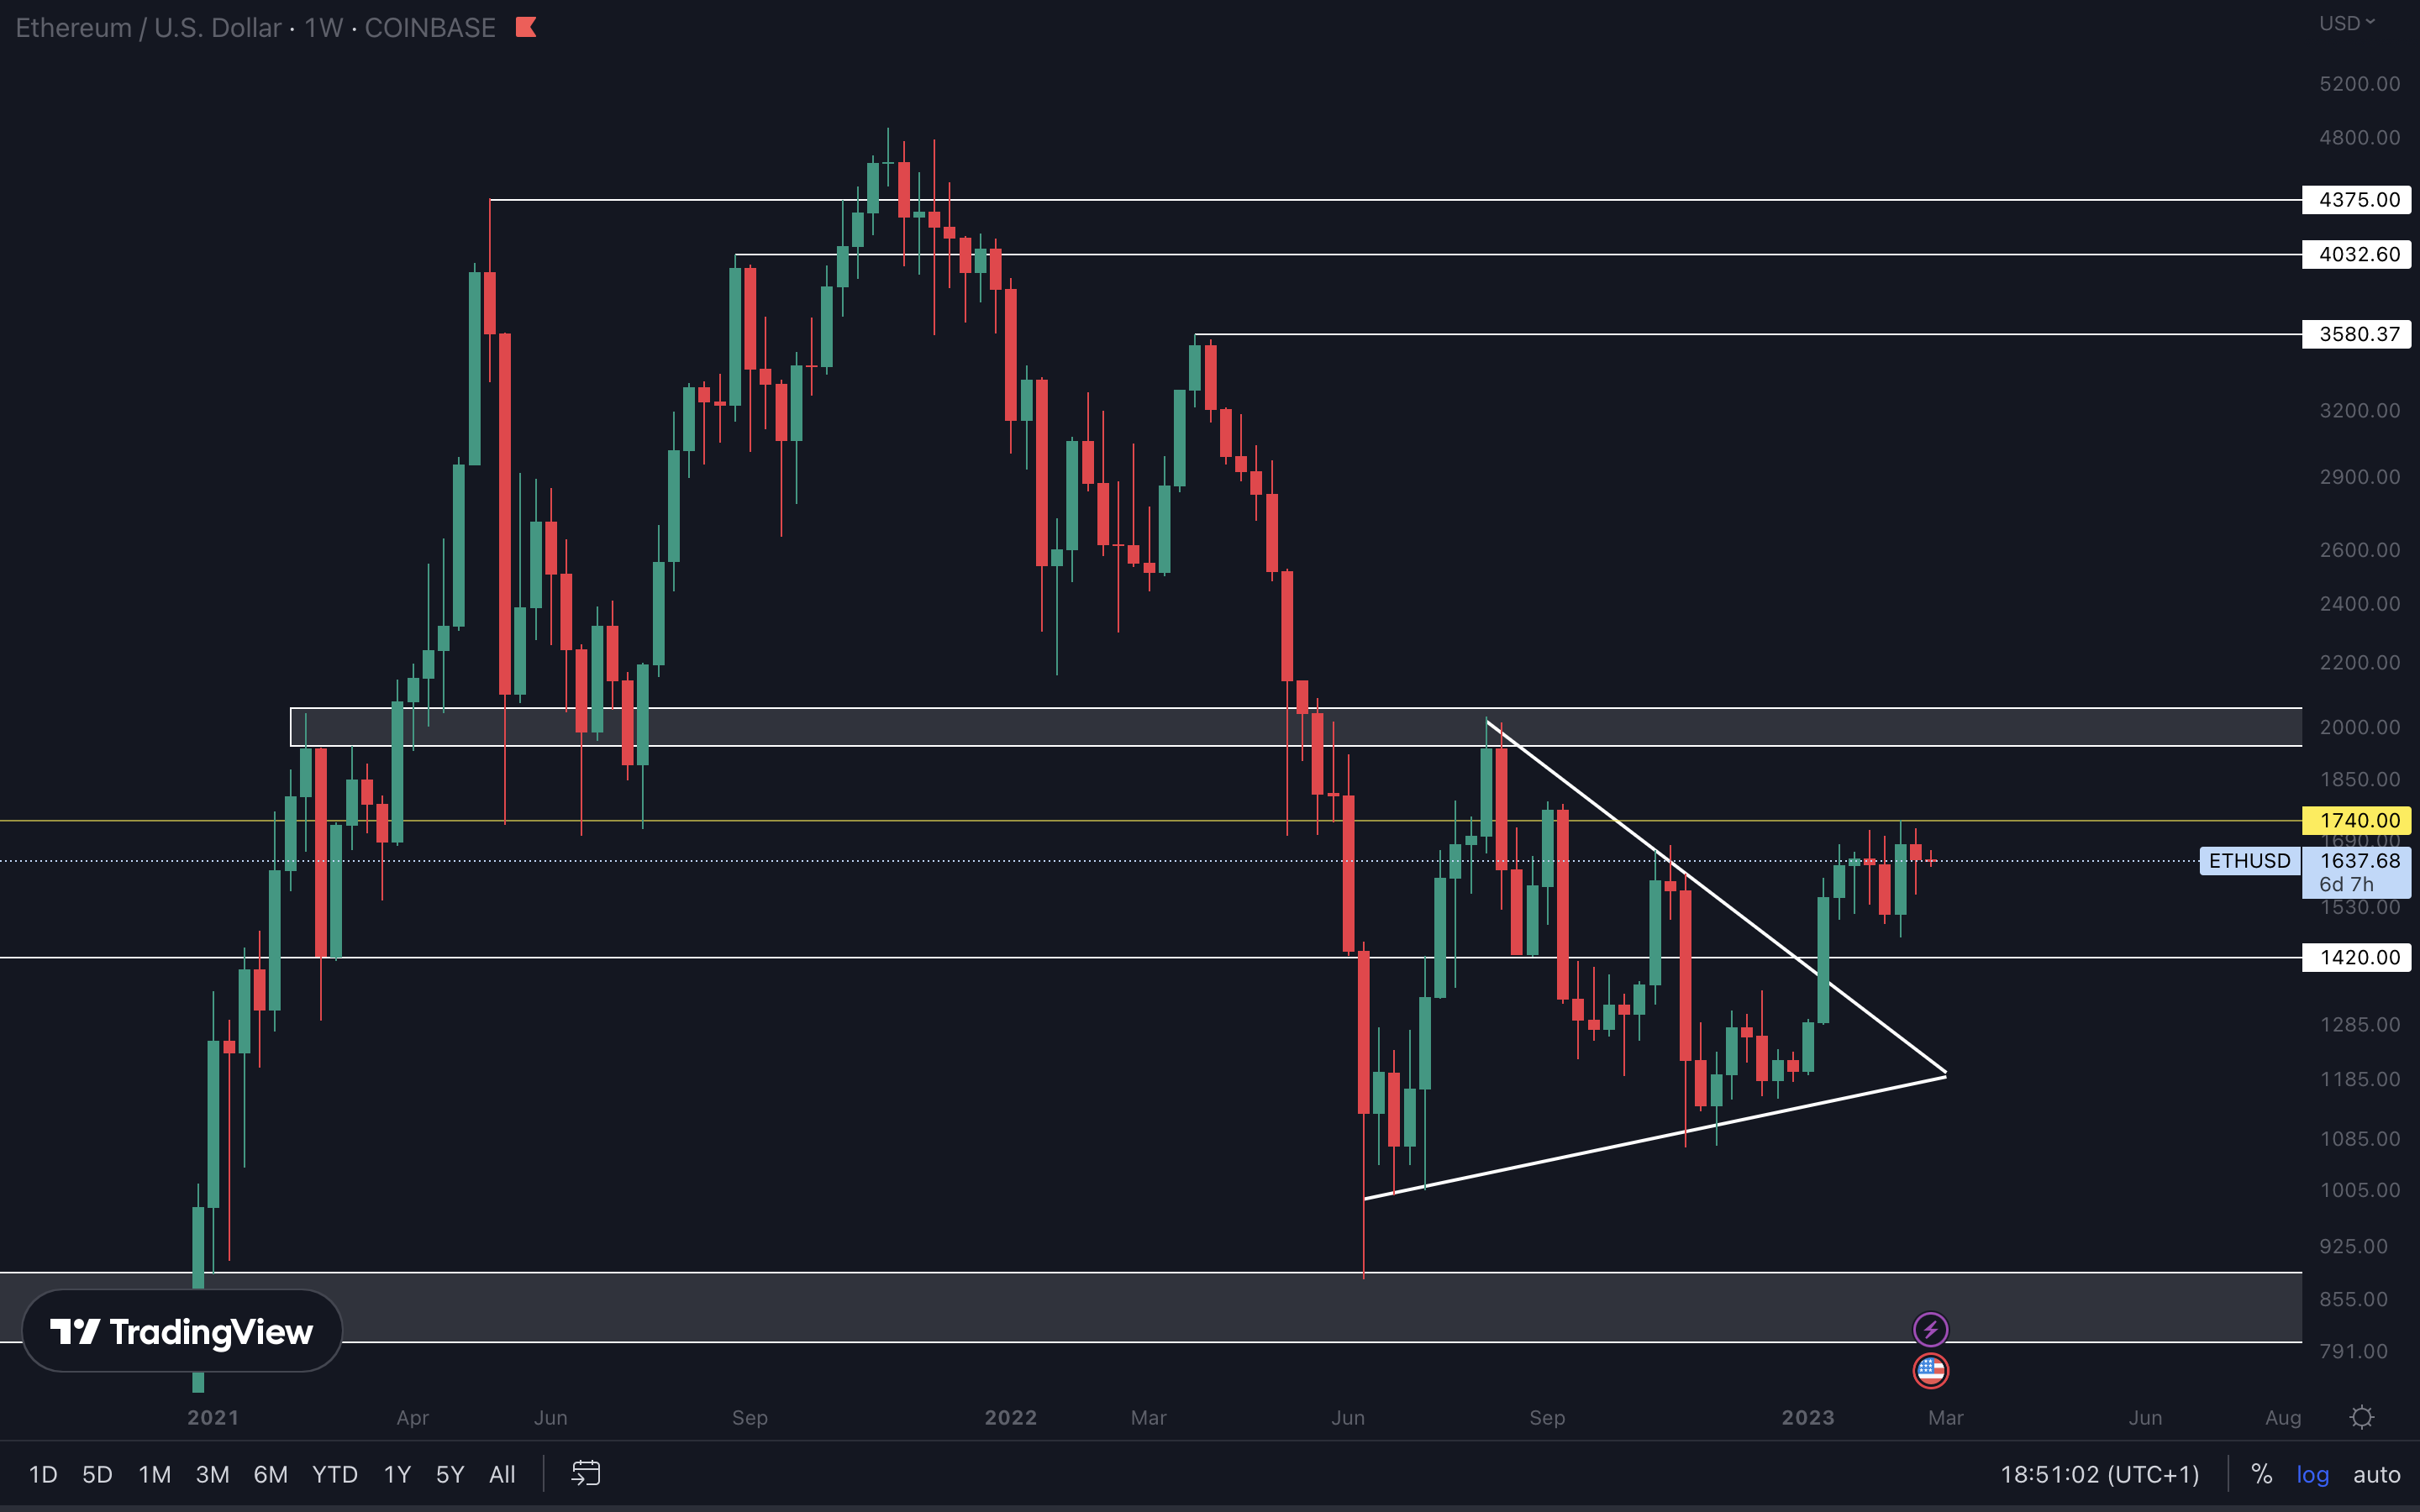
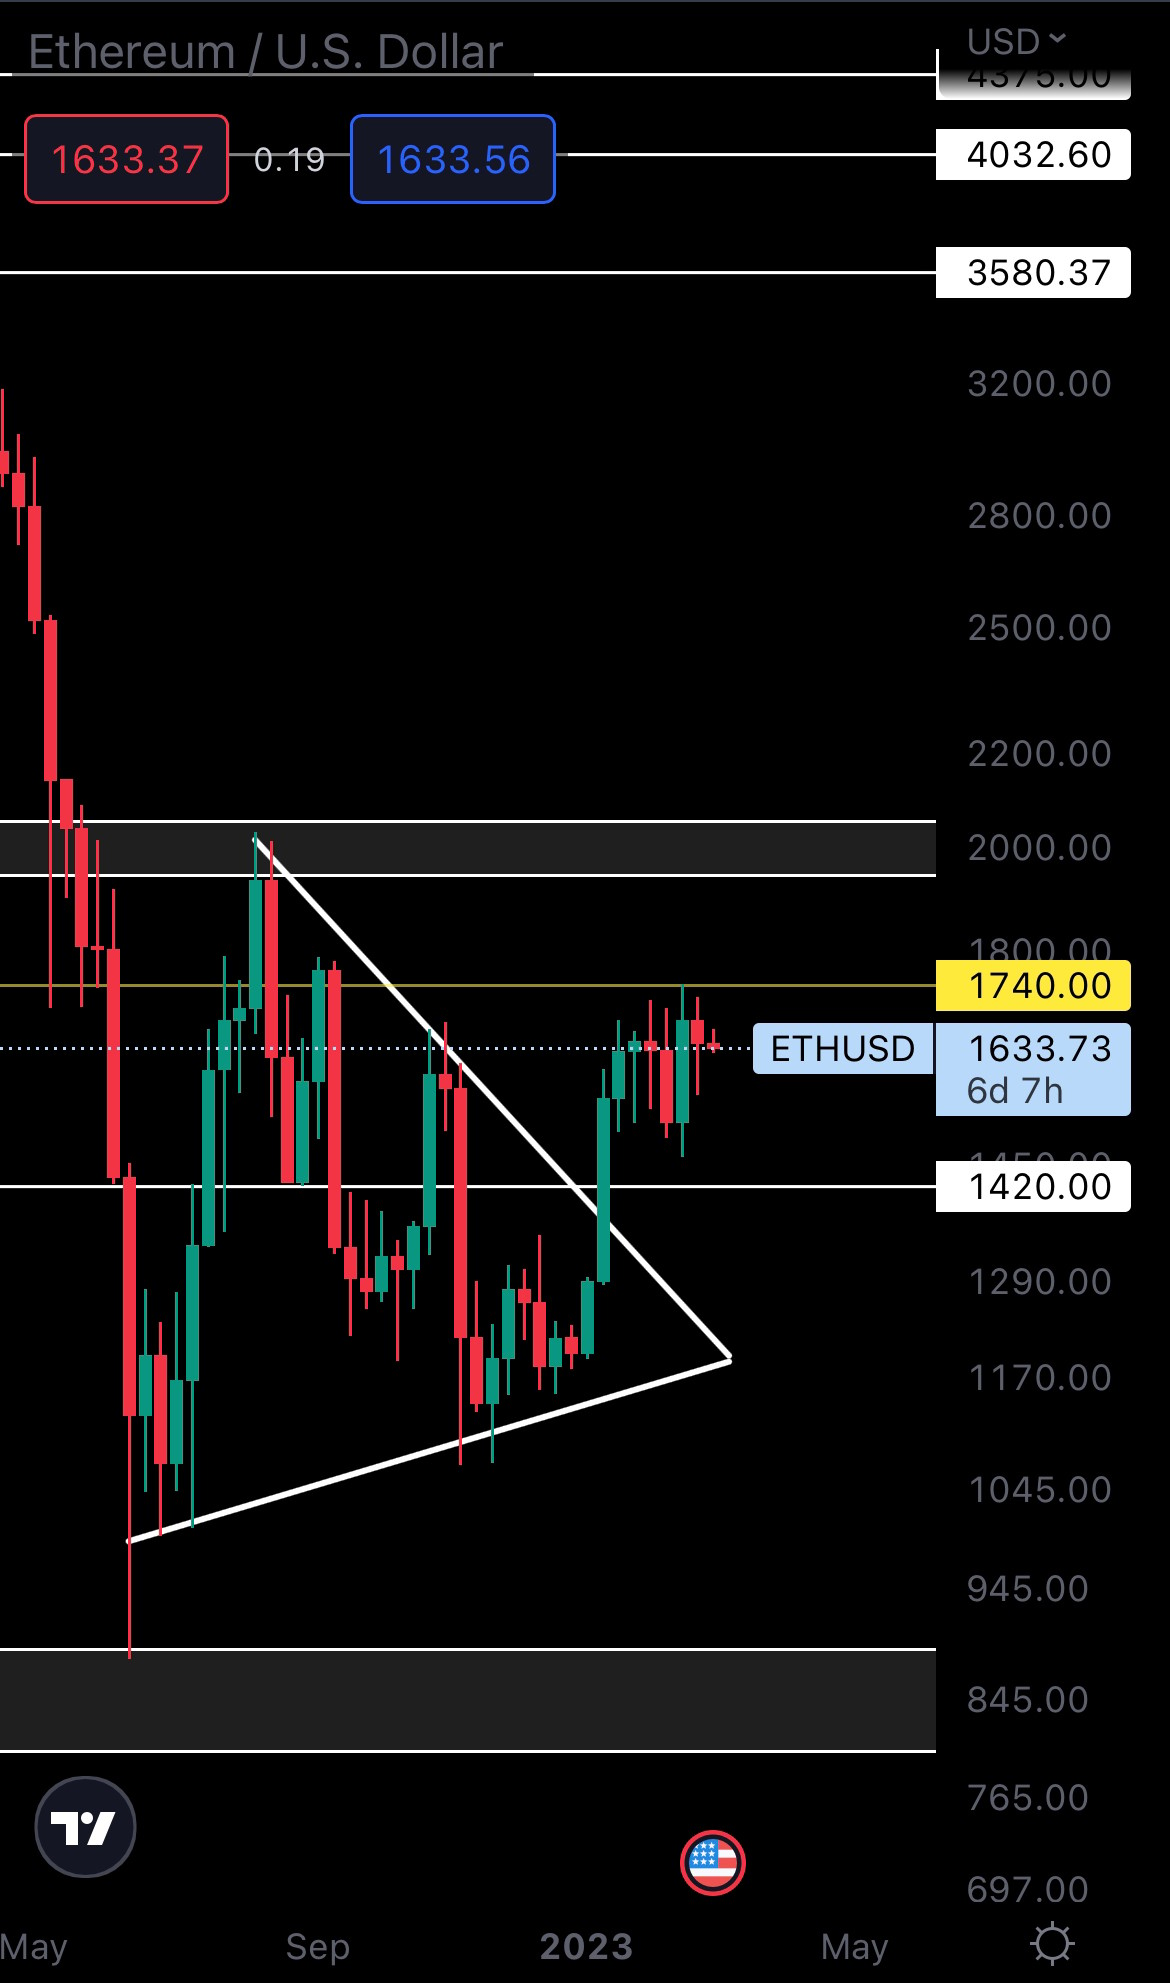
Ether is still under resistance. Reclaiming $1740 is essential for further upside to be confirmed. Otherwise it risks rejection (meaning it will go down) the longer it stays under resistance. Although Ether has a large dominance on the market as well, it it still influenced by Bitcoin’s price action. We can only assume that a reclaim of $25,150 for BTC will result in Ether breaking $1740. That makes Ether’s success (in the short-term) co-dependent on Bitcoin, so tracking that chart is what matters.
SOL | Solana (Weekly)
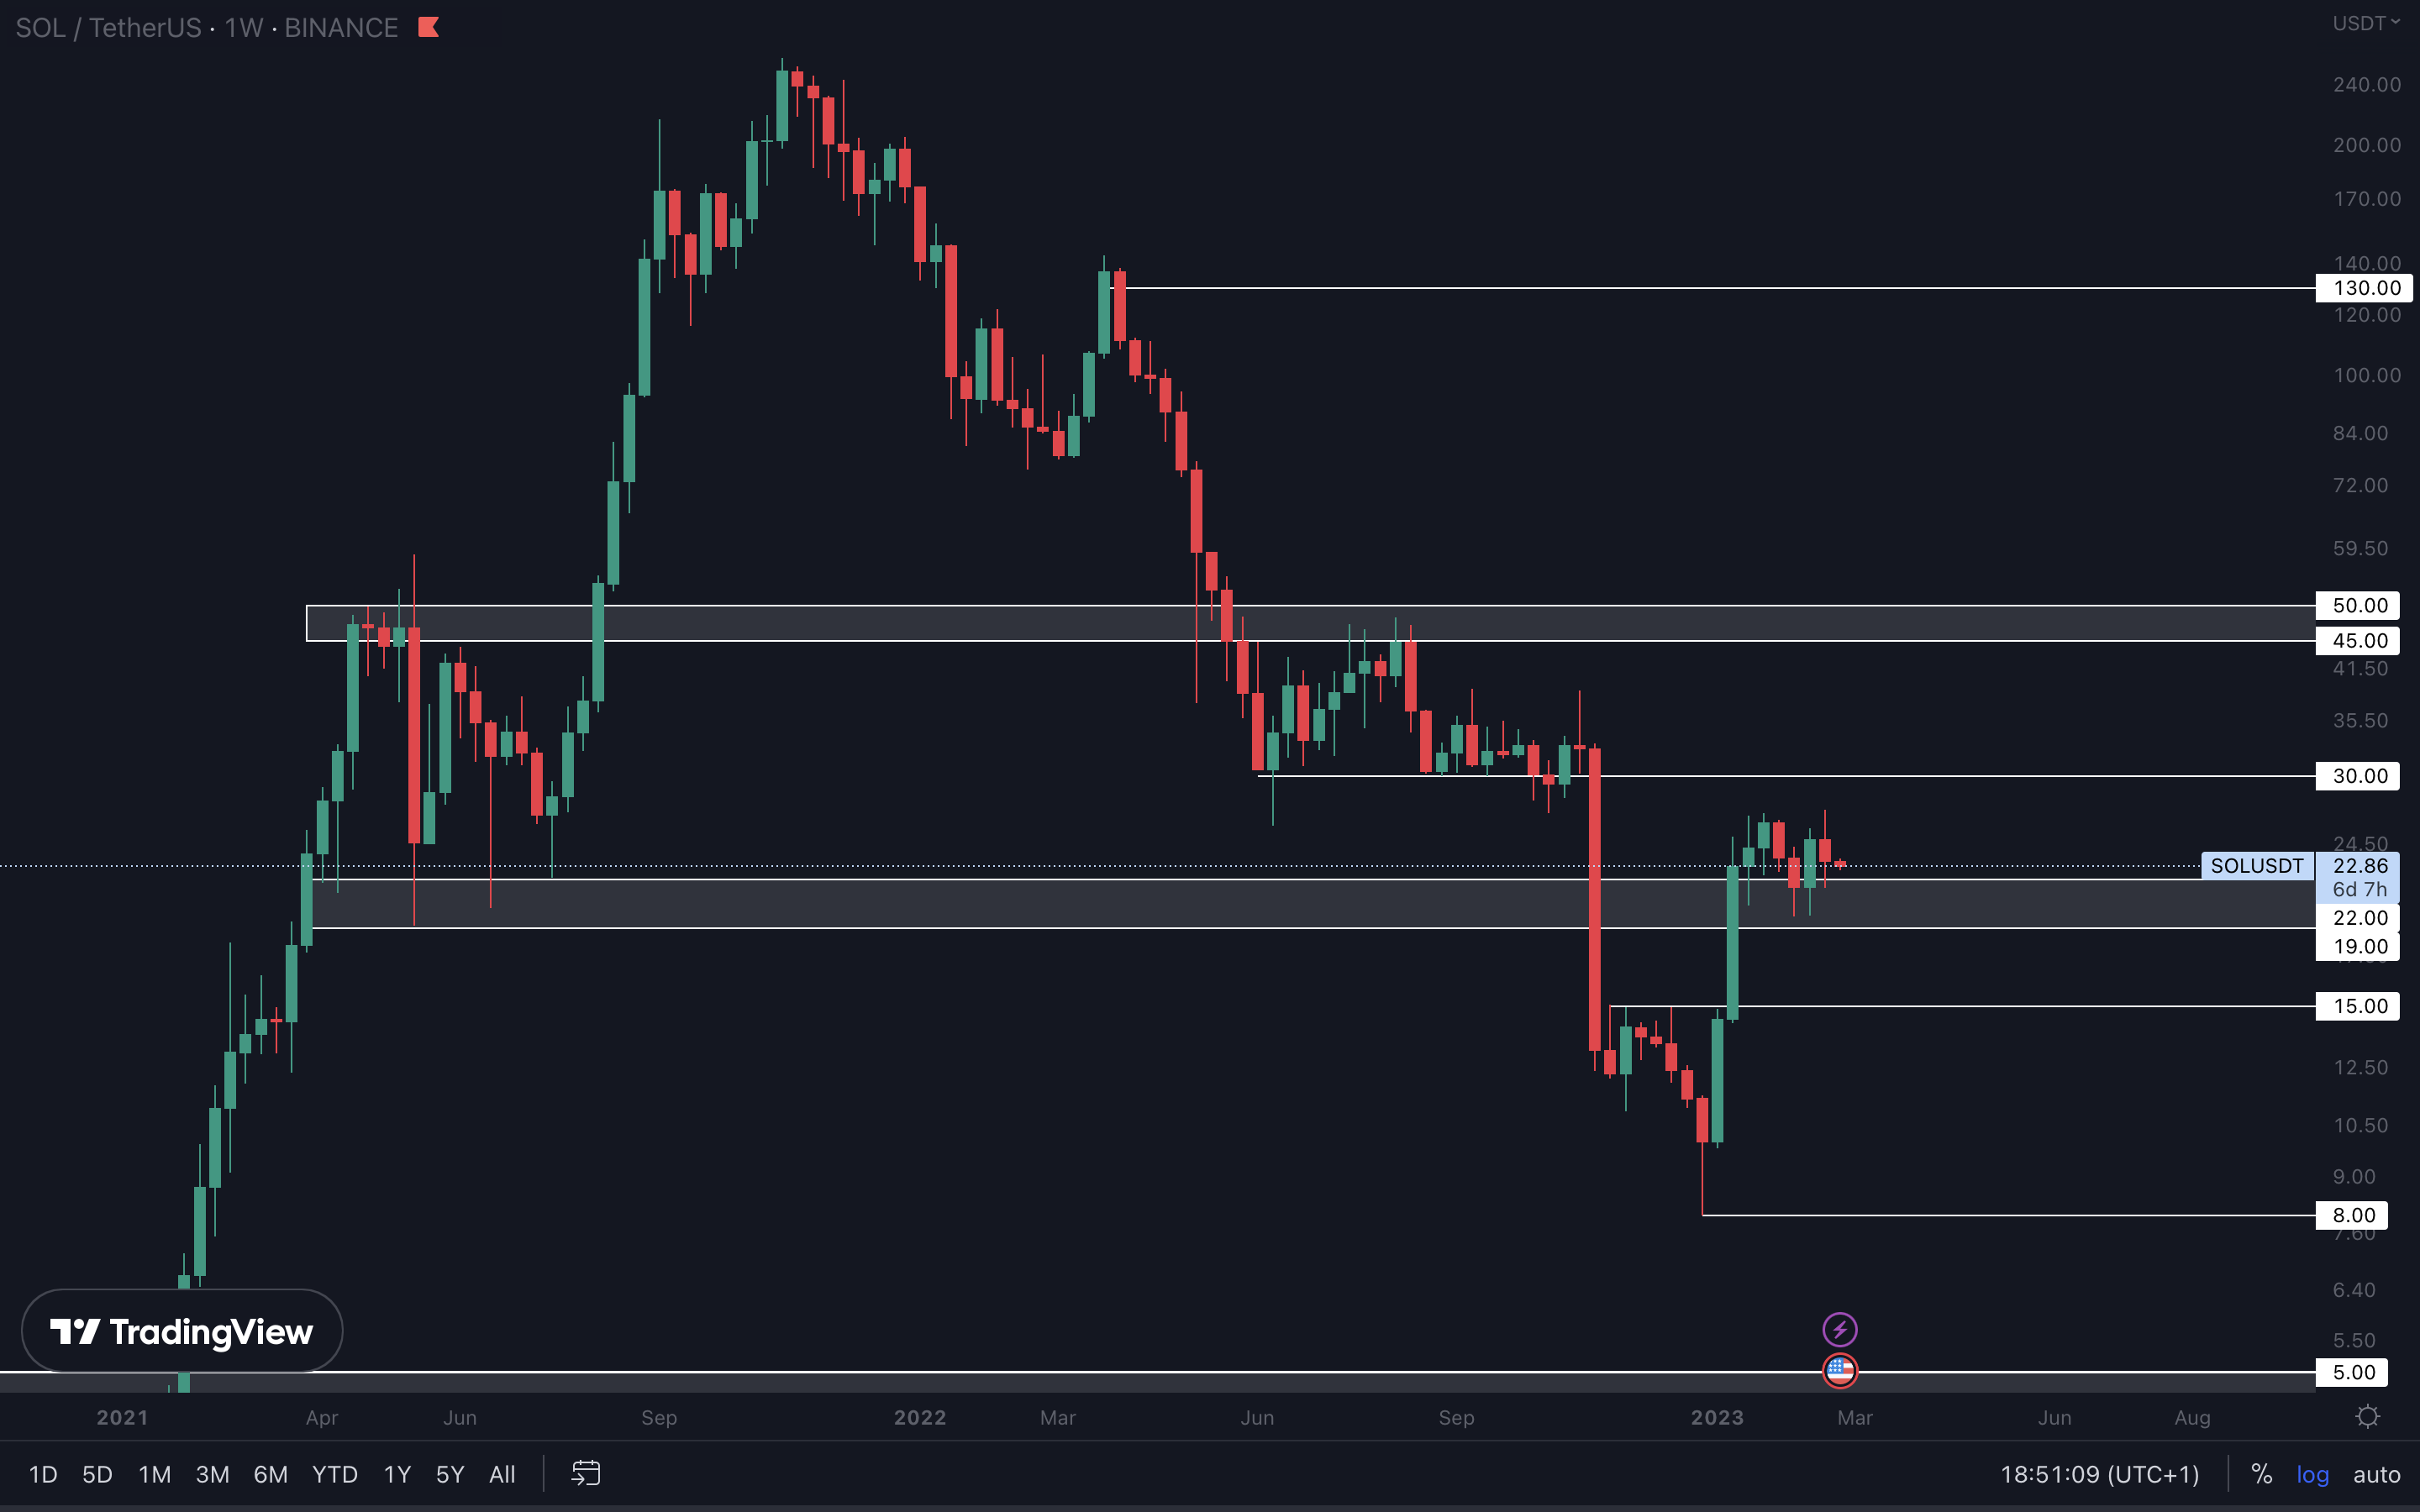
Still above support, and we still believe SOL will reach $30 in the coming weeks. An invalidation of this scenario occurs when the asset closes a weekly candle under $19, for which we have no signs of happening anytime soon.
RUNE | THORChain (Weekly)
RUNE closed a weekly candle under $1.67 last week, opening the road to $1.43. We don’t believe that level will be reached unless Bitcoin takes a dive and drops a lot lower. For downside to be invalidated, RUNE now needs to close a weekly candle back above $1.67.
SNX | Synthetix (Weekly)
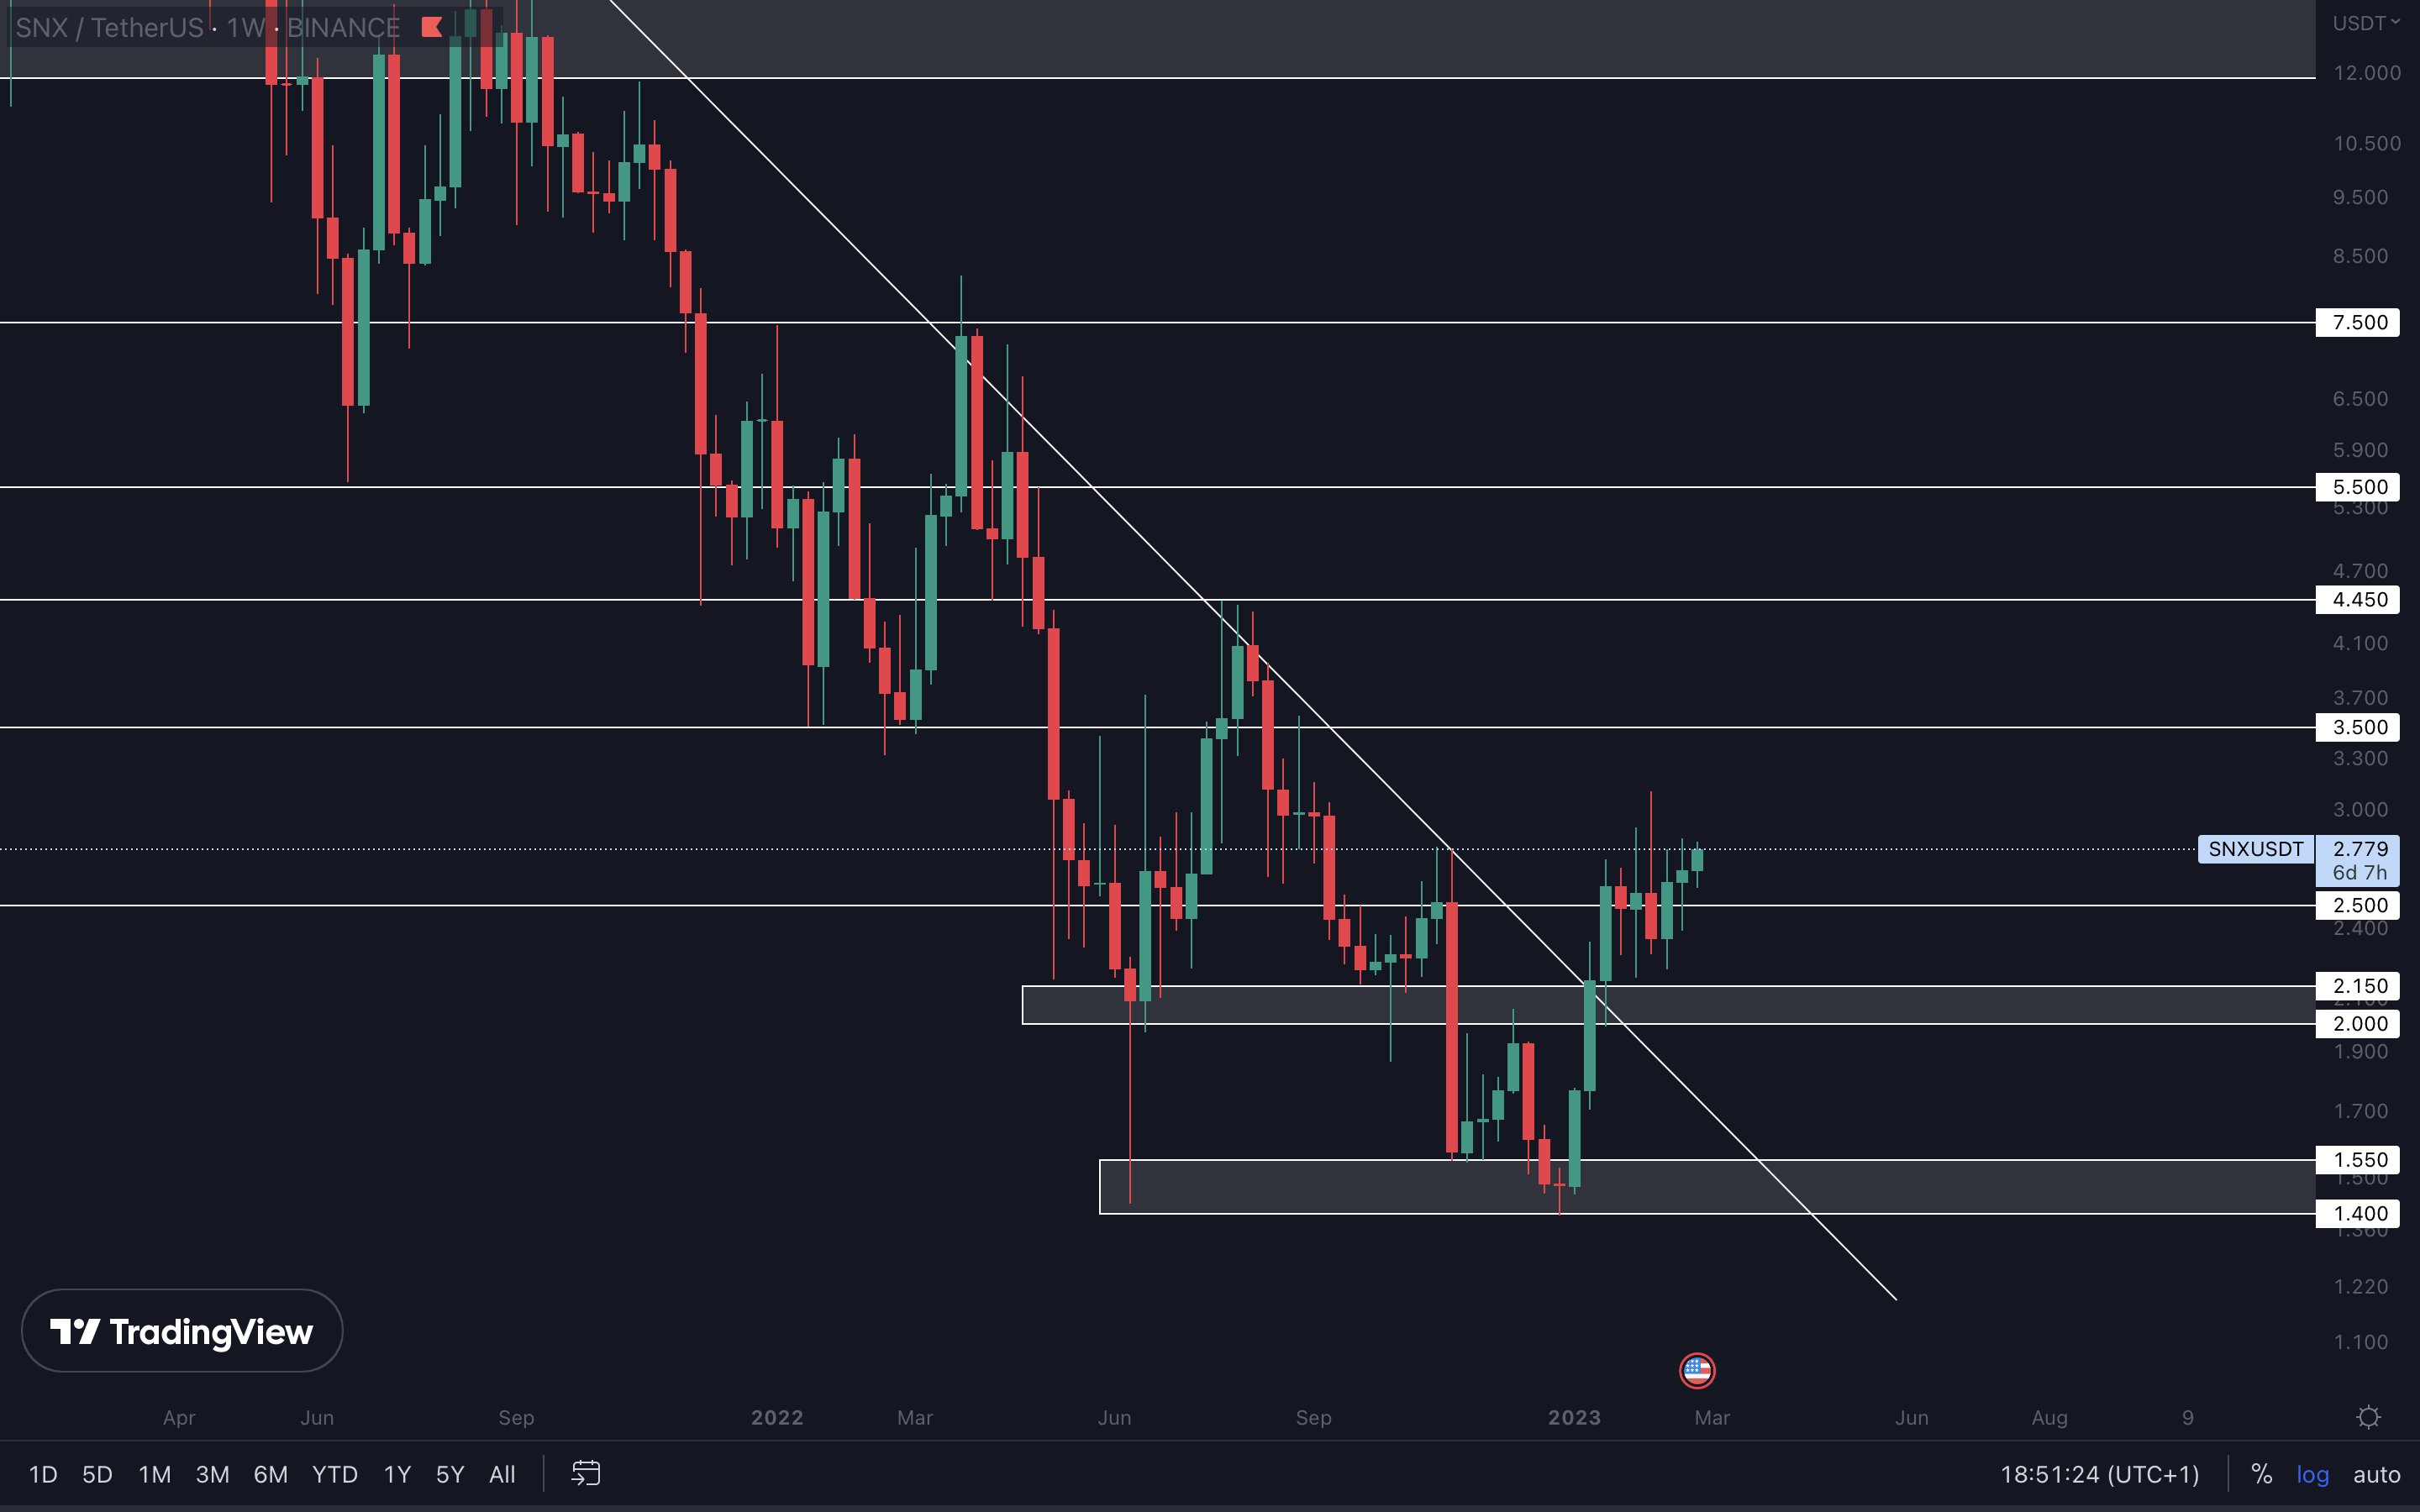
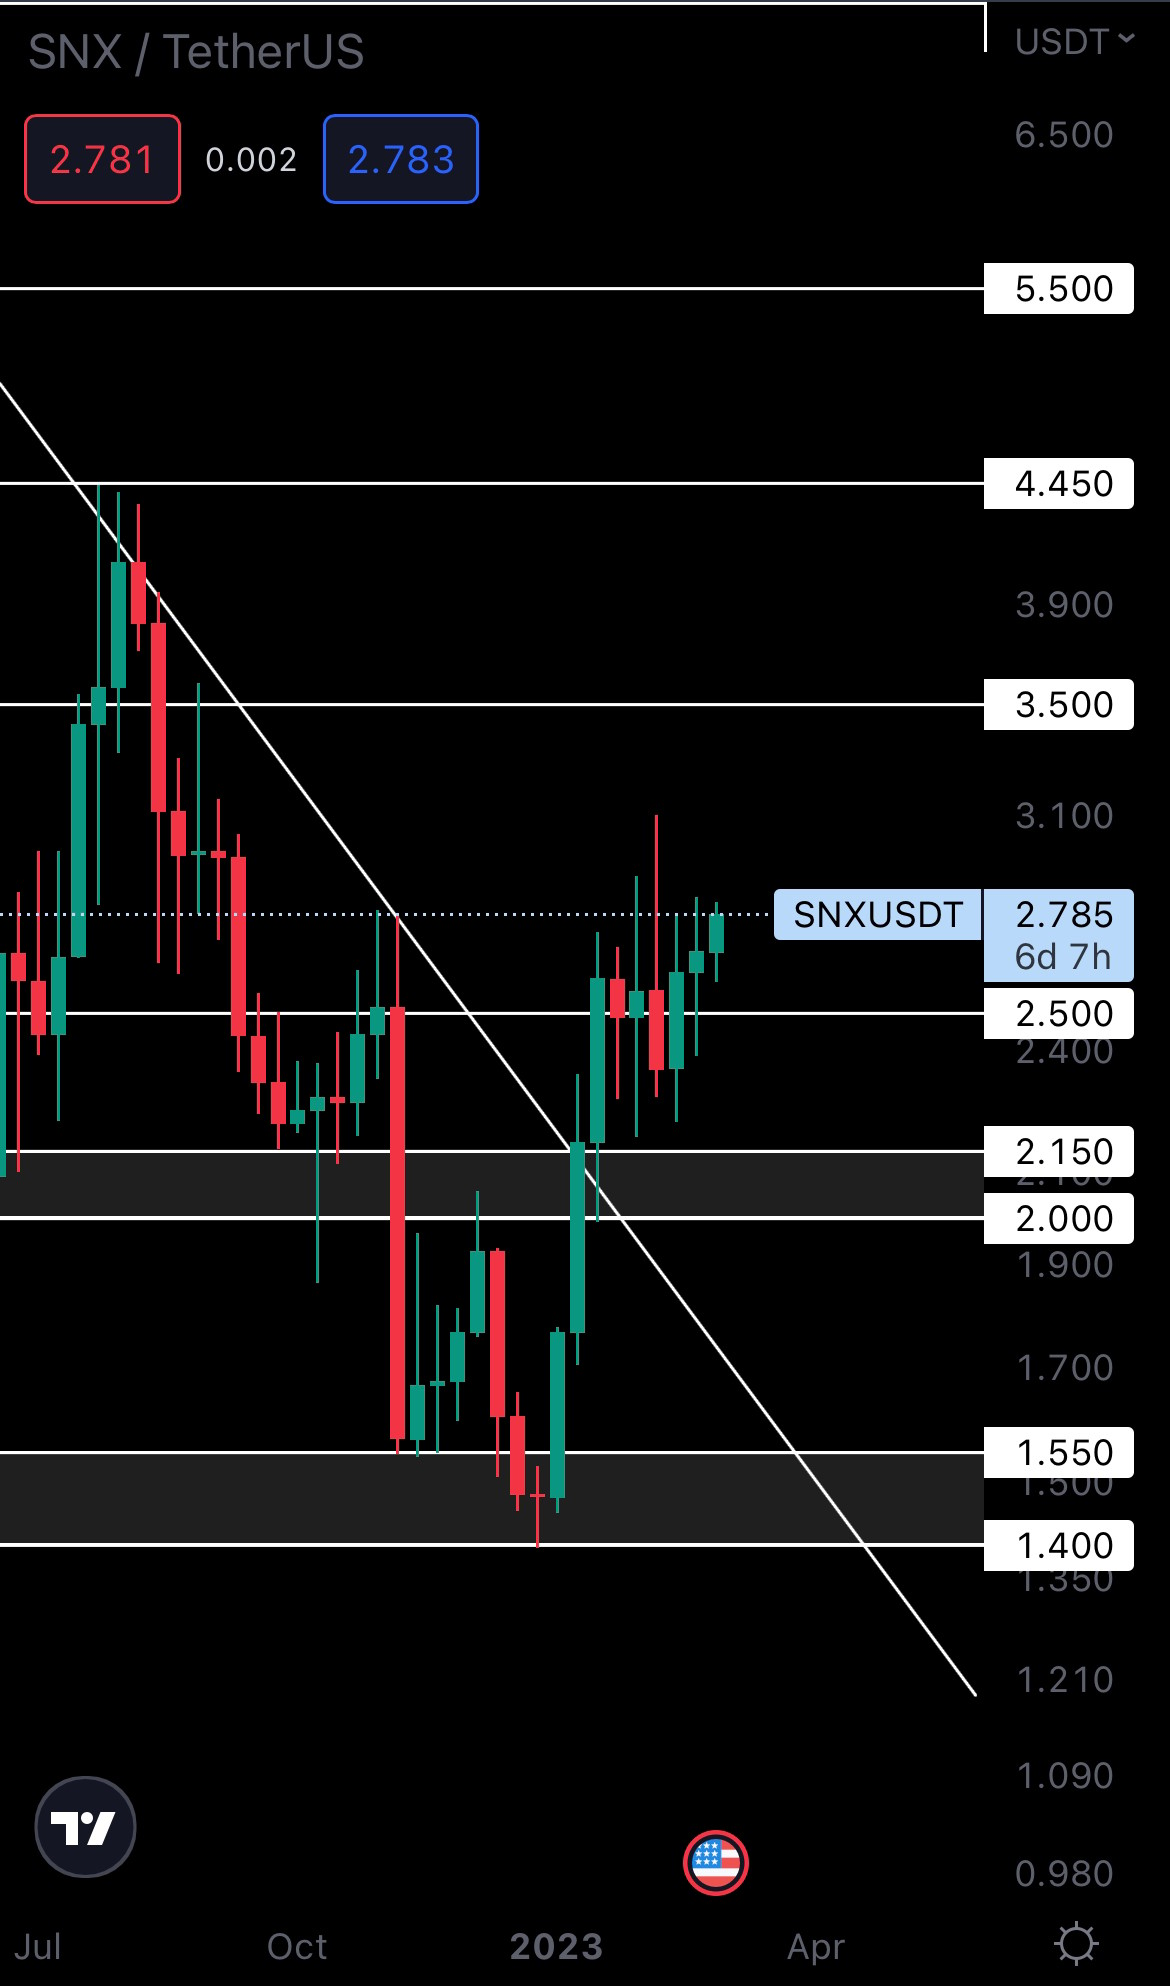
SNX is still above support, so the road to $3.50 remains open. Will SNX be able to reach $3.50 now? It depends. Yes, the chart is looking good. It’s just that SNX doesn’t have enough volume to sustain a move higher despite Bitcoin dropping. For SNX to reach $3.50, Bitcoin would have to either stay flat or rise toward $25,150.
dYdX | DYDX (Daily)
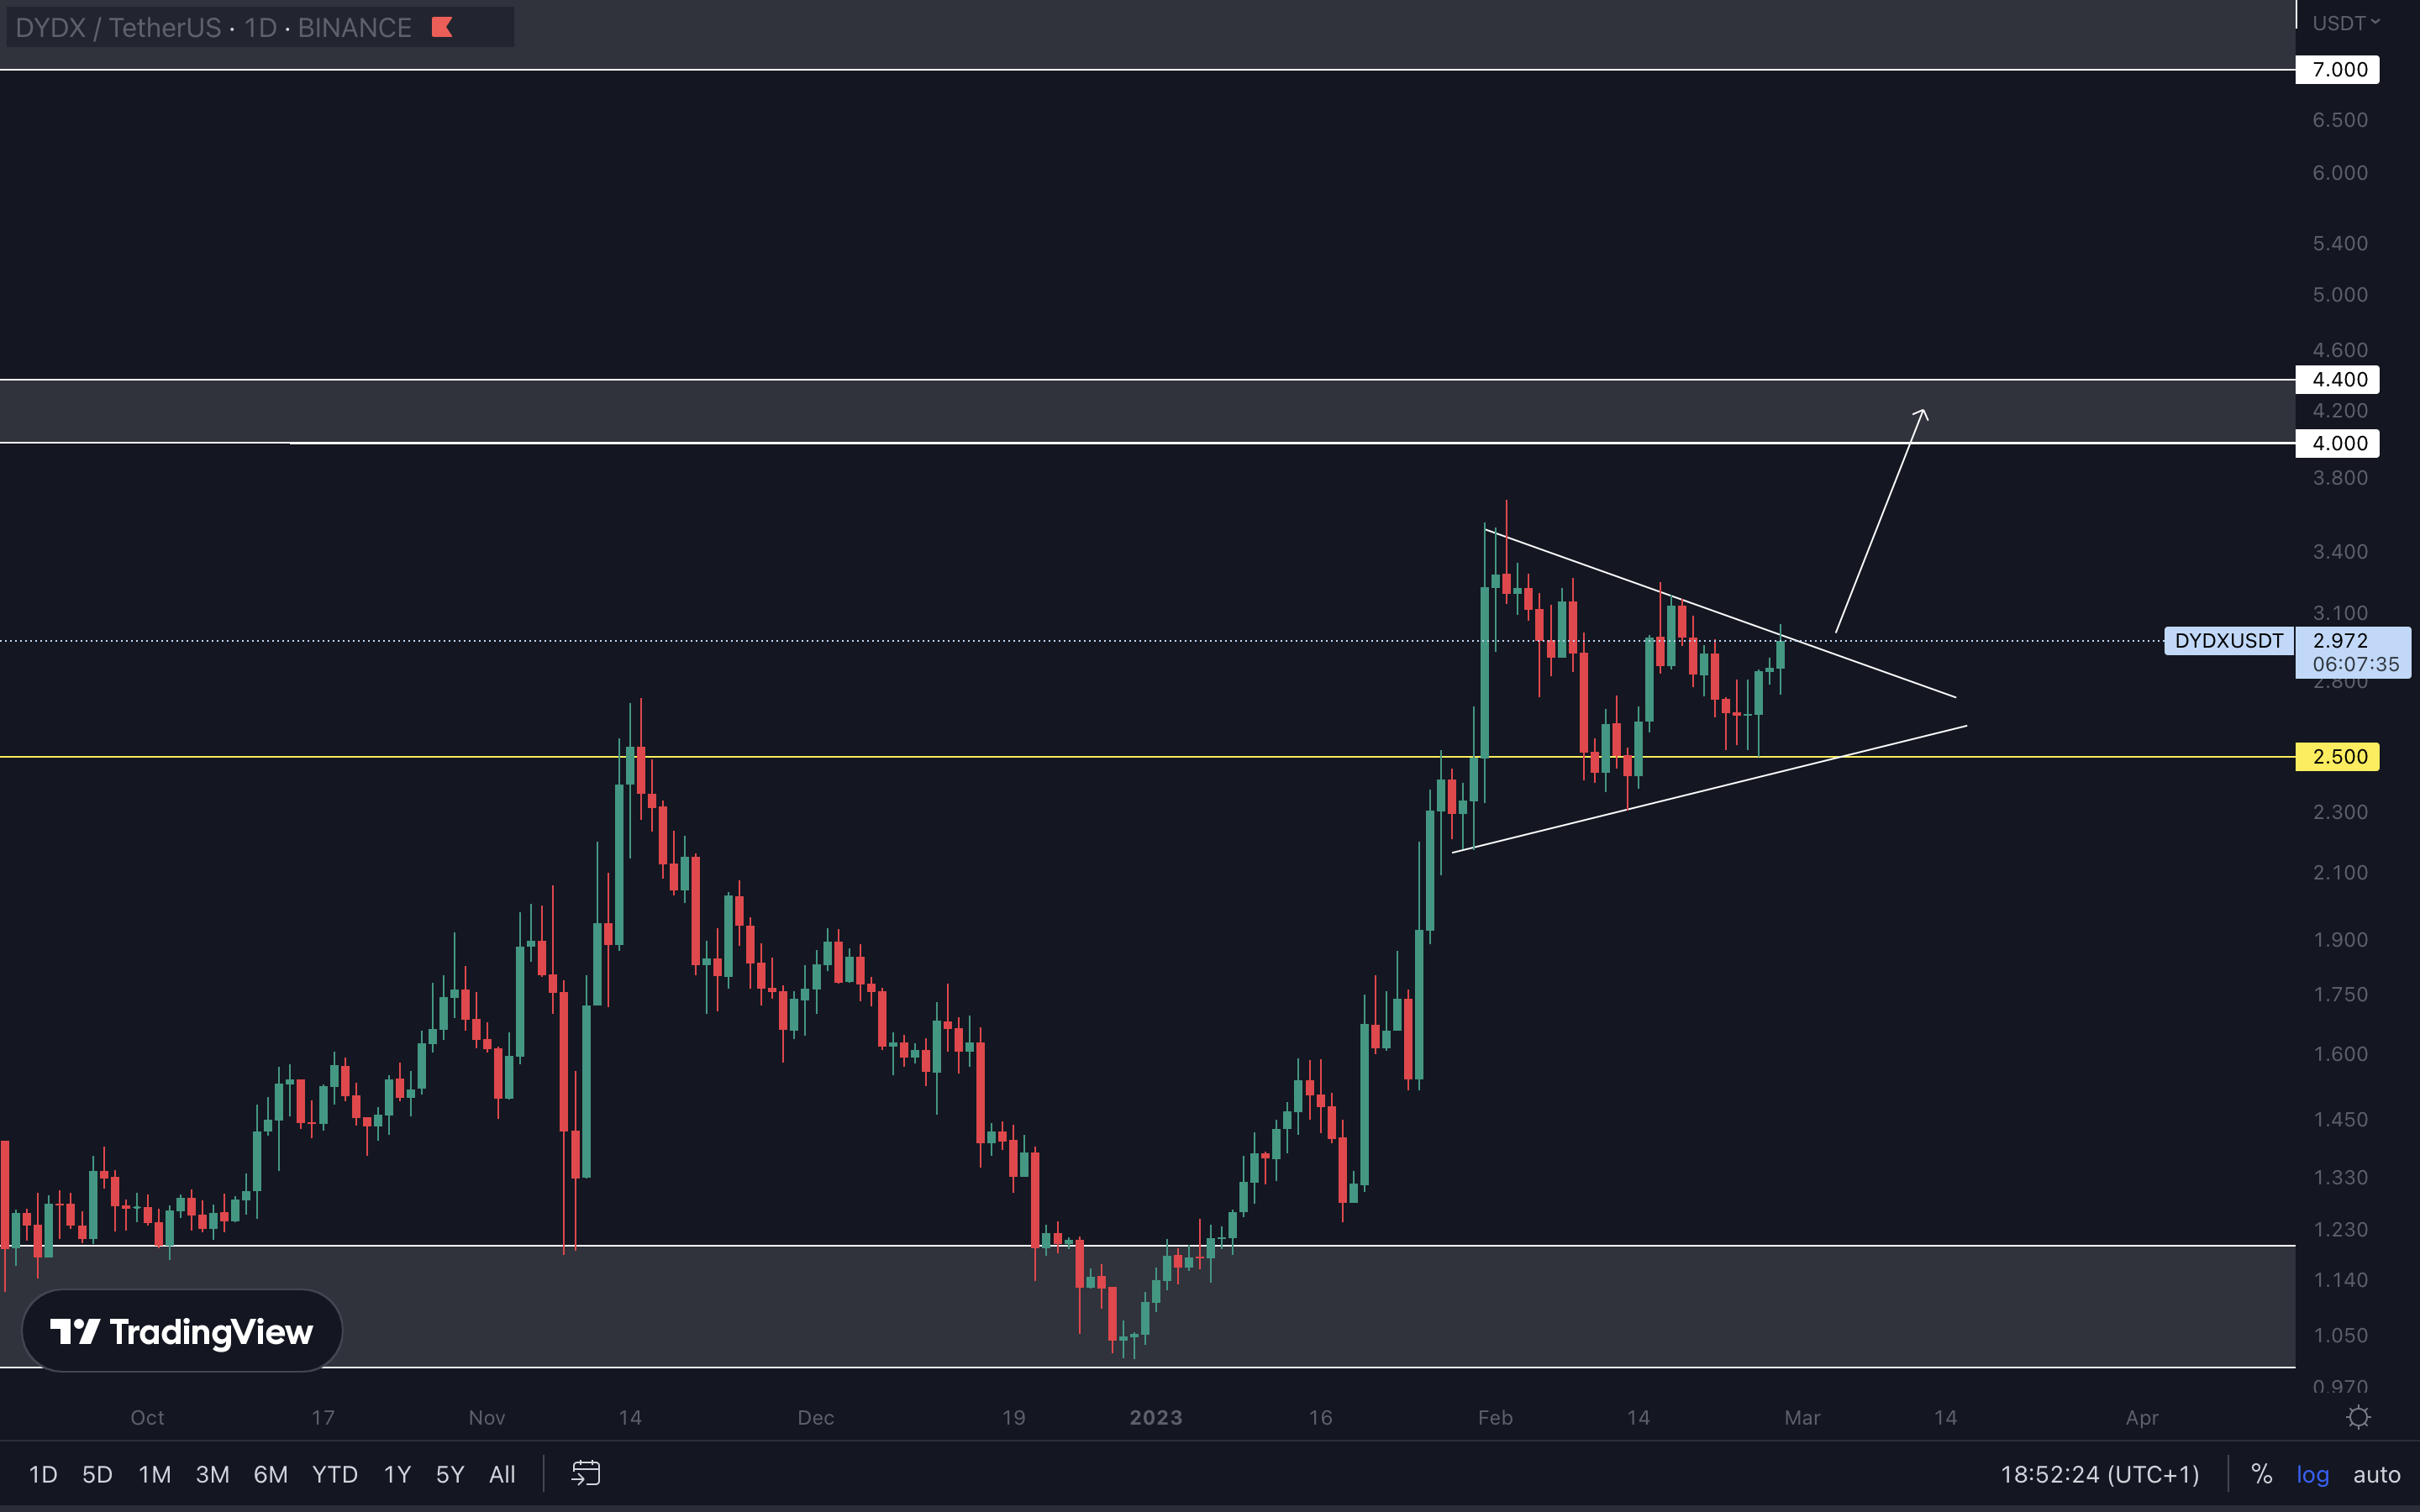
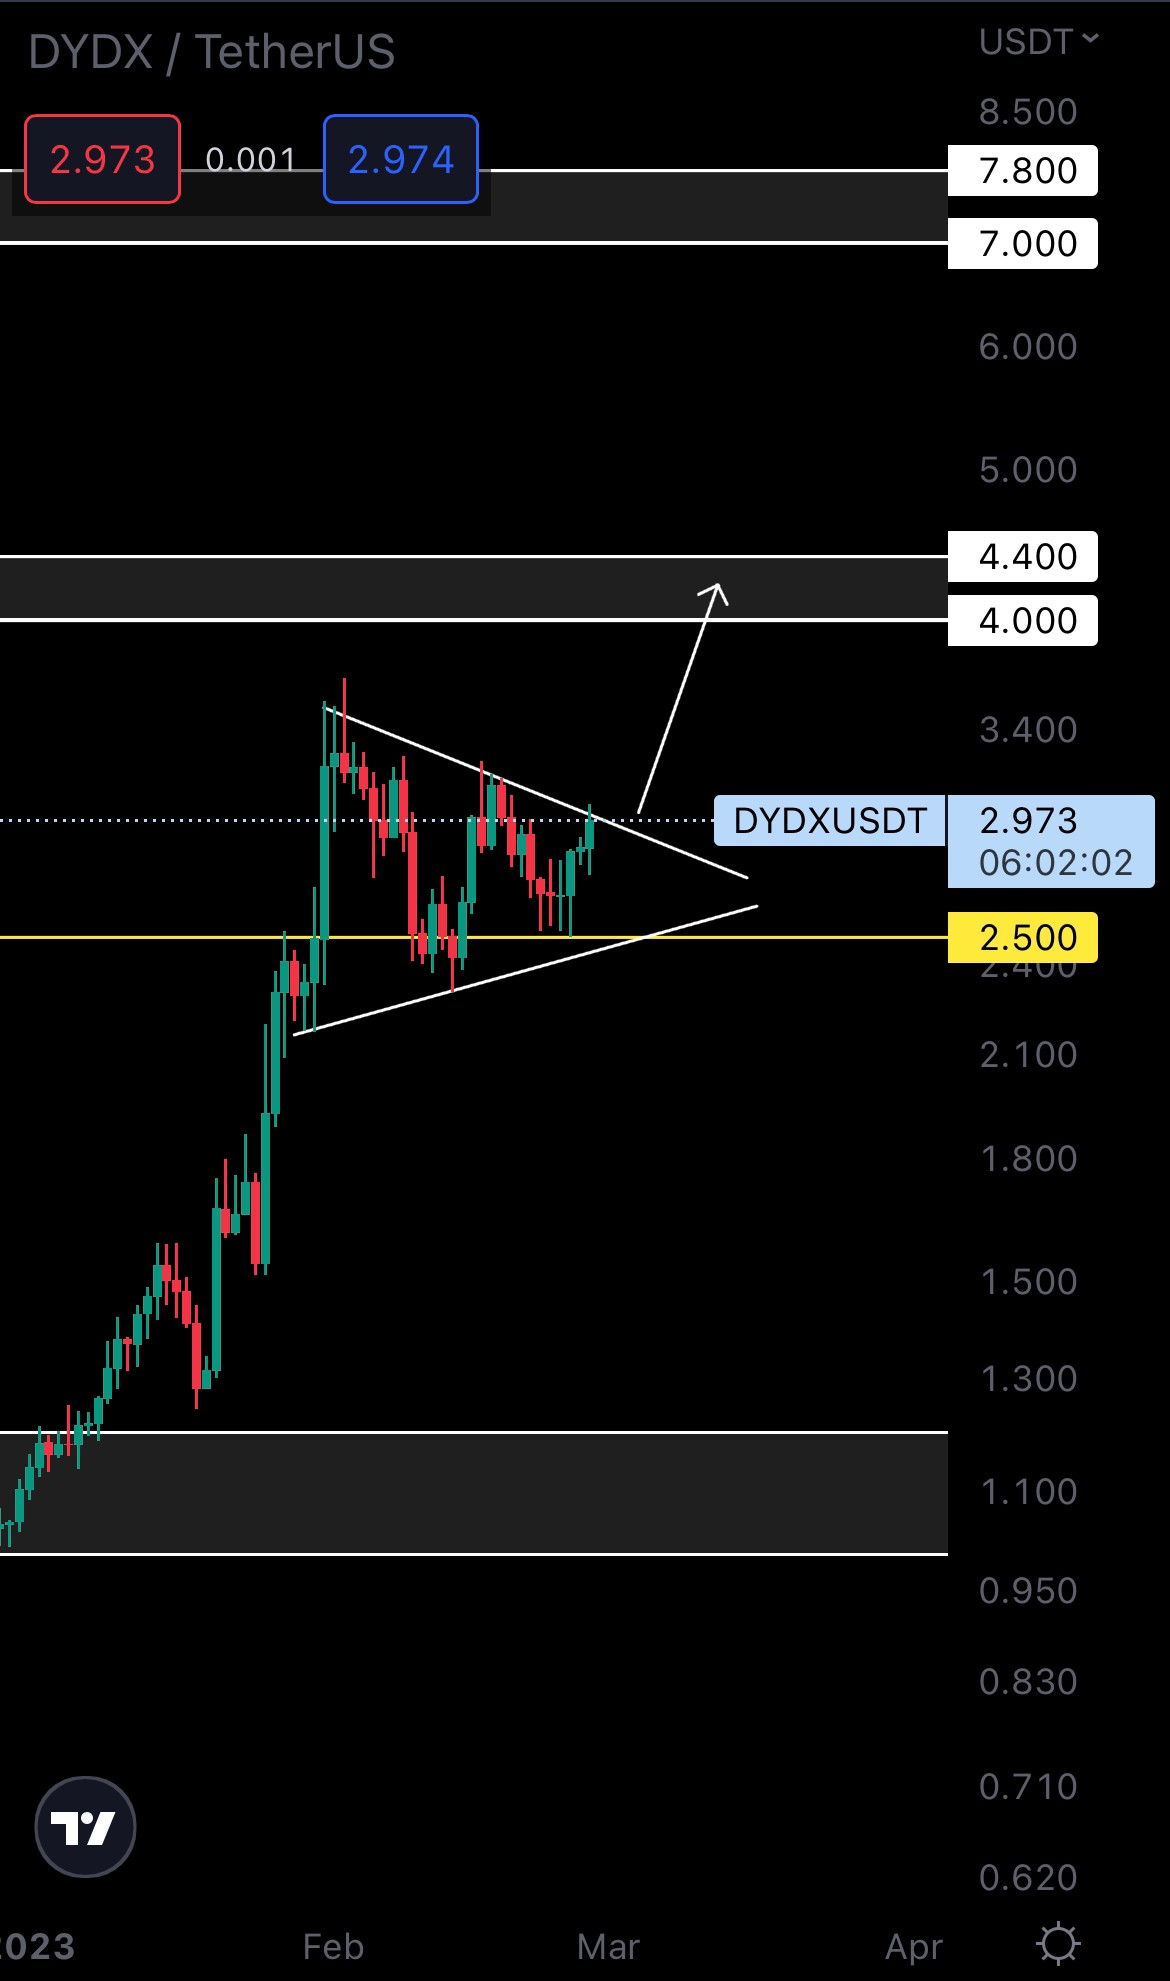
We dived into the daily timeframe here because we’ve identified a potential symmetrical triangle. When it comes to this pattern, the trend before the pattern’s formation suggests whether the asset will break to the upside or the downside. Before the pattern started to form on DYDX, the trend was bullish. From a technical standpoint, this increases the odds of it breaking to the upside. We’ll continue tracking it and see how it progresses. In case of a break in either direction, you should also pay attention to the volume. Higher volumes upon breakout or breakdown are important.
Cryptonary's Watchlist
DOT | Polkadot (Weekly)
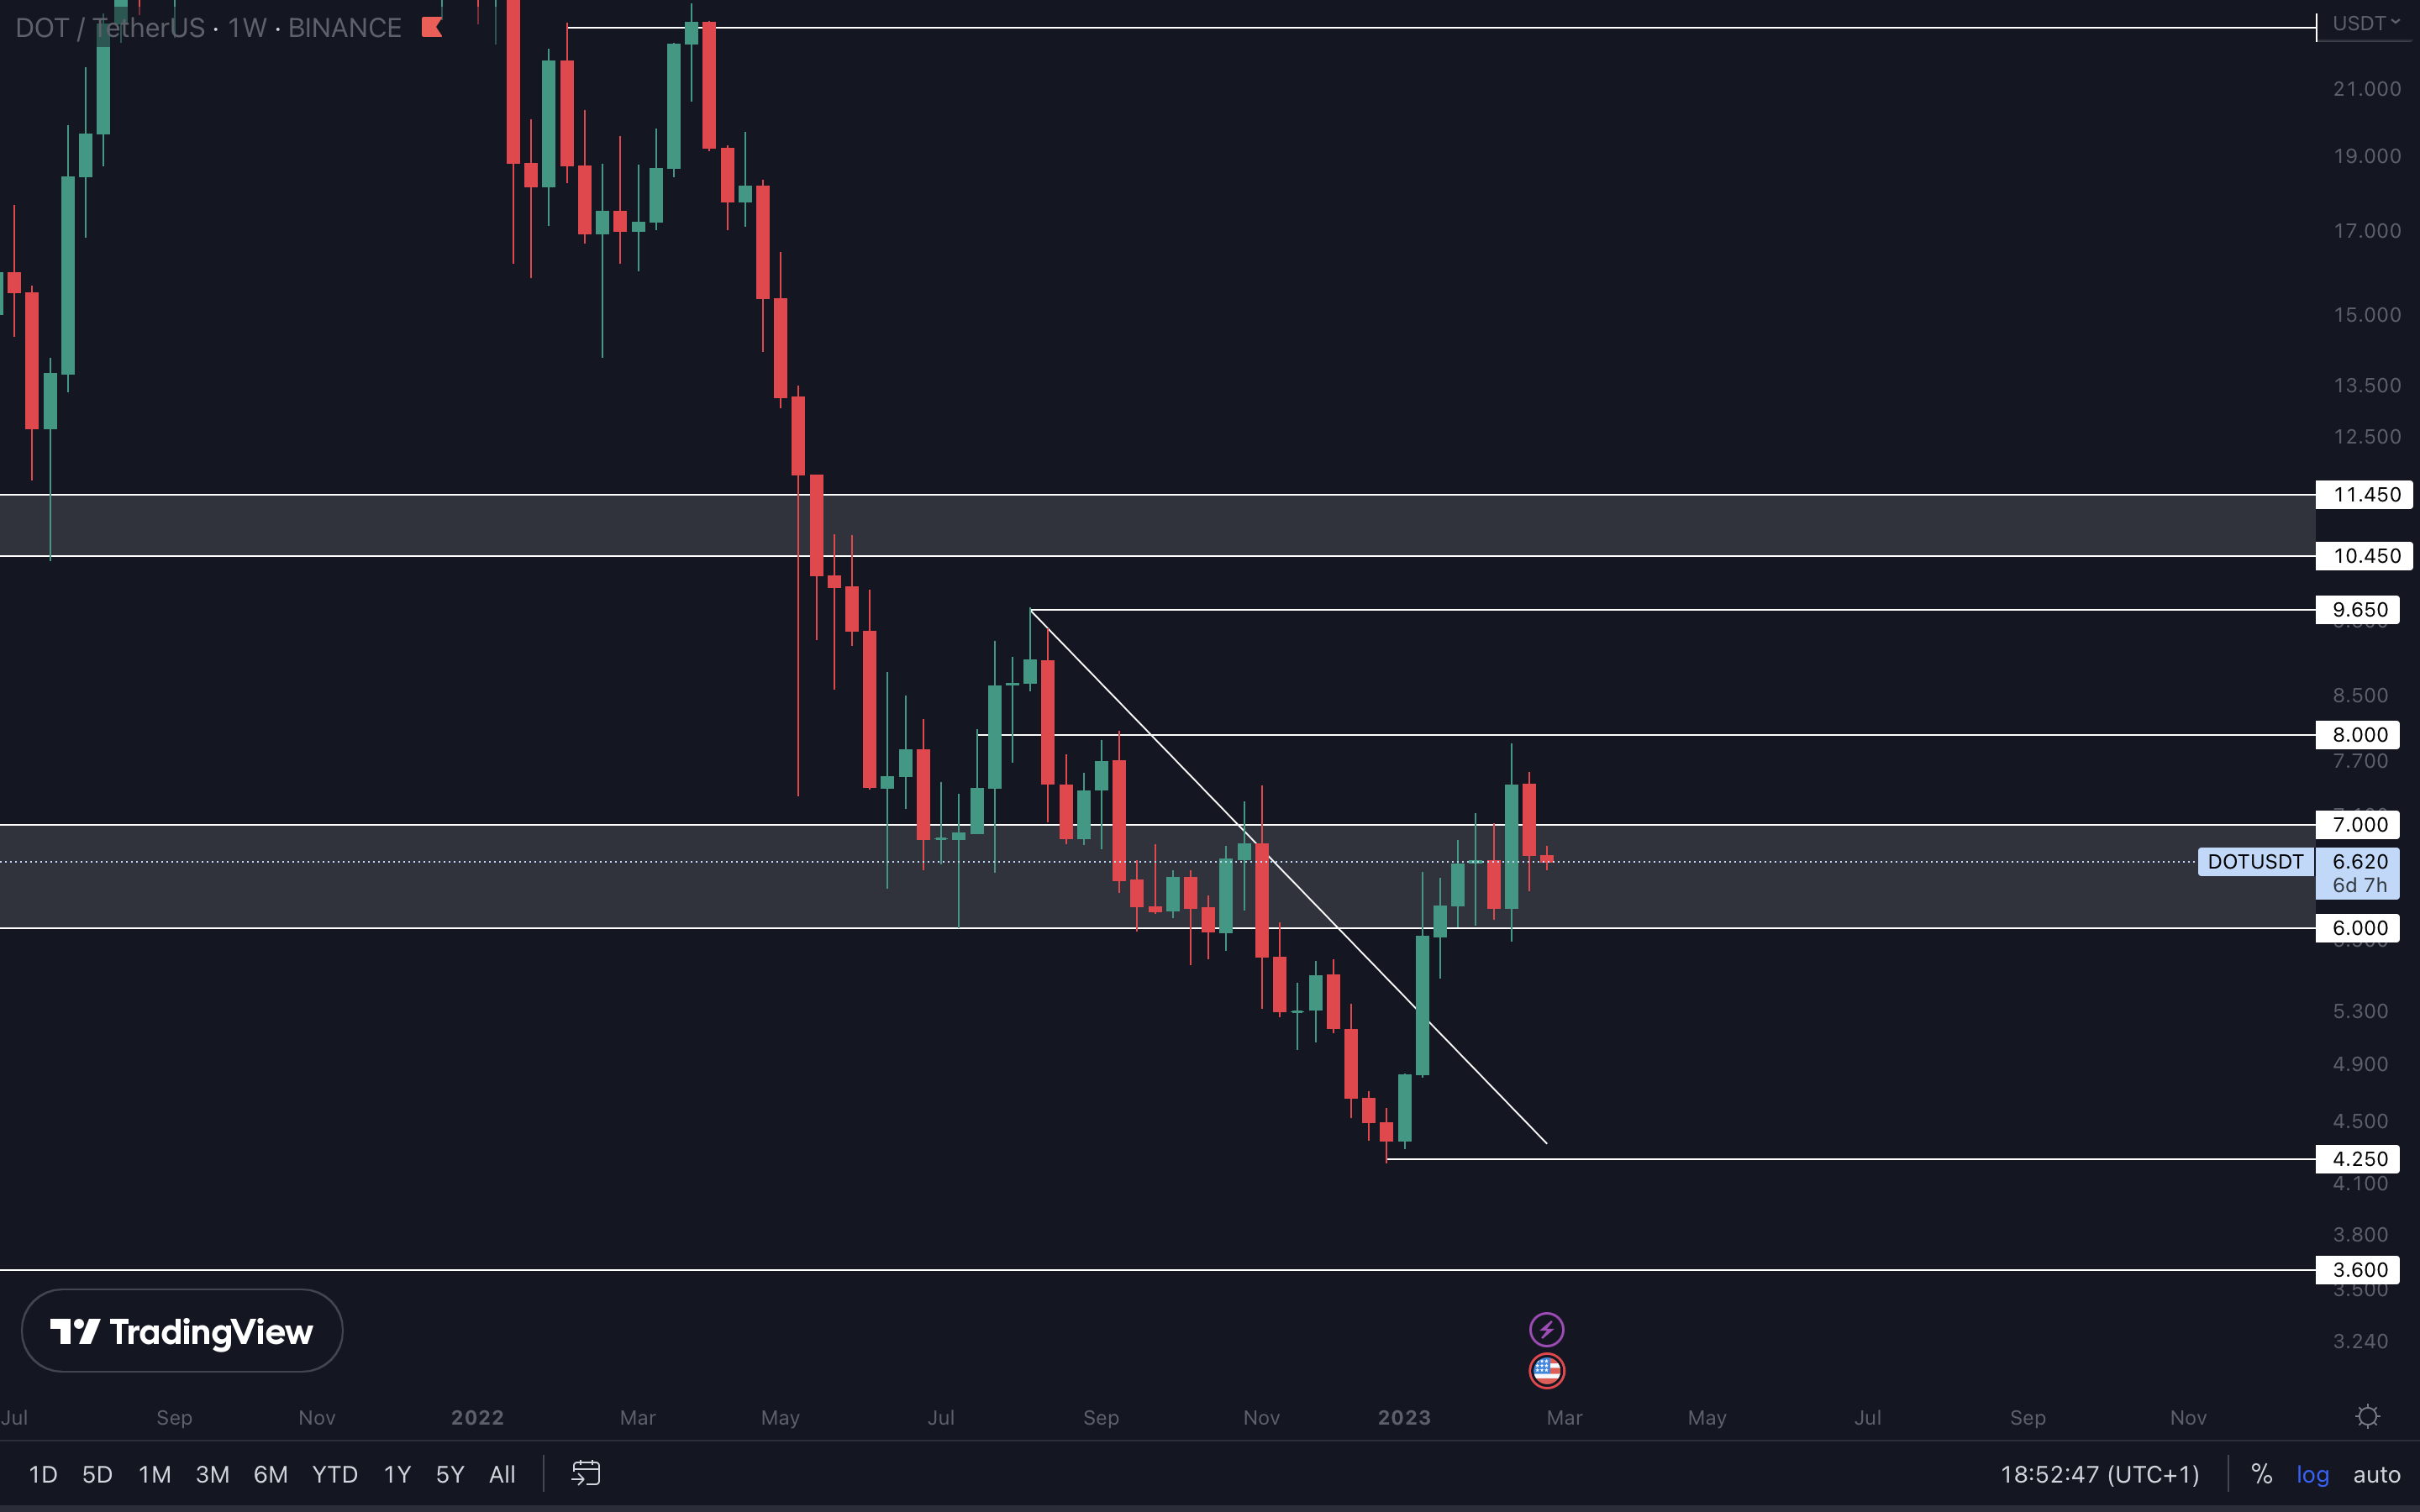
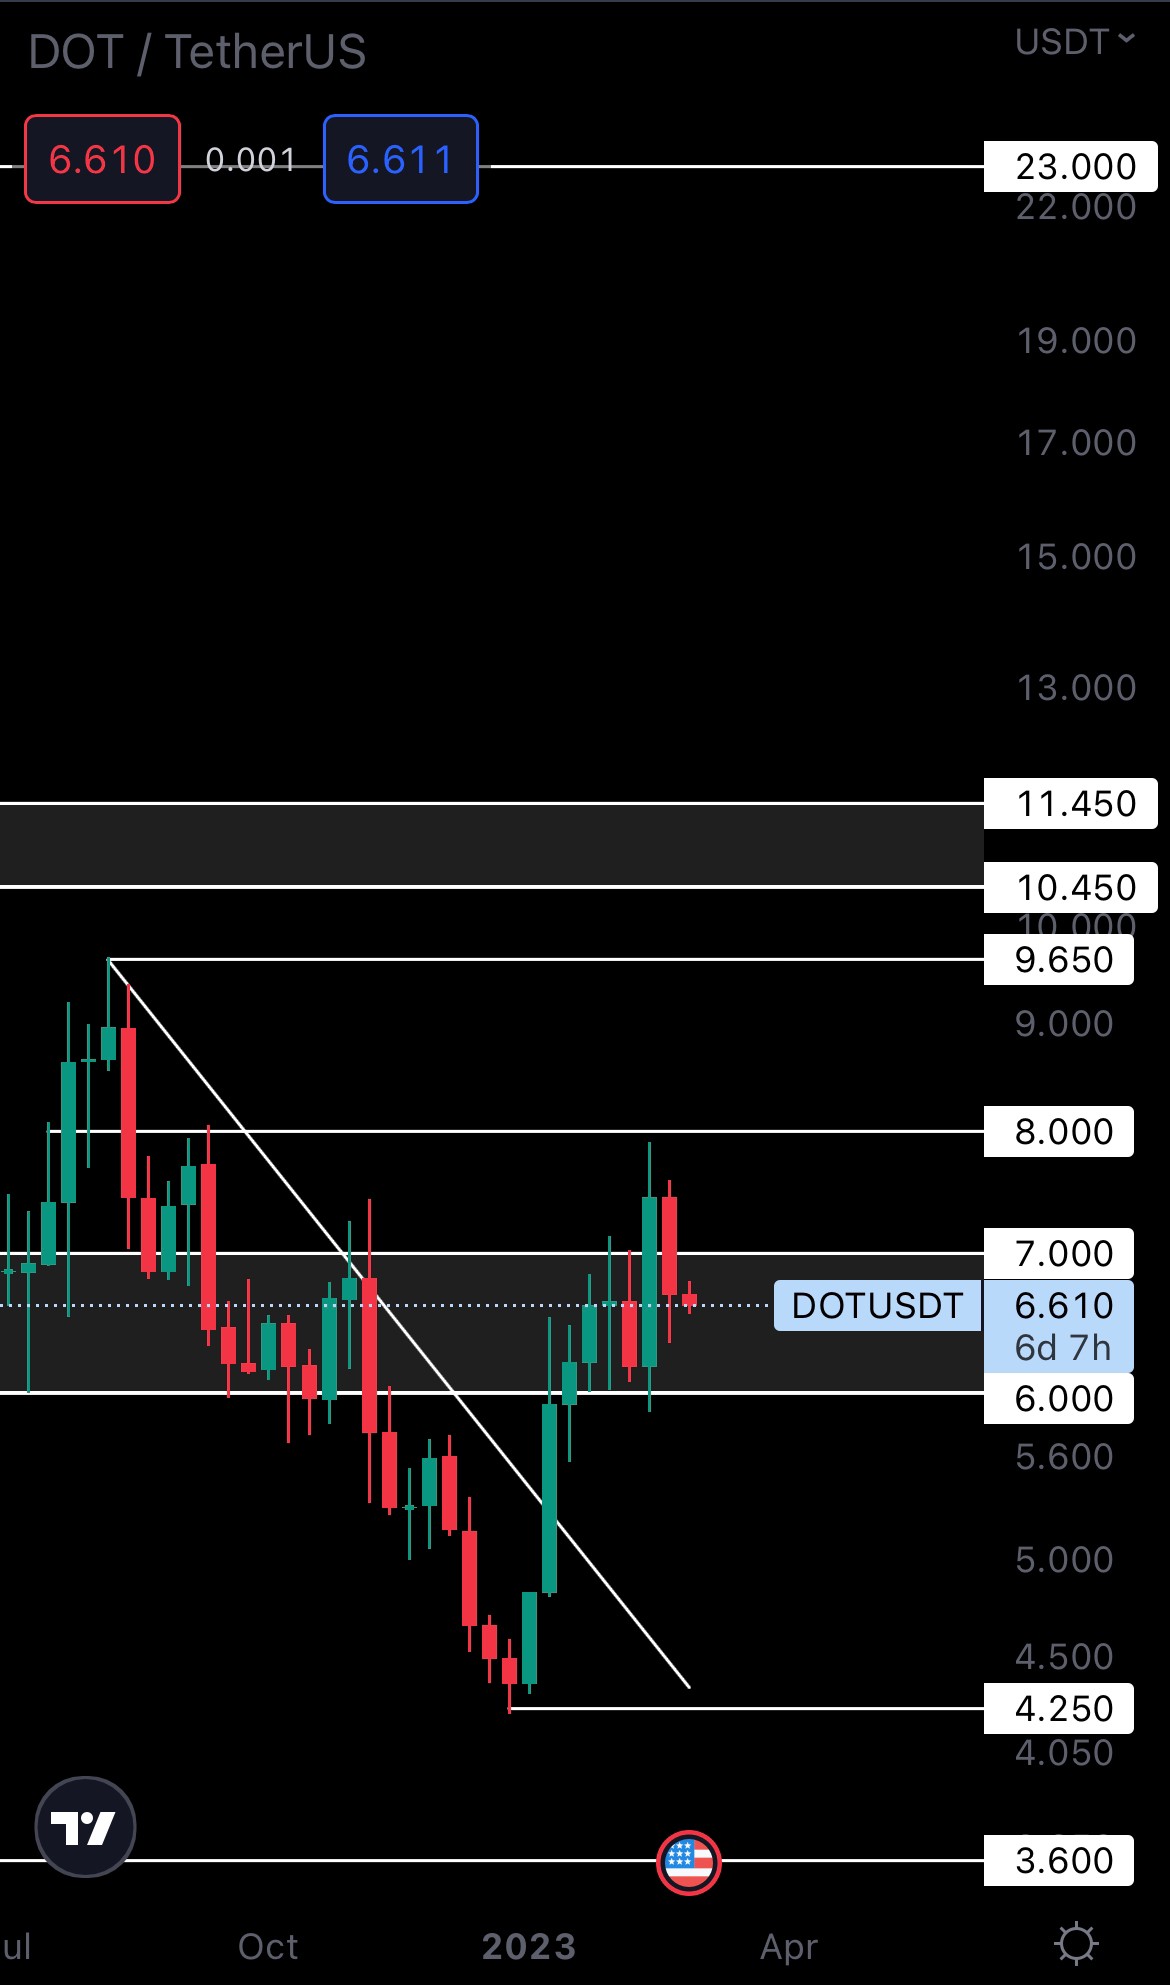
DOT was unable to hold itself above $7 and closed last week’s candle back under that level. This invalidates the move to $8 and opens the road for $6. How Bitcoin progresses in the coming weeks will drive DOT in the same direction.
SYN | Synapse (Weekly)
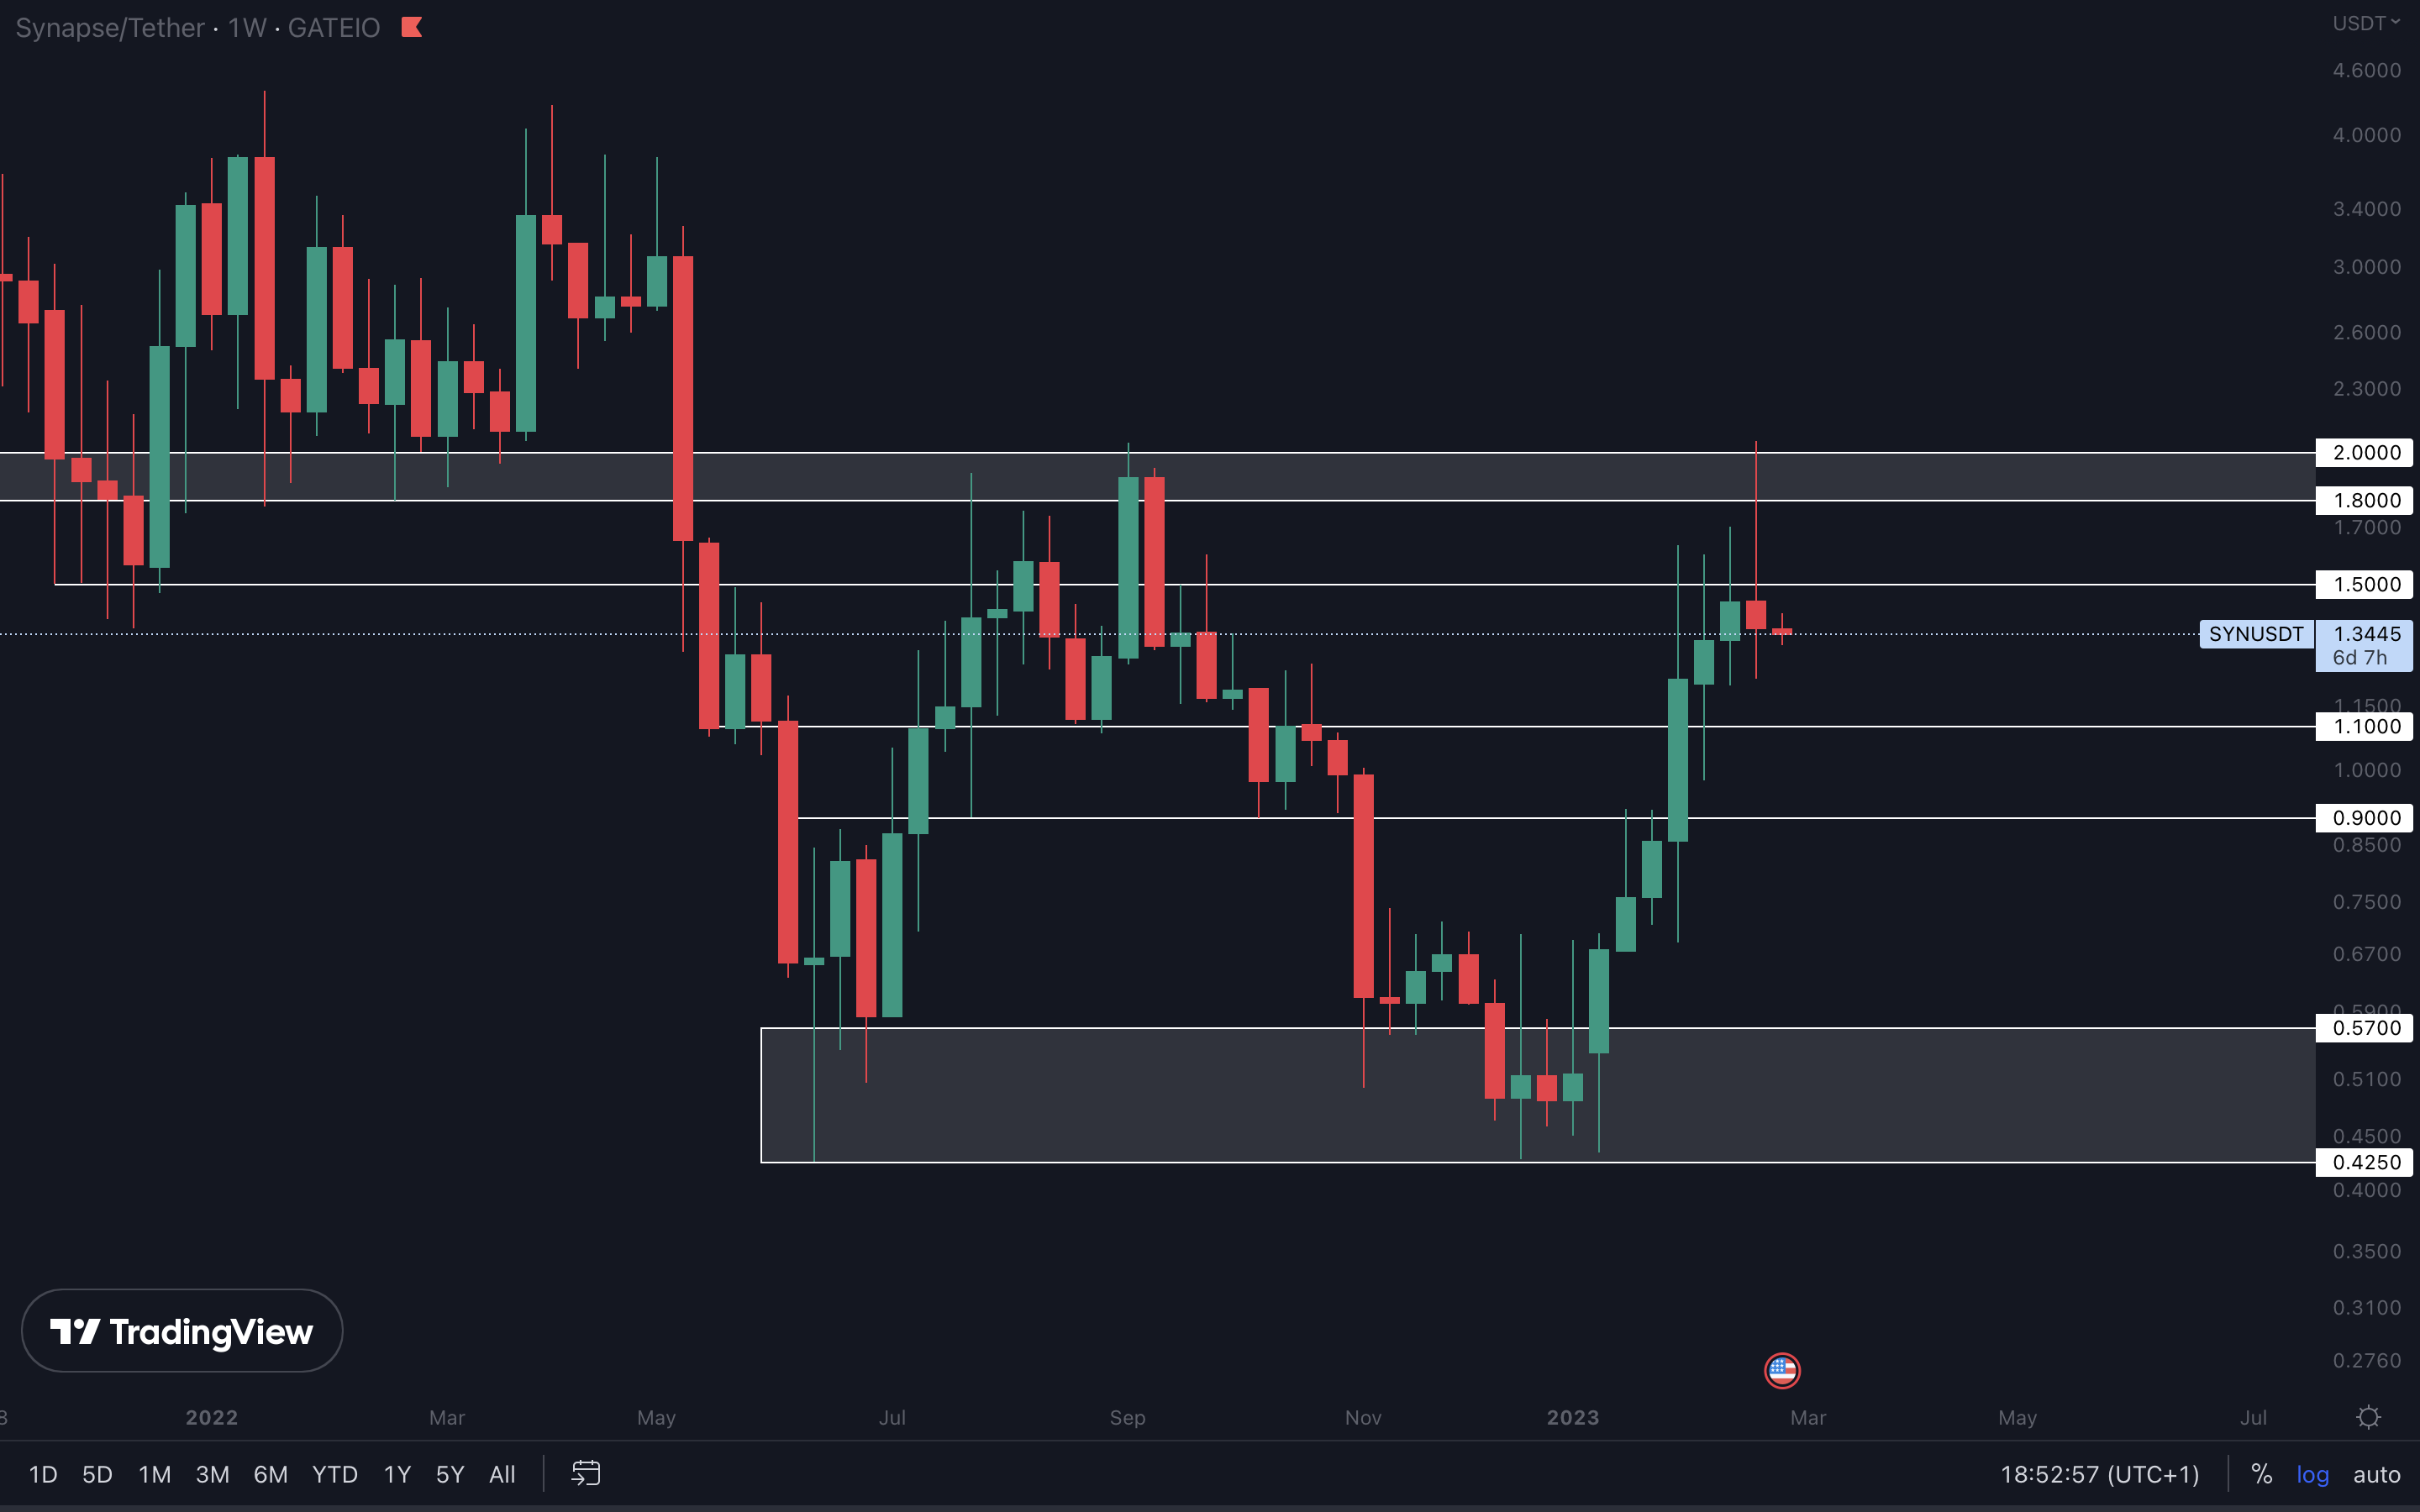
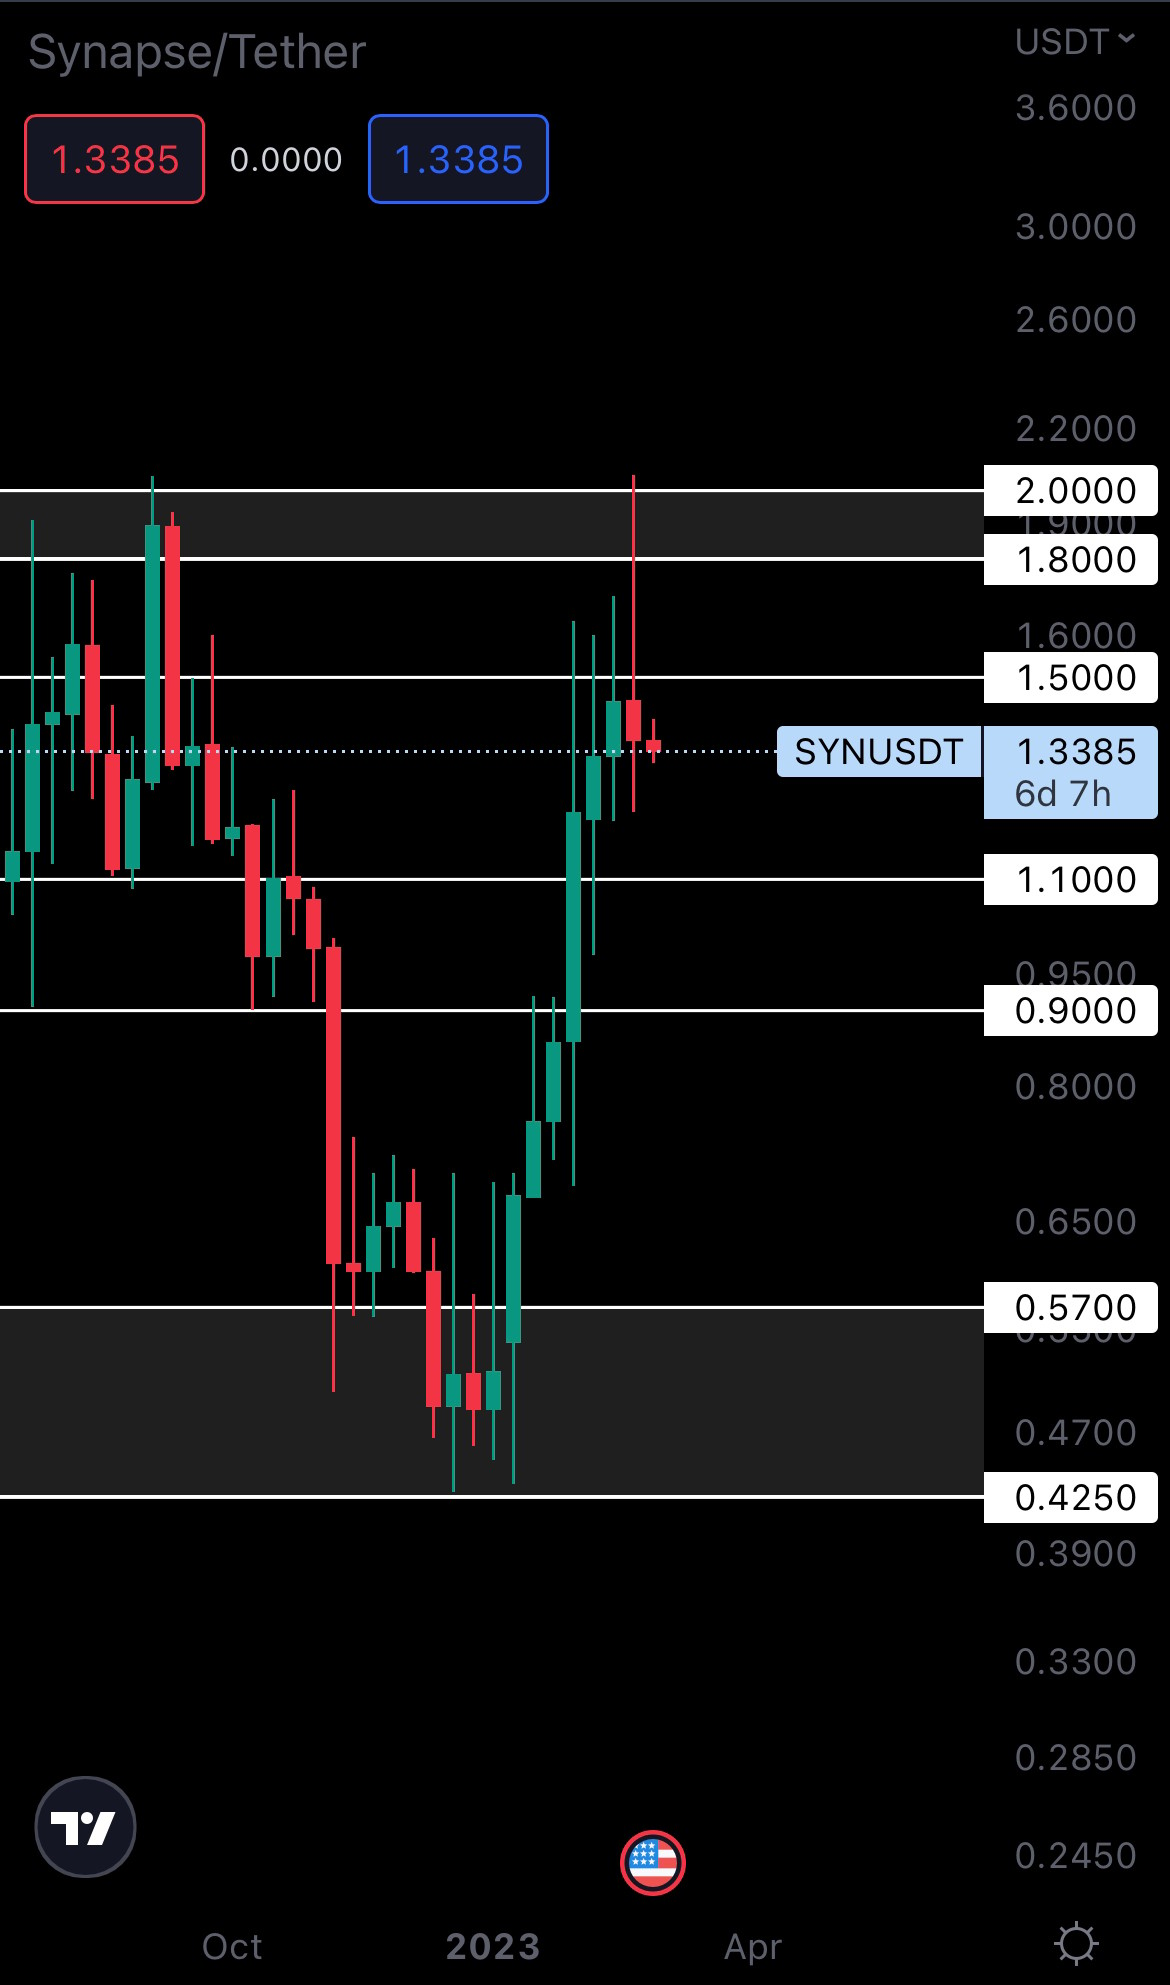
We can obviously see the extreme selling pressure that occurred last week (check the wick). Sellers were able to invalidate the entire buying pressure from last week and even close under resistance. This increases the odds of a rejection. So, because SYN closed under $1.50, this level remains resistance, and unless we see a weekly closure above it, the asset could test $1.10 (nearest support) in the coming weeks.
OP | Optimism (Weekly)
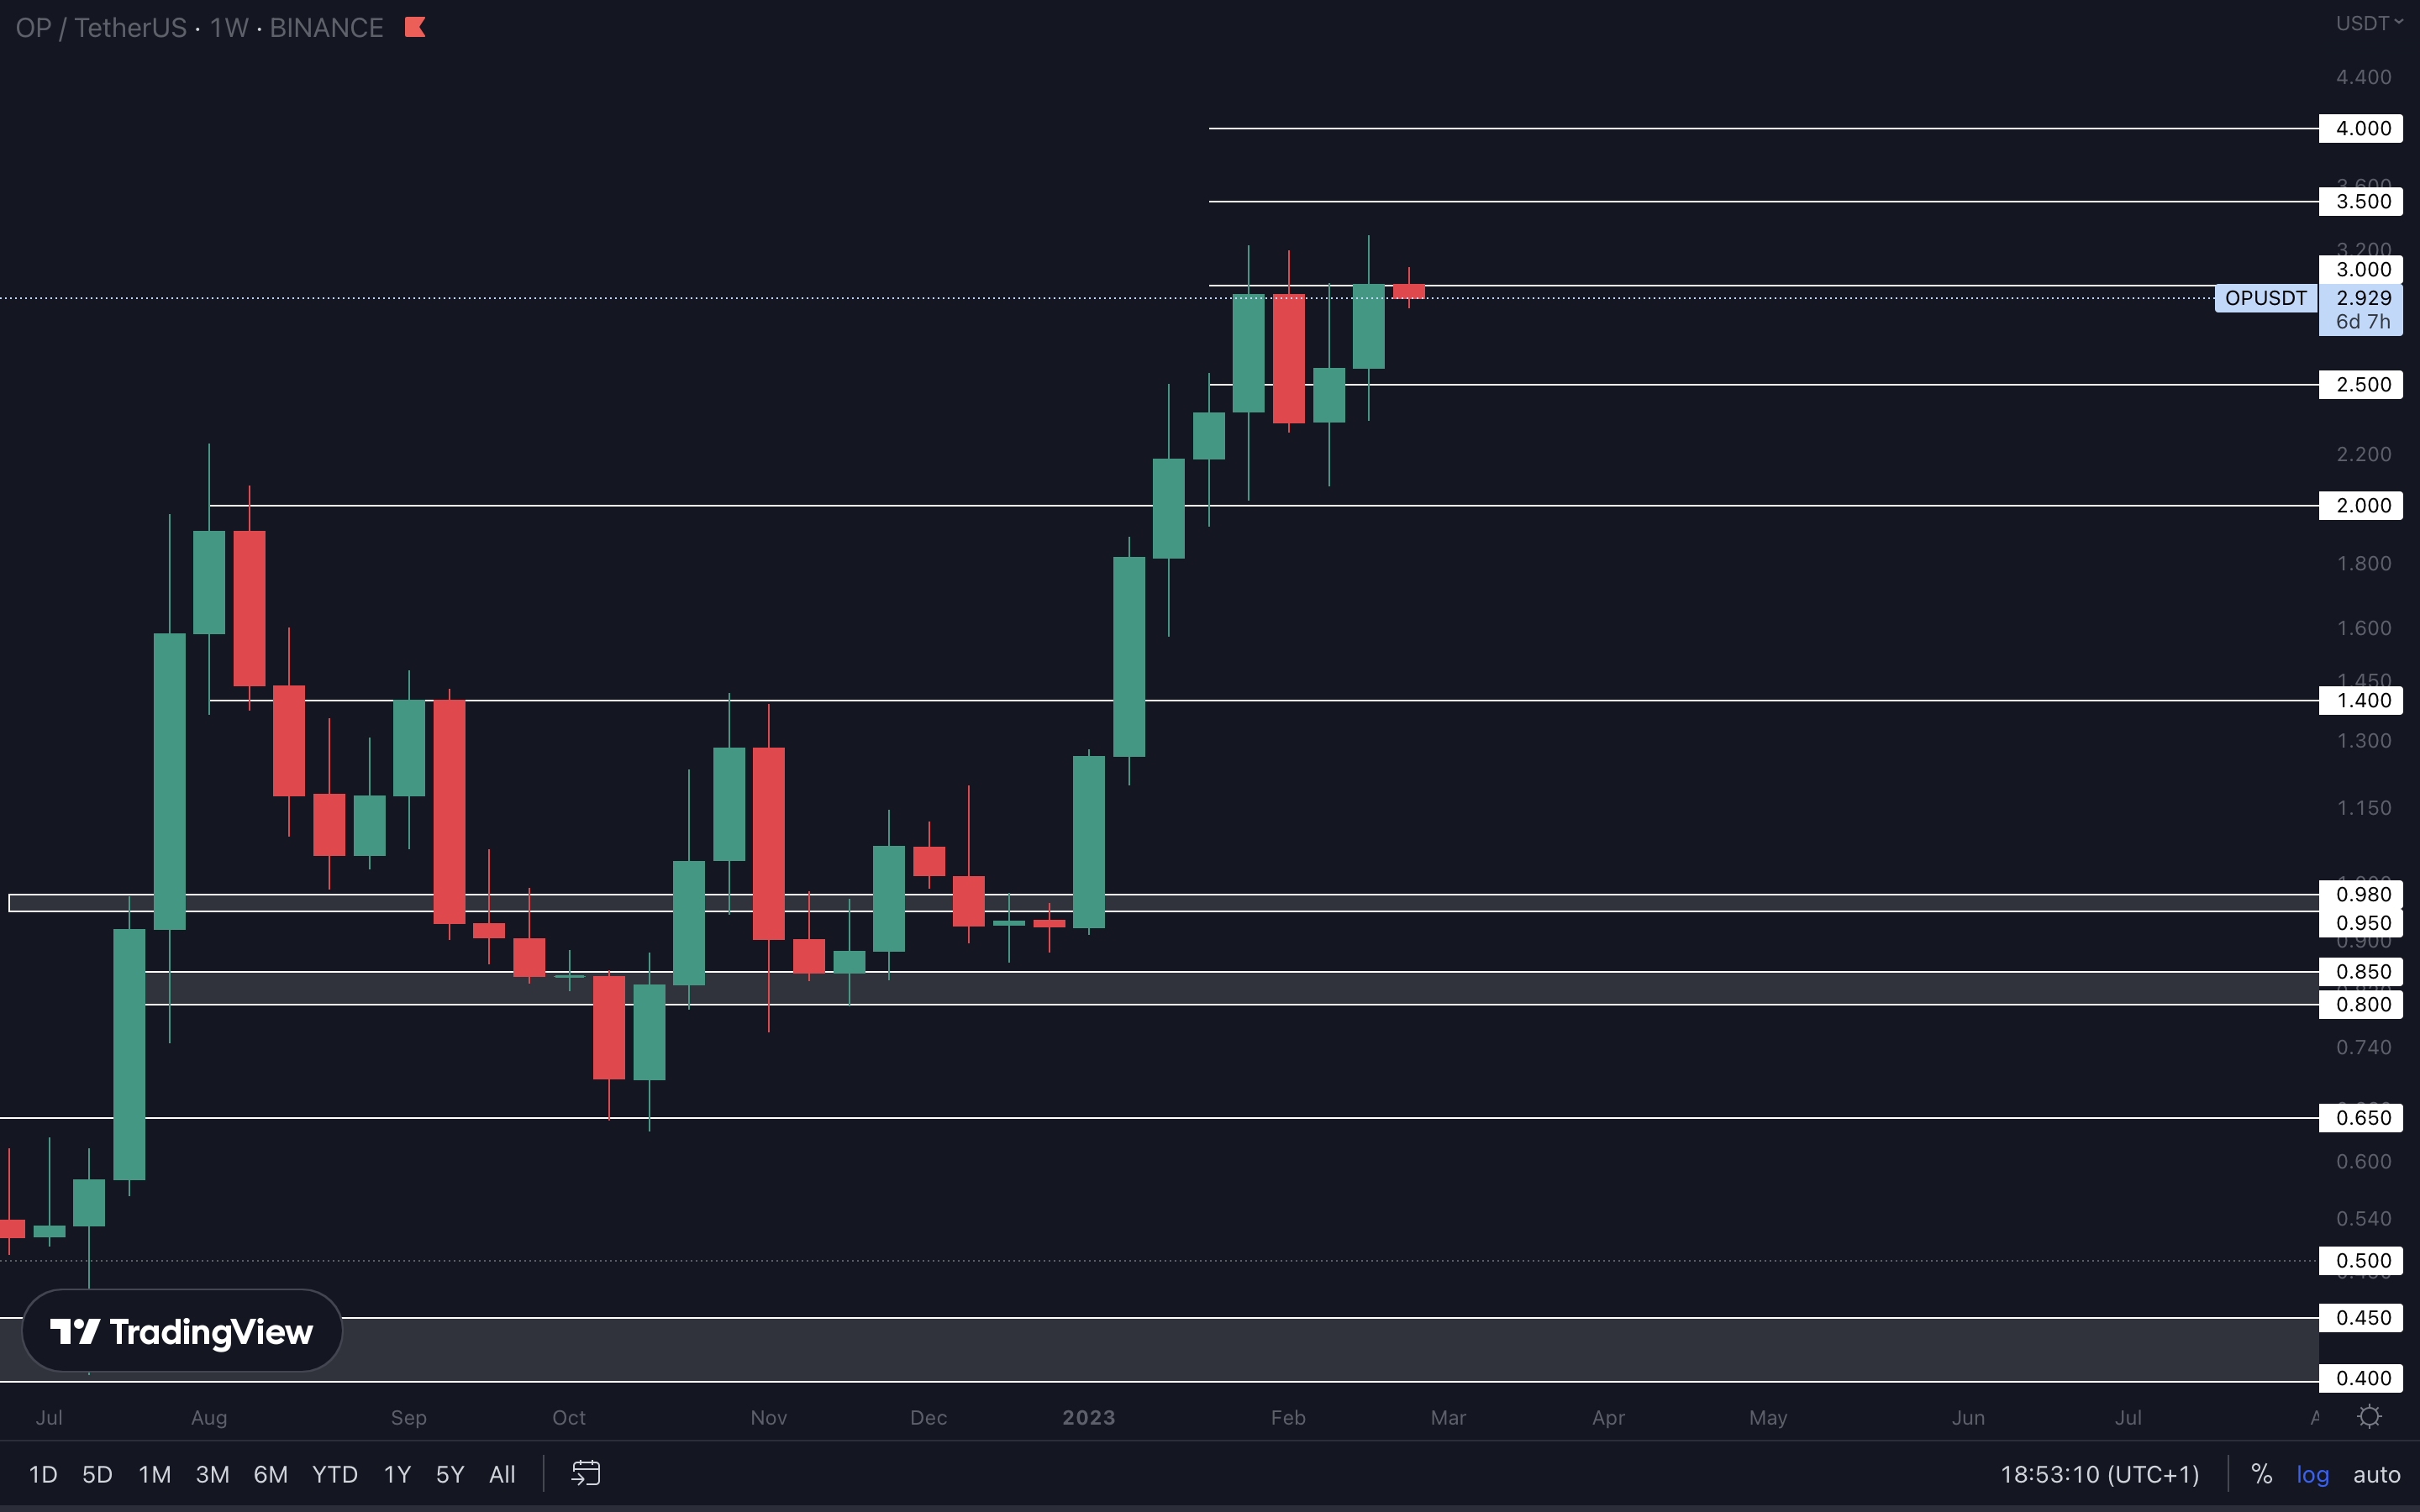
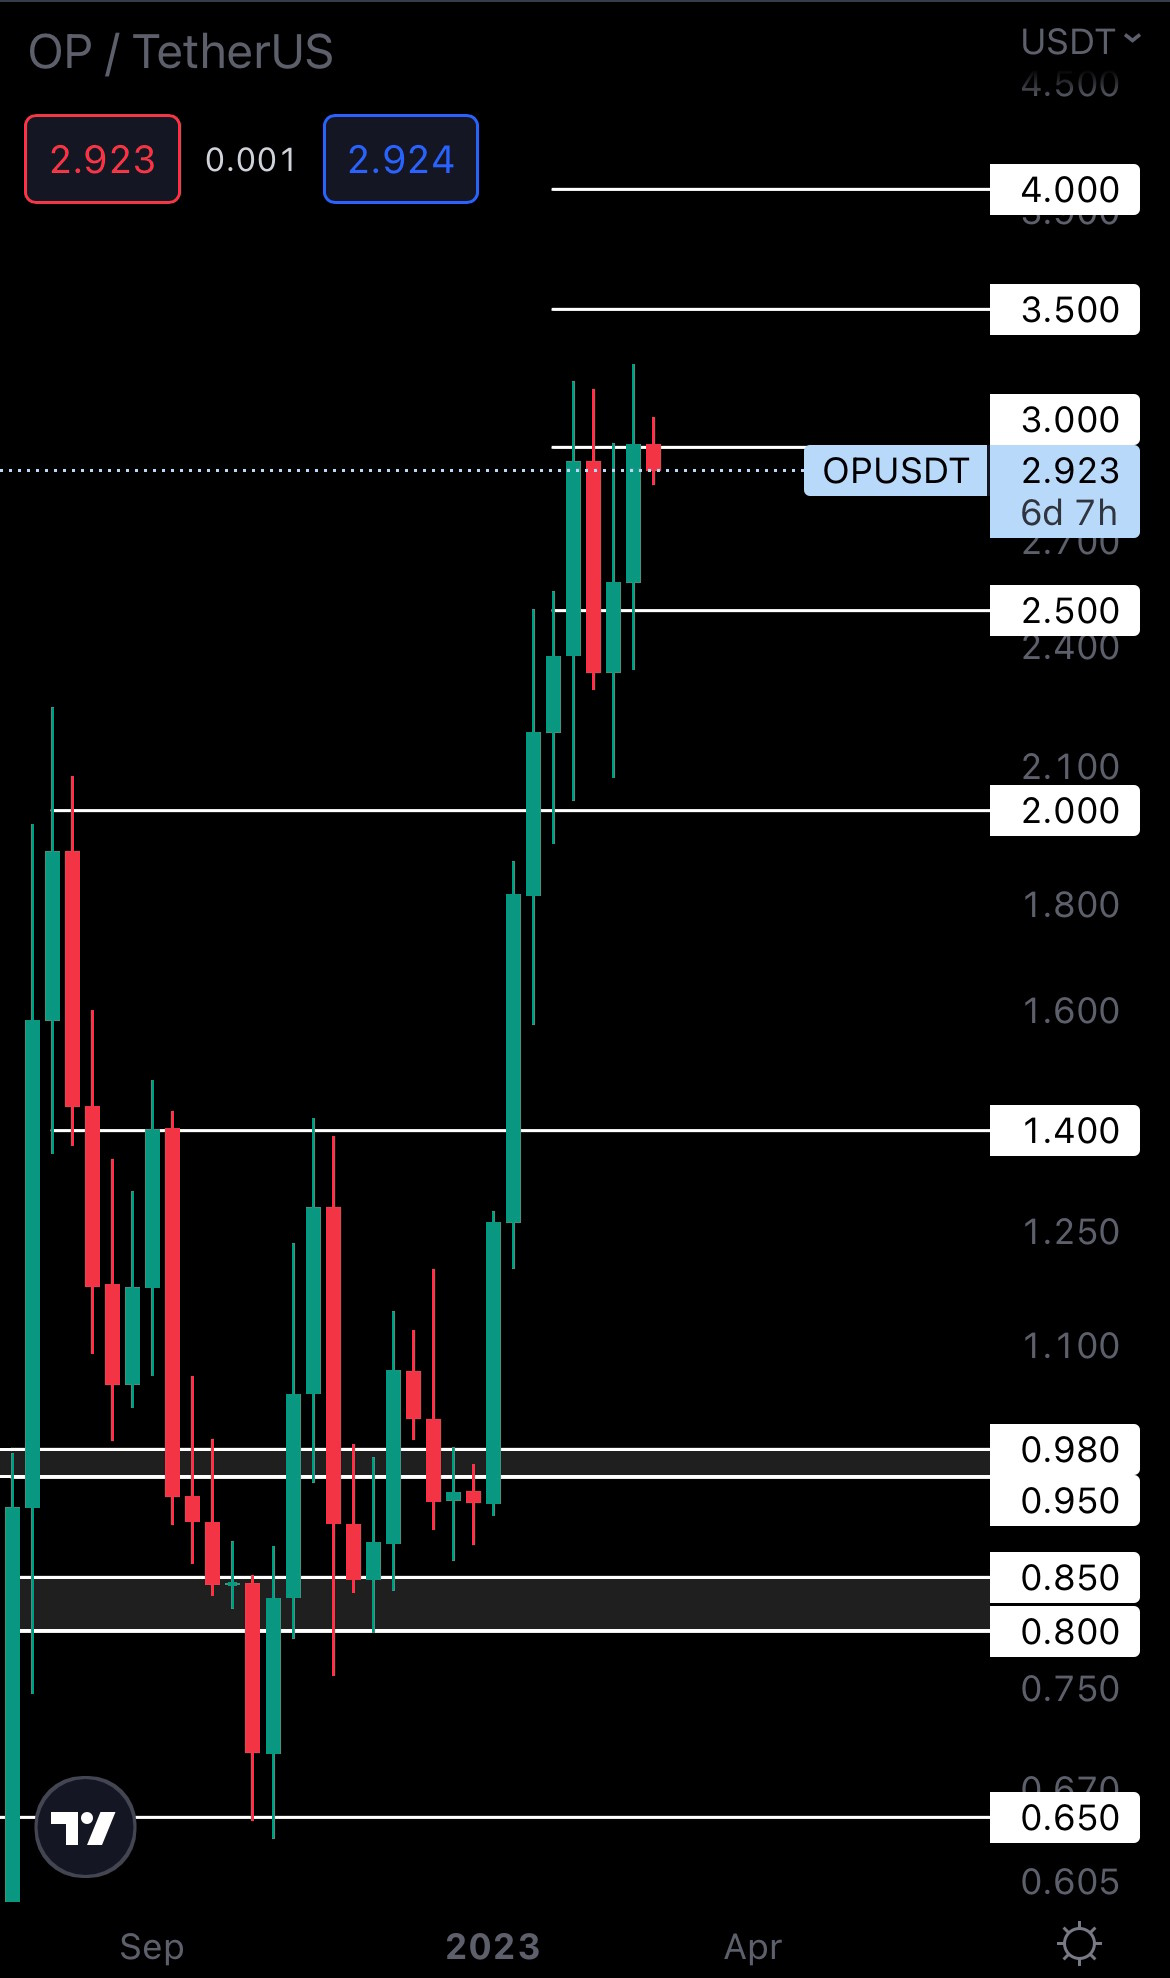
OP closed right into resistance. To confirm further upside, we’ll need to see a weekly closure above $3 this week. A new weekly high was formed last week, which keeps the market structure bullish and healthy. If Bitcoin breaks above $25,150, we could see OP reaching $4 - $5 based on its current volumes.
LDO | Lido DAO (Weekly)
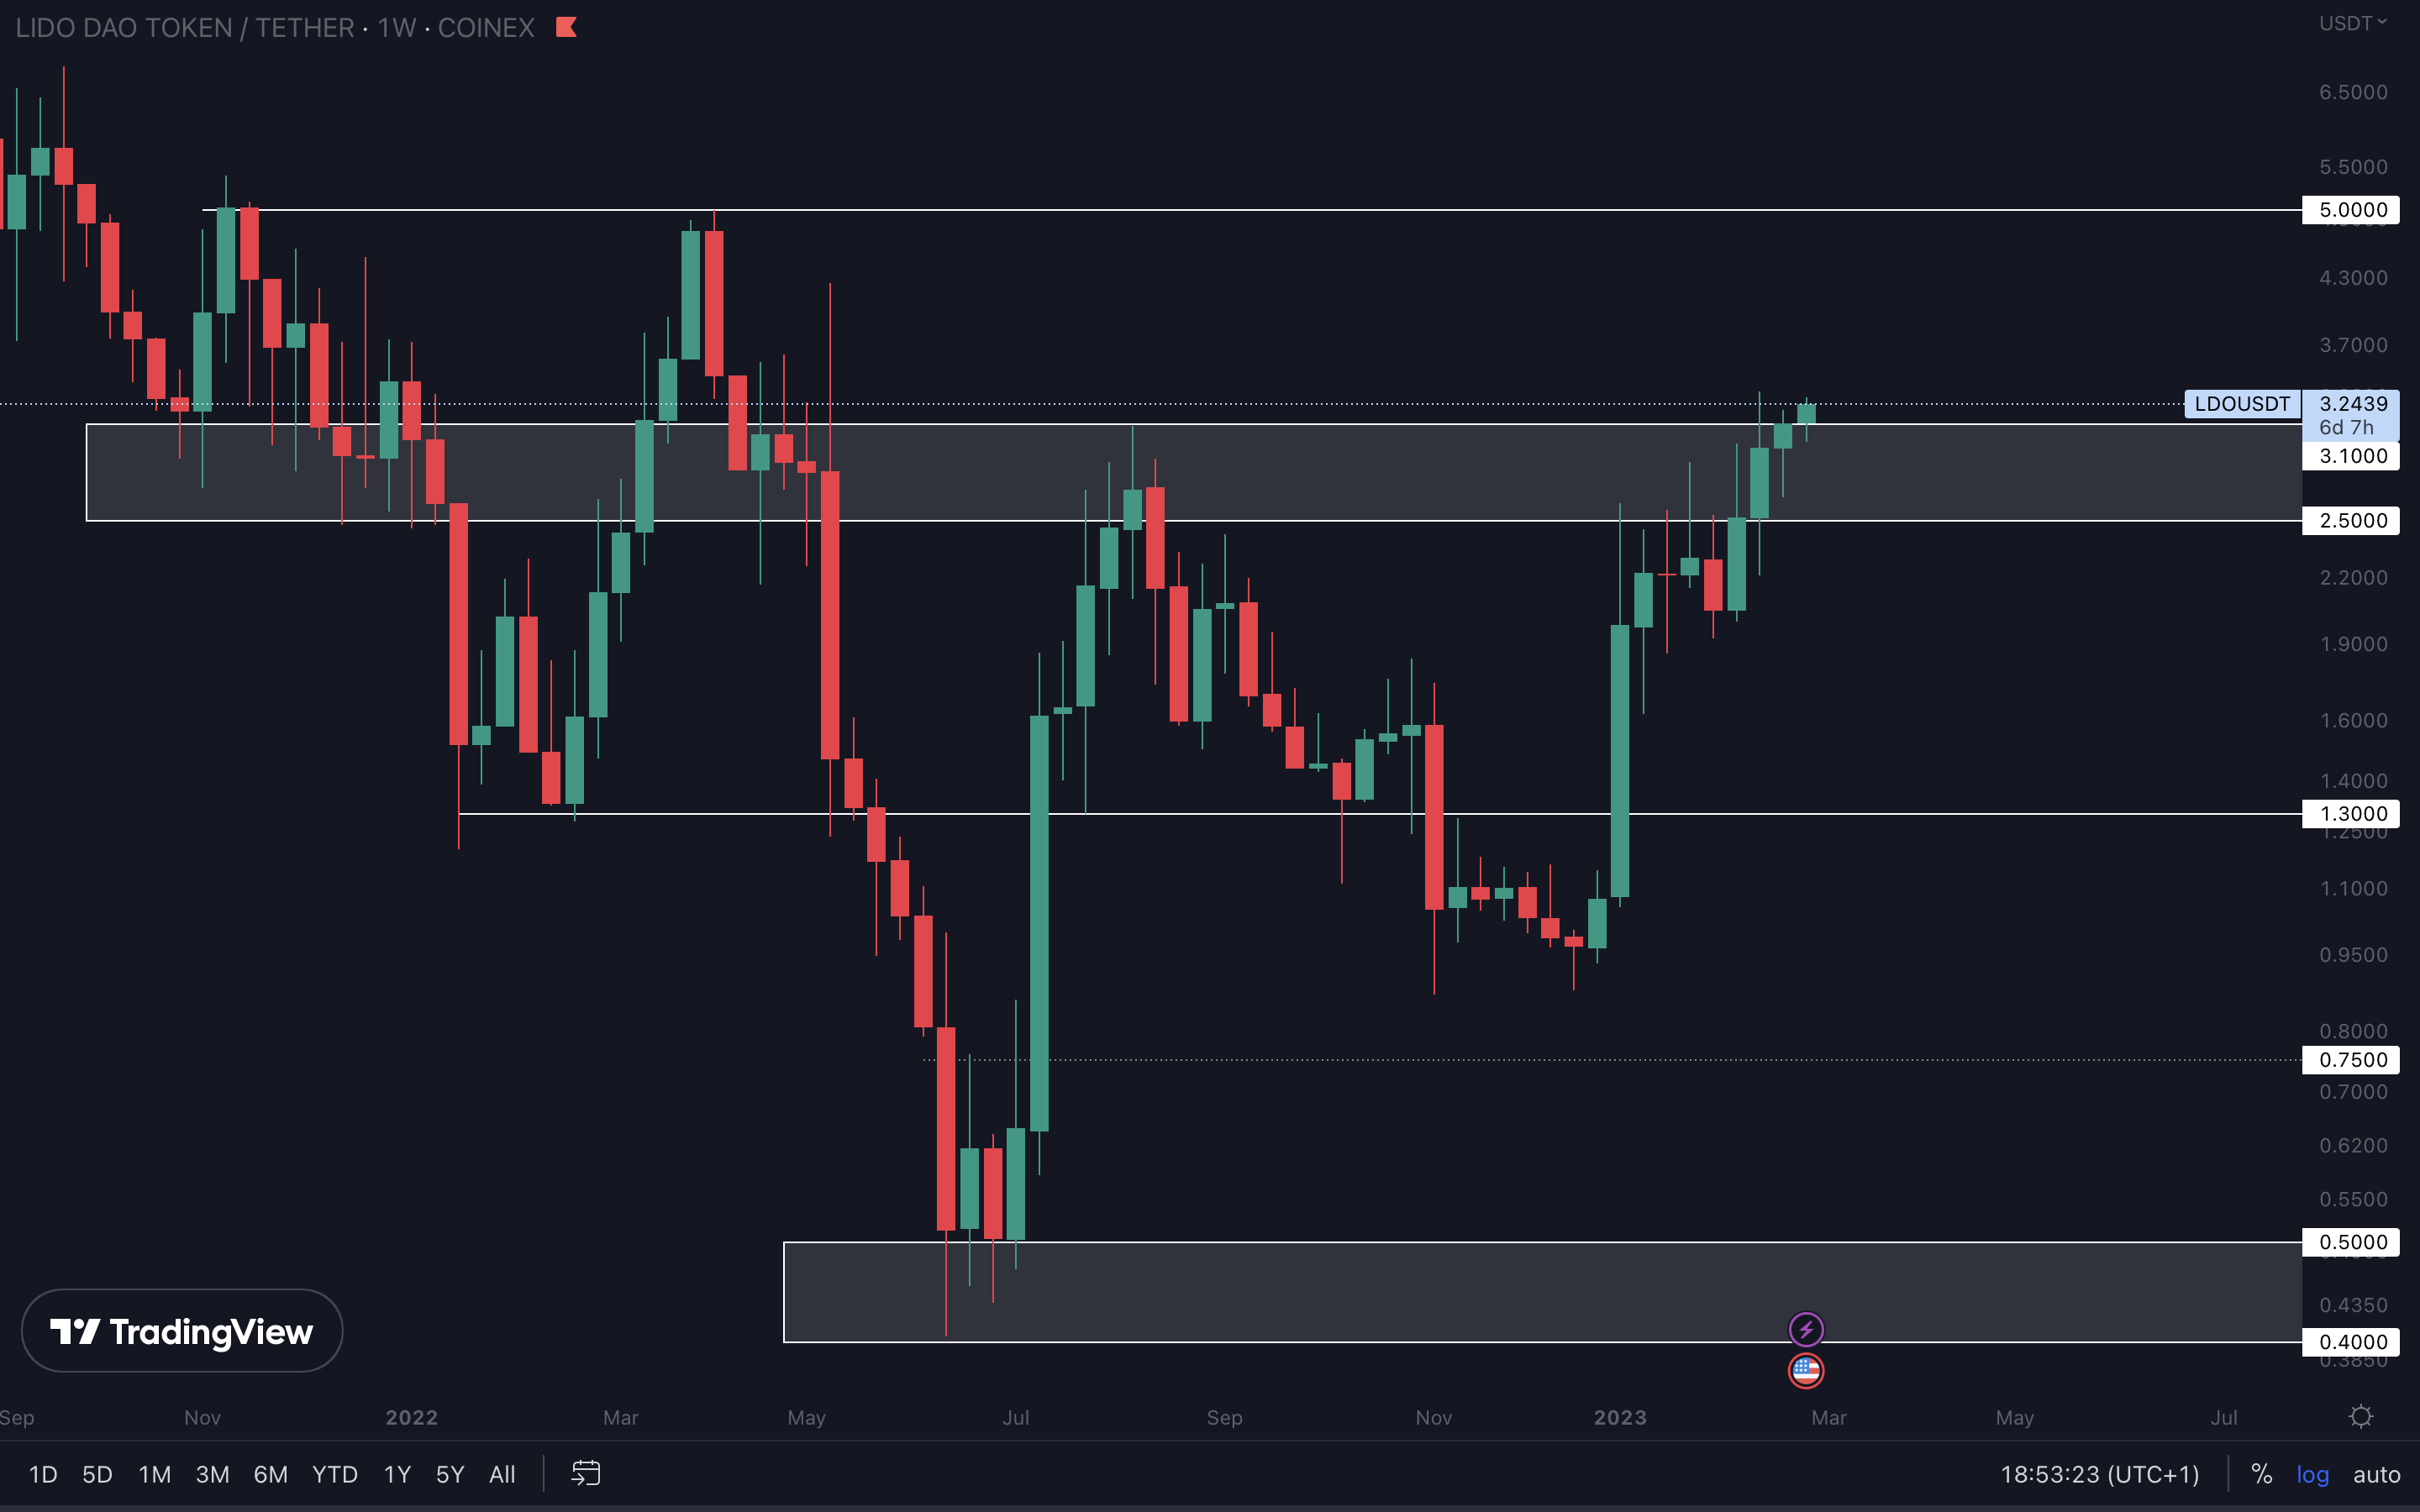
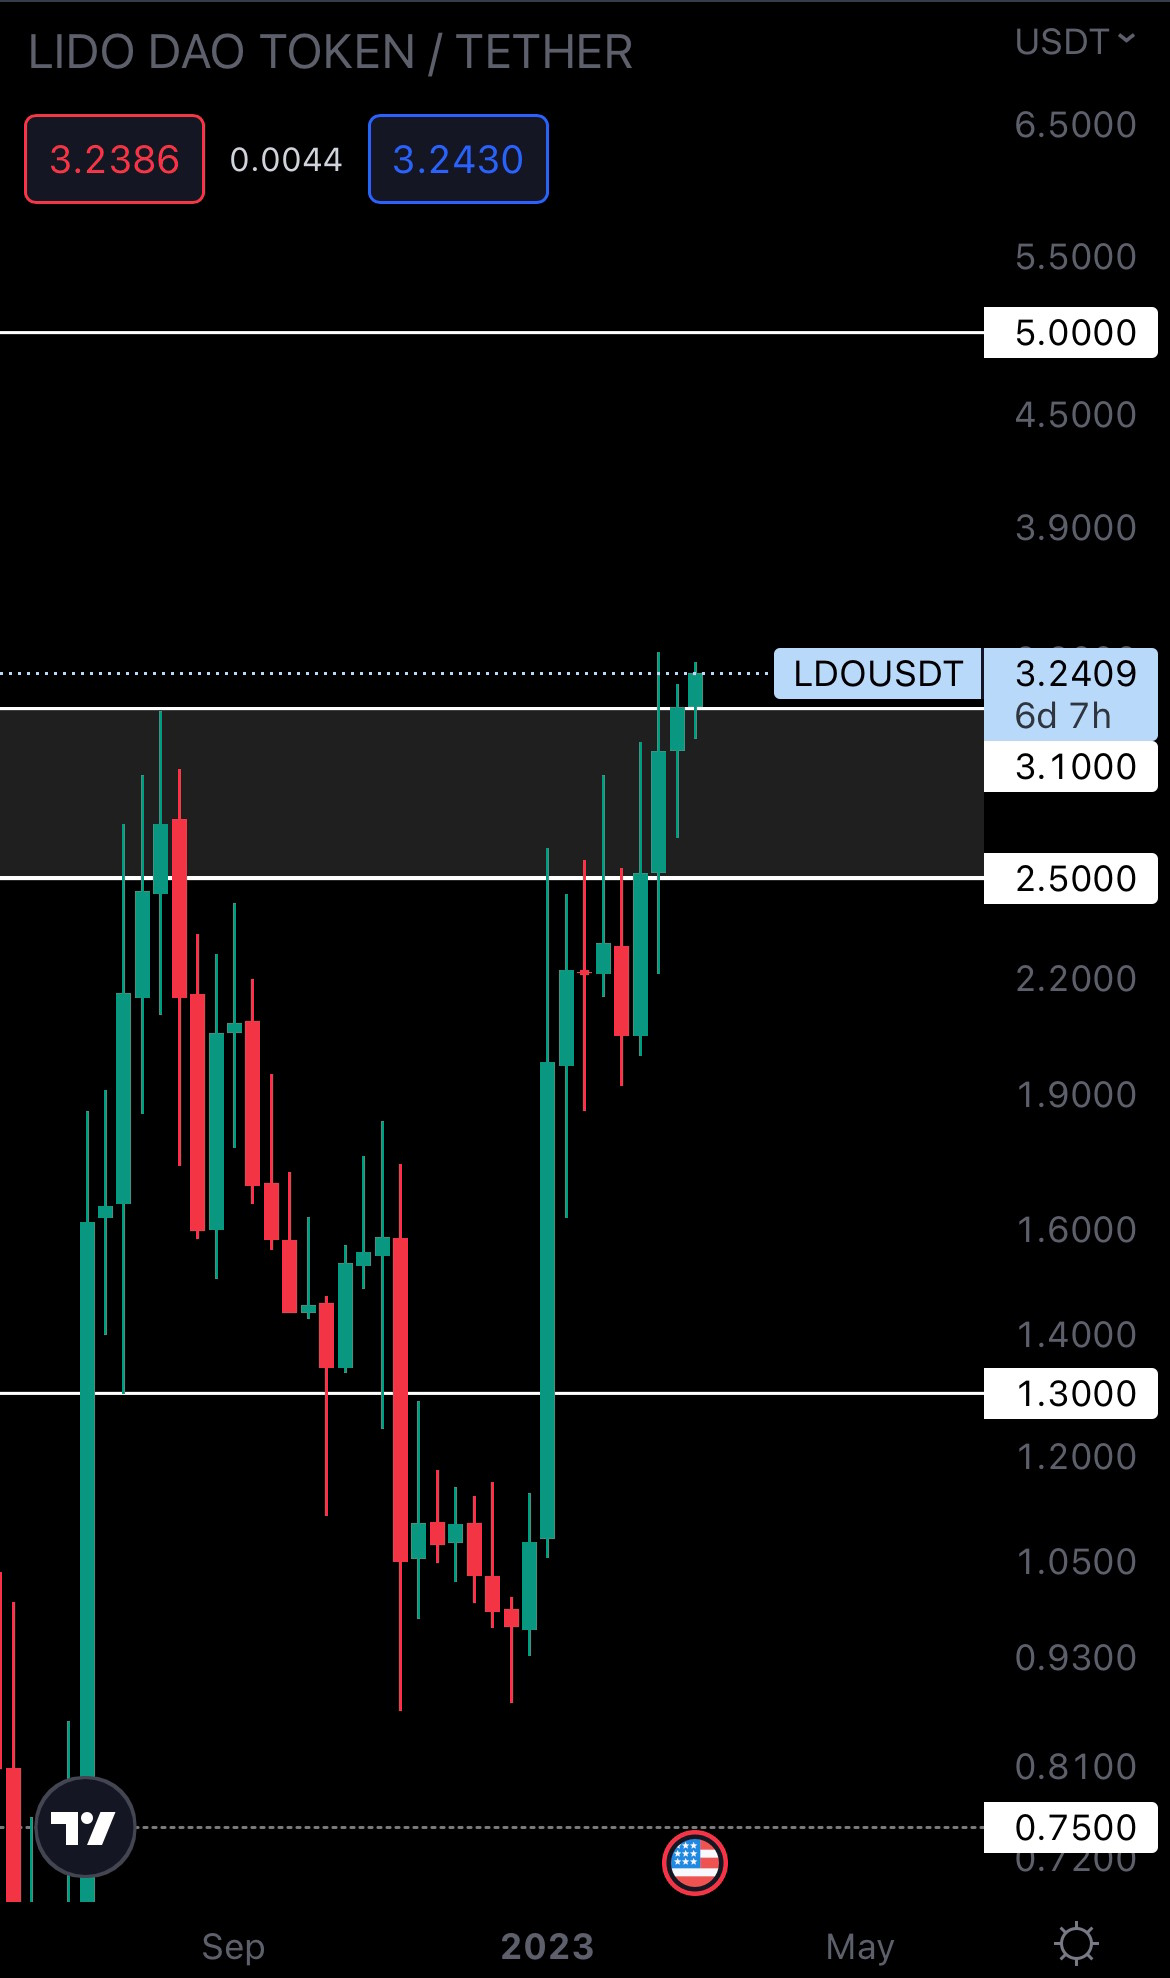 Like OP, LDO also closed into resistance ($3.10). We’ll need a weekly closure above this level to confirm $5 as our next target. The weekly market structure is bullish here as well, so upside can certainly follow, and we believe this will be one of the outperformers if Bitcoin breaks resistance.
HEGIC | Hegic (Weekly)
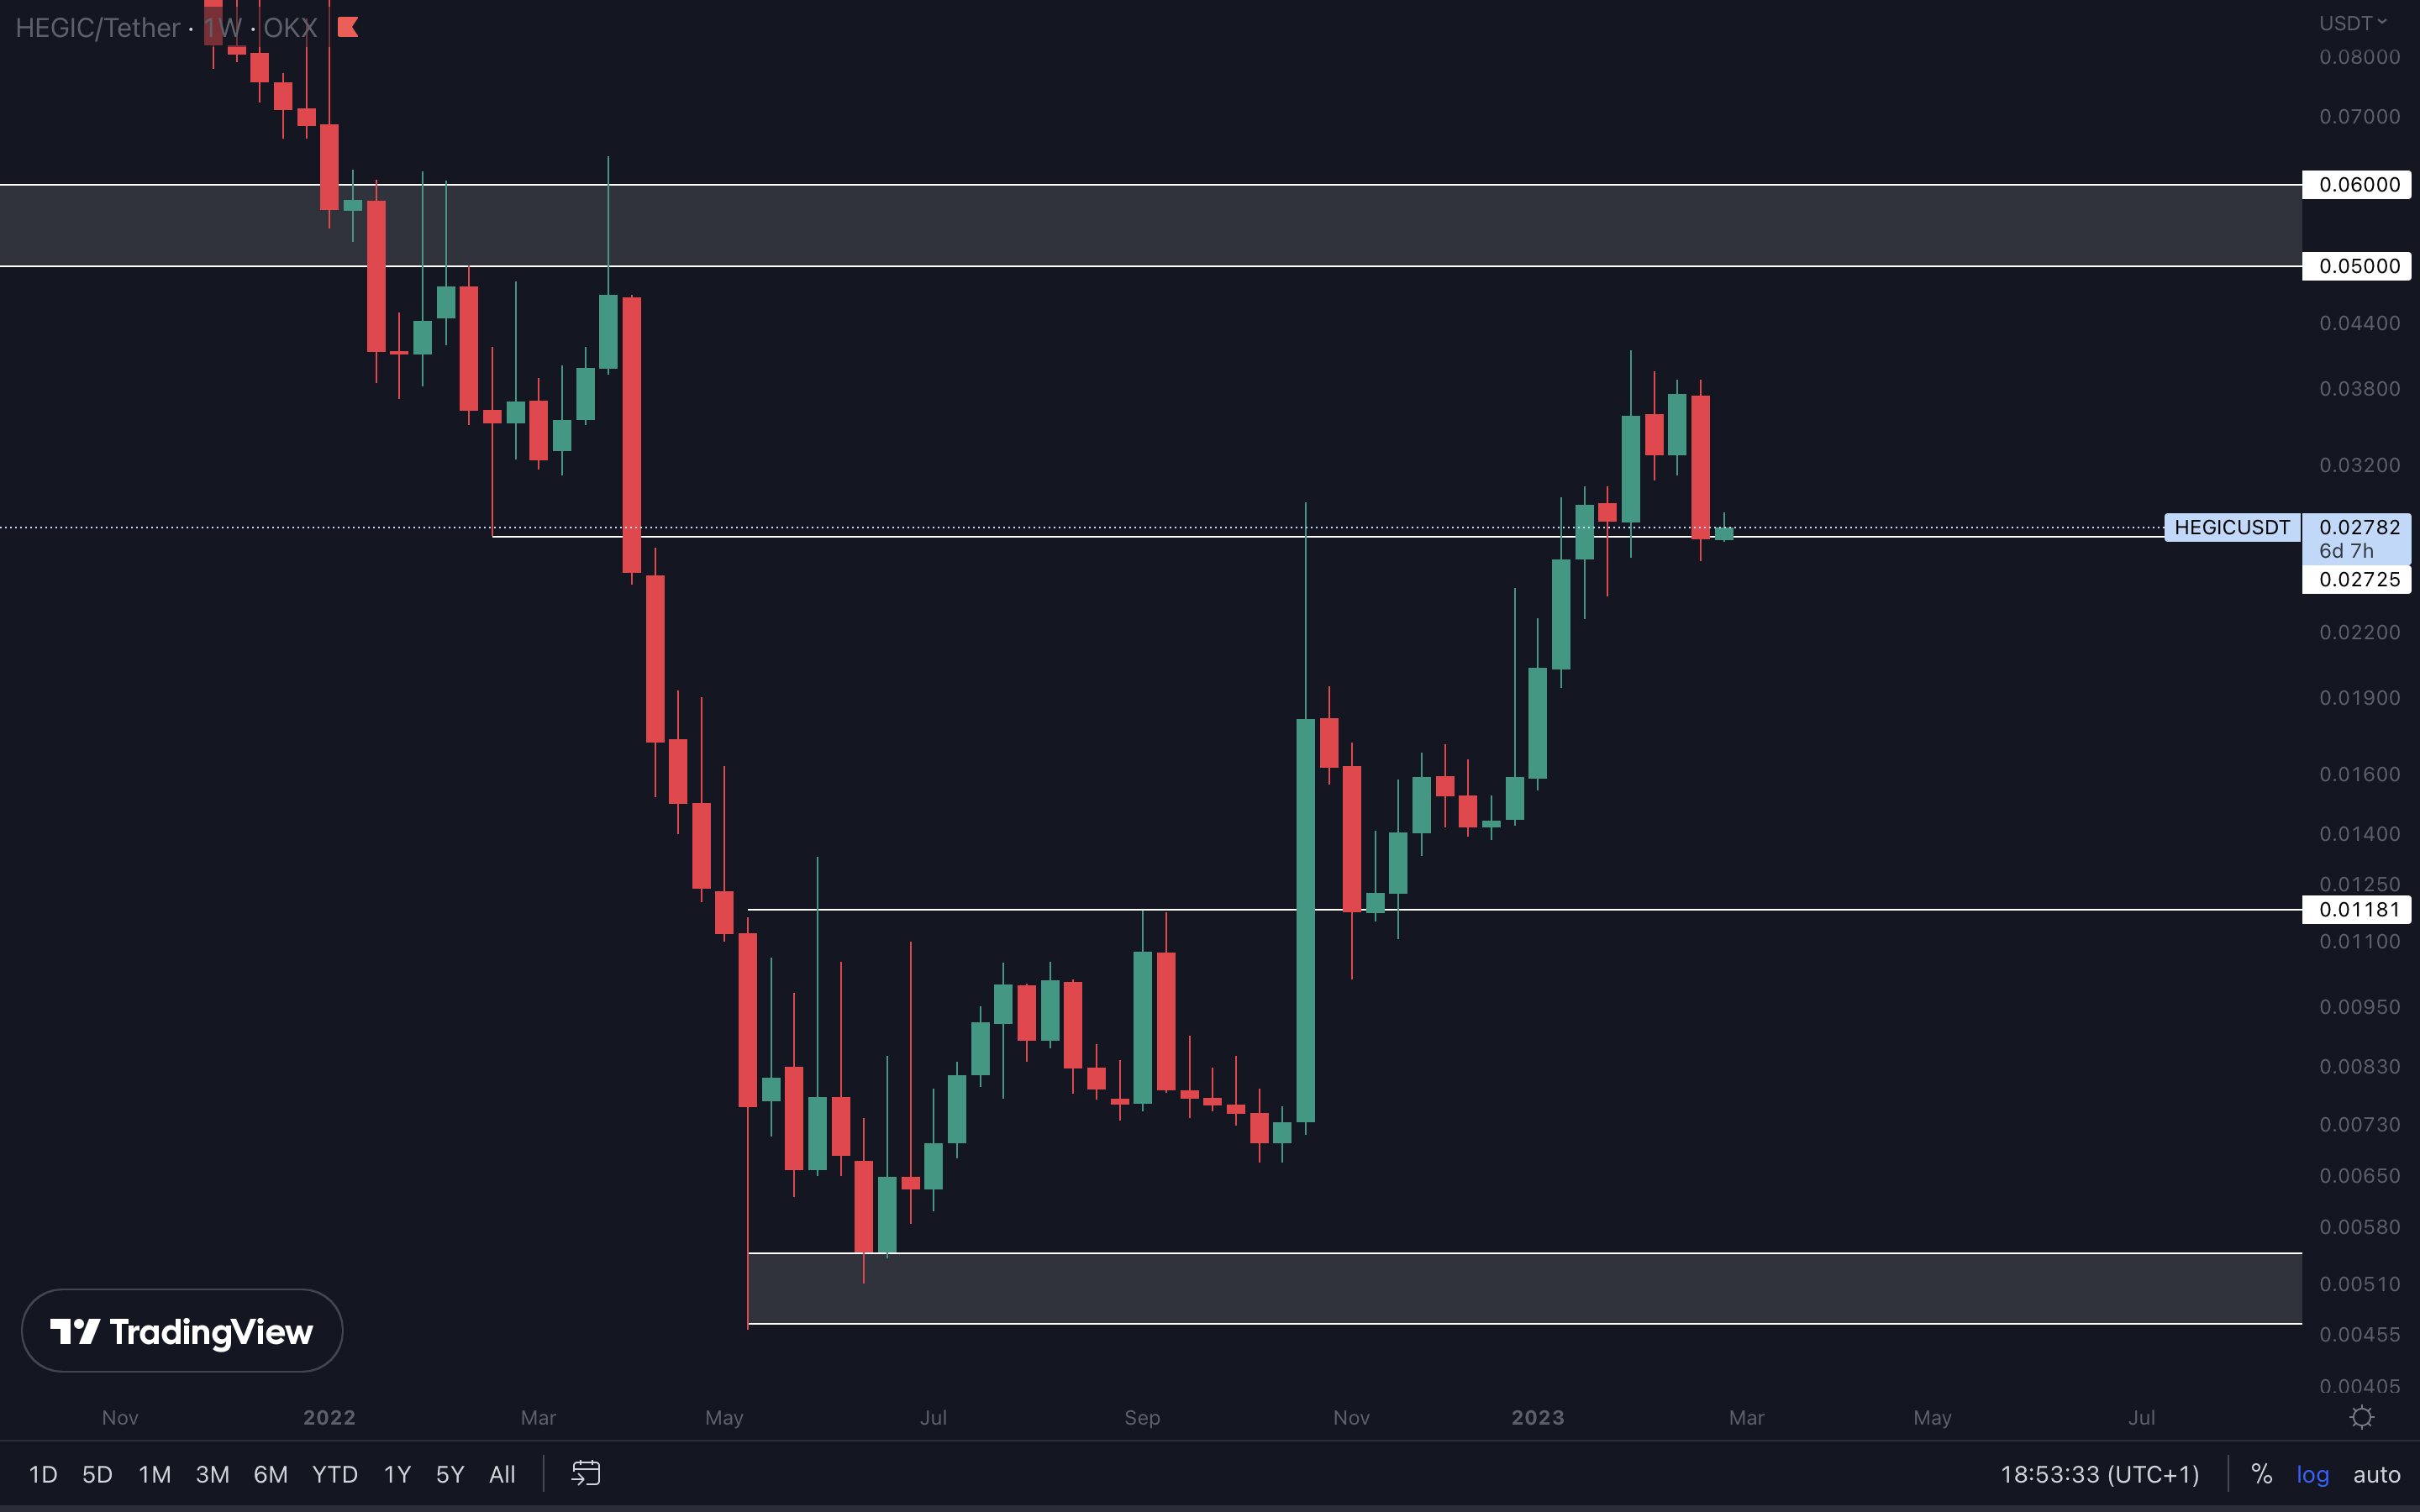
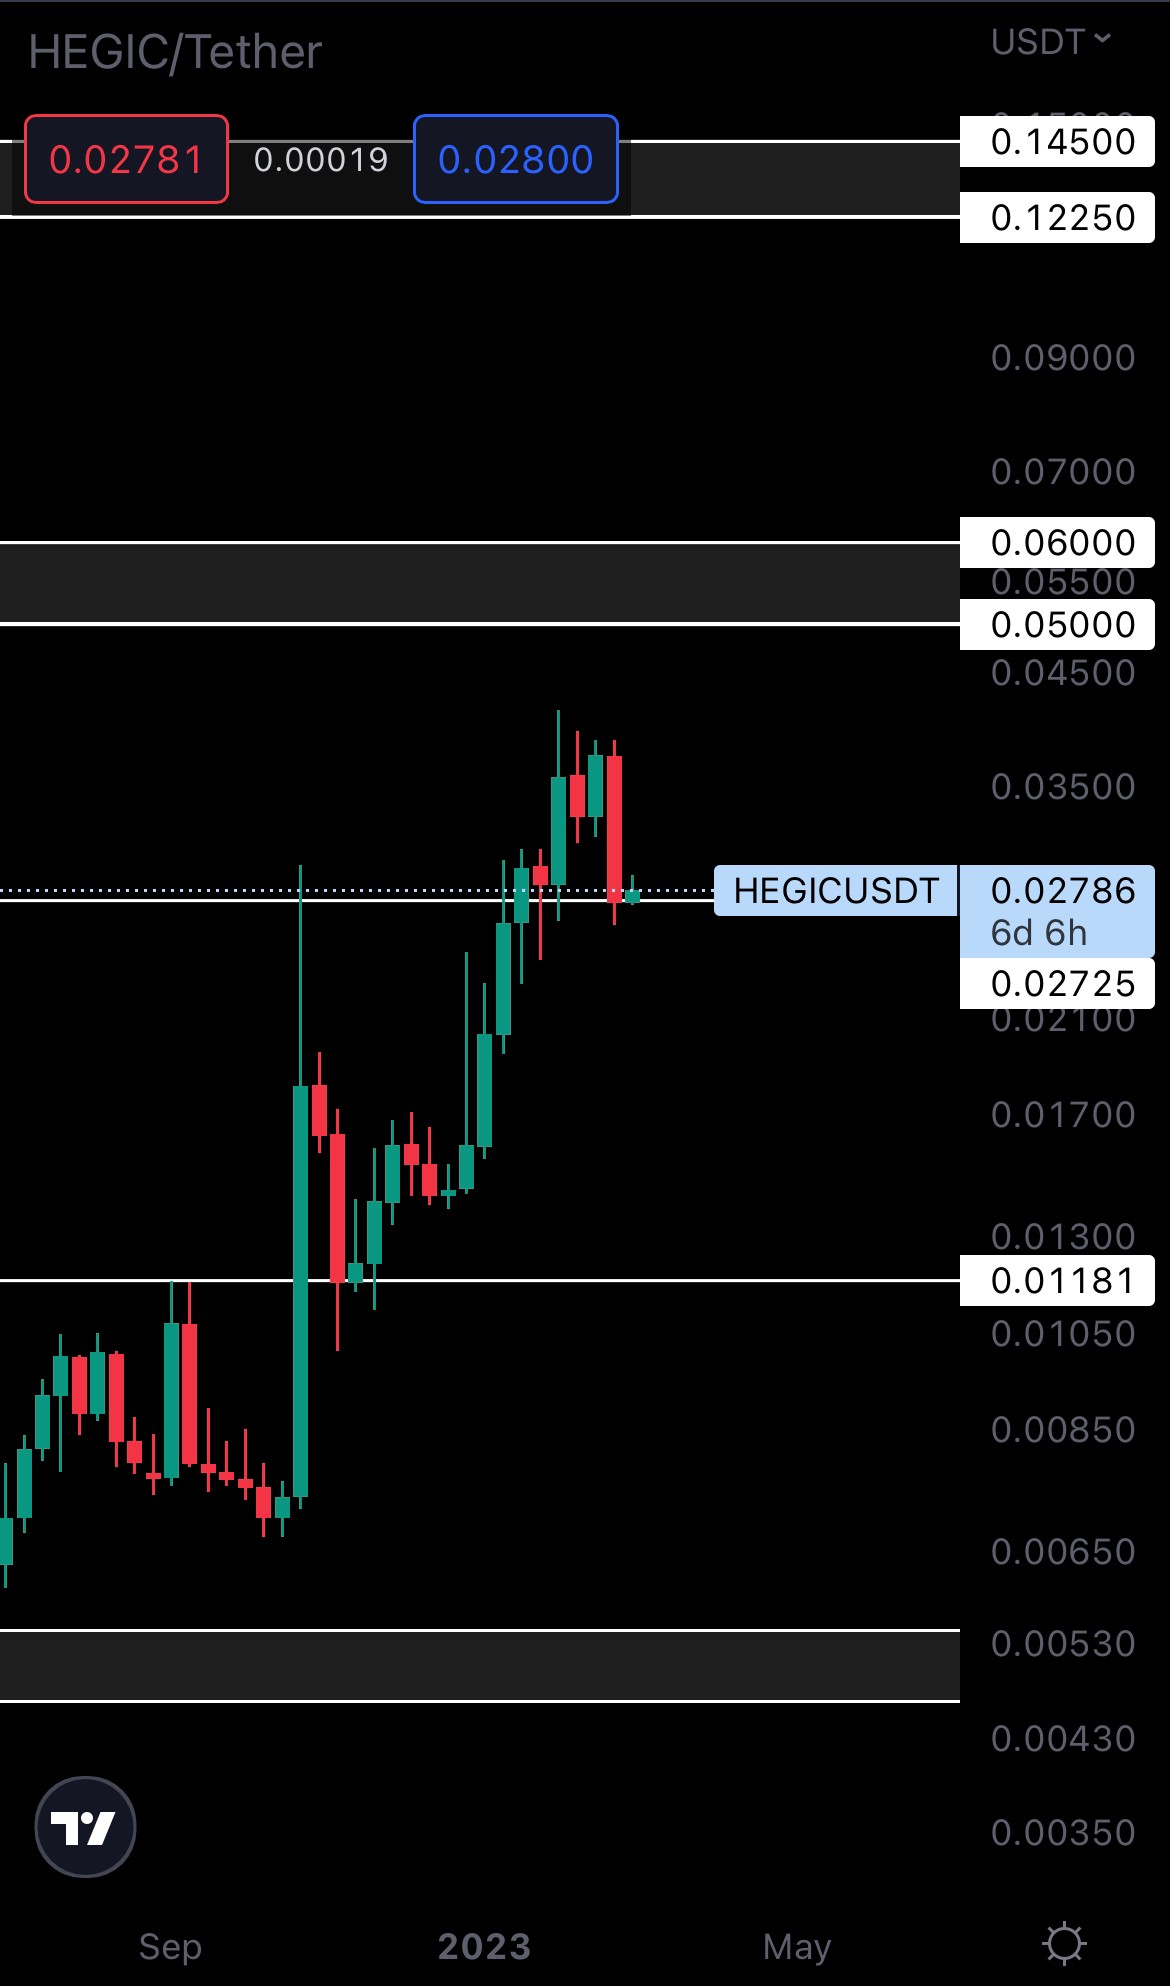
HEGIC retested $0.02725 as support. If you were looking for opportunities, this one might be one of them. The weekly market structure is bullish, and HEGIC is at support. As far as risk/reward ratios go, this is the best you can get here. HEGIC holding $0.02725 as support opens the door for a test of $0.05 - $0.06. This scenario is invalidated if the asset closes a weekly candle under $0.02725.
ASTR | Astar (Weekly)

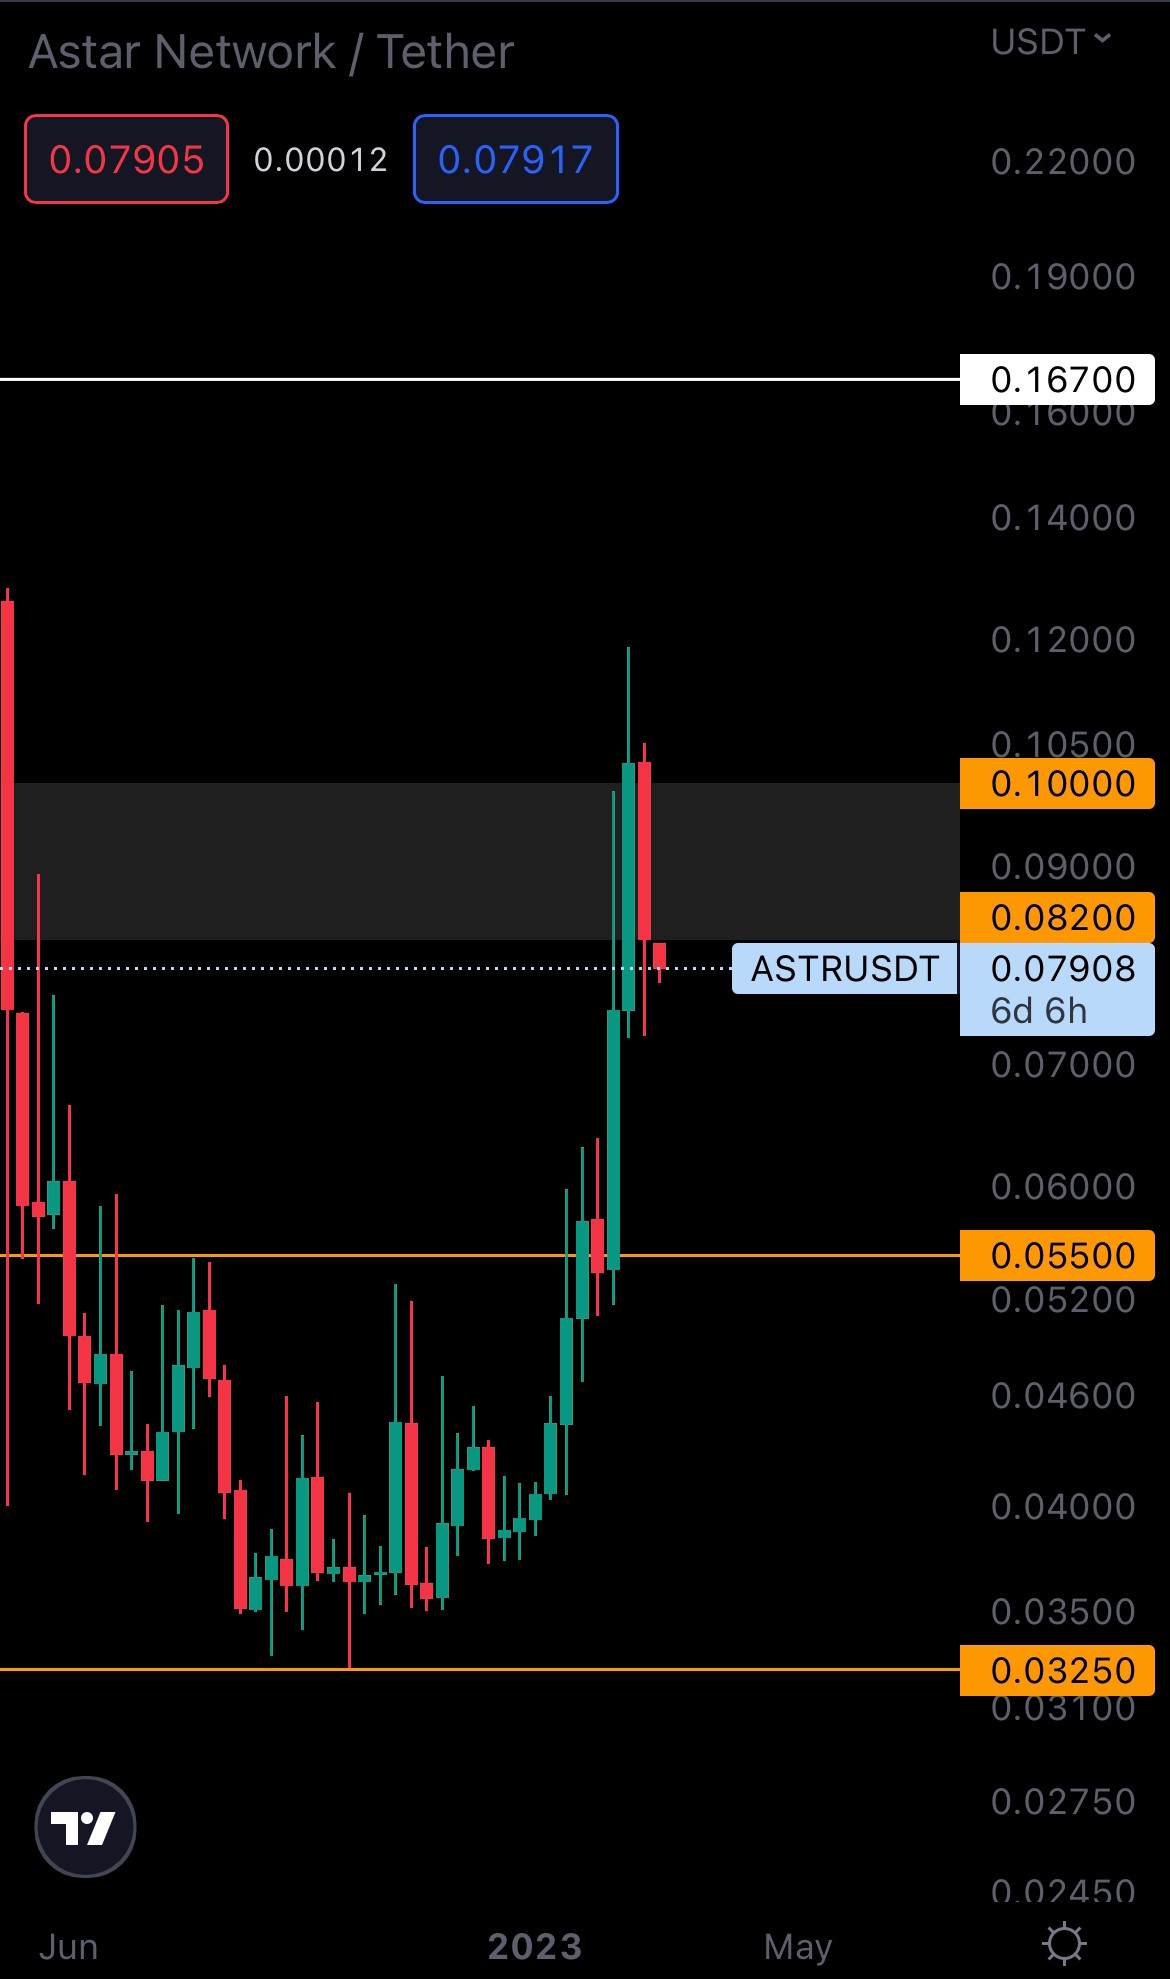
Although ASTR’s weekly market structure is bullish, the previous weeks were explosive, which makes it hard to predict where a weekly higher low can form. It could form now, or it could form anywhere between $0.0550 (top of the accumulation area) or $0.0820 (bottom of the $0.10 - $0.0820 area) The asset closed last week’s candle right into the bottom of the $0.10 - $0.082 area, but we’re now seeing sellers stepping in and pushing its price down. For ASTR to continue rising from here, we’ll need to see it closing this week above $0.082. This will keep that level as support and invalidate any potential downside.
THOR | THORSwap (Weekly)
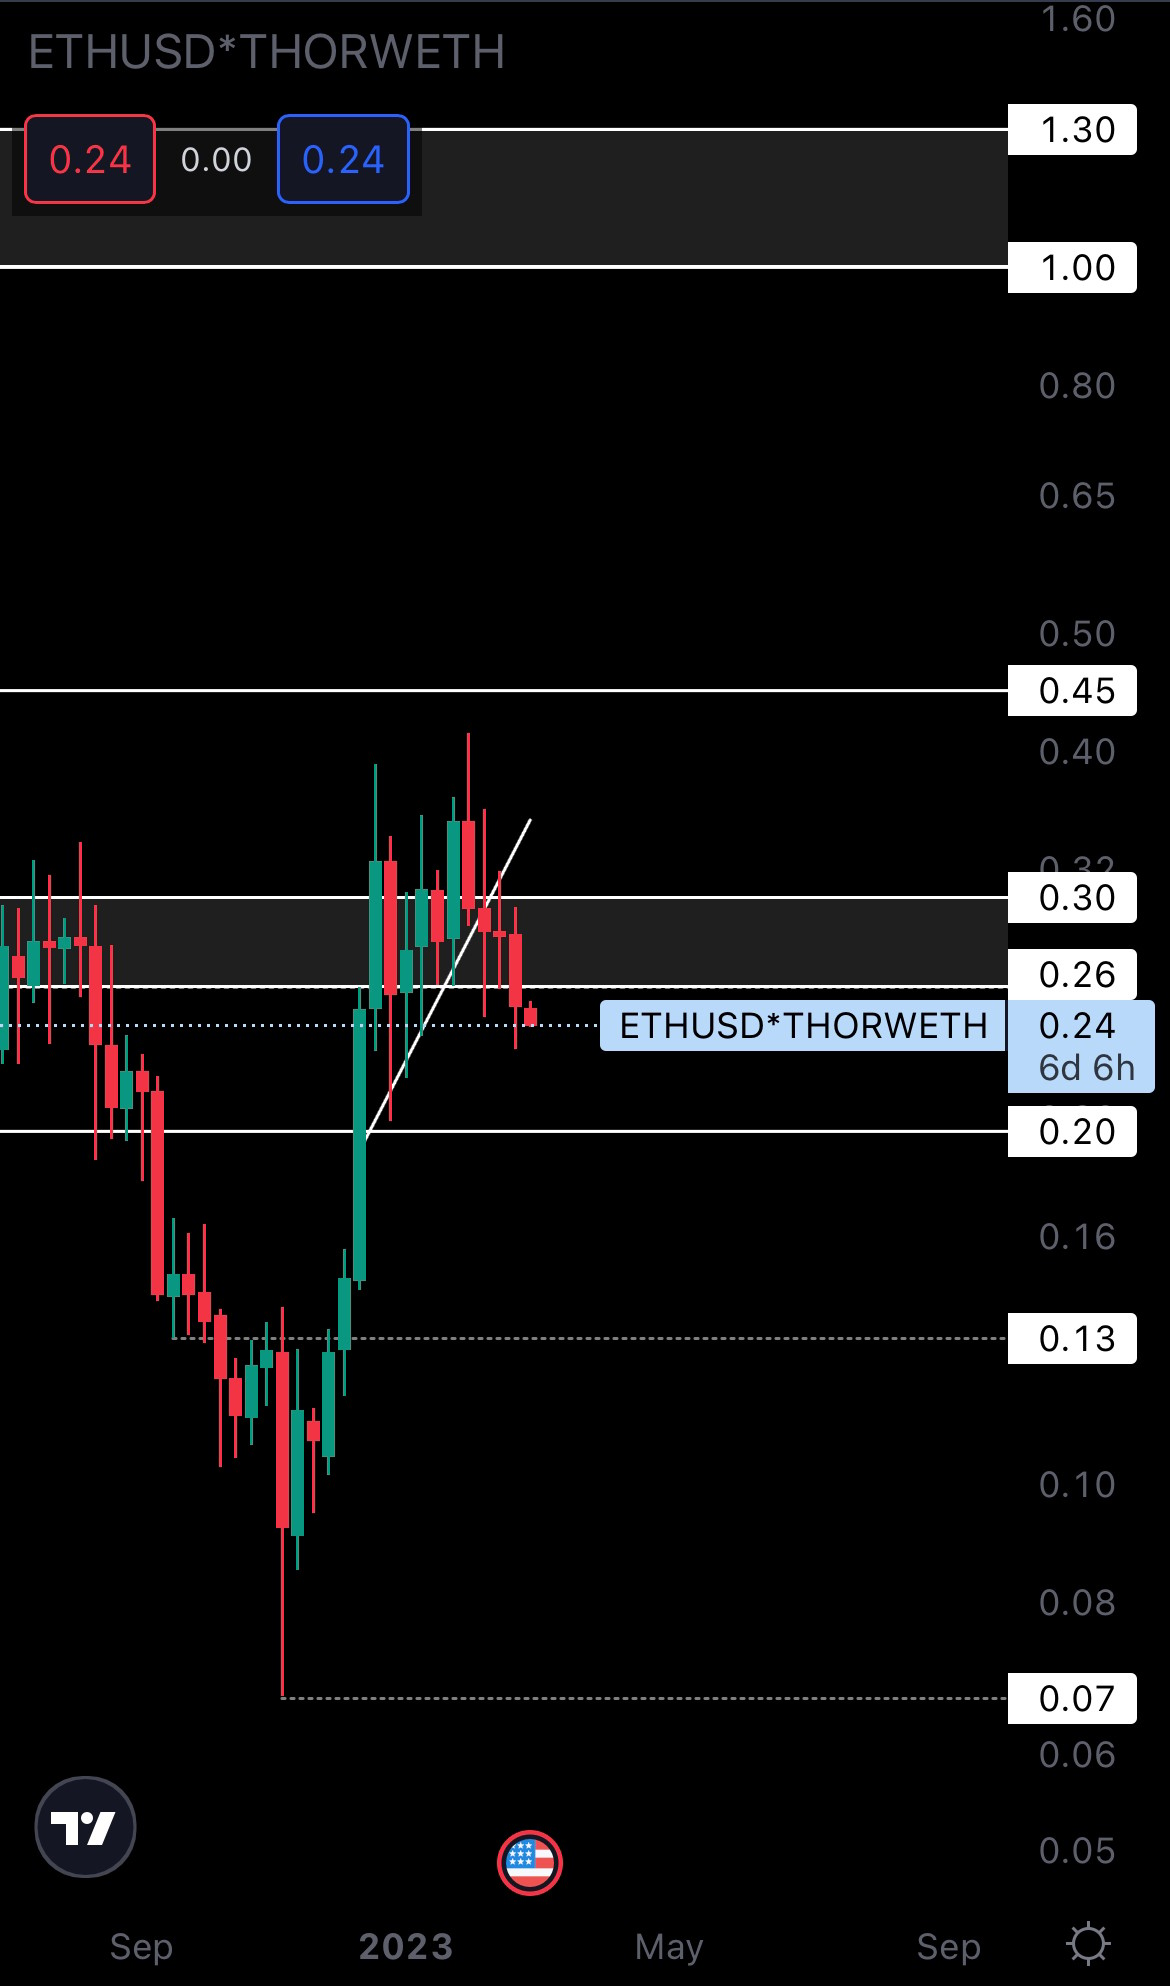
Because THOR closed last week’s candle under $0.26, it is now heading to $0.20 unless $0.26 is reclaimed (weekly closure above it is needed).
MINA | Mina Protocol (Weekly)
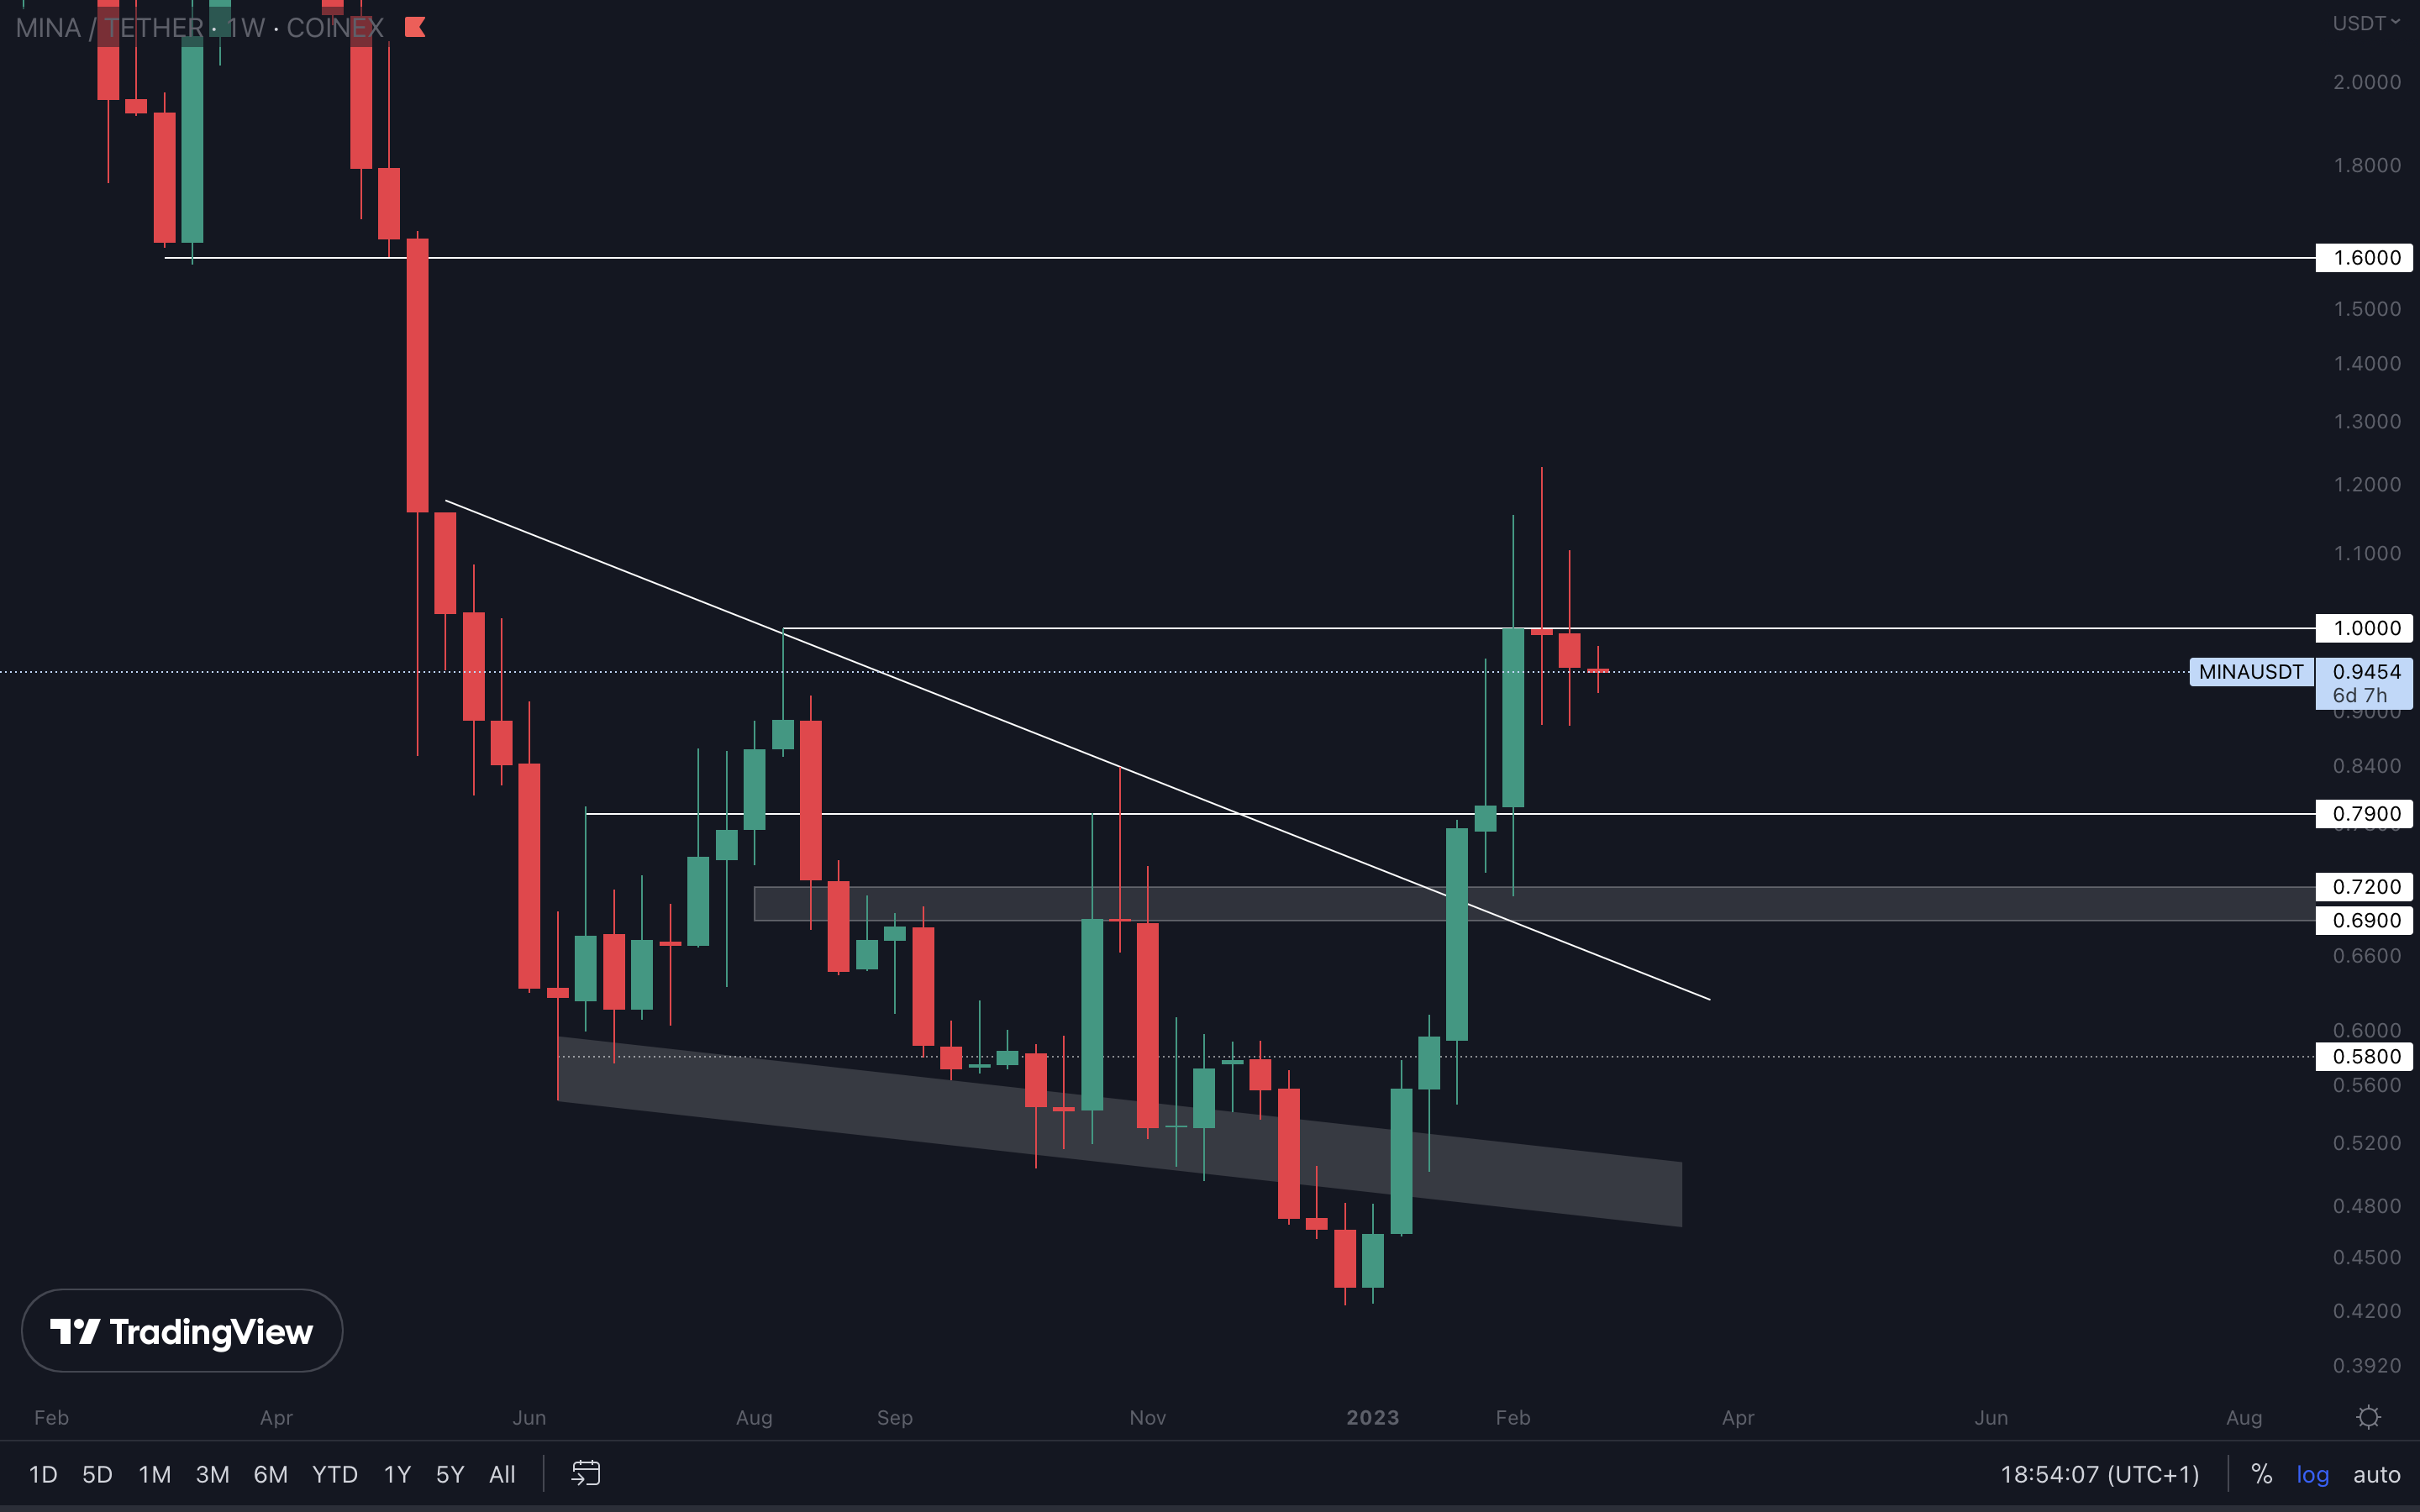
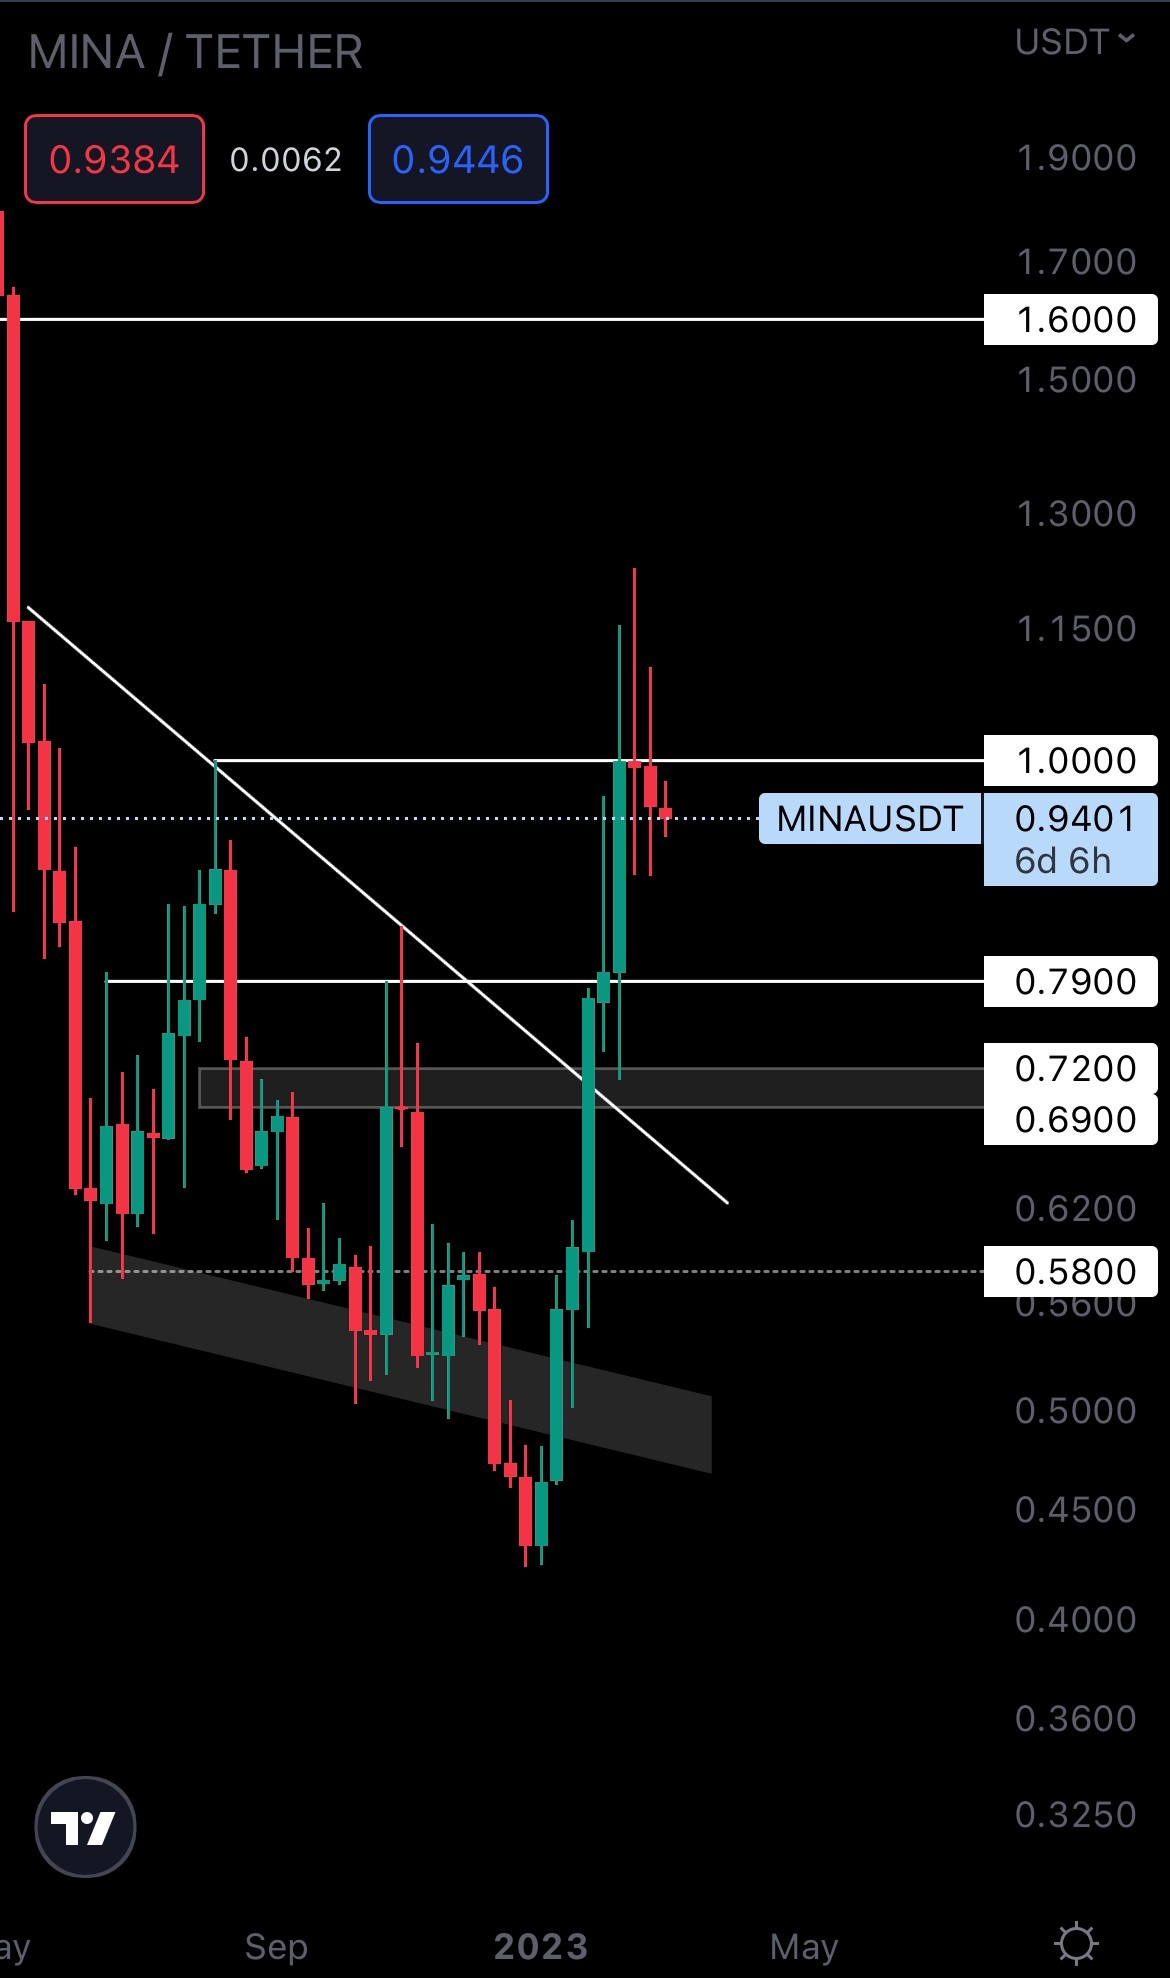
Another failure in closing a weekly candle above $1. We can see that buyers are trying (check the wicks), but the selling pressure is too much at this time. We will likely see MINA going down toward $0.79. It’s unsure whether that level will be reached or not, but the only event that will confirm further upside is a reclaim of $1, so it might be best to stay on the sidelines and wait for that level to be broken or for other local supports to form between $1 and $0.79.
STG | Stargate Finance (Weekly)
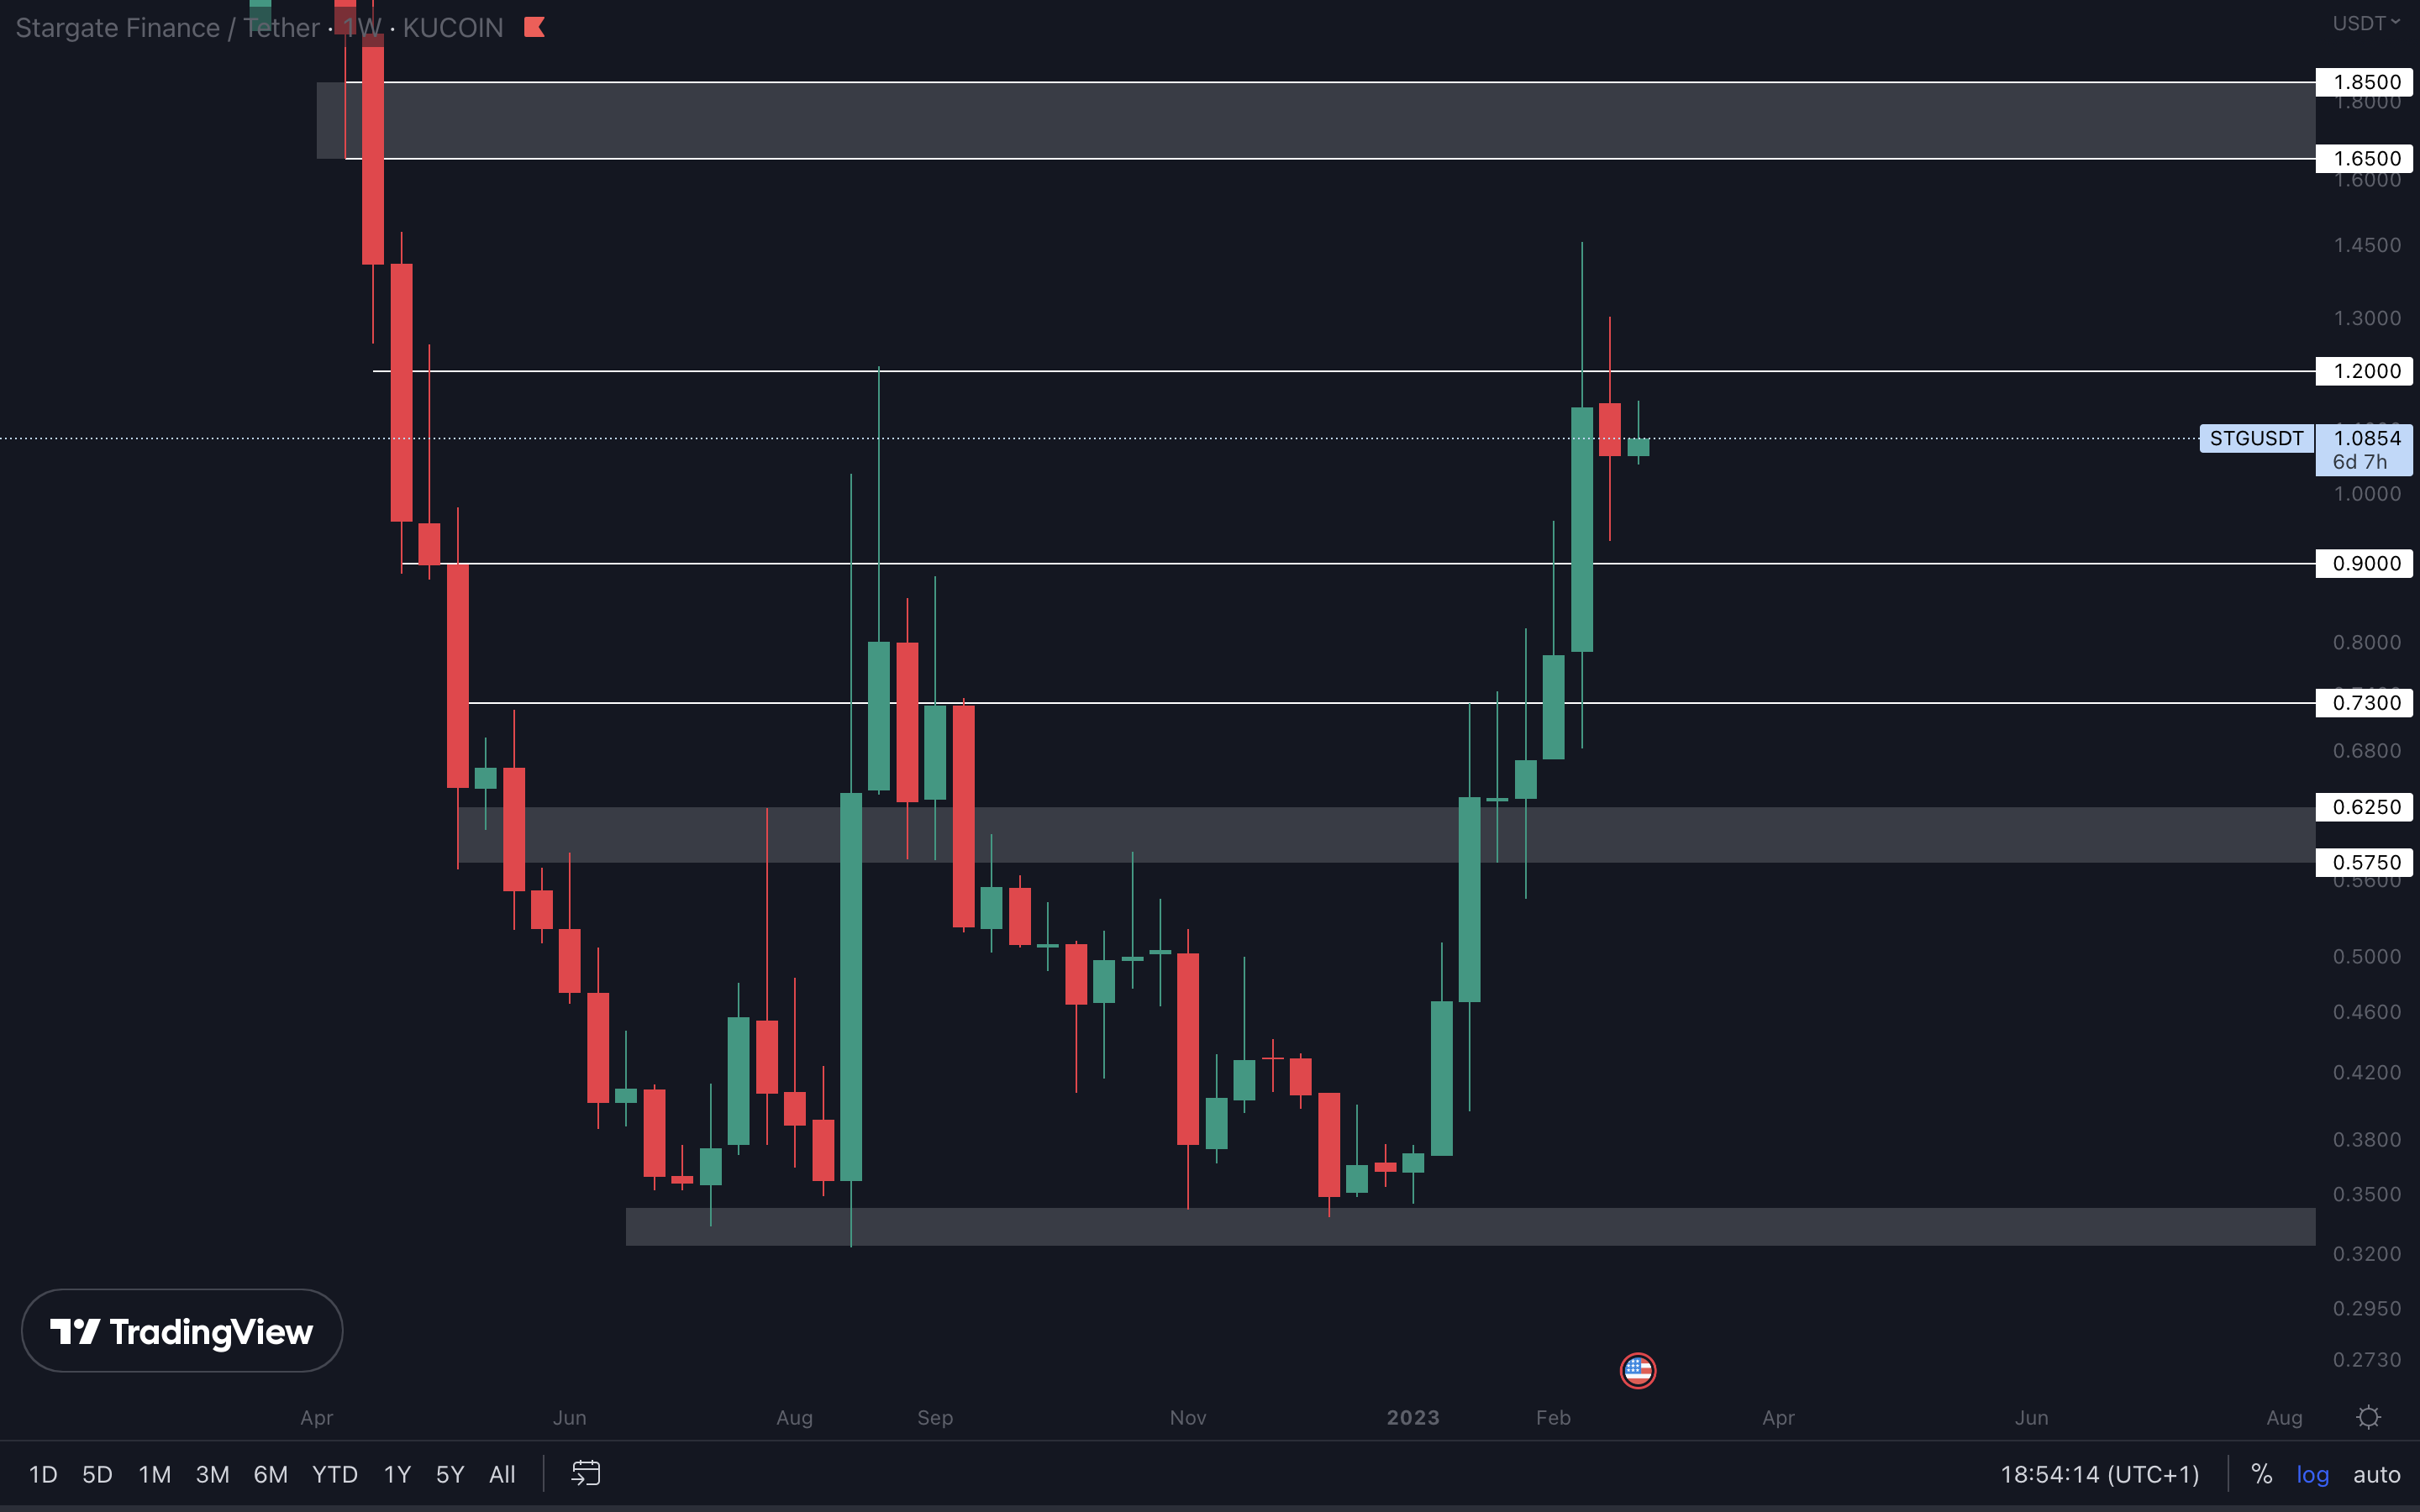
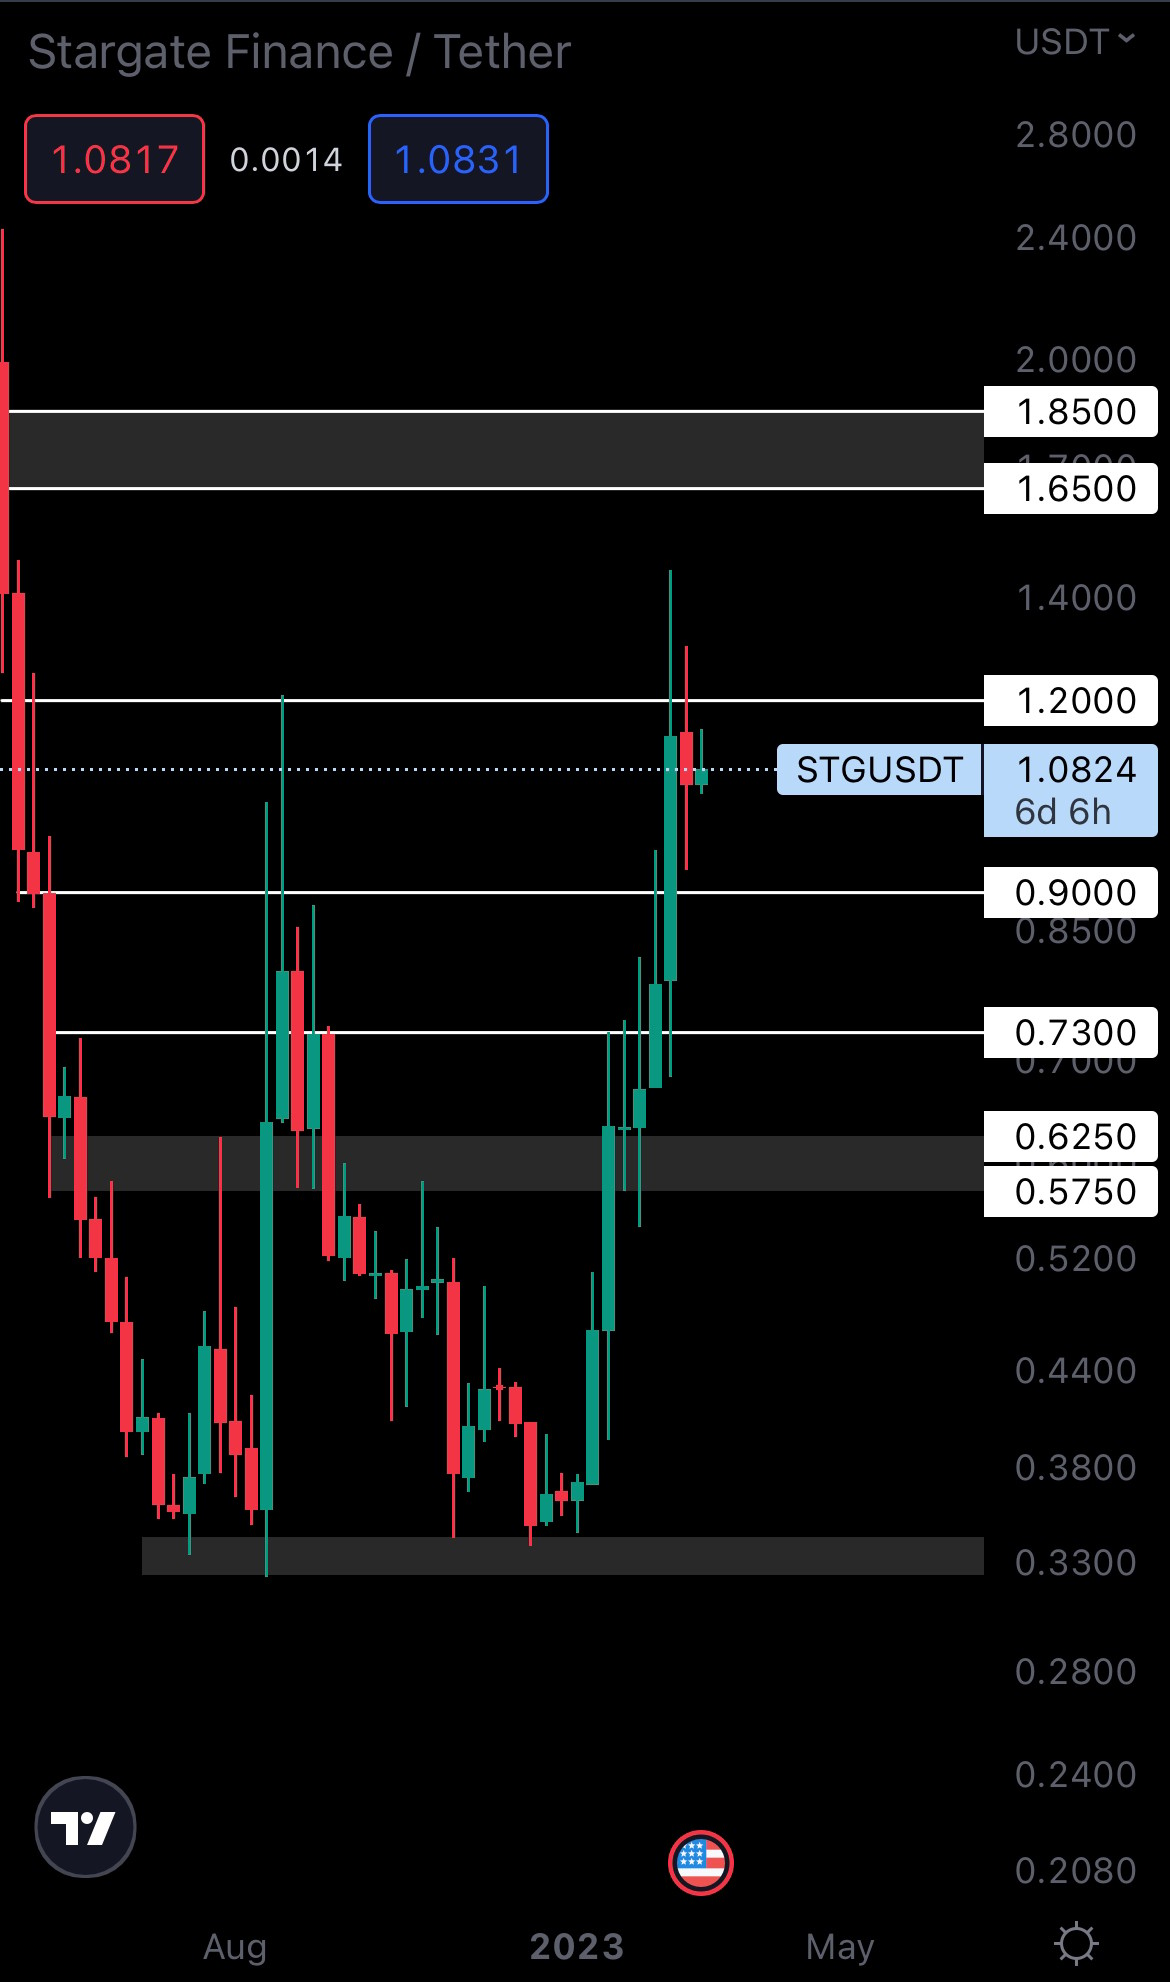
STG was unable to reclaim $1.20 on the weekly timeframe, so we can’t confirm a move to $1.65 - $1.85 yet. In the meantime, STG will continue ranging between $0.90 and $1.20 until either of these levels are broken. No opportunities at this time, but there is definitely potential here in the coming weeks.
Cryptonary’s take
Although the TMCap index (Total Market Cap) looks healthy and ready for further upside, Bitcoin still has the largest dominance in the market. As long as $25,150 is resistance, there are limitations on how high altcoins can go in the short-term. We’ll need to break that level for the rally to perform at its best.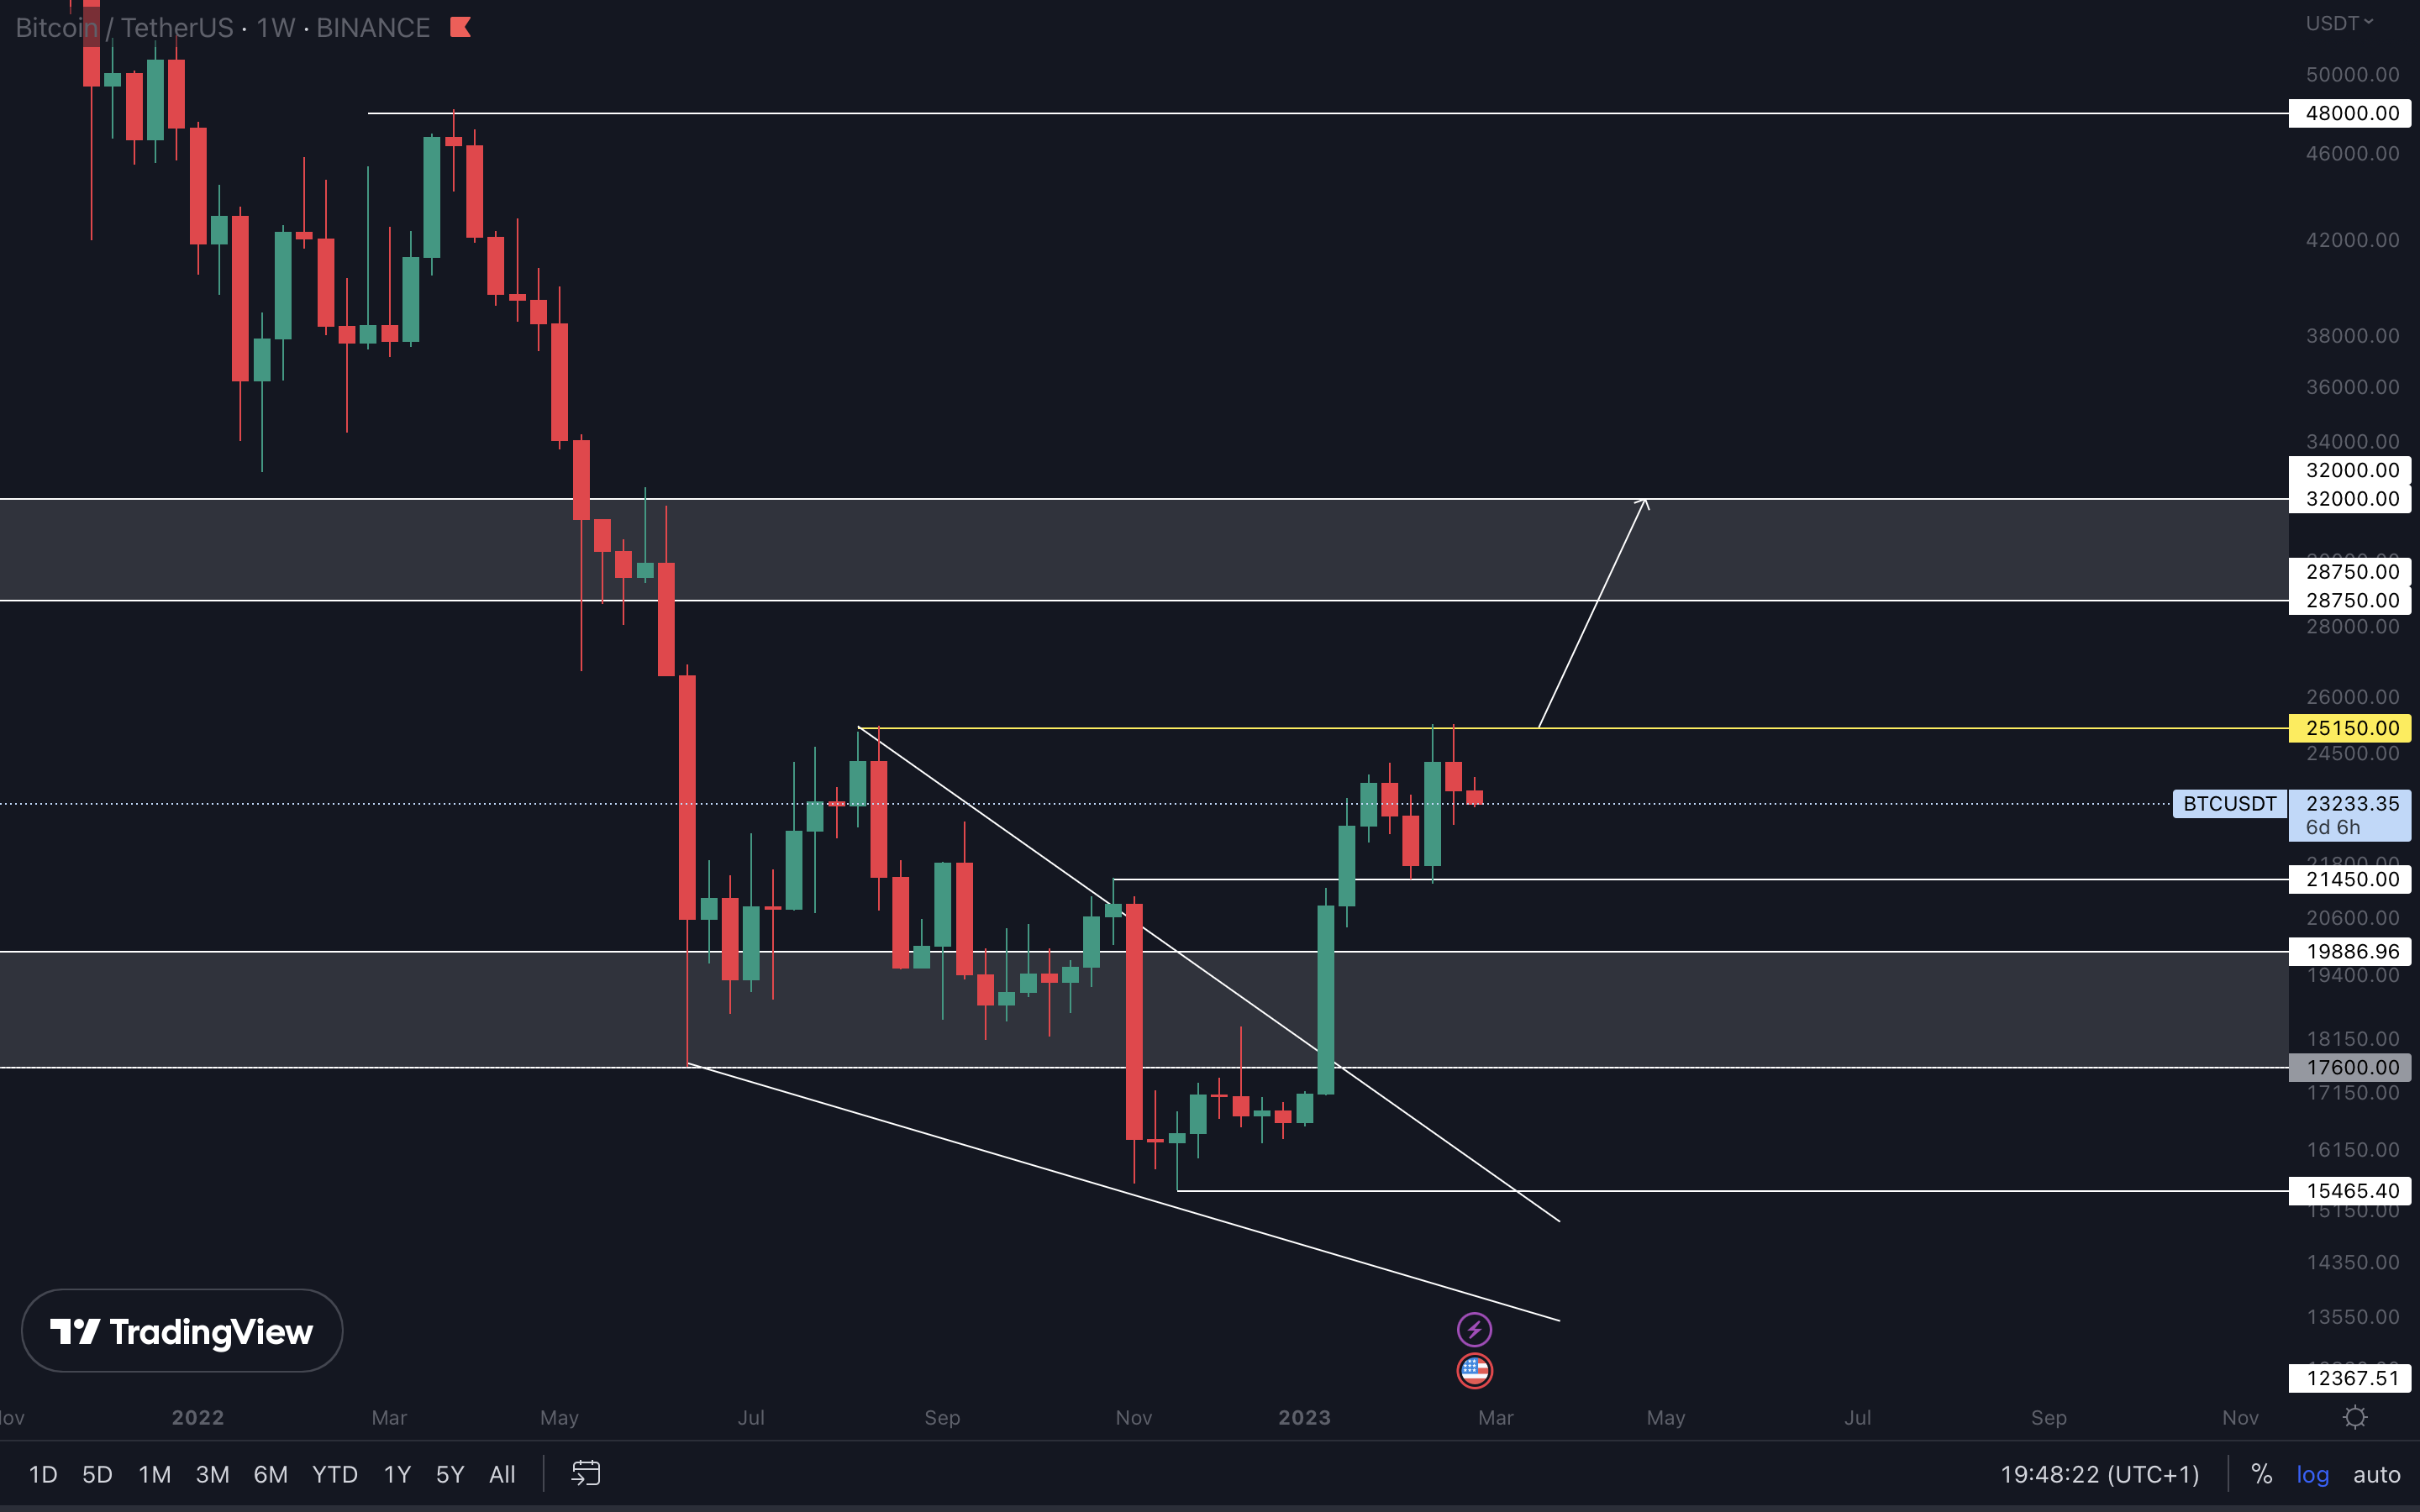
 Here are a few action points for you as we head into new weeks:
- Check our previous reports and analysis, and make a plan of your own. Have potential opportunities in sight in case Bitcoin breaks resistance.
- The Total Market Cap closing a weekly candle under $1.03T will invalidate further upside. If this happens, reducing your short-term positions might be a good idea.
- Bitcoin closing a weekly candle above $25,150 would be ideal for risking-on.
Recommended from Cryptonary


