Save 23% ($351) & Get a Free 1-1 Call with our Team ⏰ : 0d 2h 59m 44s

Why you should read this report
- BTC's recent price action and funding rates paint an interesting picture. Find out what this could mean for short-term price movements.
- ETH's technical analysis reveals a potential formation that savvy traders should keep an eye on.
- SOL's market indicators are showing mixed signals - we break down what this could imply for upcoming volatility.
- WIF and POPCAT face challenges, but are they creating hidden opportunities? Our analysis dives into the nuances.
- TREMP's trajectory takes an unexpected turn—discover the factors at play and what this could mean for your strategy.
Disclaimer: This is not financial or investment advice. You are responsible for any capital-related decisions you make, and only you are accountable for the results.
BTC
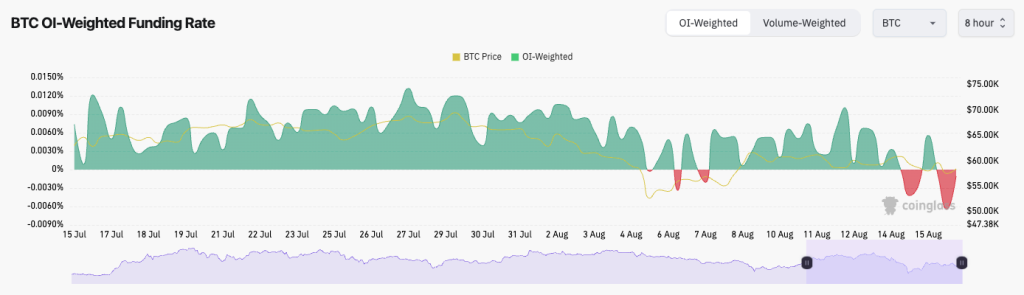
Bitcoin's Funding Rate has been negative over the last 24 hours, meaning there is a bias amongst traders to be short (hence, Shorts are paying Longs the premium).Open Interest had meaningfully reset following the flush out 10 days ago when Bitcoin's price collapsed. OI has increased slightly since, but not to any meaningful degree.
We have had a resetting in leverage, which is usually a positive. We've also seen shorts start to pile up again. This is usually a positive sign following a leverage flush out, which tends now to create more meaningful lows for price.
BTC Funding Rate:
Technical analysis
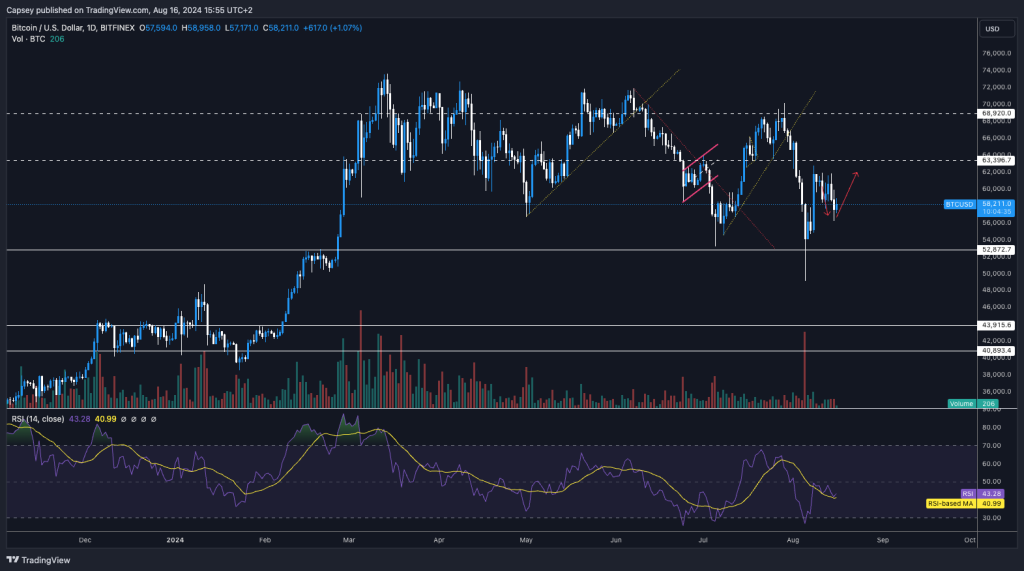
- In the last Market Direction (posted on Monday), we mentioned that we expect BTC's price to pull back slightly, which is exactly what we've seen.
- In terms of the general structure here, there aren't many price formations that currently stand out to us.
- Essentially, Bitcoin is just still range-bound between $52,800 and $63,400 in a wider range and $56,200 to $61,800 in a tighter range.
- August is usually a not-so-great month for crypto, which is likely because volumes are low as big traders are on holiday.
- The RSI is clean here at a middle territory of 44.
Cryptonary's take
So far, price has followed our plan from last Monday, slightly retracing the move up and consolidating in the high $50k range.Over the weekend and into early next week, we expect more of the same, i.e., price to be range bound in this tighter range between $56,200 and $61,800. However, we're not ruling out a move into the $54k area, but we expect it to be bought up relatively quickly if it happens.
Next week, we have Jackson Hole, where Fed Chair Powell will speak on policy going forward. He won't deliver any Interest Rate cuts, but he'll likely forward-guide them to September's meeting. We expect Bitcoin to be range-bound until then. We'll then reassess again following the event.
While we still expect the next 2-6 weeks to be tricky, we don't see Bitcoin hitting sub $50k again. We just expect price to be range-bound in the large price range we identified in the technical analysis section above. No panic or stress here; further patience is needed.
ETH
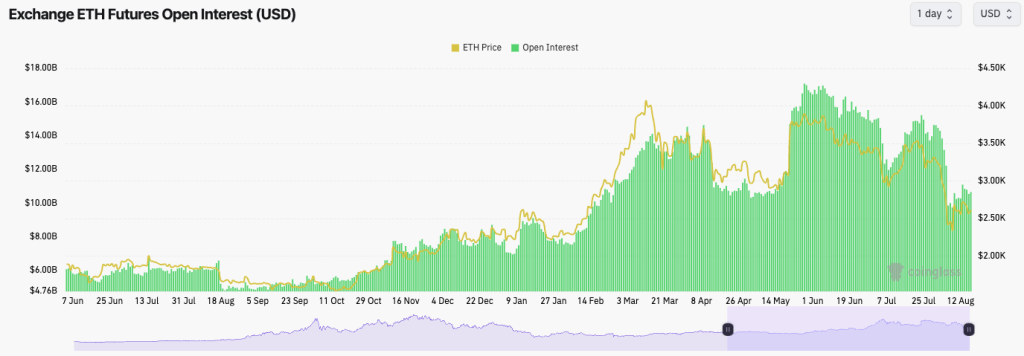
- On most exchanges, ETH's funding rate is more positive than that of BTC, indicating a stronger bias amongst traders to be long rather than short. This is healthy after a resetting of the leverage in the market that we saw last week.
- Following ETH's Open Interest flush out, we haven't seen leverage pile back on, which is a positive sign.
ETH's Open Interest:
Technical analysis
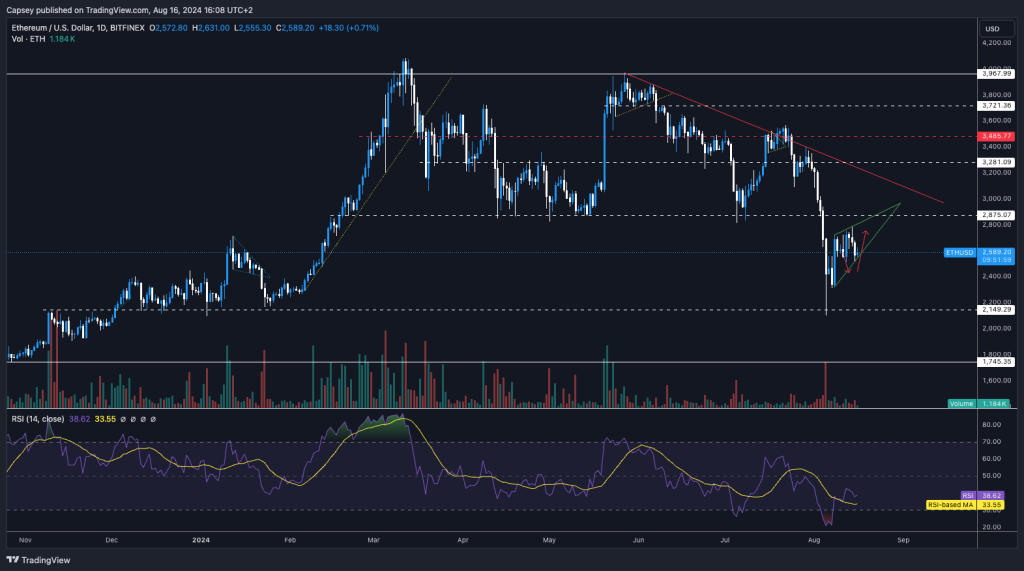
- ETH bounced well from the major support of $2,150 but now remains in this lower price range between $2,300 and $2,700, with price still not convincingly being able to progress up to the major horizontal level of $2,875.
- ETH didn't quite pull back to the red arrow level we had previously identified
- In terms of price formations, ETH currently looks like it's in an ascending wedge on the local timeframe. These have a bias to break down.
- If the ascending wedge were to break down, the target area would be $2,330 to $2,400. However, this would be an area that would strongly consider bidding ETH.
Cryptonary's take
We're expecting ETH to remain range-bound between $2,330 and $2,700 over the weekend and the first few days of next week.While ETH may see some downsides in the coming weeks, we don't believe that will result in a retest of the $2,150 to $2,400 area; we would be strong buyers of ETH if given the opportunity at those price points. The target would be to sell at considerably higher prices at some point in 2025.
SOL
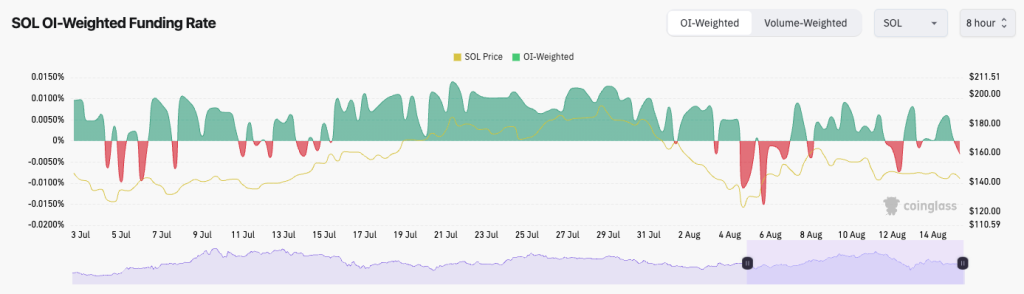
SOL's Funding Rate is negative, indicating a bias amongst traders to be short rather than long.Alongside this, Open Interest has actually decreased in the last few days.
There is real indecision among traders here; we'll continue to monitor how this develops.
Ultimately, the OI flush out of last week is positive in the mid-term, but we might see some volatility in the short term as traders flip-flop between positions.
SOL's Funding Rate:
Technical analysis
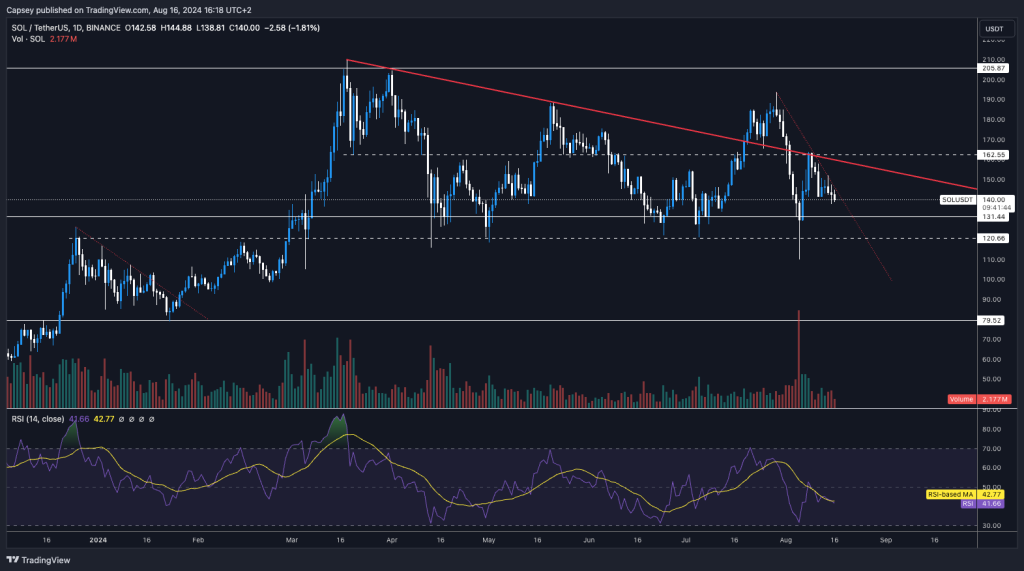
- As we predicted in last Monday's Market Direction, SOL's price has pulled back to around $140.
- SOL is also now in the tighter range of $131 to $162, having perfectly rejected from the overhead resistance at $162.
- The bottom of the range is $131. However, price may dip below this level and likely find strong liquidity/bids down to $120.
- Perhaps the clearest price formation is the downtrend line. A breakout would likely send the price back to $162. However, we're expecting slightly more downside in the immediate term, say to $131.
- We don't expect SOL to break out above $162 in the coming weeks unless we get something super dovish from Powell at Jackson Hole next week.
Cryptonary's take
We expect SOL to see more downsides in the coming week, perhaps in the $131 area. However, this area may attract buyers, which could see price breakout and rebound slightly, potentially $150.To be honest, it's hard to know what price will do in the short term, and we're expecting essentially just more chop in the coming weeks. But we remain confident that we expect SOL to be multiples higher than the current price by year-end.
WIF
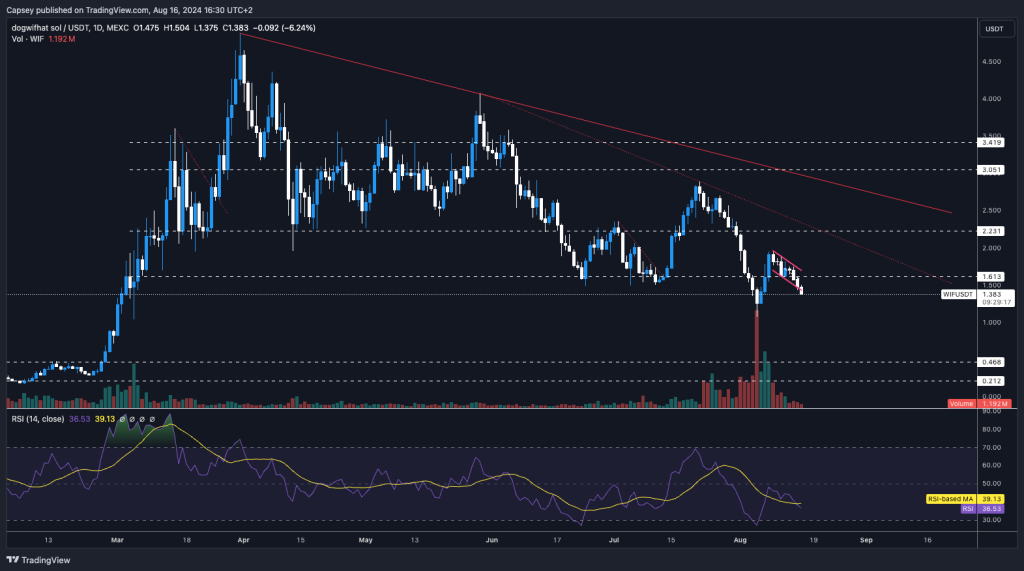
- WIF has unfortunately not played out as we had hoped in last Monday's Market Direction.
- WIF formed a bull flag above support, which in itself is a bullish pattern/price formation.
- Unfortunately, price broke below the horizontal of $1.50 and has now fallen to $1.40 on weaker volumes.
- This potentially opens the door for a move back down to retest the $1.00 to $1.20 area, although we're not confident in this call. We expect that WIF will be heavily bought back up if price revisits this area.
- The RSI is at 36, so it's close to oversold territory but not quite there yet.
Cryptonary's take
Whilst it's possible that WIF continues to decline slowly in the near term, it's looking more and more under-priced. It's expected that on weaker volumes, that price will decline, but this has been a slightly larger decline than we might have expected 6-8 weeks ago, for instance.If WIF hits oversold territory, we will look to begin bidding more heavily again there, but in all honesty, even current prices look attractive if you have a longer-term view of things.
POPCAT
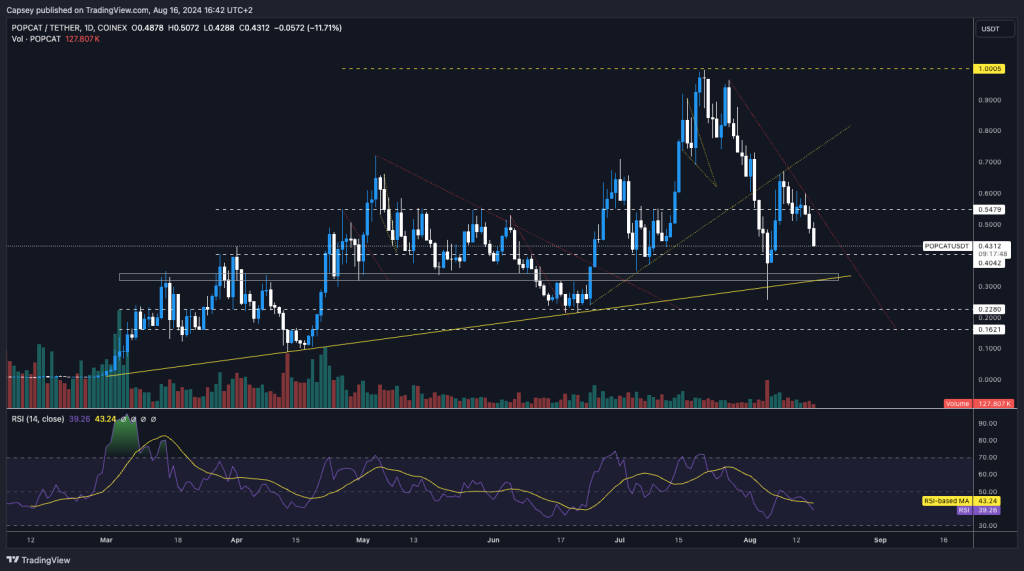
- Once again, price rejected from the underside of the local uptrend line, price also failed at the horizontal support of $0.55.
- Price has now headed lower, with the potential target being the next horizontal level of $0.40.
- In the last Market Direction, we also mentioned that price is forming a Head & Shoulders pattern, which is now playing out. The target would genuinely be about $0.10, but we don't expect this to come to fruition. Hence, we didn't want to put this (with a silly price call) of $0.10 out there on Monday.
- There is a large zone of support between $0.28 and $0.33, so if the $0.40 level is lost, we expect $0.28 to $0.33 to hold.
- The RSI is at 39, so it's possible price will pull back some more in the immediate term.
Cryptonary's take
Memes are being punished in August with these lighter volumes. We should be expecting these kinds of moves on WIF and POPCAT as we have been through this volatility many times before.In the short term, it's possible price bounces from $0.40, but if that level is lost, we expect the $0.28 to $0.33 zone to be a major support for price. Ultimately, we think these prices are value zones, and we would be buyers/adding to our bags if price were to pull back as low as $0.30, say. Longer-term, we're still super bullish on SOL, WIF, and POPCAT.
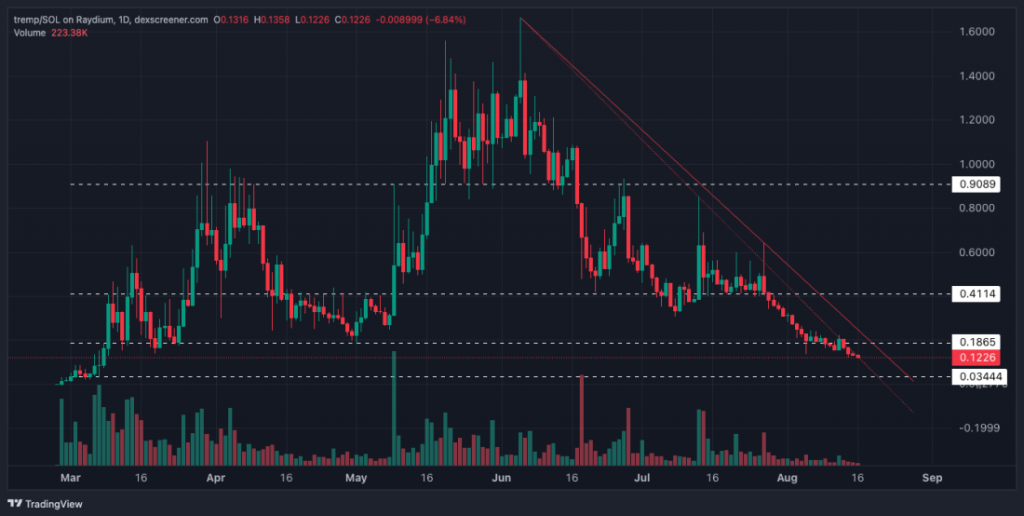
TREMP
- Unfortunately, it seems we may have gotten this one wrong, guys.
- What has not helped TREMP is Trump's odds of winning have decreased since Biden was replaced.
- Alongside the above, a number of Trump coins have come to market that seemed to be somewhat endorsed, but they just weren't. This has seemingly really hurt the space as a whole and is another potential reason why TREMP hasn't performed well.
- Price has been unable to hold key levels, which has led to further breakdowns, and it now seems as if we've lost the traction that had built up a few months back.
- Price is in a general downtrend, so if that downtrend could be broken to the upside, then price may have a rebound rally. This would likely come on positive news for Trump, although we're not expecting any major breakout.
Cryptonary's take
With volumes declining as they have been, it's been difficult for TREMP to sustain any meaningful bid. Unfortunately, over the last week or so, the poor price action, along with the Trump coins and Trump's election odds decreasing, has diminished our conviction in TREMP. Therefore, we would be looking to reduce our position size in TREMP, with any meaningful bounce in price, to reduce the position entirely.For now, we do think it's best to stay in the barbell portfolio, and we'll refrain from branching out into riskier plays until we're well into September and the new rate-cutting cycle.
Recommended from Cryptonary


