Save 23% ($351) & Get a Free 1-1 Call with our Team ⏰ : 0d 2h 59m 43s

Since its inception by Satoshi Nakamoto, Bitcoin has transformed from a peer-to-peer payment system into a widely accepted store-of-value asset, adopted by companies, institutions, and even governments.
What began as a small, niche asset, largely influenced by its halving events, has now grown into the leader of an entire ecosystem. Bitcoin has become an integral part of the traditional financial system. As a result, it is increasingly influenced by macroeconomic trends, liquidity cycles, and other factors that impact traditional finance.
Why is this important? We believe that the traditional indicators guiding Bitcoin’s cycle are being replaced by new market forces. As Bitcoin becomes more entwined with the broader financial ecosystem, its price dynamics are affected by the same factors that influence global markets.
If we project the previous BTC cycles onto the current one, when might the next peak occur? By using the 1,429-day interval between cycle tops (2017–2021–2025), the projected cyclical high for this cycle is expected to fall in early October 2025.
However, macroeconomic trends, liquidity expansion, and potential rate cuts could extend the structural bull phase, possibly into 2026.
Let’s dive deeper into this…
Disclaimer: This is not financial or investment advice. You are responsible for any capital-related decisions you make, and only you are accountable for the results.
Cycle Timing: 1429 Days Between Tops
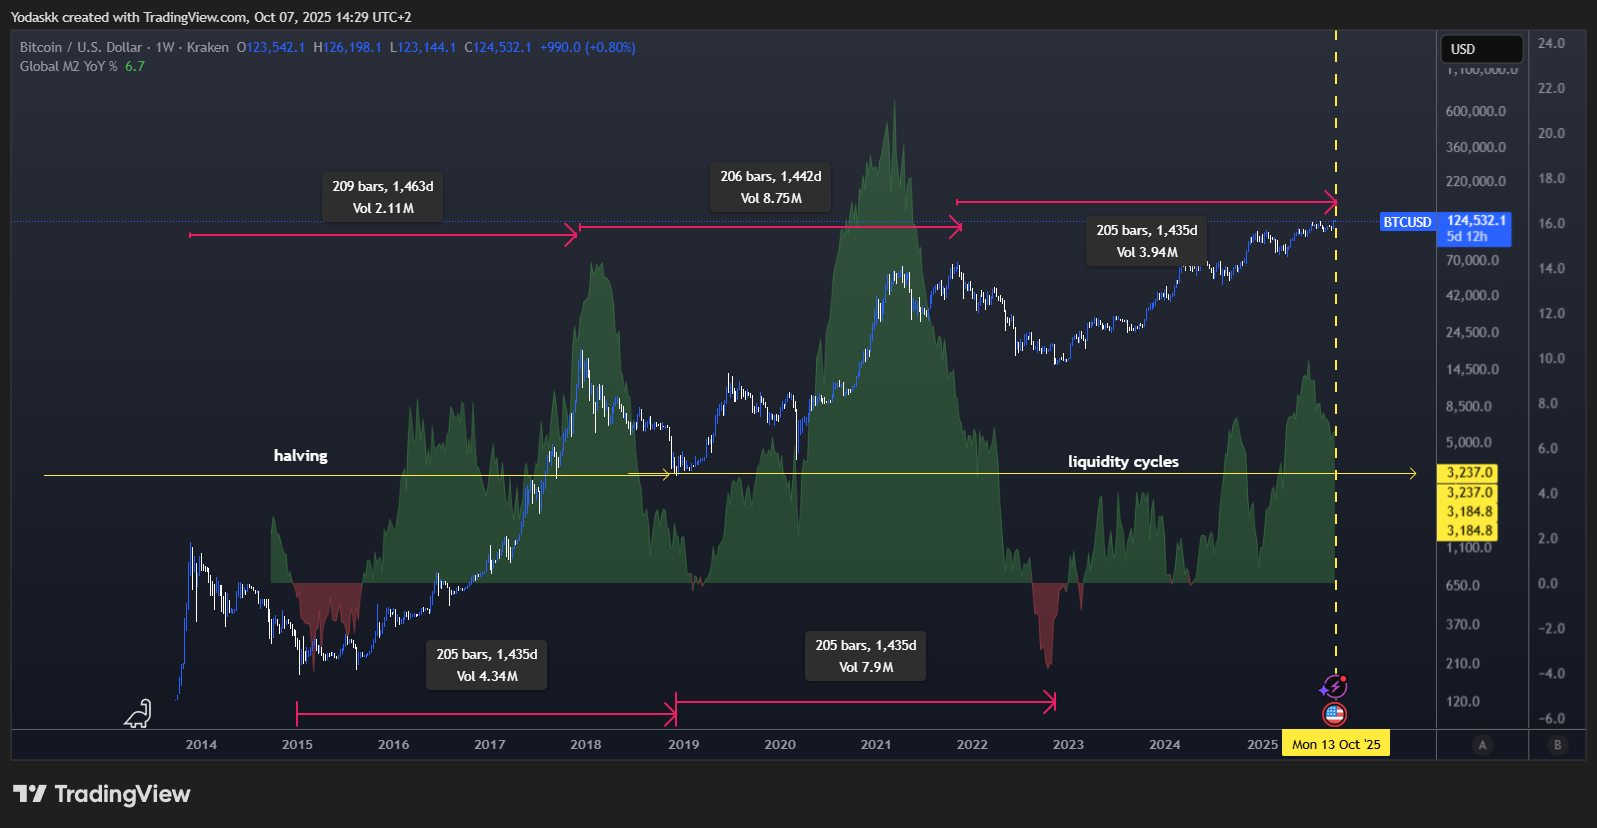
Let’s start with historical BTC price cycles. Bitcoin's cycles have historically been marked by major price peaks every 1,429 days. Bitcoin peaked in December 2017 and again in November 2021, precisely 1429 days apart.The logical next step, given this data, is to project forward another 1,429 days from November 2021 to estimate the next potential peak. If we project forward another 1,429 days from November 2021, we land on a potential cycle top in early October 2025.
But is this enough data to decide when to exit? Bitcoin’s market is much larger now, and its relationship with traditional financial markets has deepened. As such, the dynamics of its cycles are evolving.
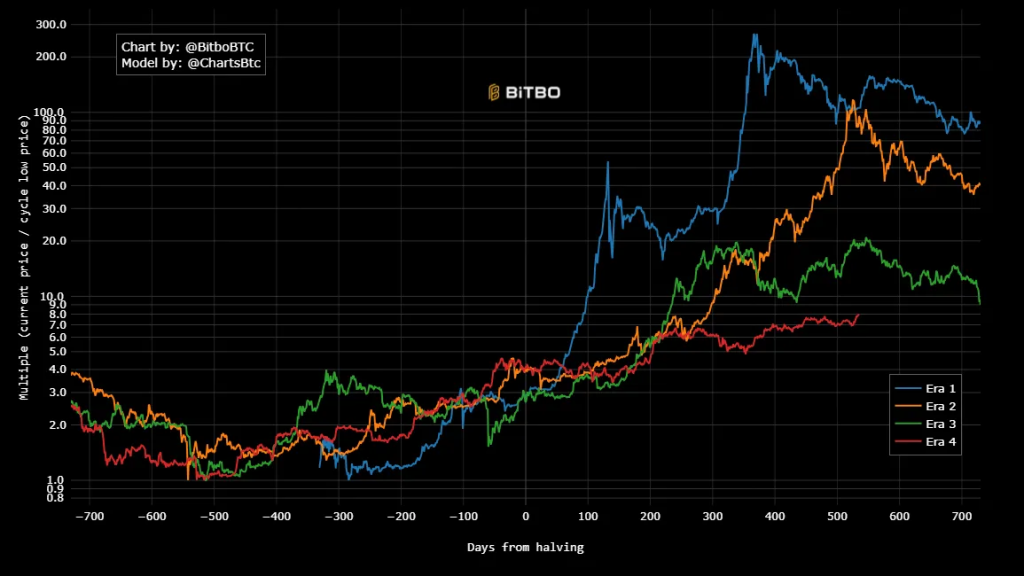
You can see in the chart below how Bitcoin’s early cycles were heavily influenced by halvings, which had a significant impact on the supply hitting the market. However, over time, the effect of halvings diminished. As Bitcoin grew in size and prominence, it became more integrated into the traditional financial system through vehicles like CME Futures, Bitcoin ETFs, and other institutional products. With this increased integration, factors like liquidity and M2 (money supply) began to play a much larger role in shaping Bitcoin's price dynamics.
BTC Cycle Peaks Chart:
Let’s look deeper at the transition from halving-driven to liquidity-driven dynamics.
From Halving to Liquidity Cycles
Bitcoin’s earlier cycles (2013–2021) were shaped by its halving schedule, where block rewards were cut in half every four years, inducing supply shocks. As over 95% of the total supply has now been mined, halving effects diminish over time.The market now follows a similar 4-year cycle, which happens to be aligned with the halving cycle but is in fact due to global monetary expansion and contraction.
What does it really mean?
The monetary liquidity cycle is a powerful, central bank-driven fluctuation in global money supply, beginning with Quantitative Easing (QE) where the central bank dramatically expands its balance sheet by creating new bank reserves to purchase assets, flooding the financial system with liquidity to lower rates and stimulate the economy.
This is followed by a contractionary phase of Quantitative Tightening (QT), where the central bank shrinks its balance sheet by allowing assets to mature without reinvestment, passively draining liquidity and tightening financial conditions.
The cycle culminates and resets when economic weakness or market stress emerges, forcing the central bank to halt QT and pivot to an easing cycle by cutting policy rates and potentially restarting QE. Central Banks start again to inject liquidity to stabilise markets and reignite growth, and complete the loop. Overall, the monetary liquidity cycle could be at this step.
But while for the past 10 years, this liquidity cycle was on a 4-year cycle, the current liquidity cycle seems to be delayed and could take longer.
Let’s look at M2, which is the best proxy for liquidity in the system.
Liquidity Conditions: M2 & YoY Growth
M2 is the total amount of money in an economy, categorised by its level of liquidity. U.S. M2 currently stands near $22.1 trillion (Sept 2025), with YoY growth turning positive in late 2024 and accelerating through 2025.M2 Growth Chart:
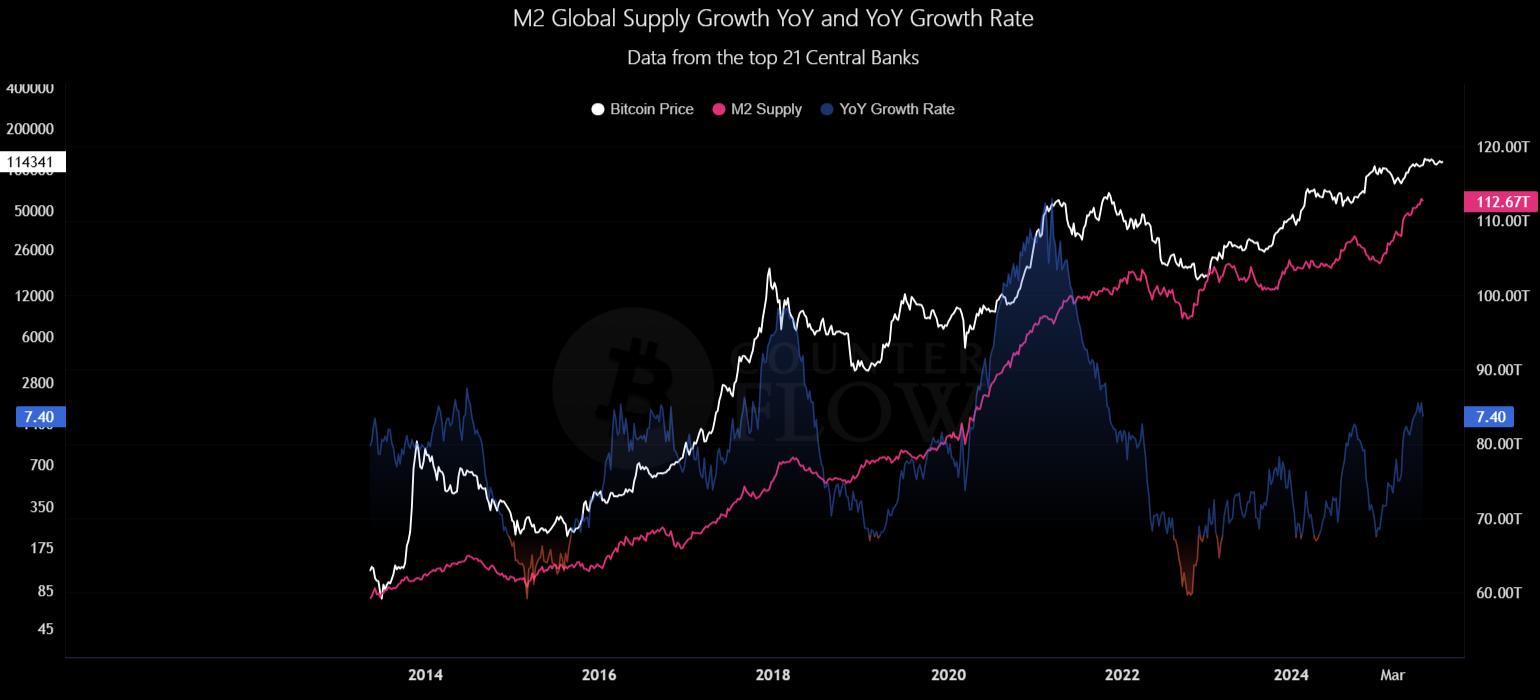
Newly available liquidity typically flows into the crypto markets within a few months, often having a positive impact on Bitcoin. With a delay of about 10 weeks, we can observe a strong correlation between Bitcoin and M2.
BTC vs. M2 Correlation Chart 1:

We can clearly view the correlation between M2 and Bitcoin on the high timeframes here, especially during its steepest moves.
BTC vs. M2 Correlation Chart 2:
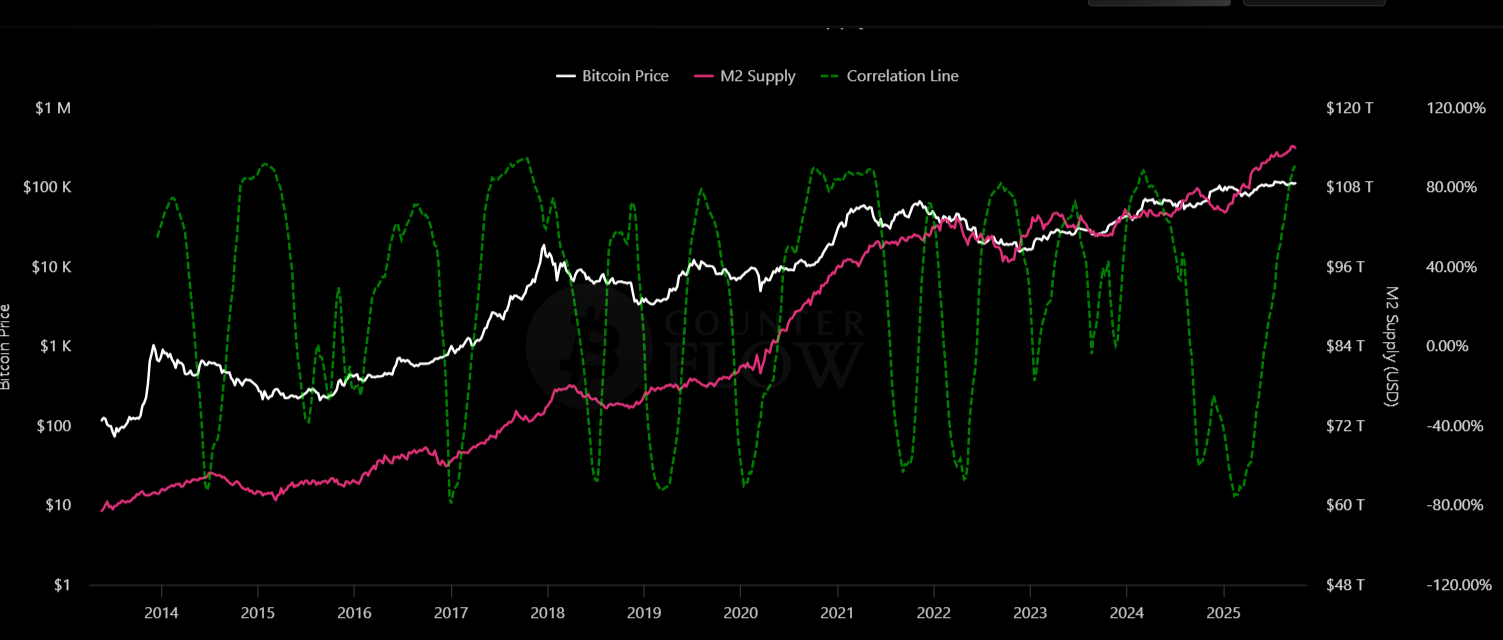
A study has shown the impact of M2 on Bitcoin, describing it as “empirical elasticity.” According to the study, each 1% increase in M2 corresponds to a 2.5–2.7% rise in Bitcoin’s price levels. While the study is a pre-print and non-peer-reviewed, it provides an interesting observation on the relationship between liquidity and Bitcoin's price movements.
This reflects Bitcoin’s nature as a leveraged liquidity asset.
Now, let's look at the US Fed policy in order to try to understand what will impact the increase in M2 in the next months.
US Fed Policy, Rate Cuts & Polymarket Odds
Polymarket is a decentralised prediction market platform where users can bet on the outcomes of various future events, including economic and financial developments. It allows market participants to trade on the likelihood of specific events occurring, with the price of shares in these outcomes reflecting the perceived probability.This makes Polymarket a unique and valuable tool for gauging market sentiment and expectations.
Polymarket data currently suggests over 80% odds of 2 or 3 Fed rate cuts by December 2025. Such a development would likely increase liquidity in the market, which tends to be favourable for risk assets, including Bitcoin.
Polymarket Odds for Fed Rate Cuts:

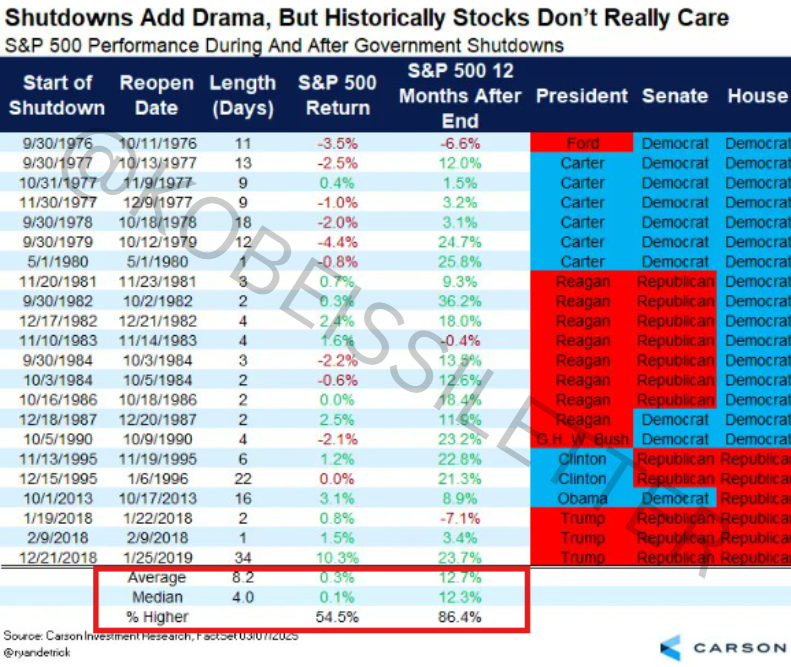
Historically, rate cuts within 2% of S&P 500 ATHs lead to +14% equity returns over the following year, per Carson Research.
S&P 500 Rate Cut Effect Chart:

Bitcoin, with its strong correlation to the S&P 500, could experience a delayed yet amplified benefit from easing liquidity conditions, given its role as both a risk asset and a leveraged liquidity asset.
As liquidity expands, Bitcoin, like other risk assets, tends to see a delayed positive reaction, potentially making its price movements more pronounced than those of traditional assets.
Here are more reasons why the Bitcoin cycle may not be over yet…
DXY & Fiscal Effects
DXY (Dollar Index) had one of the worst 6-month periods in years with a decline of around -12%.DXY Trend Chart:
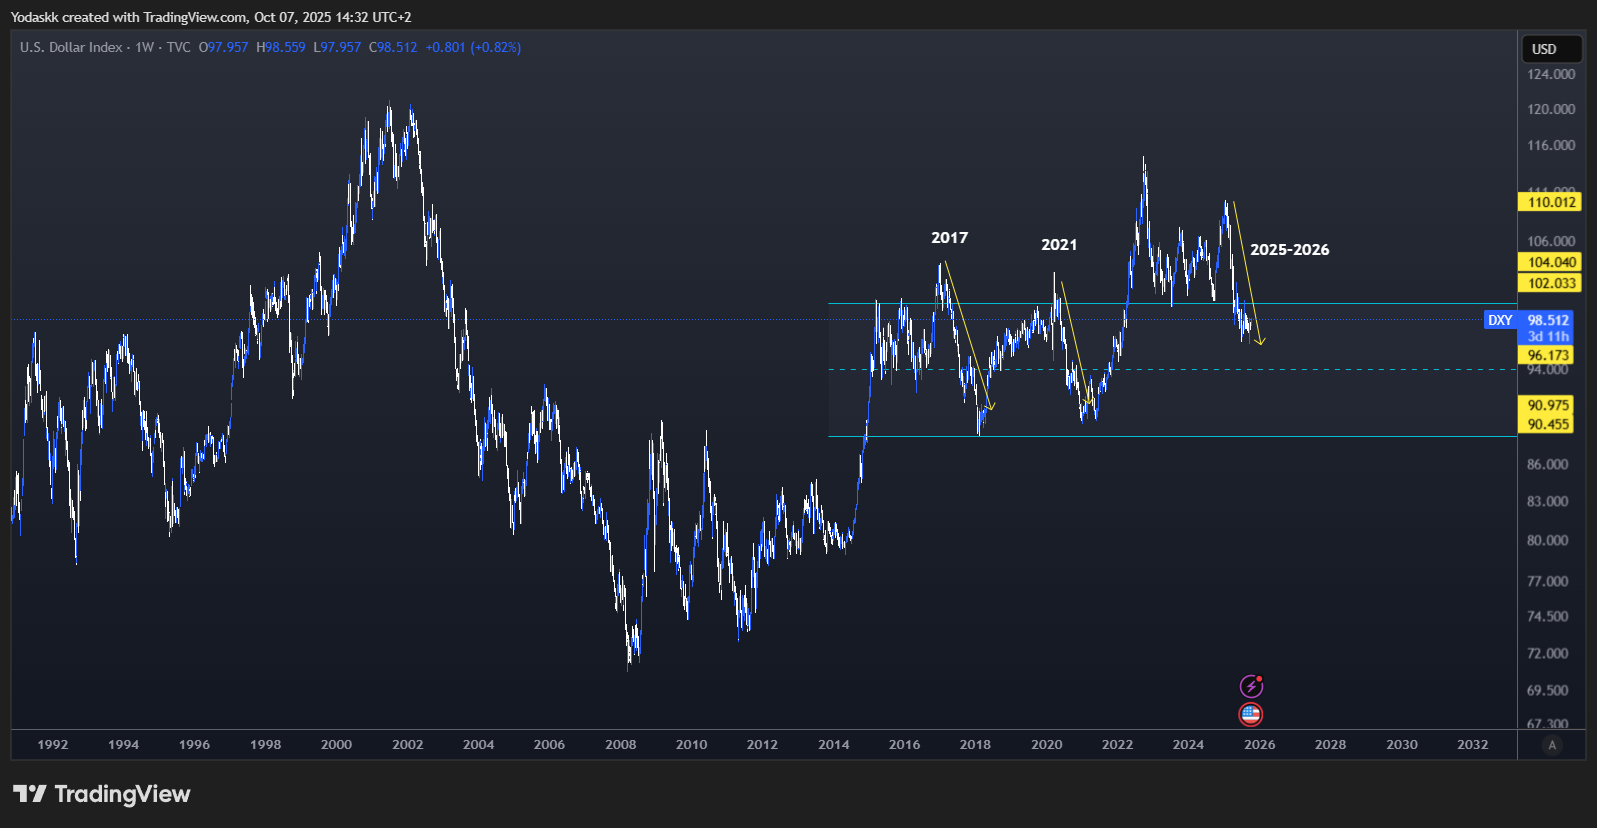
Historically, weak dollar regimes have coincided with Bitcoin bull phases, as seen in 2017 and 2021. Currently, the U.S. is experiencing a government shutdown, which, in the past, has tended to be bullish for the S&P 500. In fact, 86% of historical government shutdowns show an average +12% S&P 500 gain one year later.
This shows how fiscal stress and political uncertainty can indirectly fuel liquidity, with these trends remaining consistent regardless of the president in office.
Government Shutdown SPX Effect Chart:
Several data points lead us to think that US equities could have another 12-month overall bullish period. Bullish US equities are typically bullish Bitcoin…
BTC’s Correlation to Risk Assets
Bitcoin remains highly correlated to risk assets: 0.69 with the & S&P 500 and 0.75 with the Nasdaq, indicating it trades similarly to risk assets, as a liquidity proxy.So if we expect another 12-month bullish period ahead for US equities, it would be unusual for BTC to be bearish.
BTC S&P/Nasdaq Correlation Chart:
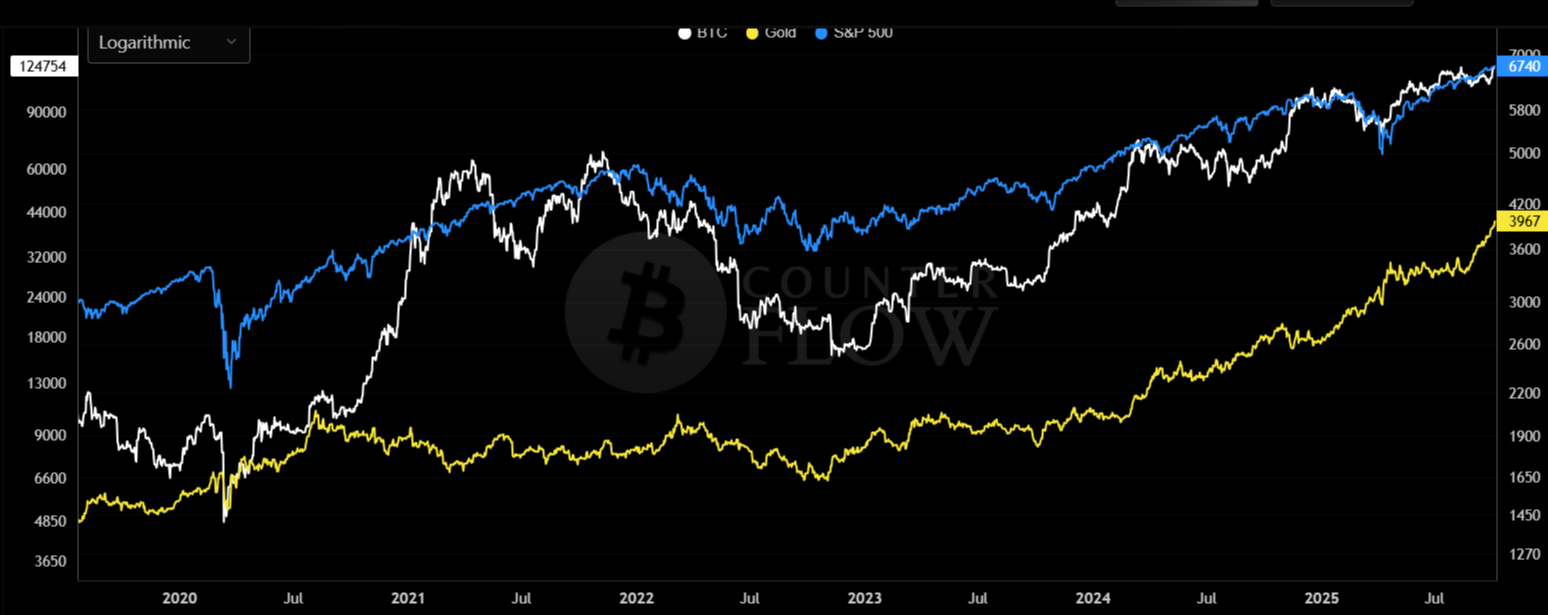
Furthermore, there is a relationship between BTC and GOLD as well.
Delayed BTC Reaction to Gold Rally
Banks all around the world are buying Gold. As a result, it reached new all-time highs in Q4 2025 following Paul Tudor Jones’s remarks on an incoming “massive rally in gold and Bitcoin.”Historically, Bitcoin tends to lag gold’s liquidity-driven breakouts by around 70–100 days, which roughly aligns with the 10-week delay it takes for M2 to flow into the ecosystem.
Given this, a continued acceleration in Bitcoin’s price through Q1–Q2 2026 would be consistent with both the gold lag and the broader liquidity expansion narrative.
The 1999 Fractal & Market Psychology
It’s interesting to note that the current conditions resemble 1999’s liquidity melt-up: easing policy, tech euphoria, and fiscal stimulus into market strength.1999/2025 Fractal Chart 1:
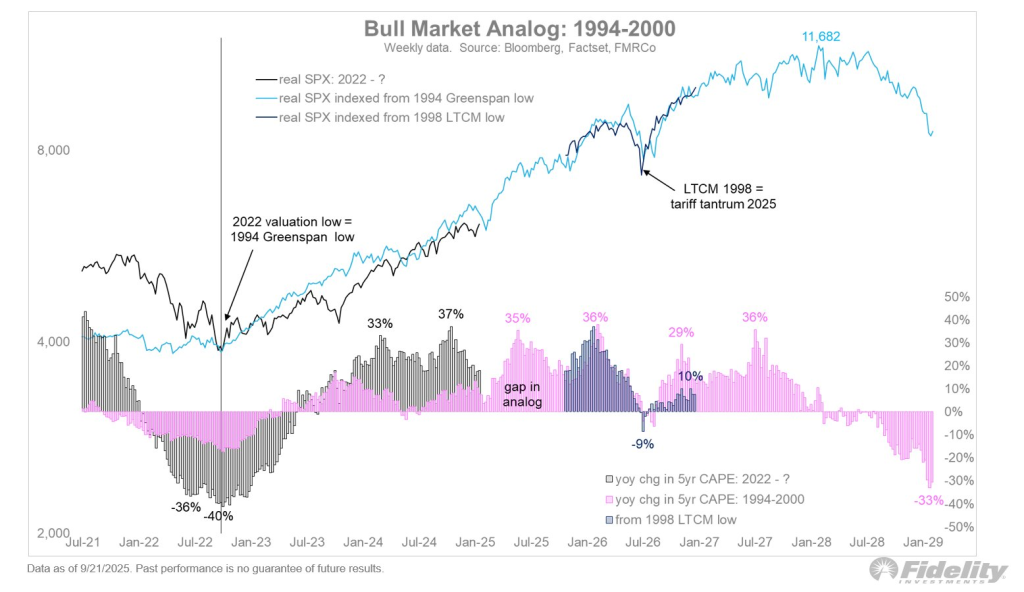

The Fidelity 1999 similarity chart shows SPX mirroring that late-cycle acceleration. This analogy supports a structural extension of the bull market through 2026 before a final cyclical top for US equities.
Here is how we could view this fractal since the tariff lows in 2024.
1999/2025 Fractal Chart 2: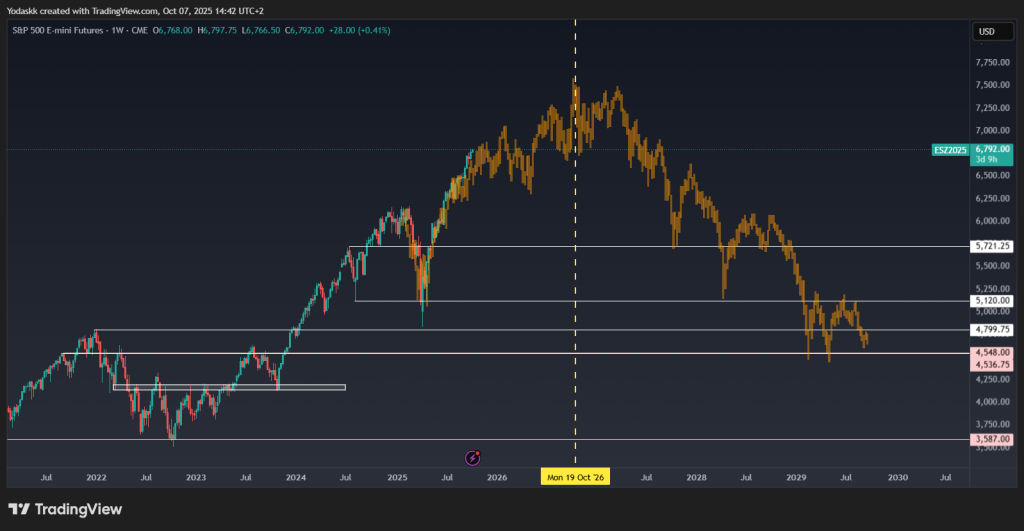
This 1999 fractal would fit all the previous data we looked at: 12 months 14% SPX gains average after a rate cut at ATH, 12 months 13% SPX gains after a government shutdown, last 1999 parabolic blow-off style before a correction at the end of the decade.
Again, BTC being highly correlated to SPX, it would be an outlier for BTC to be bearish during the last, most explosive and bullish part of a macro SPX cycle.
Lastly, let's also look at BTC Onchain indicators to see if they show the same things as our previous analysis.
BTC Onchain indicators
Despite Bitcoin trading near new all-time highs, the major on-chain cycle indicators do not show signals consistent with prior cycle tops for now.Across all key metrics, indicators remain in mid-to-end cycle territory, suggesting we are still within the expansion or early parabolic phase, not the euphoric blowoff seen in past peaks.
The 200W MA heatmap shows the price is just beginning to enter the green-to-yellow zone, typical of mid-cycle acceleration.
BTC 200W MA Heatmap Chart:
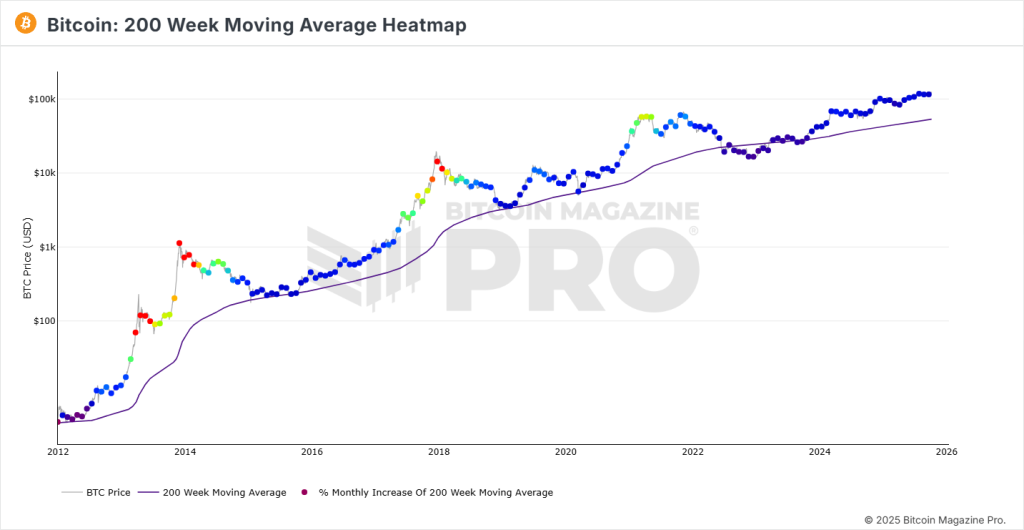
Momentum is strong, but far from the yellow-red zone that accompanied prior euphoric tops. This heatmap suggests structural strength, not exhaustion yet, even if we take into account the cyclical volatility decreasing.
The absence of a Pi signal confirms the cycle is not technically overextended. The moving averages remain parallel, consistent with the current bull phase. Even if a top could happen without a cross this time around, we could probably expect at least a steeper 111DMA during the last phase.
BTC Pi Cycle/MAs Chart:

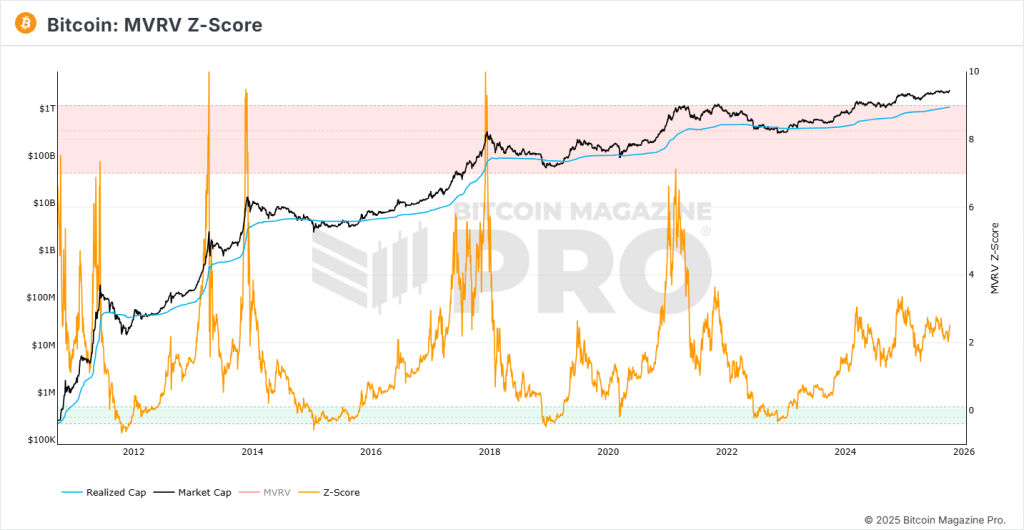
The MVRV Z-score, which measures market value relative to realised value, remains well below historical red-zone levels (typically >7–9 at cycle tops).
Market valuation is elevated but far from overheated: looks like mid-cycle behaviour. Holders are in profit, yet unrealised gains haven’t reached levels that historically trigger distribution.
BTC MVRV Z-Score Chart:
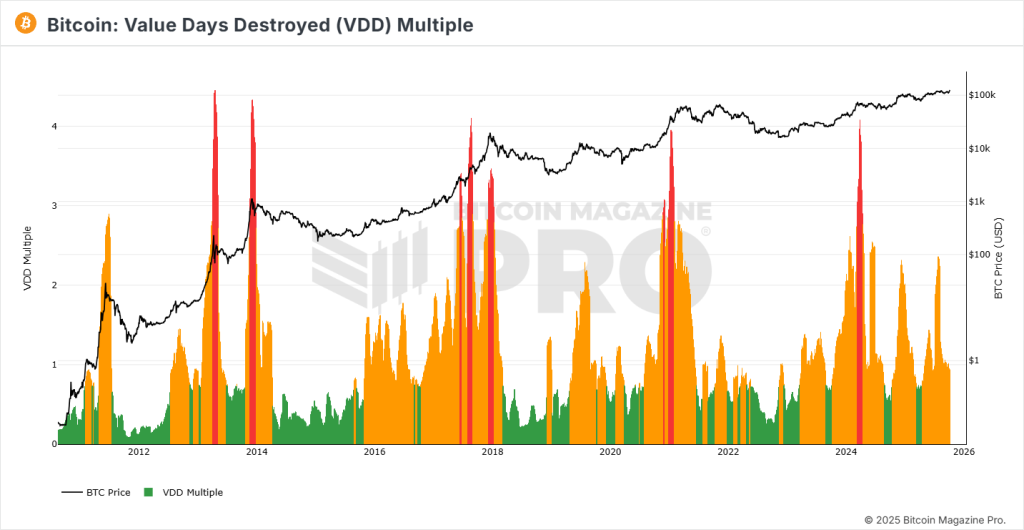
The VDD Multiple, a proxy for long-term holder profit-taking, remains muted. BTC only had a spike in 2024 when ETFs went live and created a rotation of self-custody 🡪 ETFs.
In prior cycle tops (2017, 2021), spikes above 3-4 indicated aggressive old-coin spending. Long-term holders are not yet distributing, implying conviction remains high and the market hasn’t transitioned to late-cycle selling behaviour.
BTC VDD Multiple Chart:

The share of BTC held for over one year is still near historical highs (~65–70%), showing supply concentration among long-term holders. Despite the price strength, coins are moving slowly, meaning coins are still in strong hands. We could expect a steepest decline in the 1+Year HODL wave to signal the biggest distribution at the end-of-cycle.
BTC 1+ Year HODL Wave Chart: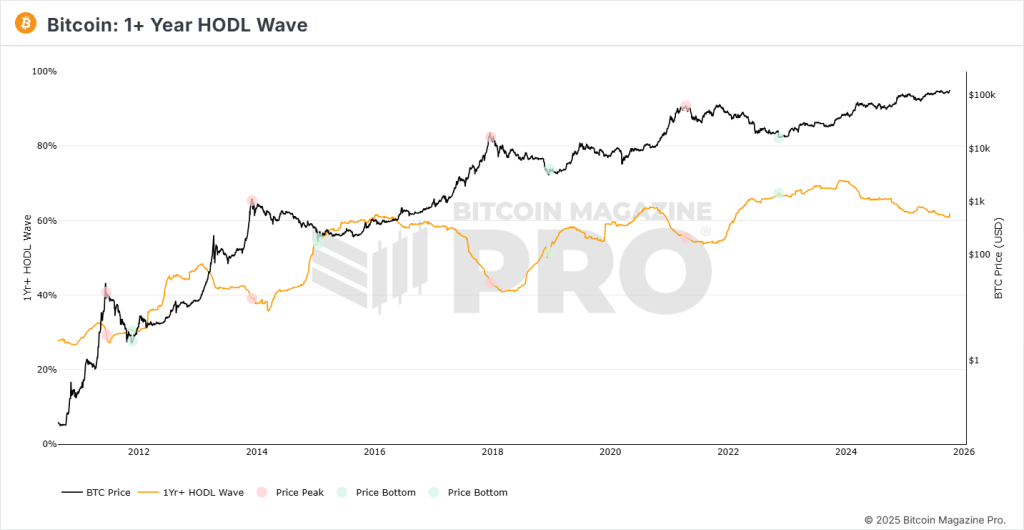
The Cycle Low Multiple, comparing current prices to prior cyclical lows, shows that BTC could currently be nearing the end of its cycle if you compare it to previous cycle lengths. Bitcoin’s multiples are significant but still below prior blowoff magnitudes, leaving room for further expansion before a major cycle top.
BTC Cycle Low Multiple Chart:

Forecast Scenario into 2026
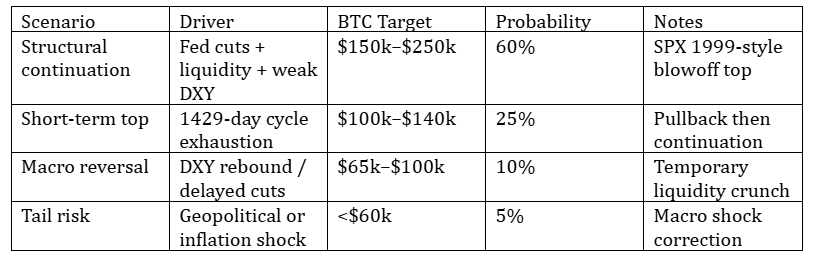
Let’s tie all of this together and look ahead to what we expect for Bitcoin in 2026. Based on the insights and trends we've discussed throughout this report, here are the tentative scenarios for Bitcoin's trajectory in 2026:BTC Scenario Forecasts Chart:

Key risks we are watching
Here are some key risks we’re closely monitoring. Any significant developments in these areas could prompt us to adjust our market stance.• Inflation surprises delaying rate cuts. • DXY rebound tightening liquidity. • ETF outflows reversing institutional demand. • Fiscal tightening or geopolitical shocks. • Overleveraged derivatives positioning signalling overheating.
Cryptonary’s take
To sum it up, Bitcoin’s 2025 cycle is shifting from being driven mainly by halving events to being more influenced by liquidity and macro factors. While the 1,429-day cycle points to a potential top in early October 2025, the global liquidity story, with rising M2 and a weakening dollar, suggests we could see even more upside.The price action is looking strong, and based on what we’re seeing in the on-chain data, there’s no clear sign of a top just yet. All these lines up with the bigger picture: with things like M2 growth, a dropping DXY, and expectations of rate cuts, the environment still supports risk assets.
At the end of the day, Bitcoin is the perfect example of how global liquidity flows through the system, and with all these conditions in its favour, it’s looking like the bull market could keep going well into 2026.
Recommended from Cryptonary


