Save 23% ($351) & Get a Free 1-1 Call with our Team ⏰ : 0d 2h 59m 43s

Disclaimer: This is not financial or investment advice. You are responsible for any capital-related decisions you make, and only you are accountable for the results.
TLDR:
- Short US Thanksgiving week; data light and unlikely to move markets.
- Fed blackout begins; December rate cut (75%) now expected after Williams’ comments.
- BTC down 36%, back in value zones but with some near-term downside risk.
- Flows weak: LTH selling, ETF outflows, and DATs turning into sellers.
- Short-term: A move to $78k-$82k could form bullish divergence; Fed cut may spark a rally to $89k-$95k.
- Bigger picture: 2026 macro still supportive; short-term trend hinges on DATs, LTH supply, and ETF flows stabilising.
Topics covered:
- This Week's Data.
- Fed Blackout Period.
- BTC On-Chain.
- What We're Watching This Week.
- Short-Term Price Action.
- Cryptonary's Take.
This Week's Data:
With this week essentially being a half-week due to Thanksgiving, we're also not getting a heavy week on the macro data front either. However, that will change as we move into December, with the next Fed Meeting just 2 weeks away (December 10th).But, the data that we're getting this week is as follows:
- PPI (Tuesday).
- Retail Sales (Tuesday).
- Durable Goods (Wednesday).
- Jobless Claims (Wednesday).
Ultimately, this week's data isn't "major" data, and we're not expecting it to be market moving.
Fed Blackout Period:
We've recently paid close attention to Fed speakers for any signal in which way Fed members are leaning (hawkish or dovish) in regards to December's rate decision.Markets have been whipped around by a plethora of opinions, where we've witnessed a shift from a number of Fed members who have leaned more hawkishly. It turned out that even though there was only 1 dissent for "no cut" at the October Fed Meeting, the Minutes showed that a number of members weren't comfortable with lowering rates even though they voted to do so. This was reflected in the more hawkish Fed speak over recent weeks, and this resulted in the market pricing out a rate cut at the December Fed Meeting. This left 4 hawkish members, against 3 more dovish members with Powell, Jefferson and Williams yet to speak.
But, late last week, New York Fed President John Williams said that he sees "room for a further adjustment (to the rate) in the near term". This immediately saw the market price a December cut back in, with odds of a Dec cut now at 75.3%.
Target Rate Probabilities for 10th Dec Fed Meeting:
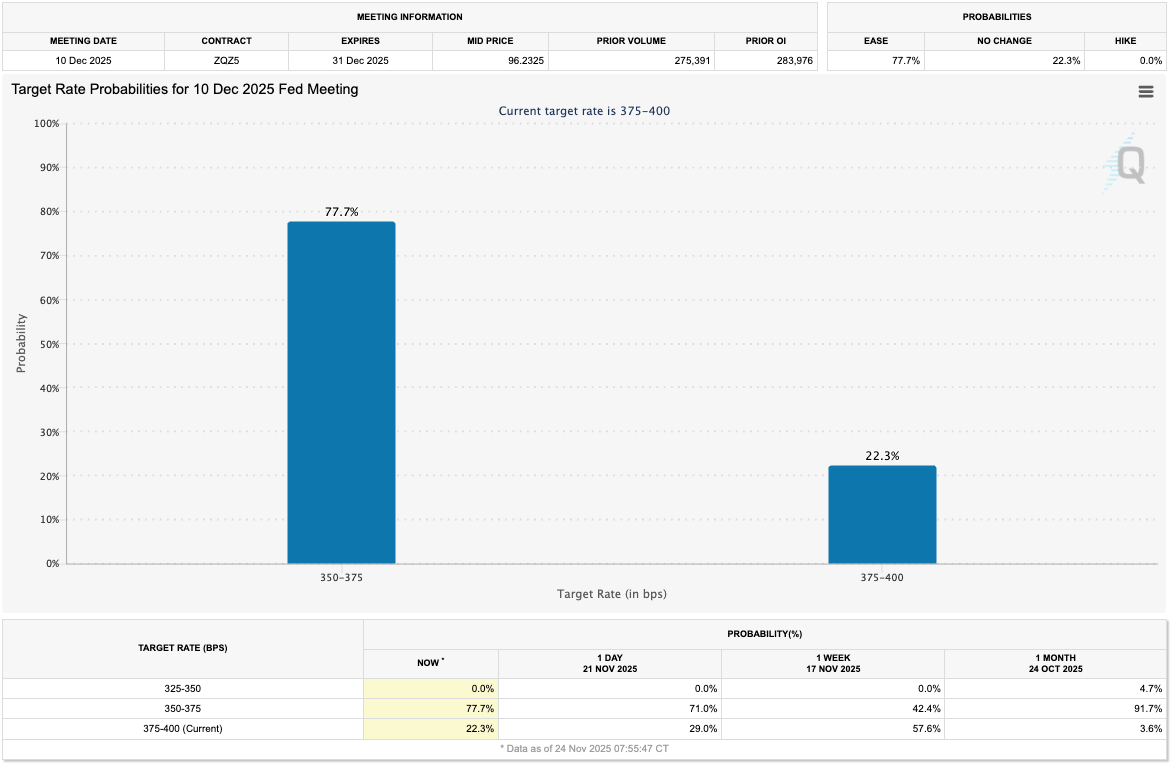
The market is now expecting the rate cut in December because Williams is a close ally of Powell's, and it's expected that Williams, Jefferson and Powell, will all vote the same. That would suggest a 7-5 vote in favour of a cut in December. But, even though the market is now pricing for a cut, it's not a guarantee and the hawks will have a strong argument in pointing towards the recent stronger Payroll number of 119k - despite more recent ADP and Challenger numbers showing a more material decline in the labour market.
Because of Williams comments, and the fact we expect Jefferson and Powell to vote the same as Williams, then we'd now also have to lean slightly towards the view that the Fed will cut rates again at their December Meeting, which could enable a relief rally, particularly in Crypto. To be clear, this wasn't our view last week. It's solely changed because of Williams' comments.
BTC On-Chain:
BTC has pulled back considerably having put in a 36.2% pullback from its all-time high - the largest % pullback from the highs that we've seen in this bull cycle. Although this pullback in percentage is similar to the ones we saw in August 2024 (33.5%), and March/April 2025 tariff tantrum (31.9%), it has broken below some key technical levels - 50WMA for example.But, this pullback has put BTC into value territory, assuming we're still in a bull market - we're of the view that we are, although we don't see substantial upside (north of $110k) anytime soon.
Last week, BTC entered its Production Cost band between $67,900 and $84,800. Historically, BTC has been in a value zone when it has retraced to its Production Cost band, but that doesn't mean it can't continue to go lower in the immediate term.
If we look back to May 2022, we can see that price initially wicked into the Production Cost band, whilst the Production Cost band began to turn down. Over the next 6 months, the Production Cost band continued to go lower, with price grinding lower to fill in the Production Cost band.
Production Cost:
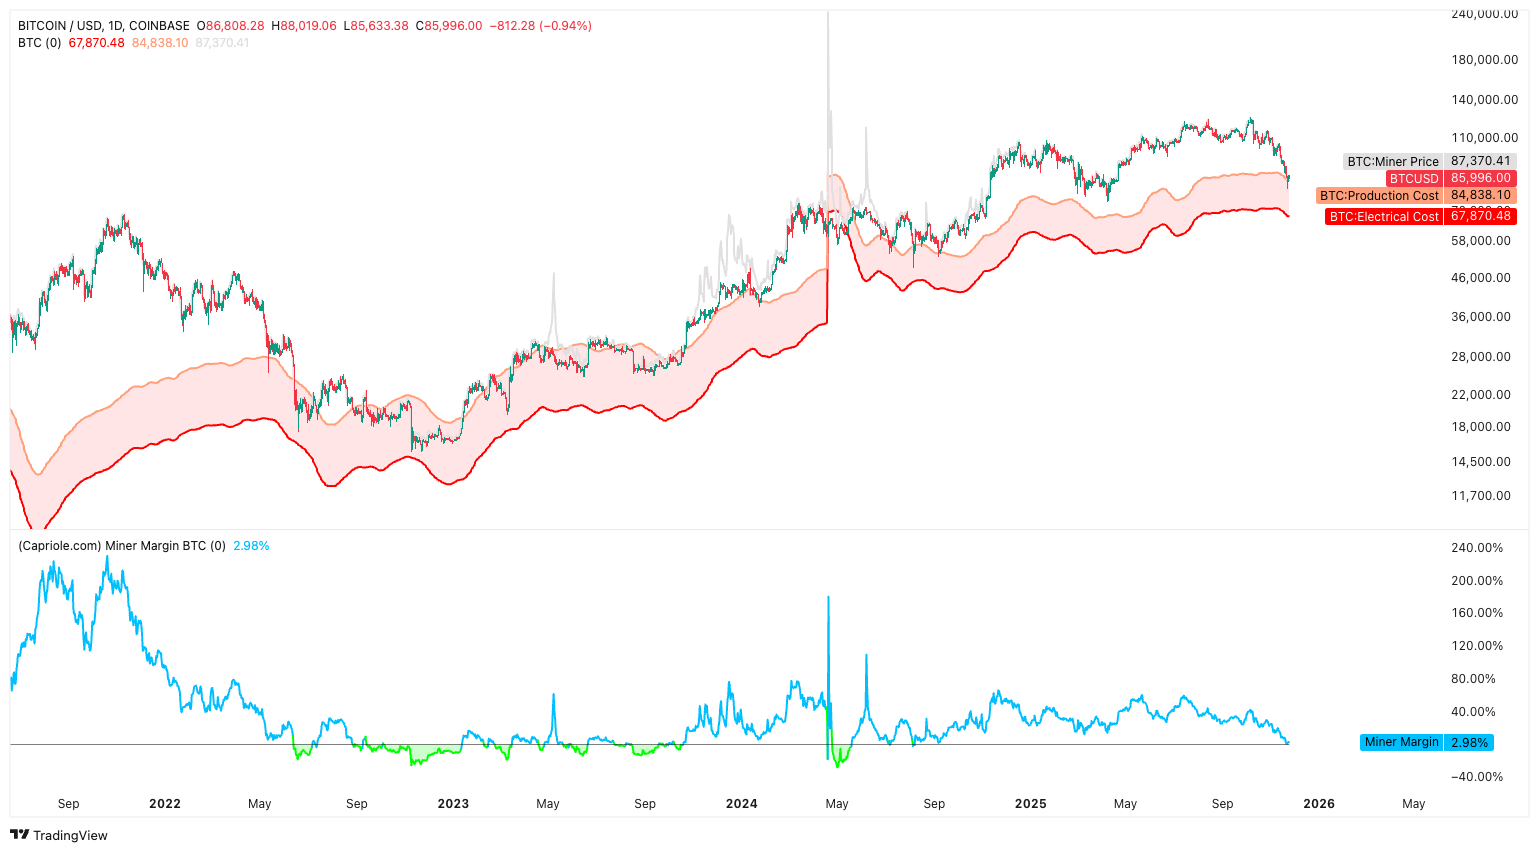
However, if we look back at the summer 'chopsolidation' of 2024, we can see that BTC wicked into the Production Cost band multiple times before propelling above it to new all-time highs. If you assume that we're still in a bull market (we do, as we see a positive macro backdrop in the first half of 2026), then the low $80k's might represent good value for BTC buys.
There is also another support in the low $80k's with the True Mean Price (the blue line in the below chart). The True Mean Price acted as support throughout the 2021 bull market.
Key Cost Basis Price Models:
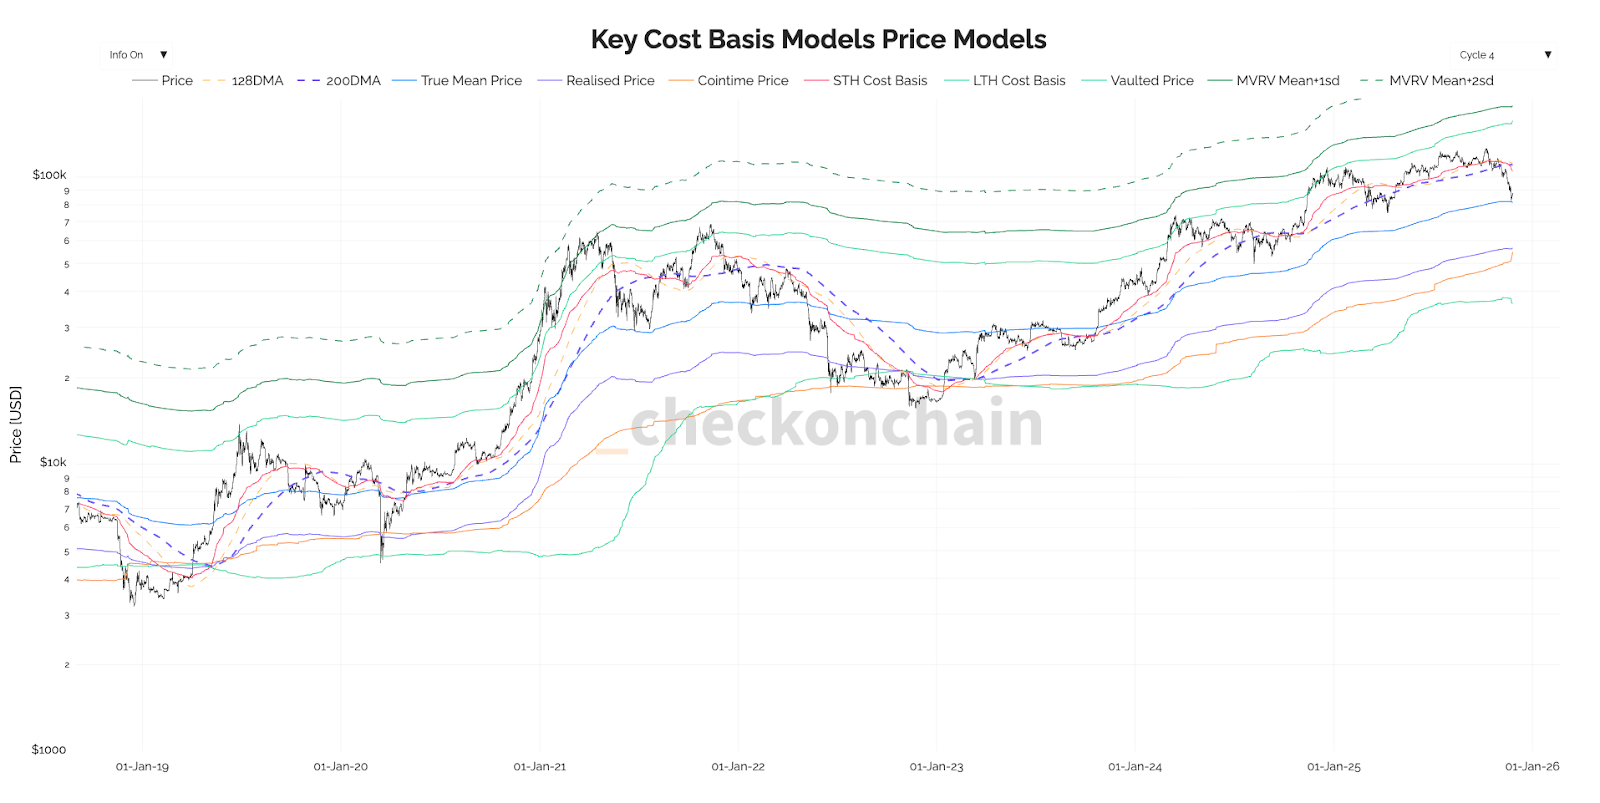
However, should we see price break below the True Mean Price, then the next on-chain support level would be the Realised Price. This currently sits at $56,500. The Realised Price has only been visited at or close to the end of bear markets. Should it be tested (not our base case), then it's a 'throw the kitchen sink at it' level - buy, and get as fully allocated at that level as you're comfortable with.
What We're Watching This Week:
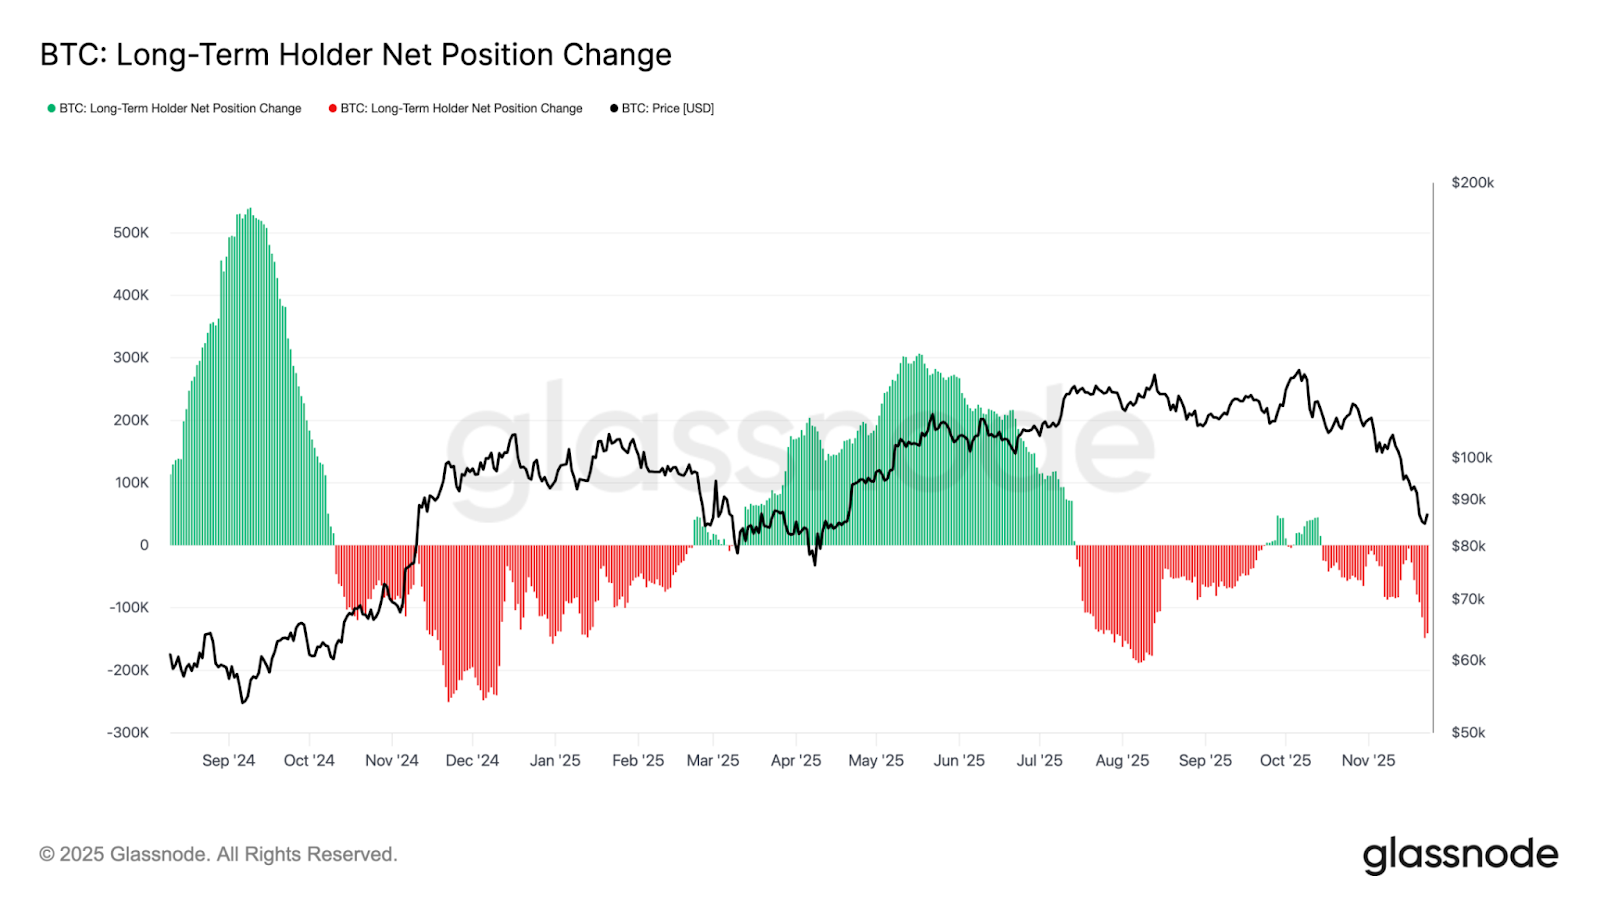
BTC is now at a crucial level, and despite being at on-chain and technical supports, plus being very oversold, there is still the chance we go lower in the short-term, especially with sentiment being as poor as it is.The two key flows data we've been watching: ETF flows, and Long-Term Holder Supply Change, are showing that Long-Term Holder Supply keeps decreasing (Long-Term Holders selling down their supply), whilst the ETF's are still seeing substantial outflows, although last Friday we did get a day of inflows. But note, on big price pullbacks, we've had inflows that have preceded large consecutive outflows days.
Long-Term Holder Net Position Change:
ETF Flows:
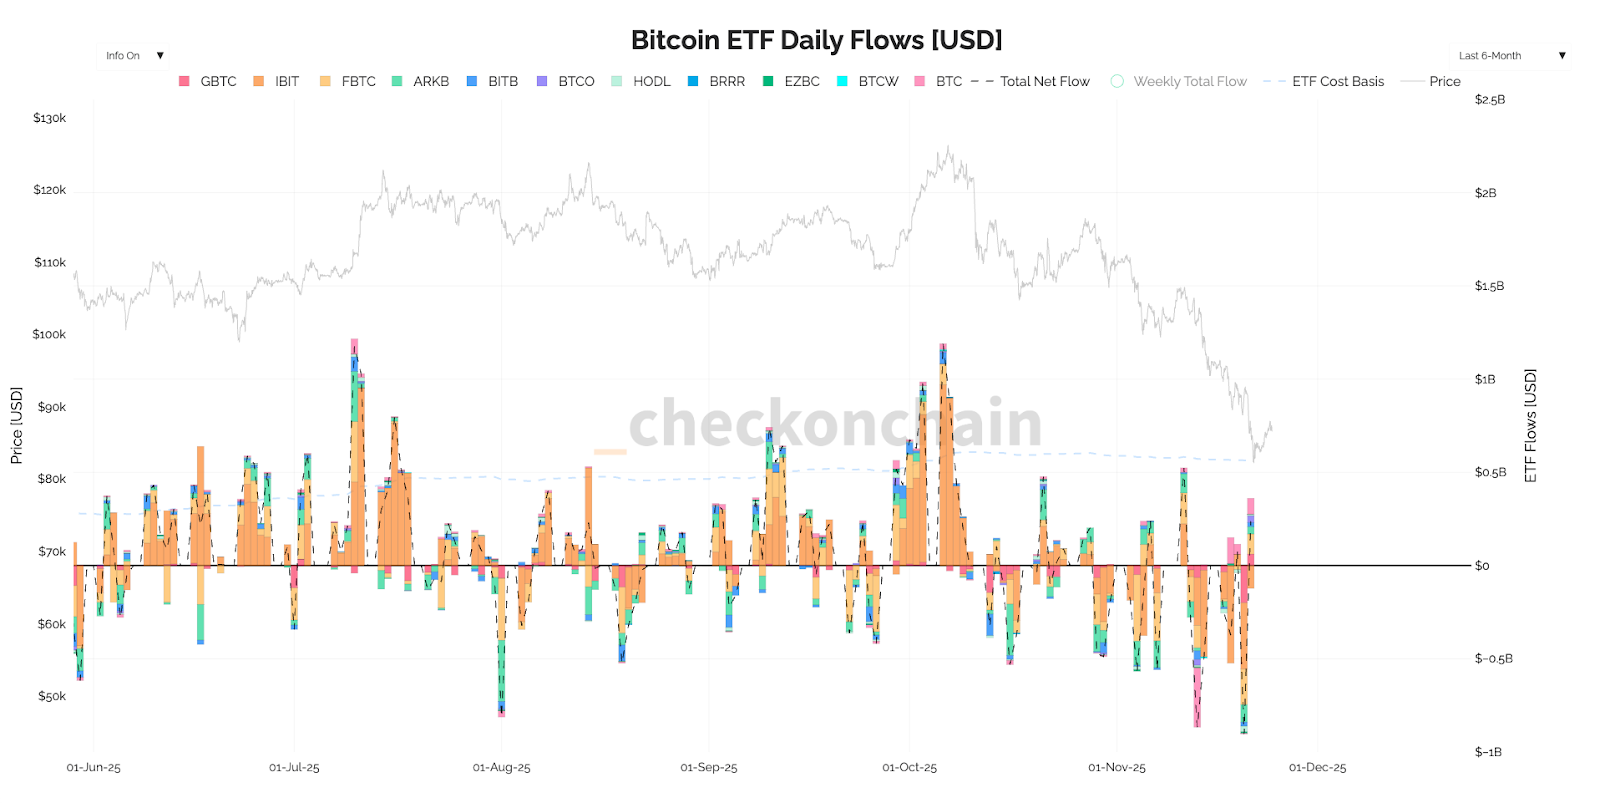
So, the flows data is still not supportive, despite BTC having pulled back to the low-to-mid $80k's. For a bottom to form, we'd like to see both of these charts begin to ease (in terms of the overall net sell pressure).
Alongside the above, we're also paying attention to any signs of DAT's (Digital Asset Treasuries) coming unstuck - having to sell the coins they bought. In the last 12 months, DAT's have been the marginal buyer. It now looks like they're the marginal seller. And the lower price goes, the more likely this phenomenon is to escalate. Should we see this escalate, it's unlikely that large institutional buyers will step in front of this and become the marginal buyer. They're more likely to let the smaller DAT's (by total value of assets) implode, see where price bottoms (of the underlying asset - BTC, ETH) and then look for buys.
Should this unfold, this would increase the odds of a pullback to the Realised Price for BTC - $56,500. For now though, it's still not our base case.
Short-Term Price Action:
The way we're seeing the short-term is as follows:- BTC has pulled back to technical and on-chain support and it's very oversold.
- Flows are not supportive, neither is the sentiment, and neither is the DAT narrative.
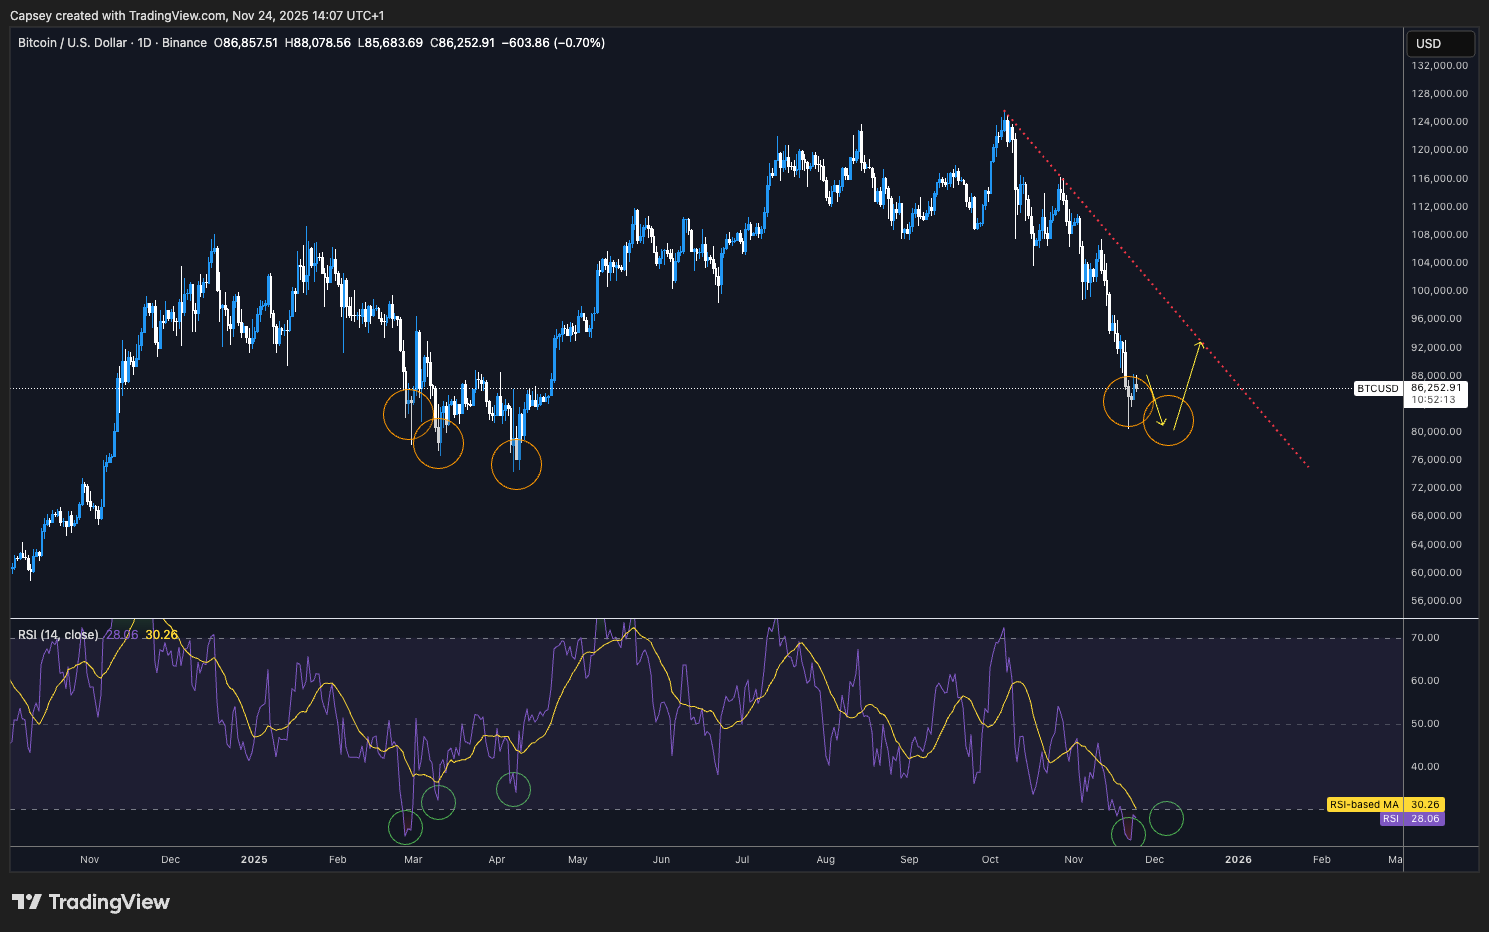
We've shown the bullish divergence setup on the below chart followed by a potential path for price action over the coming weeks.
BTC - Potential Bullish Divergences Setup:
Our more long-term view, we'll reassess as the days and weeks play out. It's really important that we see the flows data improve and for the DATs to stabilise, rather than unwind.
Cryptonary's Take:
In the last few weeks, BTC has pulled back by a greater percent than all the other pullbacks since the start of this bull cycle. What we're wrapping our heads around is whether this is a buyable pullback or whether we're in a bear market.We have the macro backdrop for the first half of 2026 as being supportive which should take BTC higher, and hence our view that we're still in a bull market. However, in the short-term, we have outright risks to Crypto (the unwind of DAT's) which is being front-ran by Long-Term Holders and institutional players (ETF's) selling down their BTC. This has resulted in a cascade lower for prices.
We expect that the technical setup is there in the short-term to play a bounce from $78k-$82k zone into the $89k-$95k zone, catalysed by a Fed rate cut in early December. We don't expect Long-Term Holders and ETF's to continue unloading supply into the $78k-$85k region say - it's just not an attractive price to sell coins into, especially considering how oversold BTC is here.
To put it simply:
We expect a move down into the $78k-$82k area, a bullish divergence to form, and then for price to move up from there to $89k-$95k.
In terms of bull or bear market, we'll monitor this more in the coming weeks. To determine this, we'll be paying close attention to the following:
- DAT's unwinding.
- Long-Term Holders and ETF sell pressure.
- Rate cuts, and the expectation for future rate cuts.
Recommended from Cryptonary


