Save 23% ($351) & Get a Free 1-1 Call with our Team ⏰ : 0d 2h 59m 45s
Technical Analysis
THORChain (Rune) coin price prediction - chart, and expert analysis
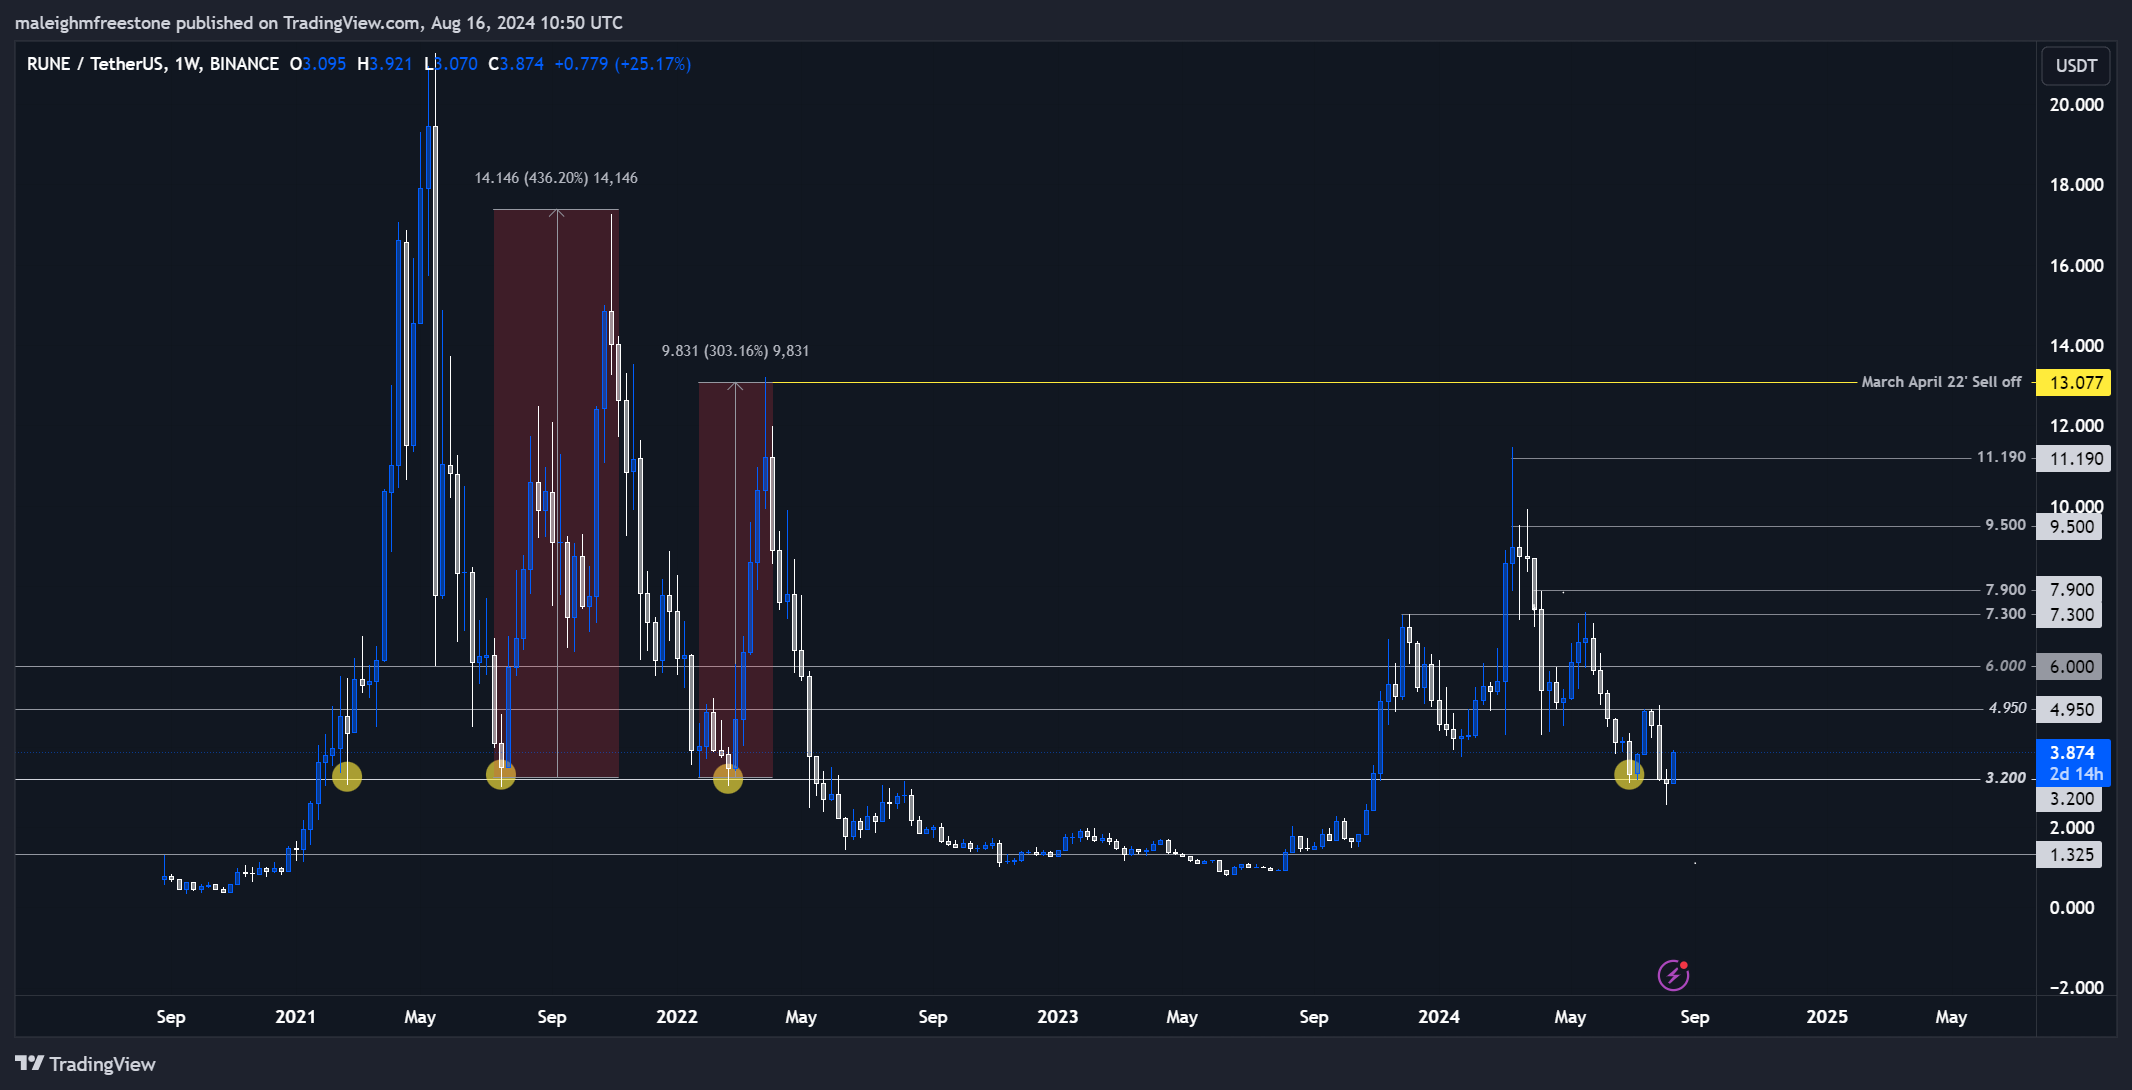
Back in July 2021, RUNE rallied 431% from this price point, and in July 2022, it surged 303%. This price level, $3.2, has consistently demonstrated its importance as a demand zone, even after significant corrections. Given that we're currently trading around this level, it's an indicator that we could see a potential reversal.
RUNE market context
The first key level we're focusing on with RUNE is the $3.2 zone. Recently, we moved away from this level, but it's crucial to remember its significance. On July 6th, 2024, after a major 35% sell-off from $7.30, we saw a strong 52% rebound from $3.2. Historically, this level has proven to be pivotal.The historical context shows that after substantial rallies, the market has still recognized the relevance of $3.2, making it a strategic point to start building positions. The previous cycles suggest that, despite corrections, demand has been strong enough to drive substantial recoveries.
Disclaimer: This is not financial or investment advice. You are responsible for any capital-related decisions you make, and only you are accountable for the results.
Market mechanics
Several key factors are influencing the current market mechanics for RUNE:Liquidation heat map:
The 24-hour liquidation heat map from August 16th shows that price levels around $3.888 were targeted, with the market being magnetized towards this area. Currently, we are trading just below the $4.00 level, with liquidation levels sitting just above the current price. This suggests a potential squeeze upward, which could help reclaim the $4.00 level. This evidence supports the idea of beginning to build a spot position around current levels.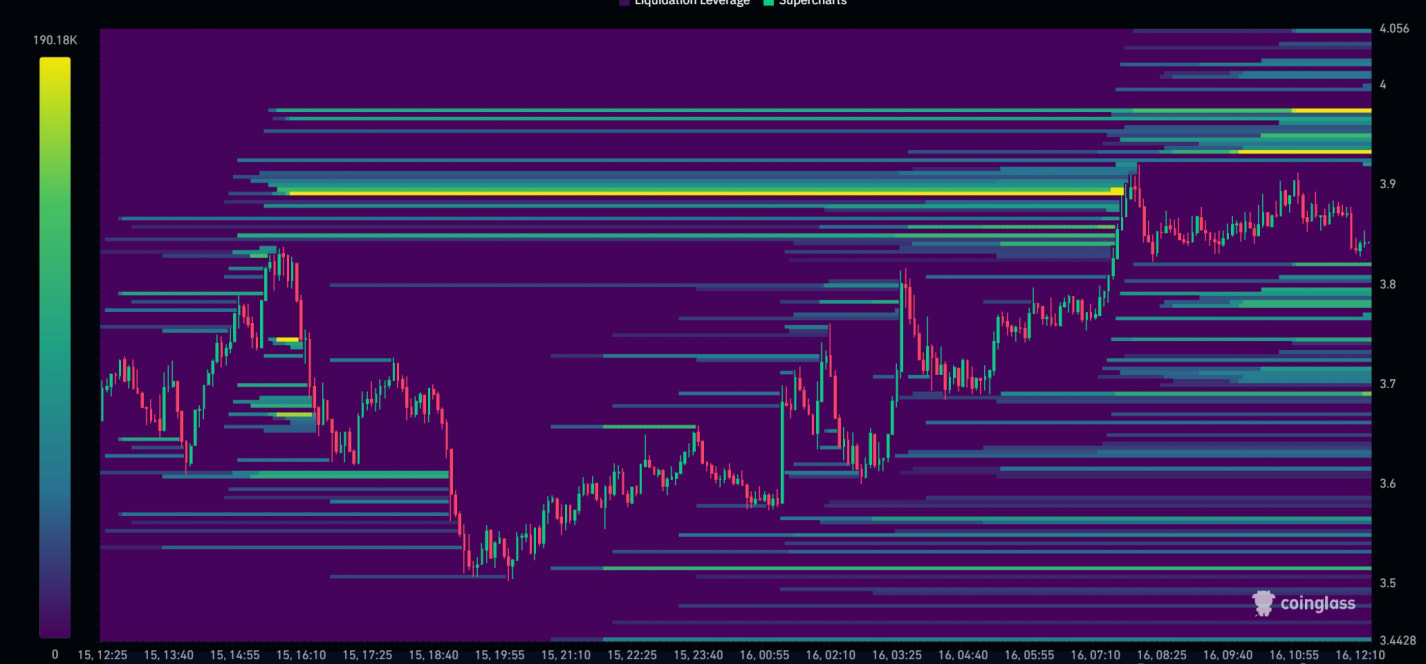 Volume:
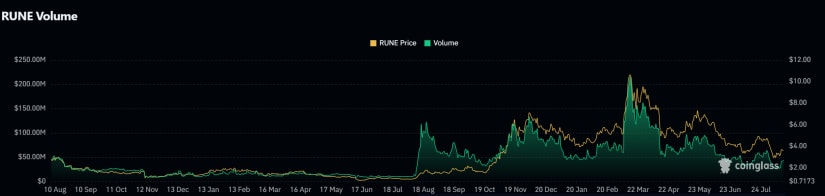
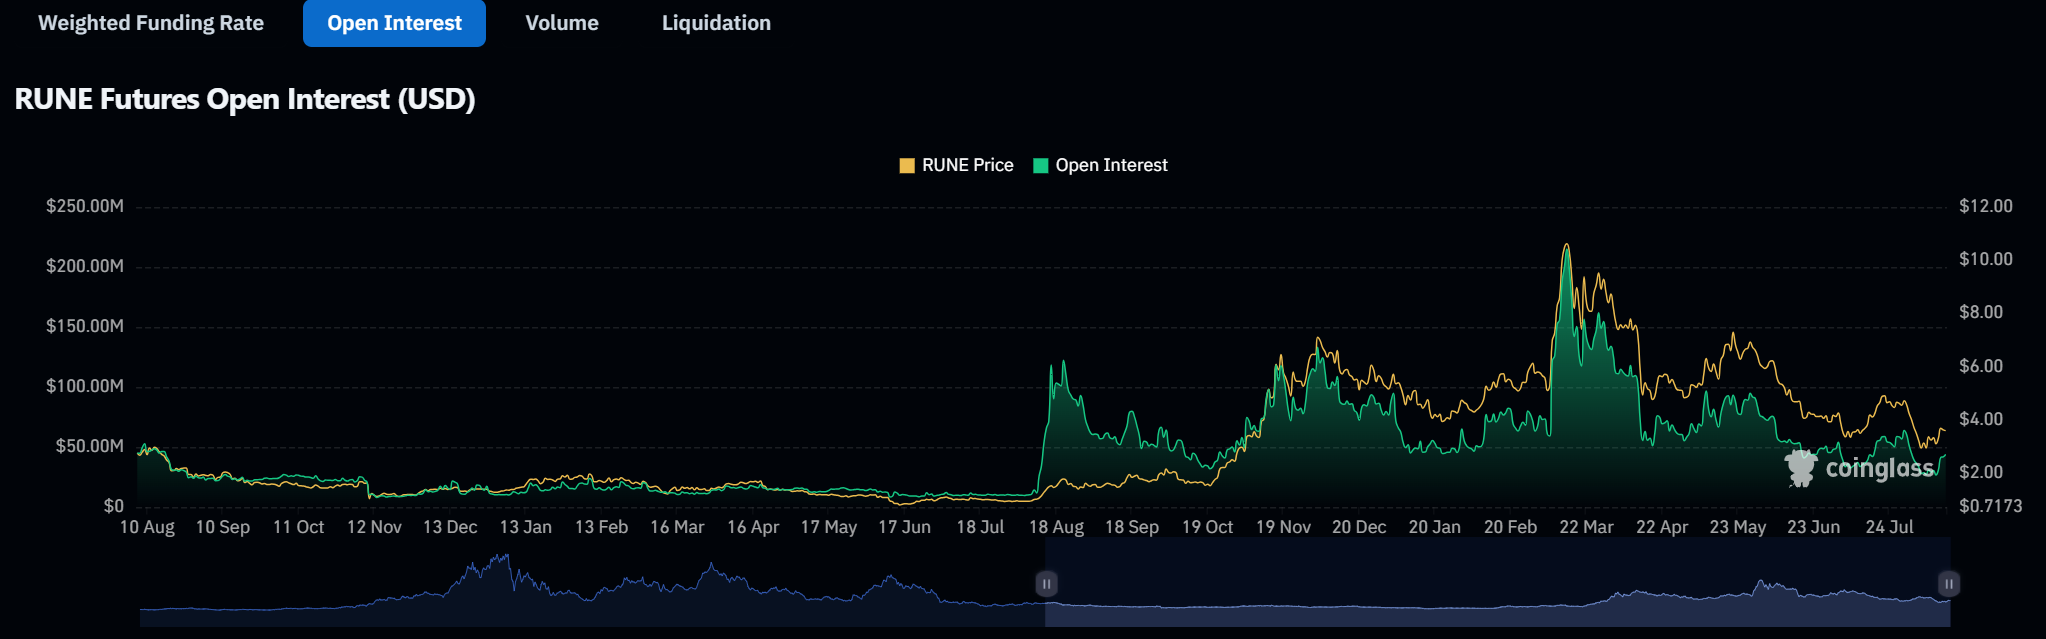
Volume for RUNE is relatively low and flat at the moment, especially when compared to significant periods like March 25th and March 16th or December 2023. Low volume is typical before a significant move begins, and considering the market-wide volume context, this could indicate that we're on the cusp of some interesting developments.
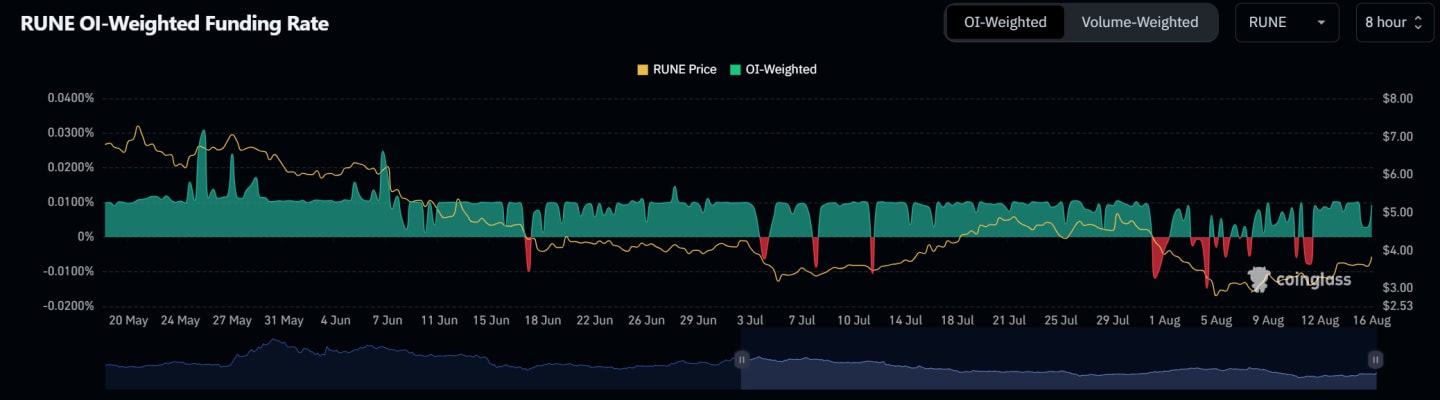
 Open interest and funding rate:
Current open interest and funding rates for RUNE are balanced, with no overheating or significant bias towards longs or shorts. This balanced scenario means there are no immediate headwinds or hurdles that might hinder price movement. It also suggests that the market is in a neutral position, ready to move in either direction depending on external triggers.
 Playbook
Hypothesis
RUNE's historical behavior suggests that the $3.2 level is a critical demand zone, with previous rallies of 303% and 431% from this point in prior cycles. Given the current market context, this level could again serve as a launchpad for a significant move, especially if we see price action hold around here.Key levels
$3.2: Strong historical support and a key accumulation zone. If we revisit this level, it's a prime area to consider building positions. $4.00: Psychological resistance and a historically significant level. A reclaim of this level could indicate the start of a new upward trend.Risk management
Spot Accumulation: The safest approach is to build a spot position within the $3.2-$4.00 range. This method avoids the risks associated with leverage, allowing you to hold through market swings for potential long-term gains. Leverage Strategy: If you're looking to increase exposure, consider using light leverage with stop losses placed below $2.553. This strategy requires careful risk management and an understanding that you may need to reposition if the market moves against you.Leverage strategy:
If you're looking to increase exposure, consider using light leverage with stop losses placed below $2.553. This strategy requires careful risk management and an understanding that you may need to reposition if the market moves against you.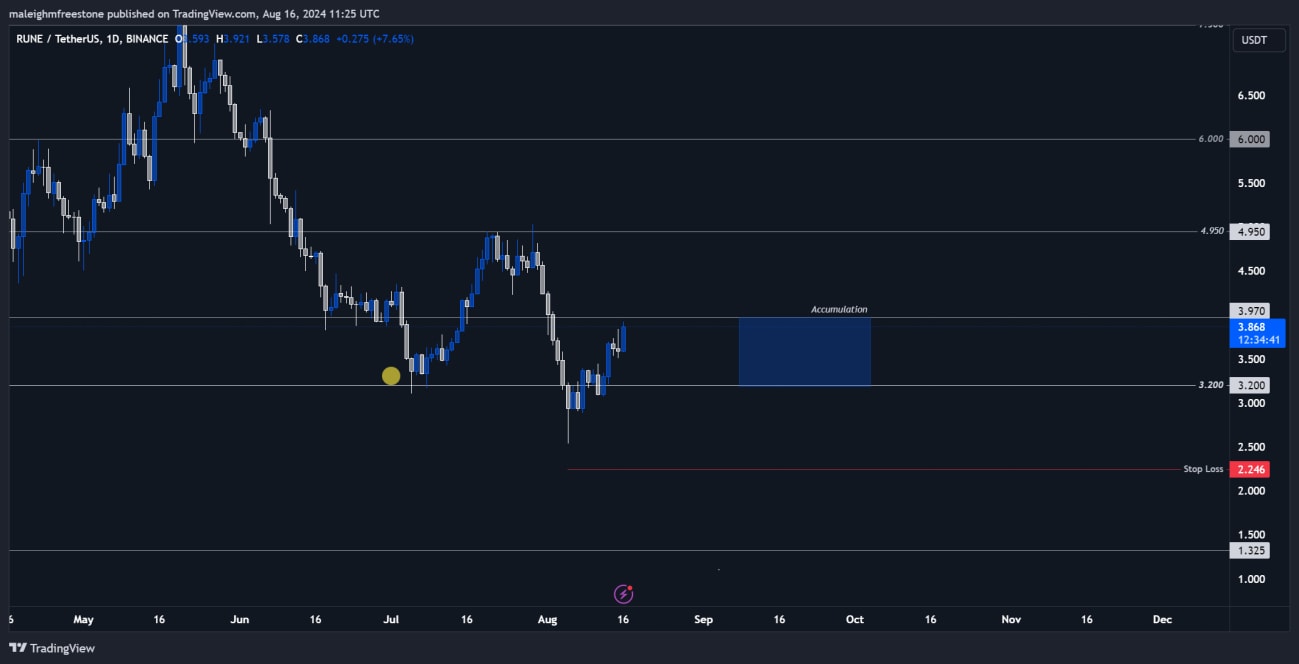
Cryptonary's take
Given the market mechanics, including the liquidation heat map, balanced open interest and funding, and low volume, this scenario suggests that we may see a continuation of the upward trend. Accumulating within the $3.2-$4.00 range appears to be a solid strategy, with the potential for significant gains if the market plays out as expected.Recommended from Cryptonary


PRO
Market Direction
11 min read
Mar 24, 2026

PRO
Market Updates
8 min read
Mar 23, 2026
PRO
Market Direction
13 min read
Mar 20, 2026
