Save 23% ($351) & Get a Free 1-1 Call with our Team ⏰ : 0d 2h 59m 44s

Yet, while it is difficult to predict where the market is headed with certainty, at Cryptonary, we are not in the dark about how best to position your portfolio for profit.
Today, we share our thoughts on where we believe the market is going based on important data.
What’s more? We share our analysis of 6 coins to provide you with actionable information on how to position for the best possible upside.
Are you ready to tame the bull?
Let’s get started.
TLDR 📃
- BTC is facing resistance after choppy price action. The upside may be limited in the near term.
- ETH broke out above a key level and looks poised for further upside. Resistance awaits at higher levels.
- SOL gained recently, but heavy overhead resistance looms large. The upside could be limited.
- LINK broke major resistance levels. Watch for bearish divergences if it continues rising.
- ARB breached a downtrend line, but resistance overhead may limit gains. The long-term outlook remains positive.
- BCH is approaching resistance after light volume gains. Watch for bearish RSI divergences for potential short opportunities.
Disclaimer: Not financial or investment advice. You are responsible for any capital-related decisions you make, and only you are accountable for the results. “One Glance” by Cryptonary sometimes uses the R:R trading tool to help you quickly understand our analysis. They are not signals, and they are not financial advice. Any capital-related decision you make is your responsibility and yours only.
Trading BTC | Bitcoin

Starting with the king of the space, there aren't too many changes from Monday's Watchlist in terms of price. But the data is always changing, let's assess these changes.
Technical Analysis
Again, looking at this on a very zoomed-in timeframe, we can see that BTC’s price came beneath the local horizontal line of $26,500, and we're now moving back up to that level to test the underside of that horizontal level.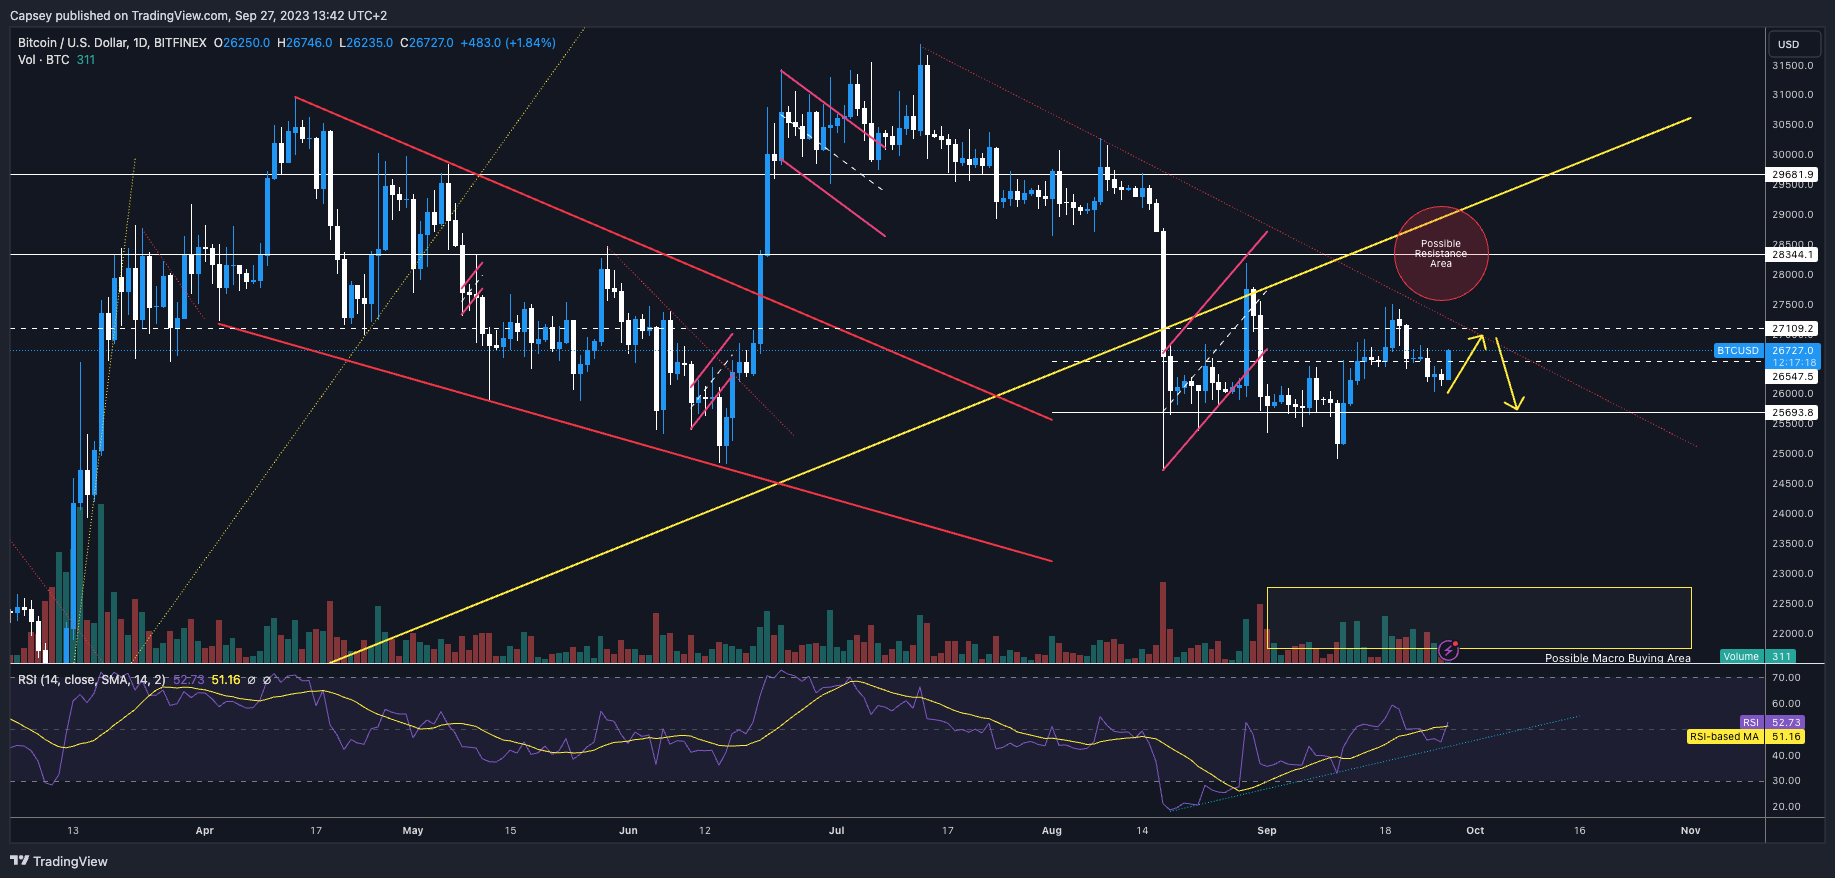
What's super interesting is that if we can get above $26,500, BTC will be eyeing the red downtrend line to try and break above that and get a breakout. Now, the $27,100 horizontal resistance is just above this level and has proven to be prior resistance; it suggests to us that this is the key level that needs to be broken in order to see a more significant upside.
RSI
There is not too much going on on the RSI other than the fact that it is trending up. But, no bullish or bearish divergences are currently at play or even close to forming.Funding rates
Funding rates are mostly negative, but there’s a real variation amongst the exchanges. Again, this shows real indecision. Additionally, yesterday's funding rates for BTC were mostly positive and around the 0.005% level; today, they're negative. This suggests to us that market participants continue to flip-flop on their positioning and lack any real confidence in the positions they're taking... hence they keep changing. This was a similar story on Monday, and since then, BTC’s price has chopped around in a tight range.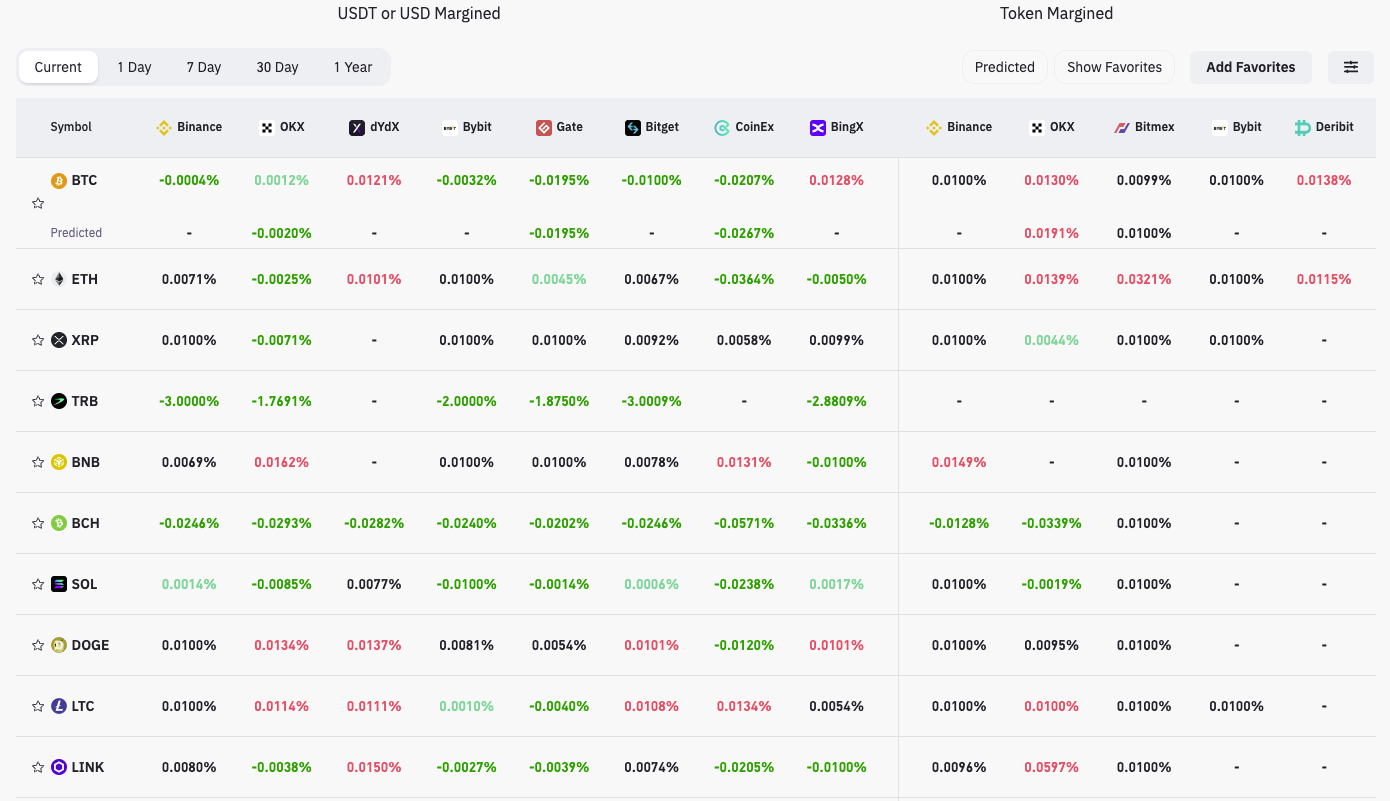
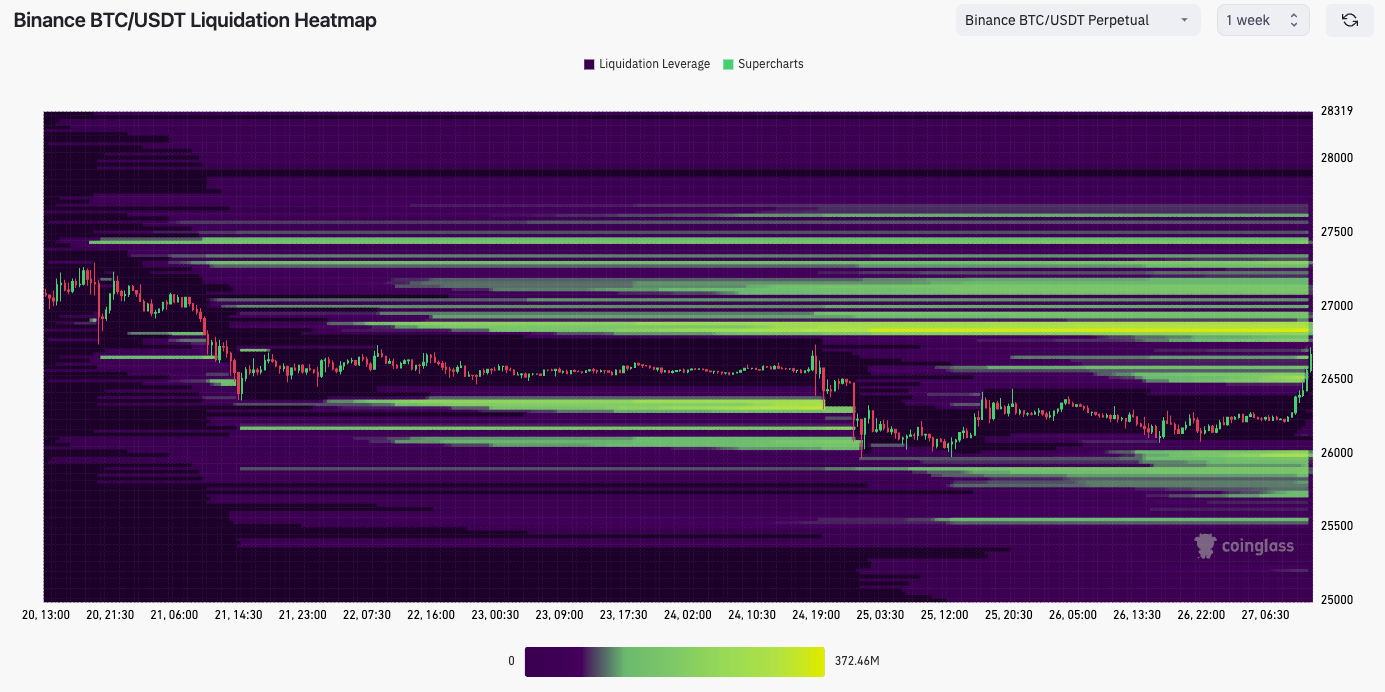
Liquidation levels
We've zoomed out a tad on this, the reason being that we think this constant chopping will likely come to an end soon, and we'll see a more volatile move. We, therefore, want to see the liquidation map on a zoomed-out view to identify wider levels - where could BTC’s price be squeezed to is the question?Looking at the liquidation map, many shorts would be liquidated around the $26,800 - $26,900 level. This could then drive the price up to $27,100 as shorts cover. However, above that, there isn't much.
Conclusion on trading BTC
We think BTC will go higher and get into the $27,100 level. But we feel this will act as a relatively decent resistance level, and in order to really surge higher, we'll need a large amount of buying volume to come in.With the $28,300 resistance level not far above $27,100, we can't see how big buyers would want to come in to push BTC’s price up just 3-4%, as $28,300 will likely be another significant resistance.
In short, we feel the price gets to $27,100 and is rejected from there in the short term.
Trading ETH | Ethereum
Is perhaps more interesting than BTC in that ETH is actively looking for a breakout and has already done some of the legwork to achieve this.
Technical analysis
The previous $1,552 horizontal support acted as support again. We've moved higher from that level and now breaching the horizontal level of $1,625. Alongside this, price has also broken out above the red downtrend line, so all positive so far. What's important is to see a good daily closure candle, i.e., Today's candle closing above the $1,640 area.What we then would want to see is some follow-through in volume coming and pushing ETH’s price above the more local resistance area of $1,660 (marked on the chart as the red dashed line).
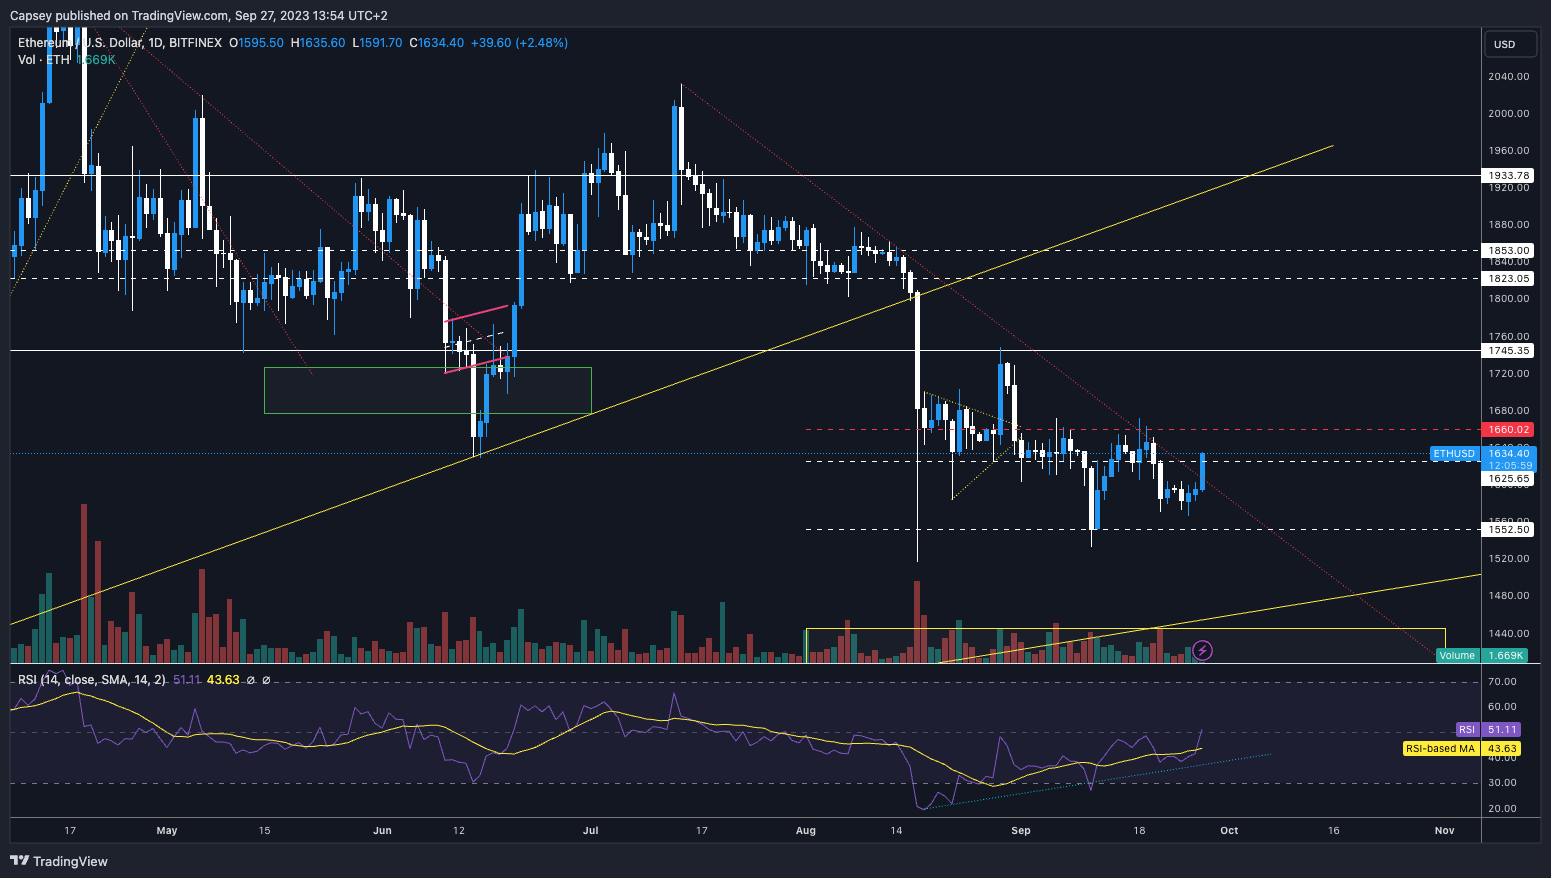
RSI
The RSI does provide some concern in that it's produced a new high without the price doing the same. This is a hidden bearish divergence, and this may limit ETH's upside in the very short term.Funding rates
ETH is more positive here in that it is being Longed (positive funding rates around the 0.007% area), and this may help ETH with getting some further upside.Conclusion on trading ETH
We think we will see ETH get to $1,660, which will be the decision point. We feel the $1,660 level may provide some short-term resistance to ETH, so we may see something like a move into $1,660, a reset back to $1,625 and then a move higher to potentially test $1,700.Trading SOL | Solana

SOL is a coin we really like for the long run, and we've had more positive price action over the past couple of weeks. What concerns us is the heaviness of the resistance just above us.
Technical Analysis
The $19.11 has acted as a local support area for SOL, so that's the first thing needing to be achieved/held if SOL wants to see more upside. There are some huge overhead resistances on the SOL chart, and from our experience, seeing these kinds of resistances, we wouldn't want to be Longing SOL into these.
We do think SOL can move higher as we feel BTC and ETH can move higher (so will lift the market, generally speaking). This may then take SOL into the $19.90 - $20.41 area, where we think the resistance will prove too strong, and SOL may reject it here.
So, there’s just not enough upside for us to want to take a Long position.
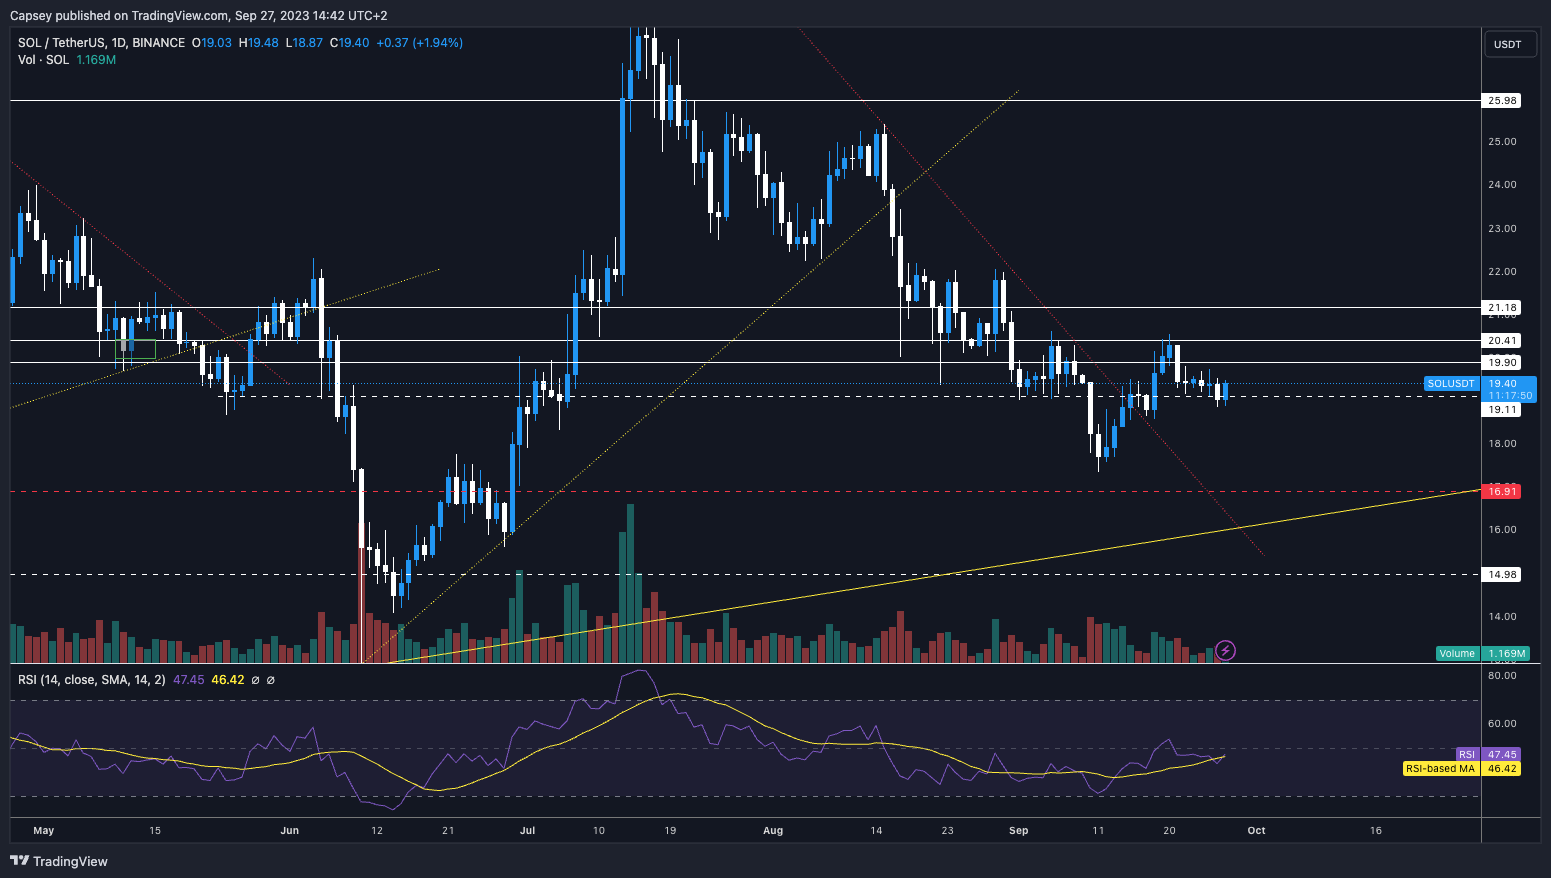
RSI
In neutral territory (at 47) and not printing any negative divergences, this would be somewhat positive for SOL. We are still not bullish either ways, just neutral.Funding rates
Again, it is just phenomenally mixed, depending on what exchange you check. On most exchanges, the funding is positive, so participants in the majority are betting on further upside on SOL.Conclusion on trading SOL
Our general feeling from weighing up the above, and also now having weighed up BTC and ETH and having that context behind us, is that we think SOL can go higher and test into the $19.90 to $20.41 area.However, we feel that this will be too strong a resistance level, and SOL may reject from this level.
Trading LINK | Chainlink
Chainlink has had some positive fundamental catalysts which have driven LINK higher here.
Technical analysis
It is fantastic to be able to break out above the $6.80 - $6.99 resistance range and now move more into a price discovery phase until it hits (if it gets to) the next horizontal resistance level at $8.07. We are not Longing this token at the current price and are becoming more cautious about it.See below. 👇
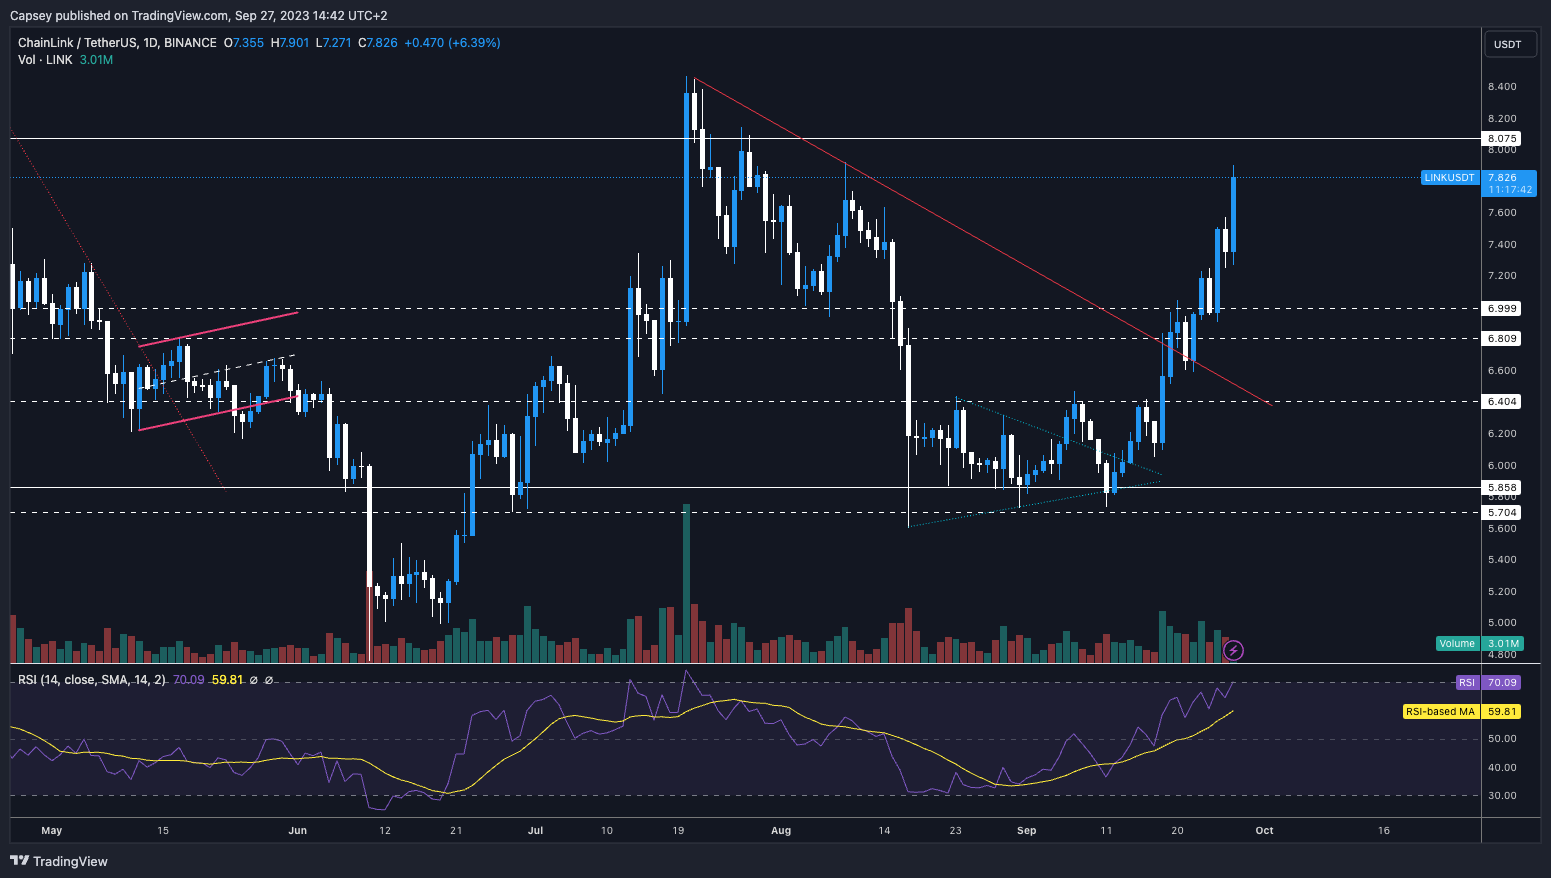
RSI
Looking at the RSI, we're very close to overbought territory (at 68 on the RSI). From our experience, we will start putting in some highs in price, and we then think we'll get lower highs on the RSI, which will form bearish divergences.So, we think there’s further upside ahead, but maybe into the $8.07 area and then possibly we get the formation of bearish divergences.
Funding rates
Very mixed, as is the whole market, really. This is probably positive for LINK, though, in terms of getting further upside.Conclusion on trading LINK
LINK has moved up really nicely, having broken above some key horizontal resistances. Even though we believe there's another 5-7% upside in this, we would begin exercising caution as the RSI moves into overbought territory (already hitting over-bought on other RSI timeframes).We would be eyeing up the low $8s for some possible entries for Shorts. Let's re-assess once/if LINK’s price gets there. If the price does get there, we expect to start printing bearish divergences, which might be the catalyst that the Shorts need.
Trading ARB | Arbitrum

So far, we've got ARB relatively spot on. We called on Monday that even though we feel ARB heads lower in the mid-term, in the very short-term, we could see ARB head higher and break out of its local downtrend line and move into testing the horizontal resistance at $0.86. Up 5% since the call on Monday.
Technical analysis
So far, the above has played out. We're now seeing ARB attempt a breakout of the local downtrend line. We're now 2-3% away from touching the horizontal resistance at $0.86.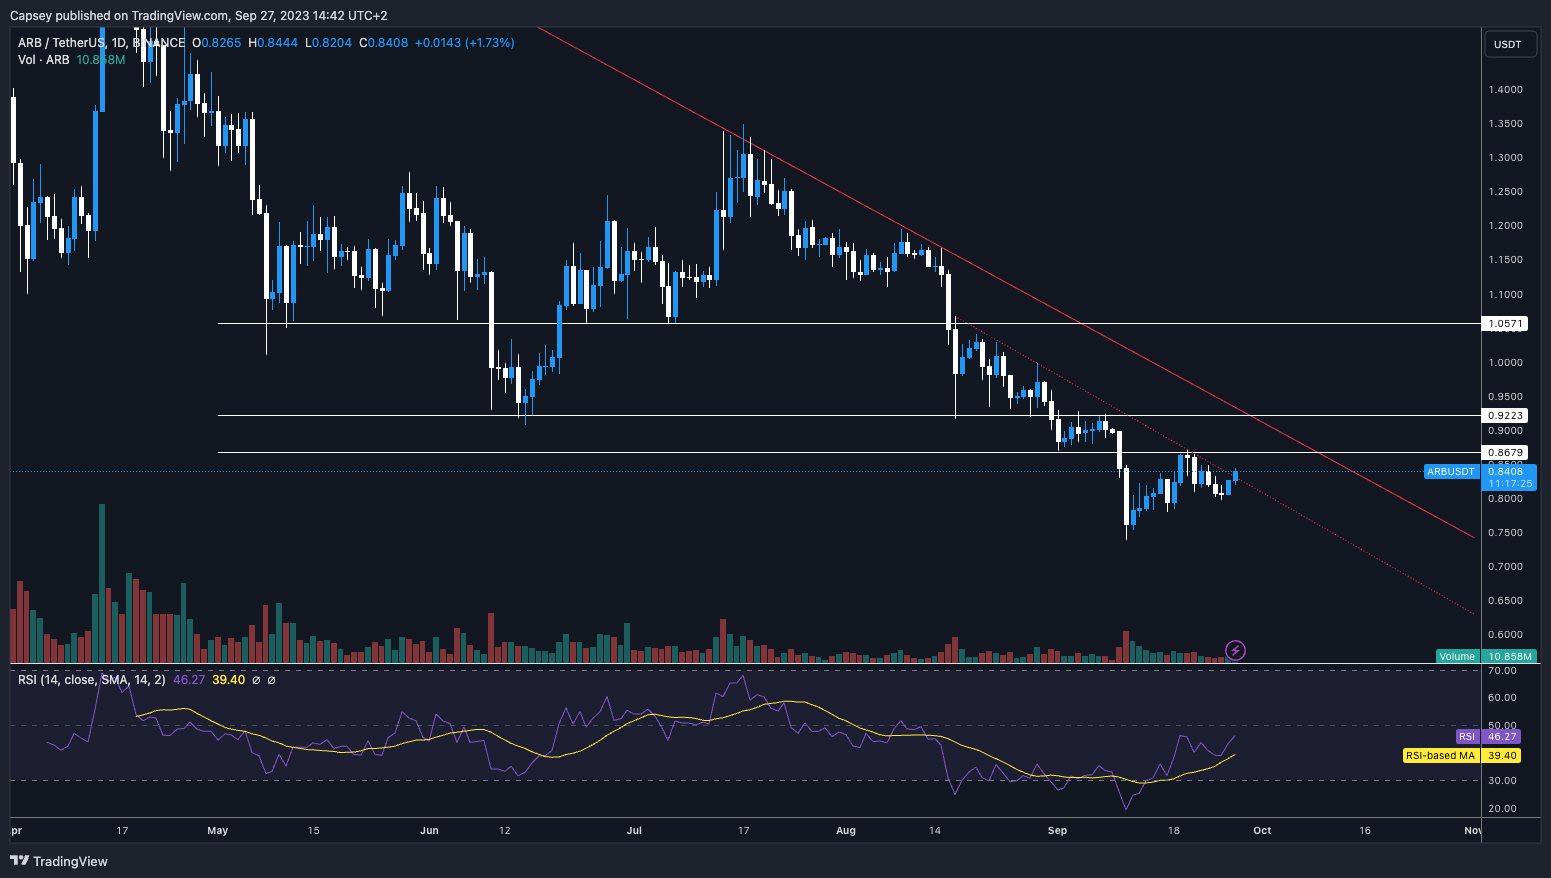
RSI
The RSI is our concern. We're already seeing the RSI produce a new local high (a higher high on the oscillator and a lower high in price) - this is a hidden bearish divergence, and we've not even got up to the $0.86 horizontal resistance level yet.Conclusion on trading ARB
With the RSI already printing a hidden bearish divergence on the daily timeframe and the overhead horizontal resistances at $0.86 and $0.92 above us, we think it'll be very difficult for ARB to get past this level (particularly $0.92) soon.Long-term, yep, a fantastic play, but right now, we think the resistance may prove too heavy. If we get to $0.92 (which we don't even have huge confidence that we will), we may actively look for opportunities to Short it.
Trading BCH | Bitcoin Cash
Right now, we don't think the opportunity is good, but we are keeping a close eye on BCH for a Short at a later date.Technical analysis
BCH’s price is currently breaching up into the horizontal resistance of $231. There is a lighter resistance overhead at $250 and a more major one in the range of $259 to $270.We've held a local uptrend over the past few weeks and pushed higher on relatively light volume,...... usually not good for sustaining the moves.
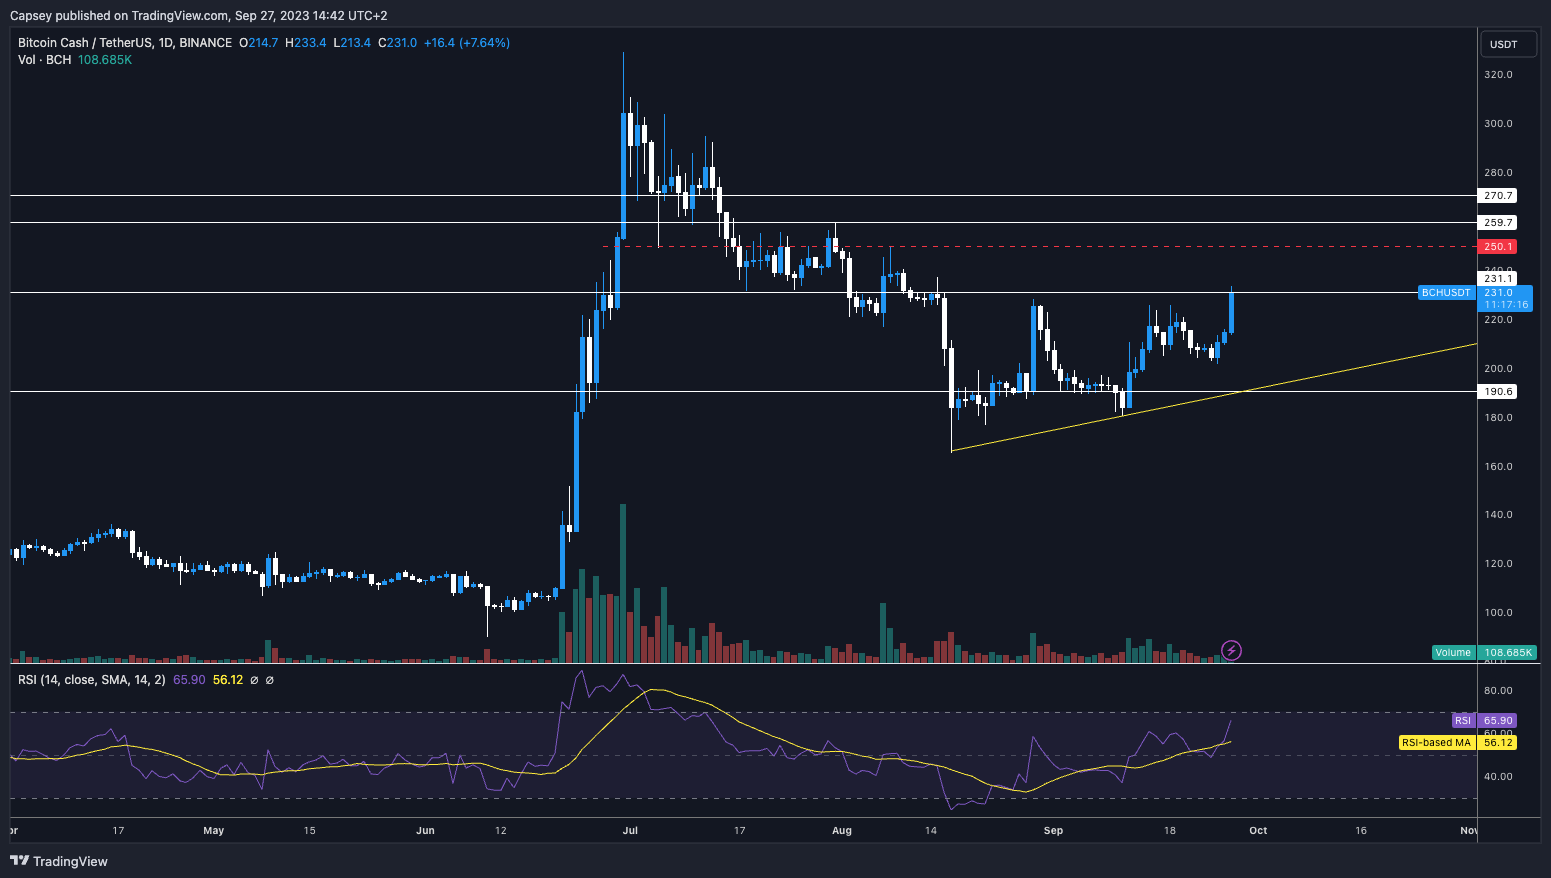
RSI
The RSI is key here in terms of formulating a trade. We know there are resistances overhead and that this move has happened on light volume, so these are components that can aid a Short. But, the RSI. We're at 66, so close to overbought and on the smaller timeframes, we're already well into overbought territory (@84 on the 4hr timeframe). What I'd like to see is BCH shove higher again here if BTC can get to, say, $27,100 and drive the rest of the market higher.I think this kind of move would push BCH's daily RSI into over-bought territory, while the smaller timeframes would likely be printing bearish divergences. Prime setup for a Short, particularly if BCH’s price is moving into the $250 to $270 area.
Conclusion on trading BCH
We are watching this closely, even though we are not taking action now. If we get a move up to $250, we will look for the daily RSI to be well into overbought territory and for the smaller timeframes to have created bearish divergences on the RSI.We will then assess BCH’s price and likely look for Shorts between $150 and $170. This will involve us layering orders to achieve a good average entry price - it's hard to know where the exact top may be.
Cryptonary’s take 🧠
In our trading watchlist today, we explored potential trading opportunities by reviewing the price action, indicators, and market positioning for BTC, ETH, SOL, LINK, ARB, and BCH.While our analysis is not a crystal ball, it provides valuable insights to get you started on formulating your thesis on the market and placing trades based on your convictions.
The bottom line is that there are some nice opportunities out there, with some particularly good ones looking like they're beginning to form.
Let's see how BTC does, as this could push the market higher if it can get to the $27,100 level. The feeling is that that will be the main area of resistance, and we may struggle to breach above that level.
Let's see what we get.
As always, thanks for reading.🙏
Cryptonary out!
Recommended from Cryptonary


