Save 23% ($351) & Get a Free 1-1 Call with our Team ⏰ : 0d 2h 59m 44s
Disclaimer: Not financial nor investment advice. Any capital-related decisions you make are your full responsibility and yours only.
Let's recap November and look at what the market is communicating. Starting with the indexes:Total Market Cap
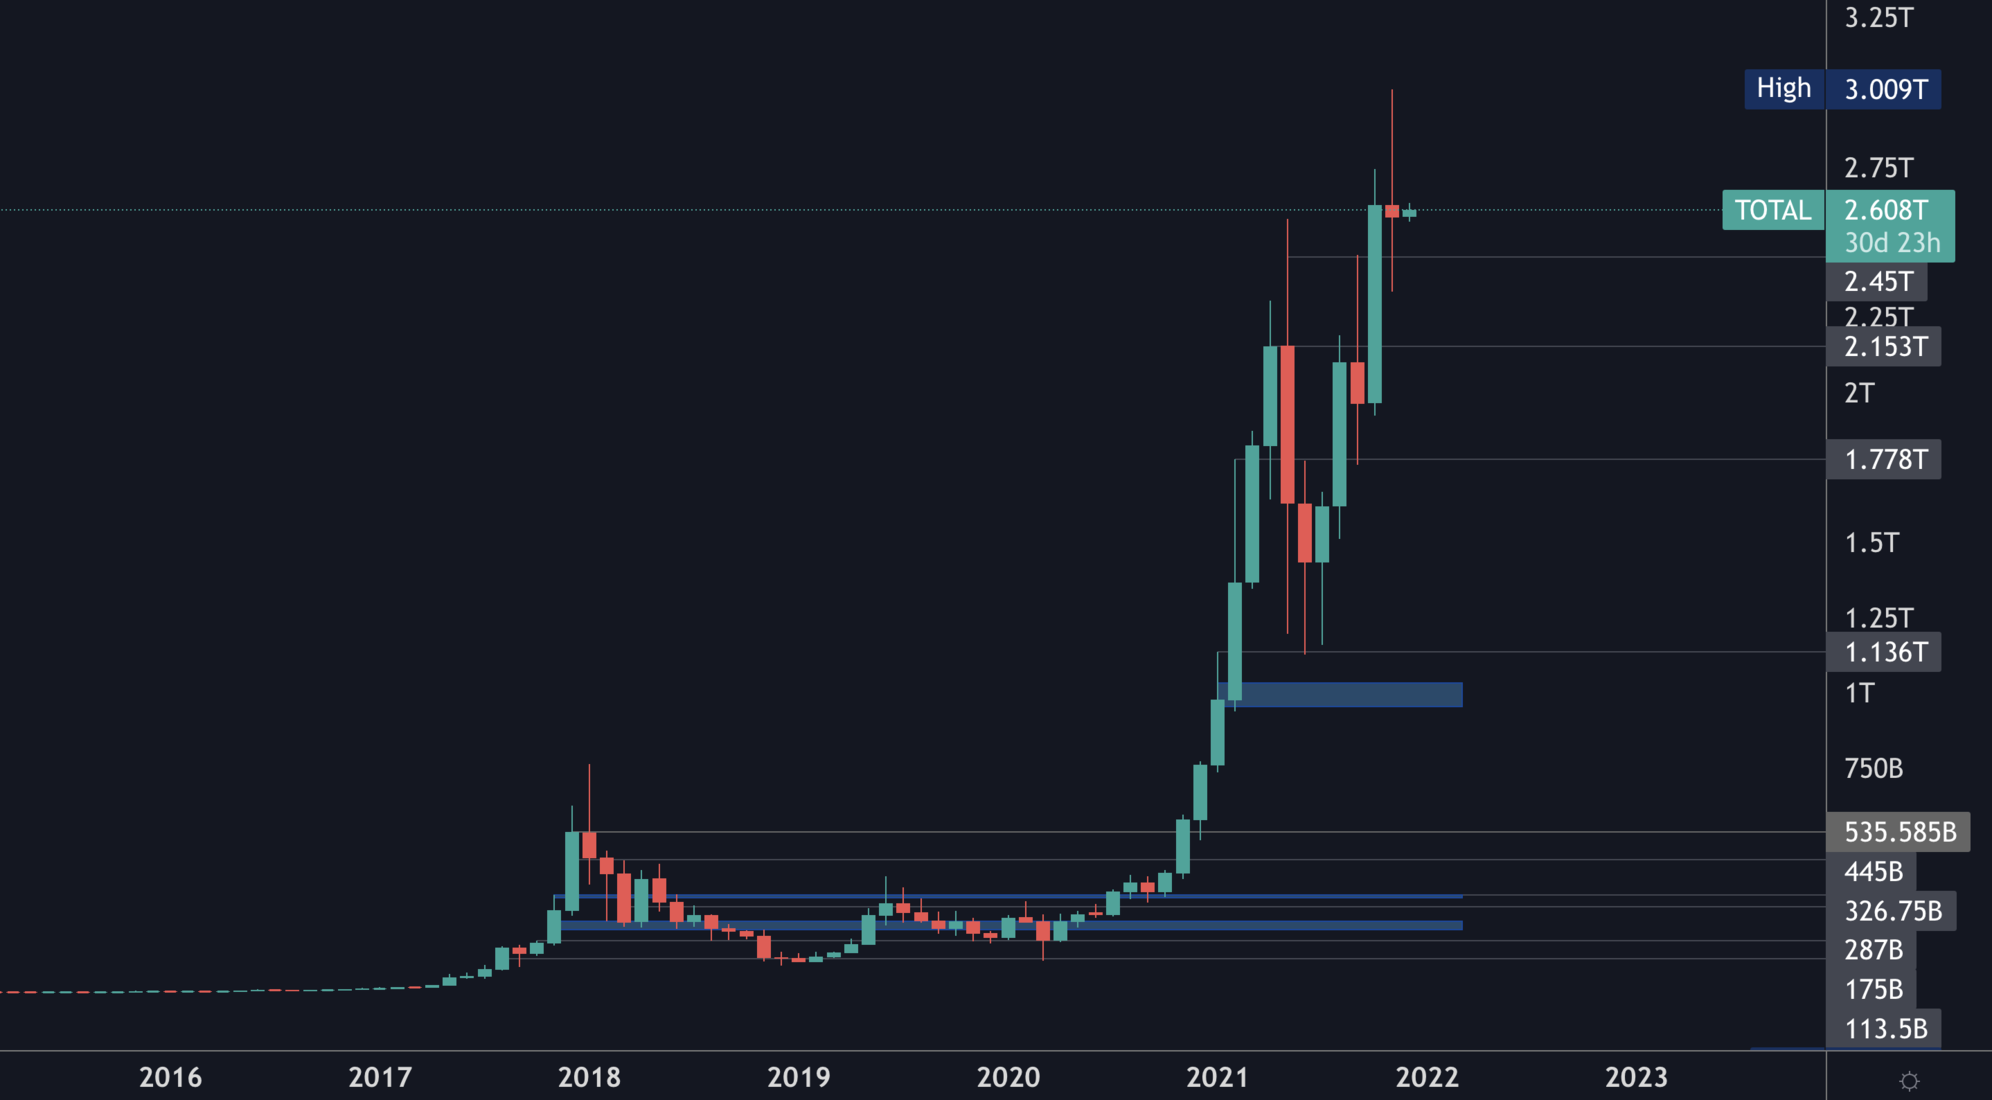
The Total MCap broke through $2.5T in October, then last month we saw two peaks (to the upside and downside) both of which were suppressed. This communicates that the market believes this is roughly a fair valuation for the market as of today.
The market structure remains bullish as it still consists of higher highs and higher lows which maintains a $5T target valuation for the coming months.
Altcoins' Market Cap
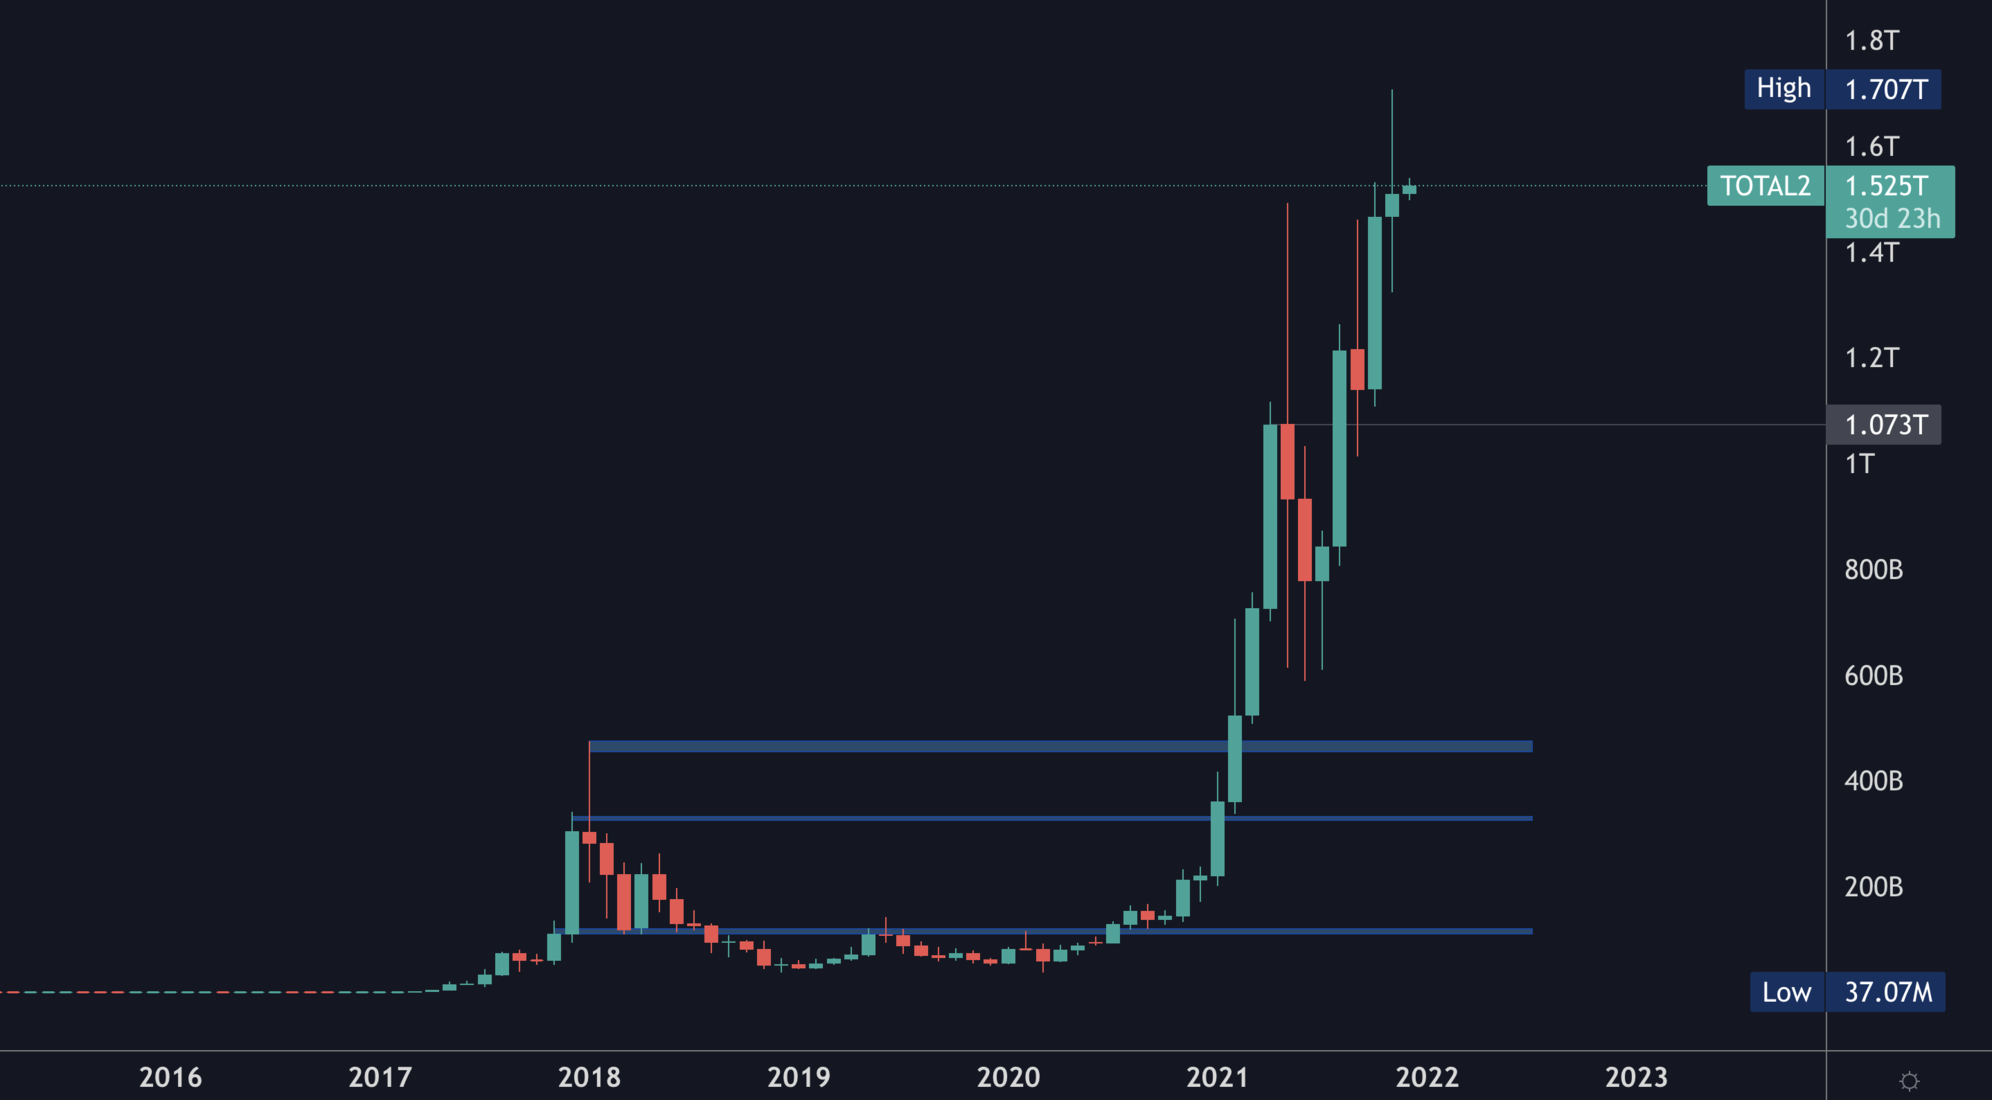
The same image is shared with the Alts MCap. The only difference is that the highest monthly closure has just been registered.
Now let's dive into each asset's chart:
Bitcoin
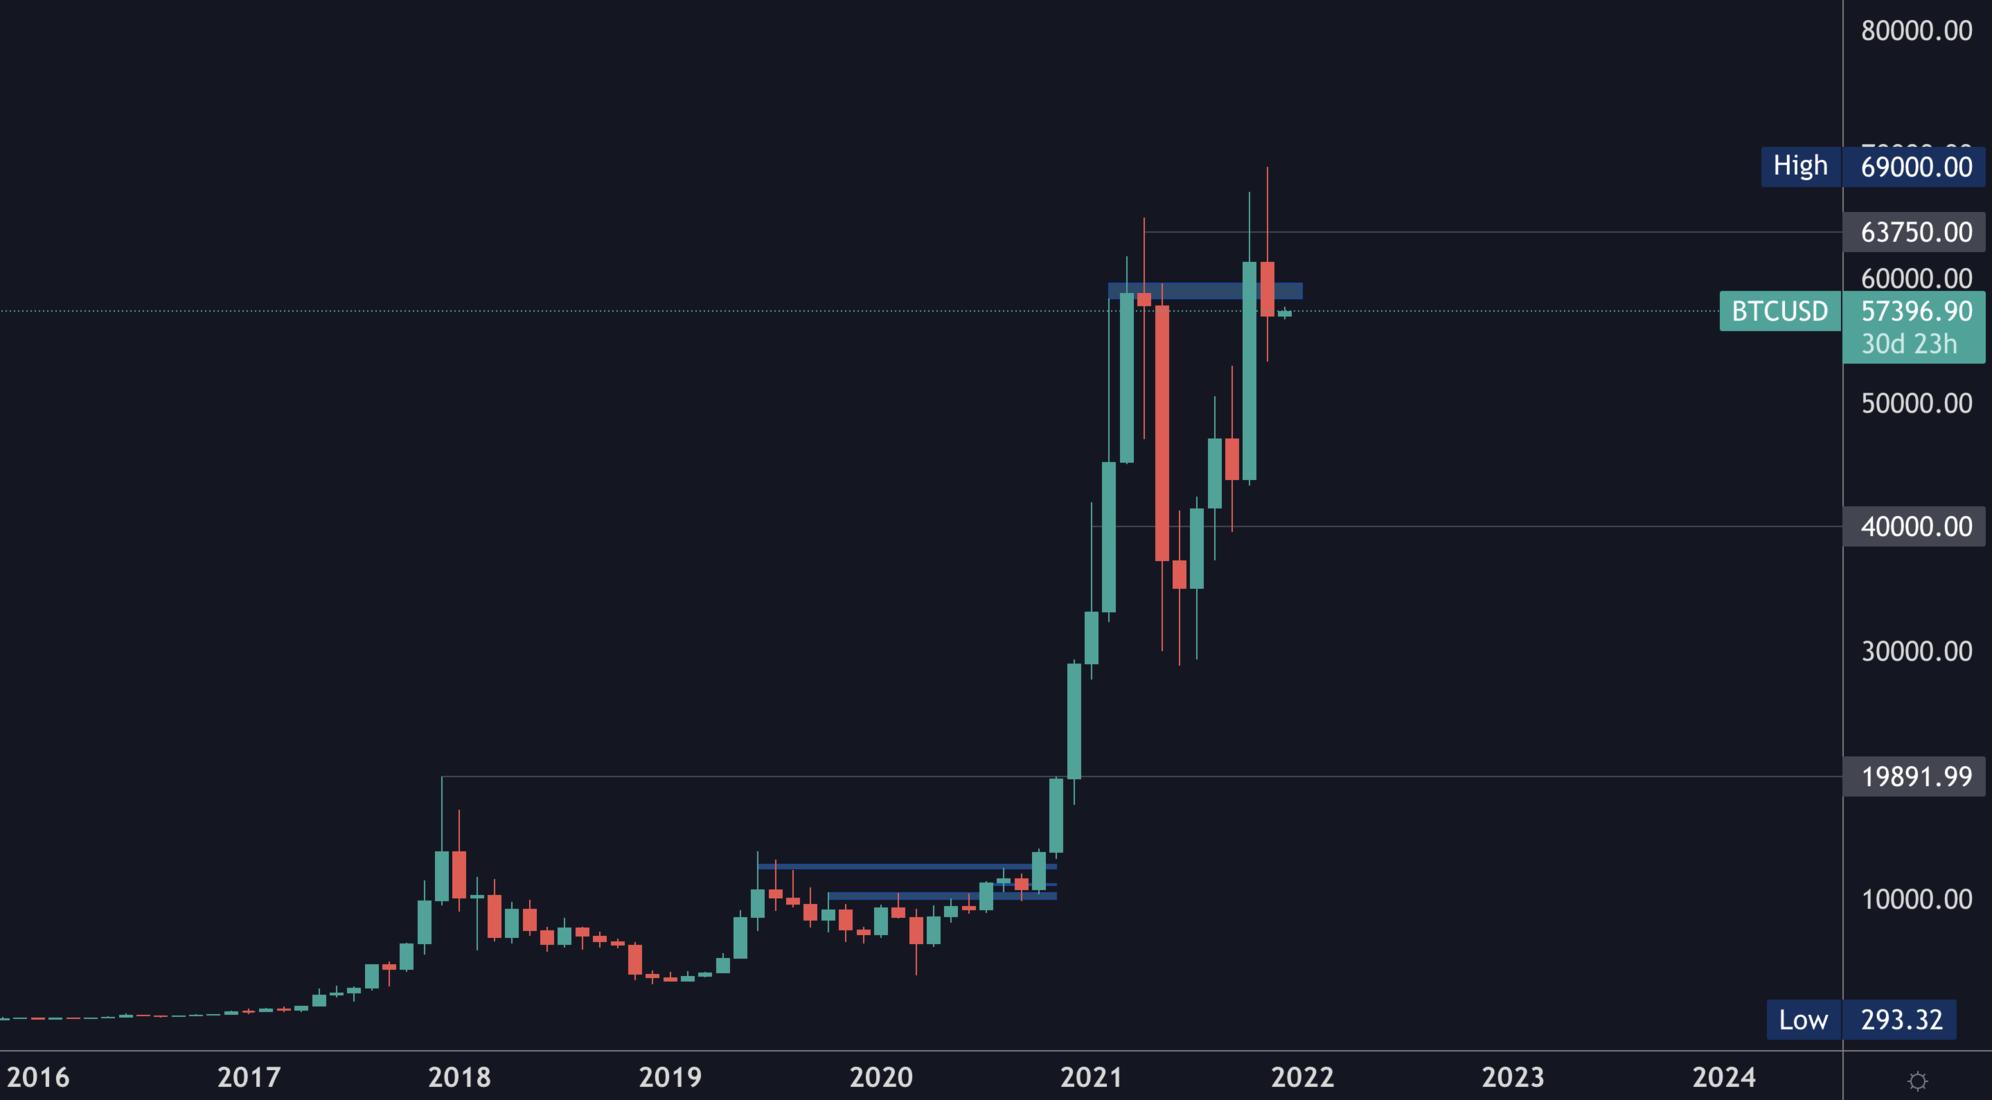
Bitcoin invalidated the breakout from $60,000 with this closure. While still very close to ATHs, this is a point of concern arising from BTC only which may end up giving further room for Alts to rally as we'll see that their charts look relatively bullish.
$60,000 is a very important level on all timeframes: daily, weekly and monthly. To invalidate the potential downside here, that level must be reclaimed.
Ether
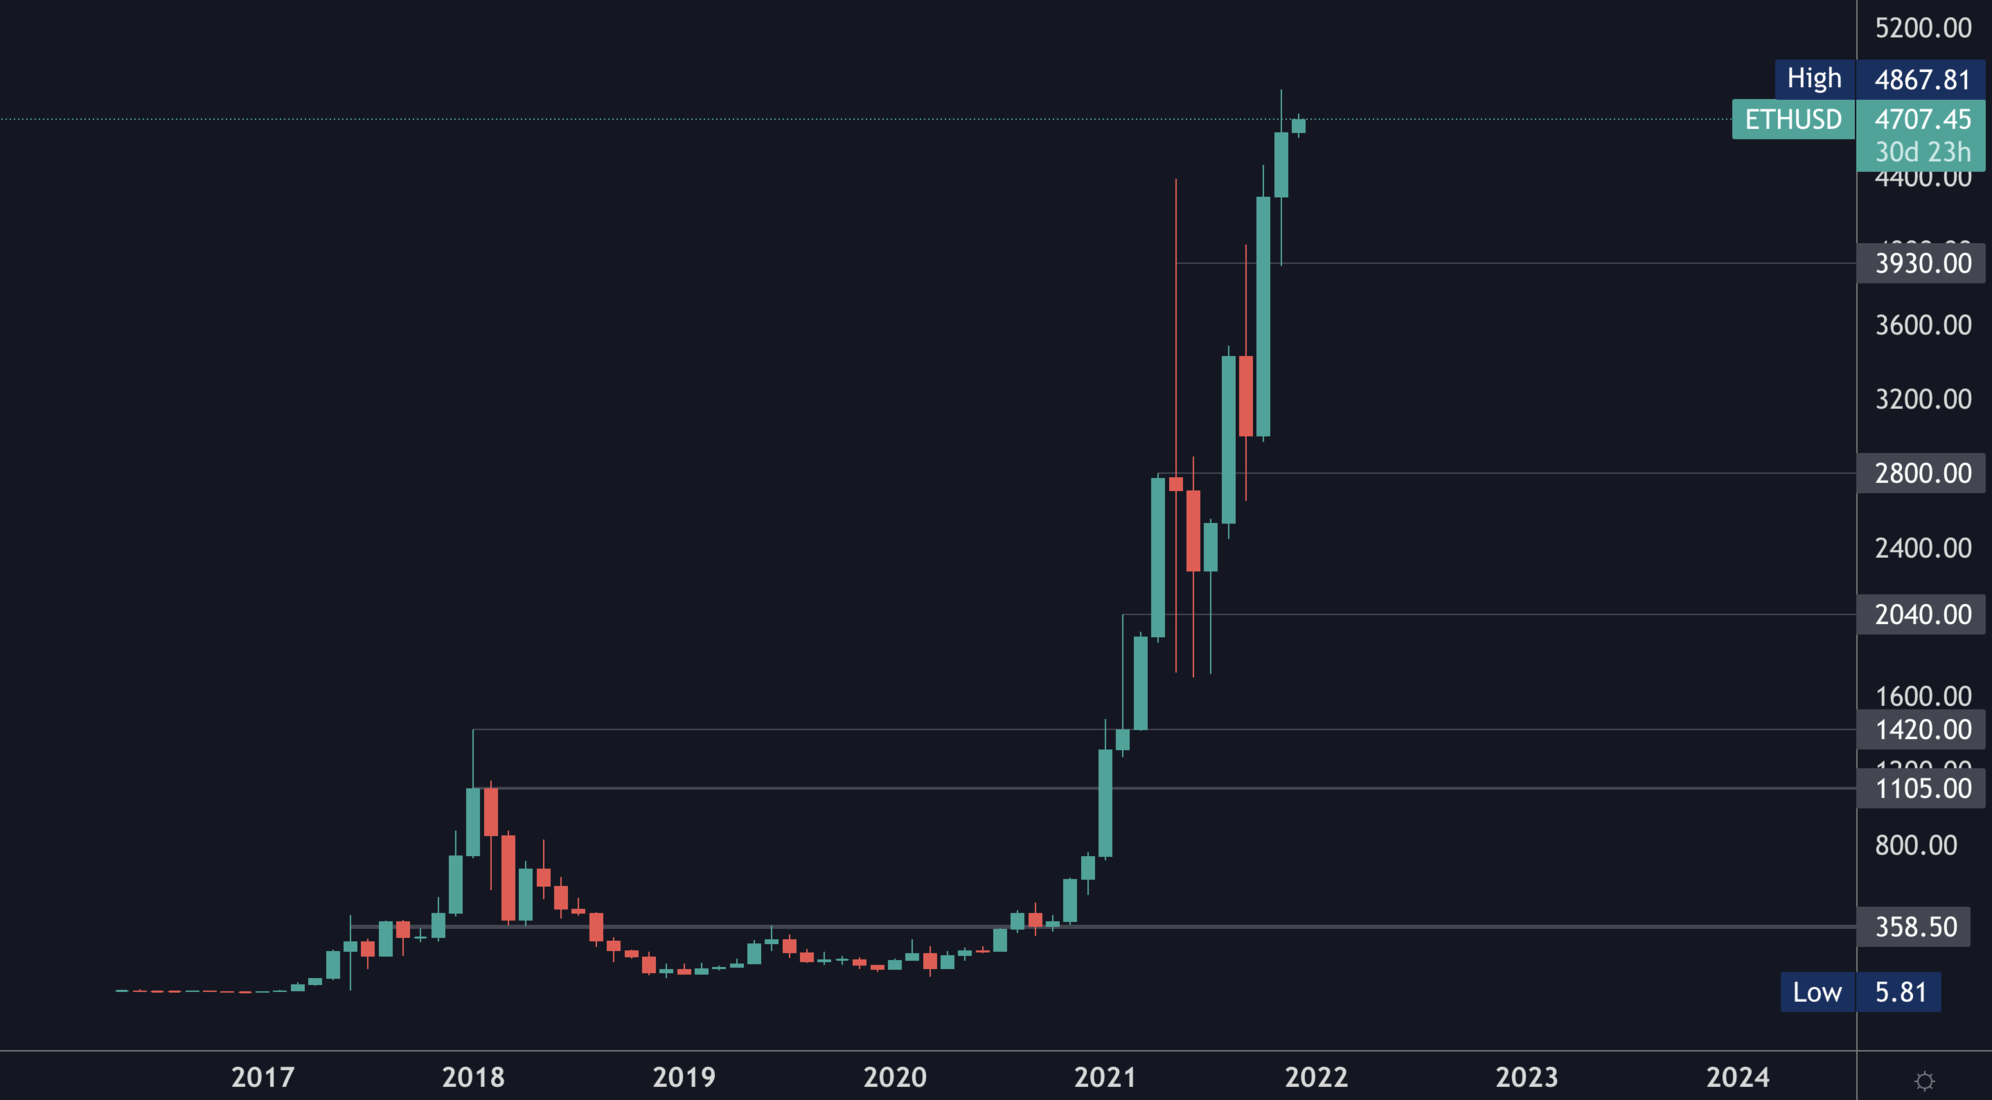
ETH has registered its high monthly closure ever while entering into subtle price discovery. The reason we subtle is because so many people seem to be dismissive of the price discovery from what we're seeing on socials.
The strength on ETH's bid persists.
ETH/BTC
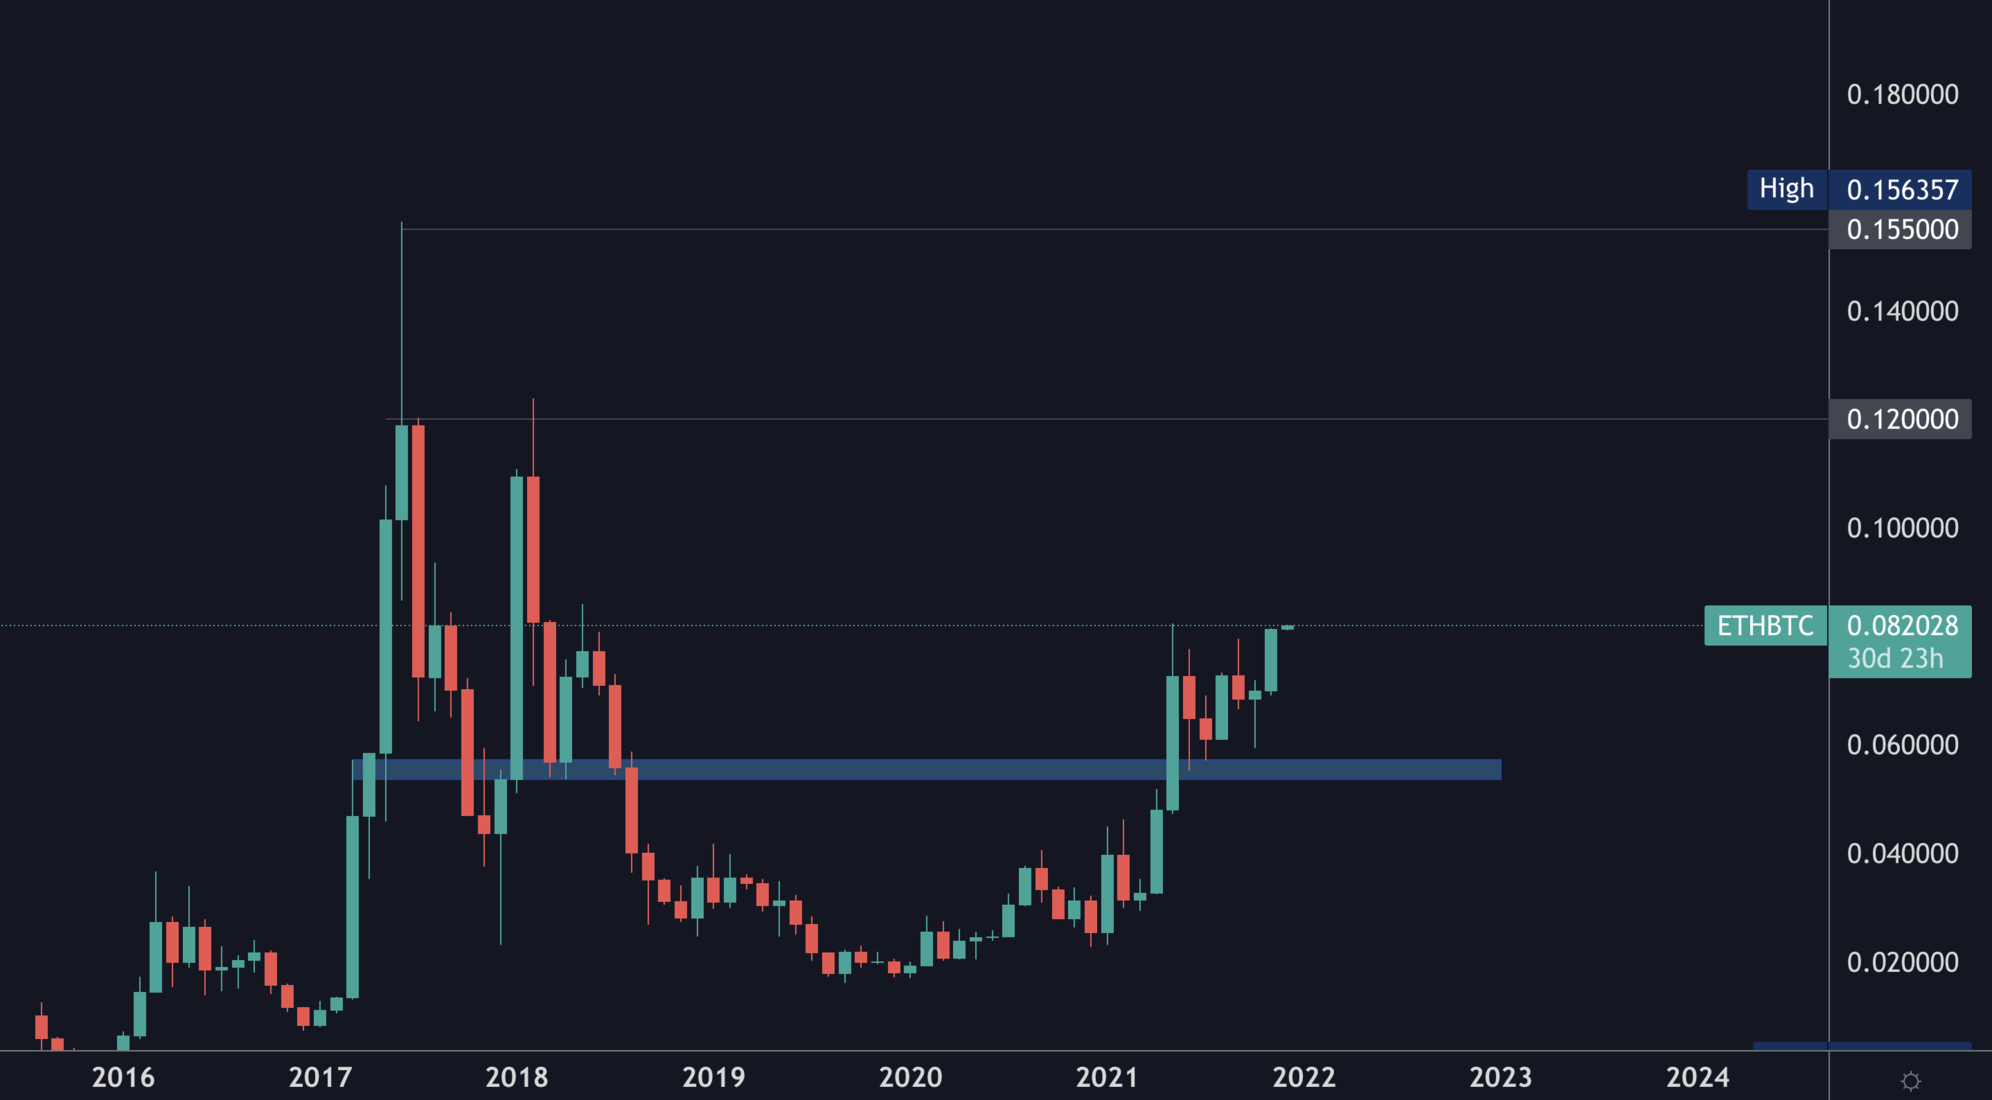
ETH making a high on its USD pairing is one thing. ETH registering the highest monthly closure since 2018 against BTC is another.
The bearish market structure on the ETH/BTC chart has been replaced with a bullish one. This tells us that in the coming months, we're likely to see a 0.12BTC ETH.
The "flippening" happens at 0.16.
DOT
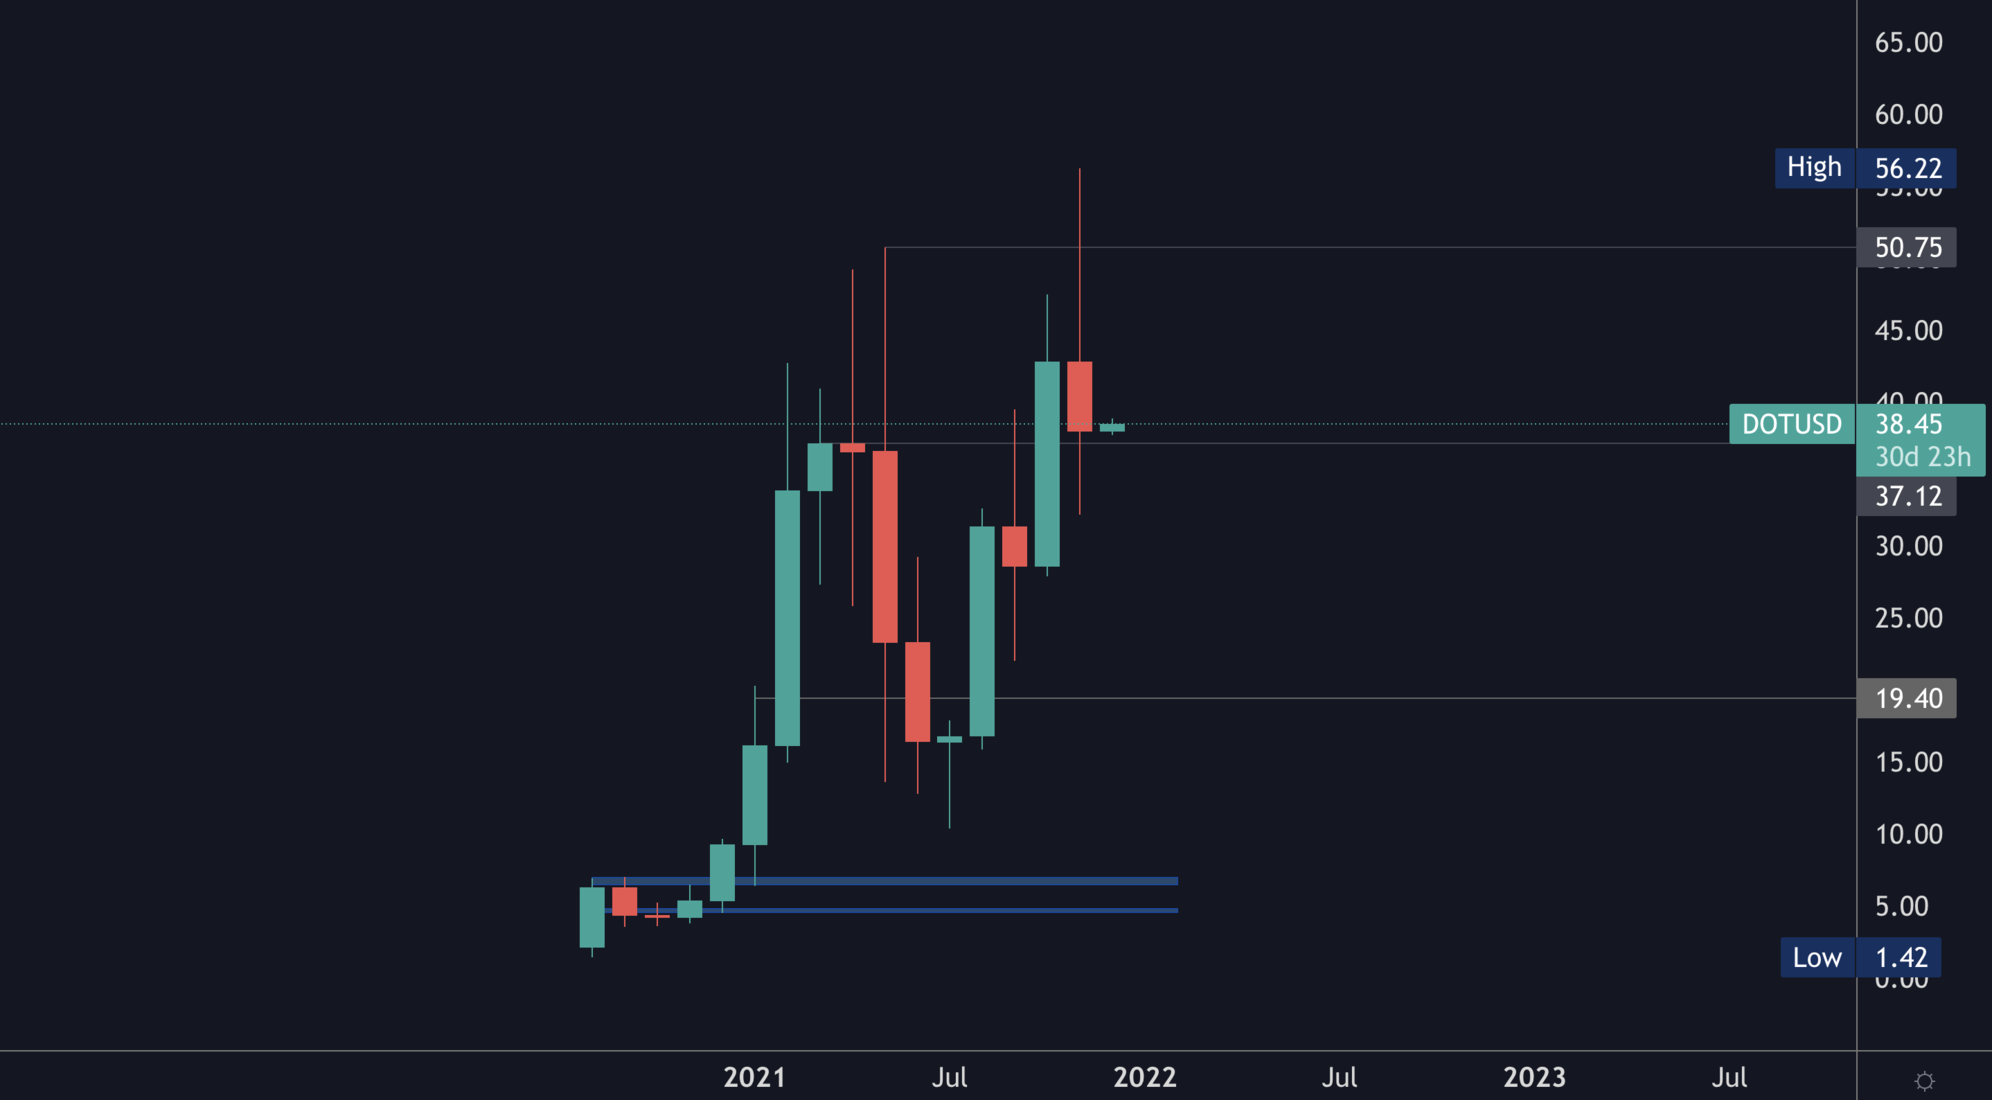
November was a bitter sweet month for DOT. While we saw parachain auctions go live alongside a push into new ATHs above $50, it was then met with downside induced from BTC weakness.
Nonetheless, if we look at the structure here. We can see a breakout into new highs (in terms of candle closures) in October and a retest of the previous highest closures set in early 2021 just now. To summarise, it is a bullish structure.
SNX
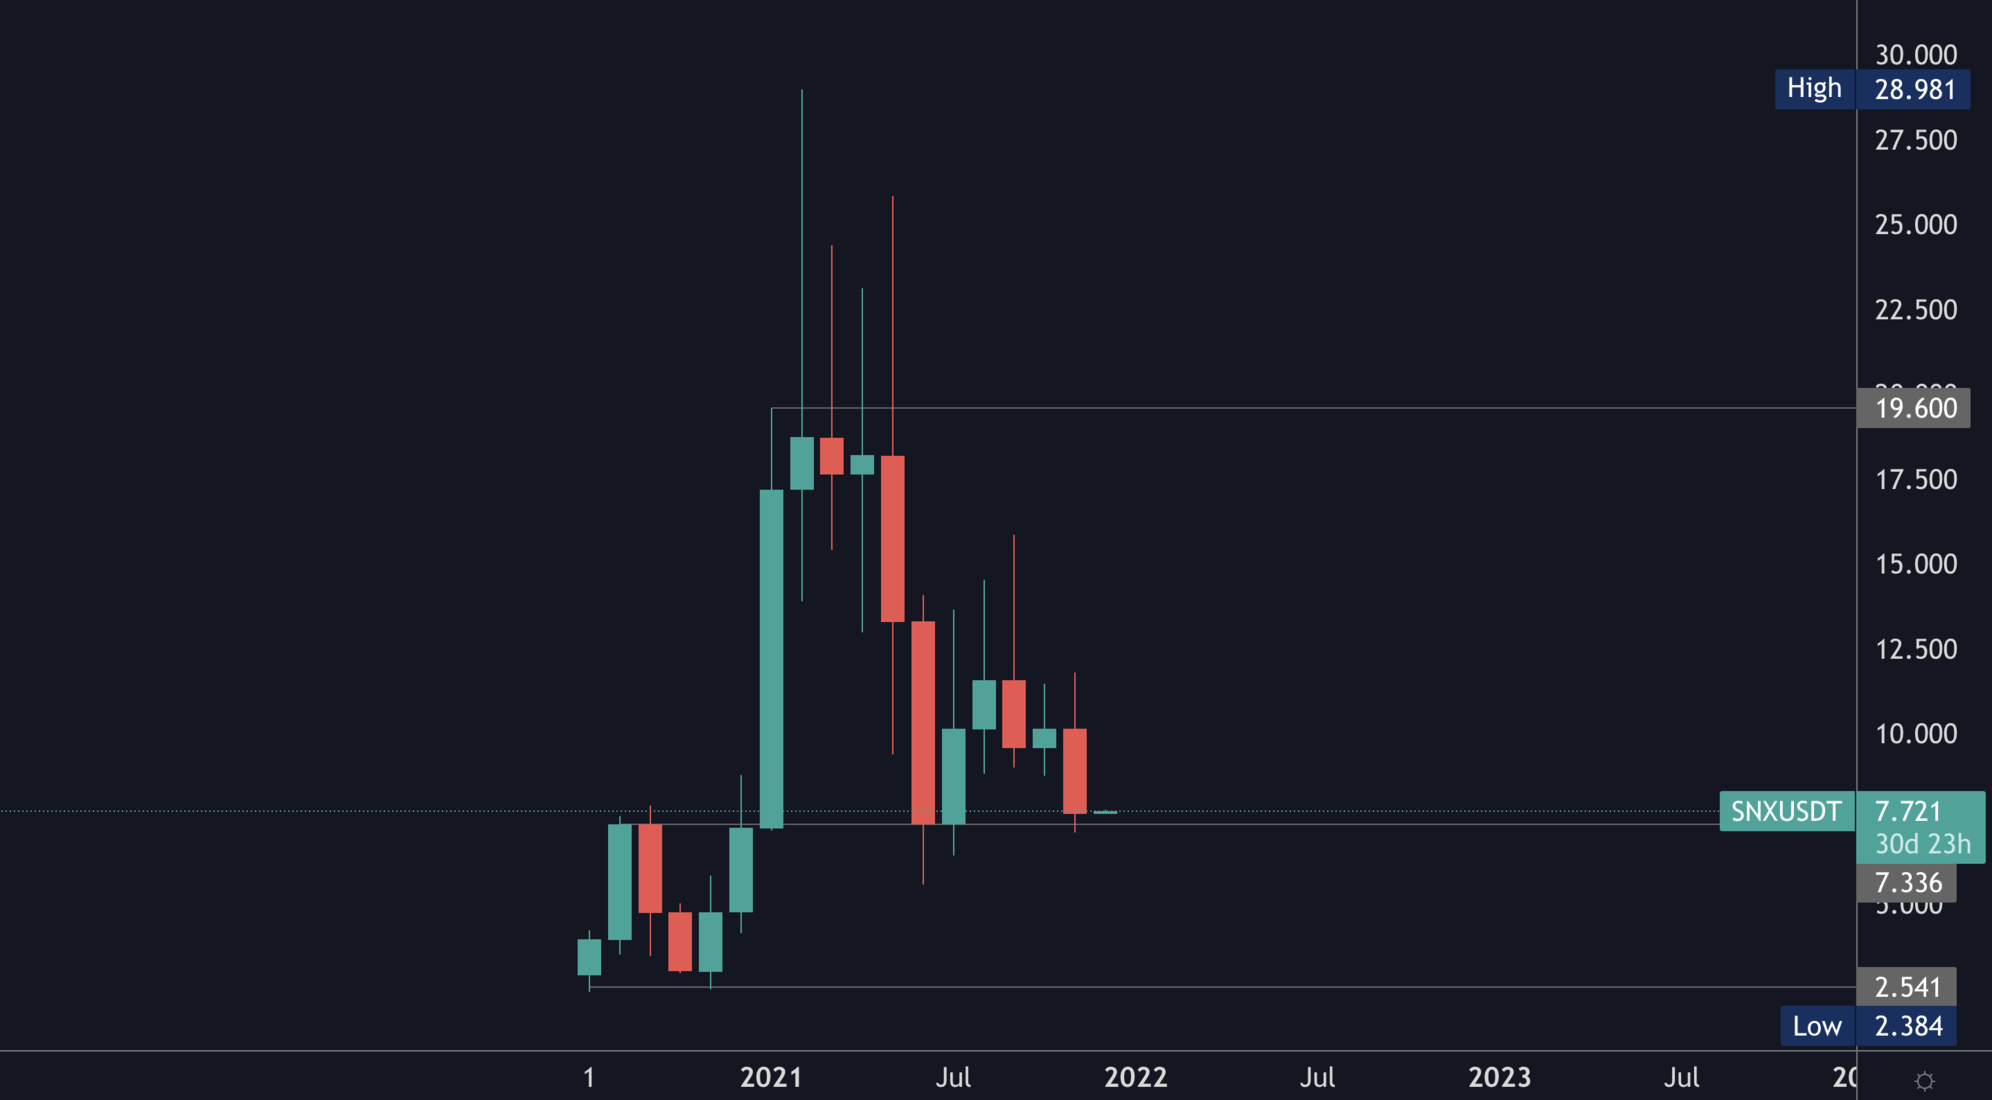
SNX feels like it is in an endless range.
On a serious note, the monthly chart shows better clarity than even the weekly offers. SNX is practically in a range between $7.50 and $19.60. Price at the moment is at support which gives the conclusion that $19.60 would be next in the upcoming months.
This is the second test of $7.50 however and we all know support weakens the more it is tested. To invalidate this theory, SNX would need to close a monthly candle above $12 in the coming few months.
RUNE
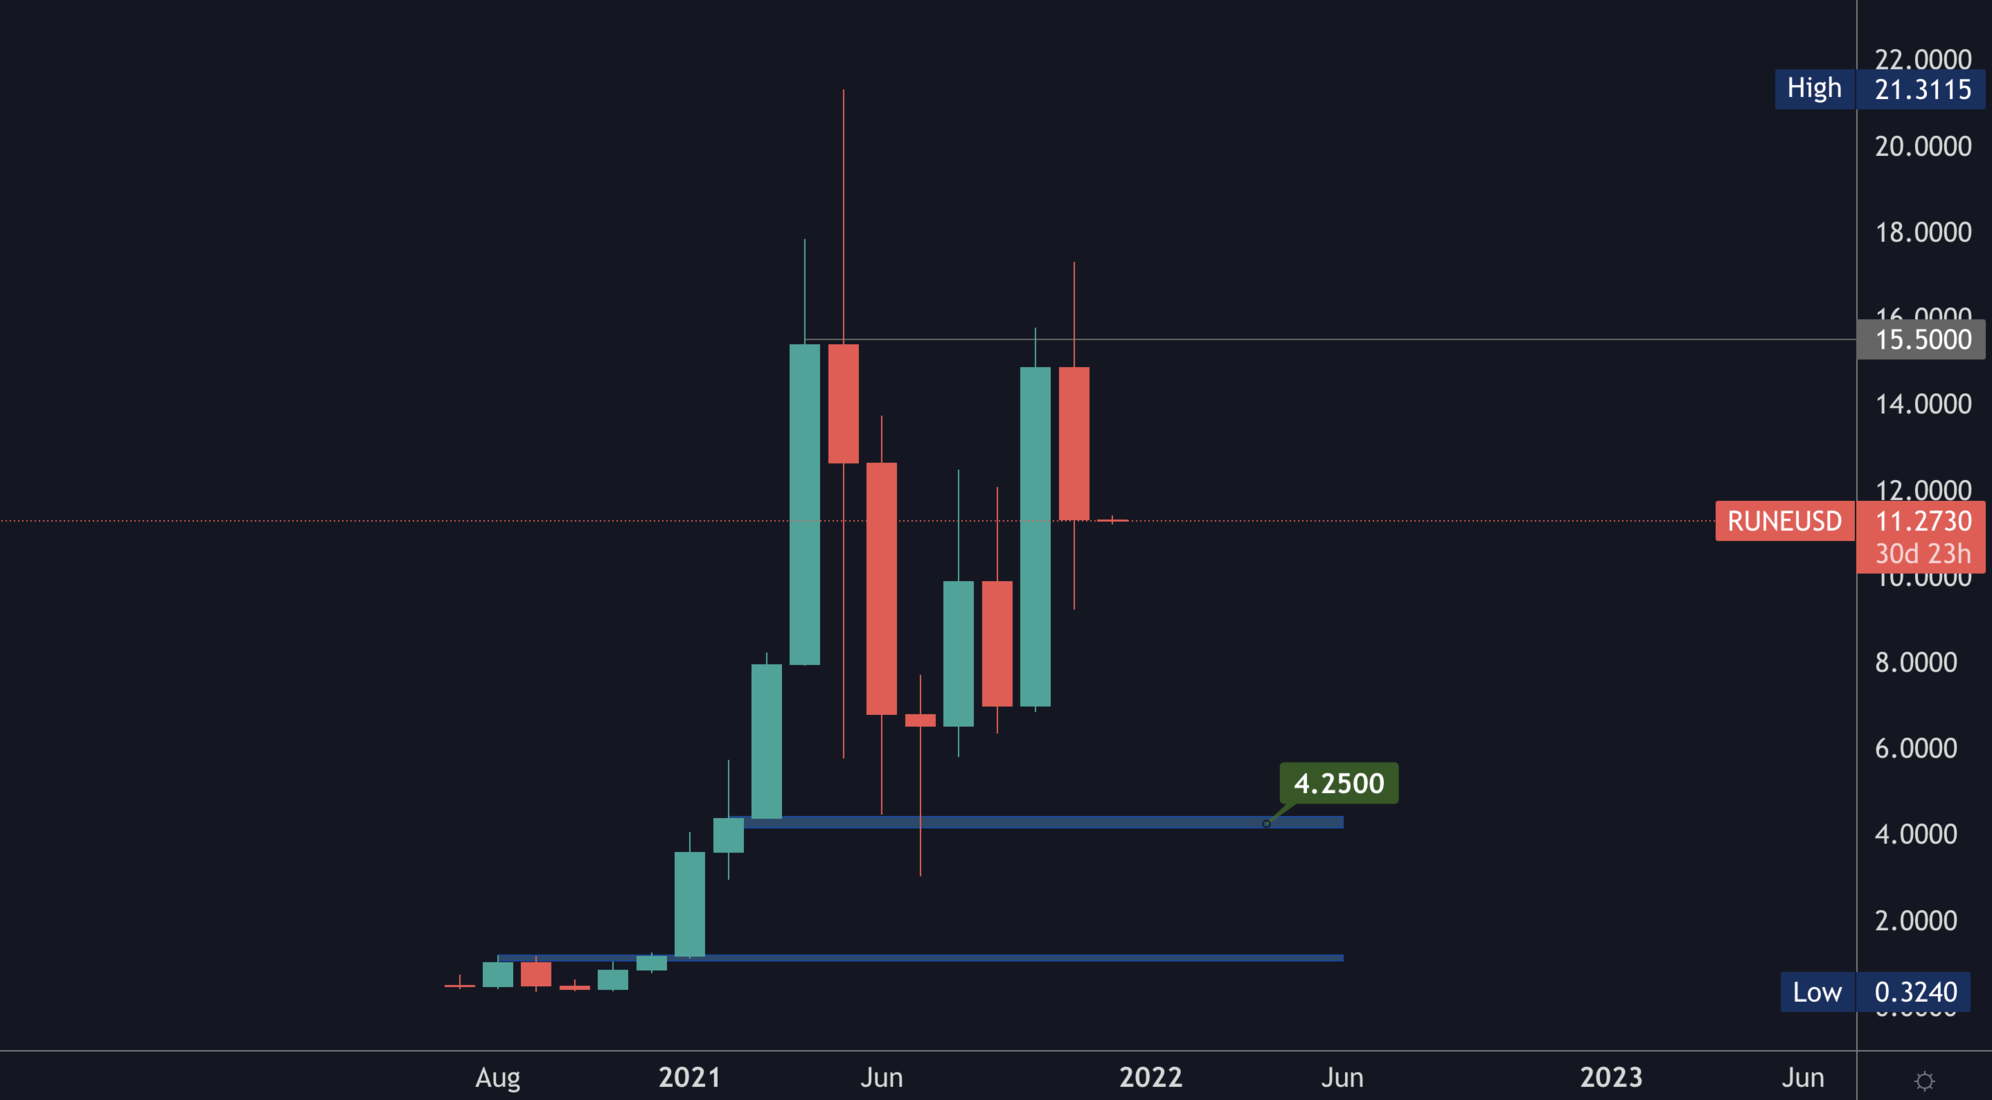
Basically, RUNE closed May at $15.50, tested $4.25, found resistance at $10, flipped $10, tested $15.50 as resistance and now retested $10 for support.
The market structure has been fixed, nonetheless what opens the door to price discovery will be a monthly closure above $15.50.
SOL
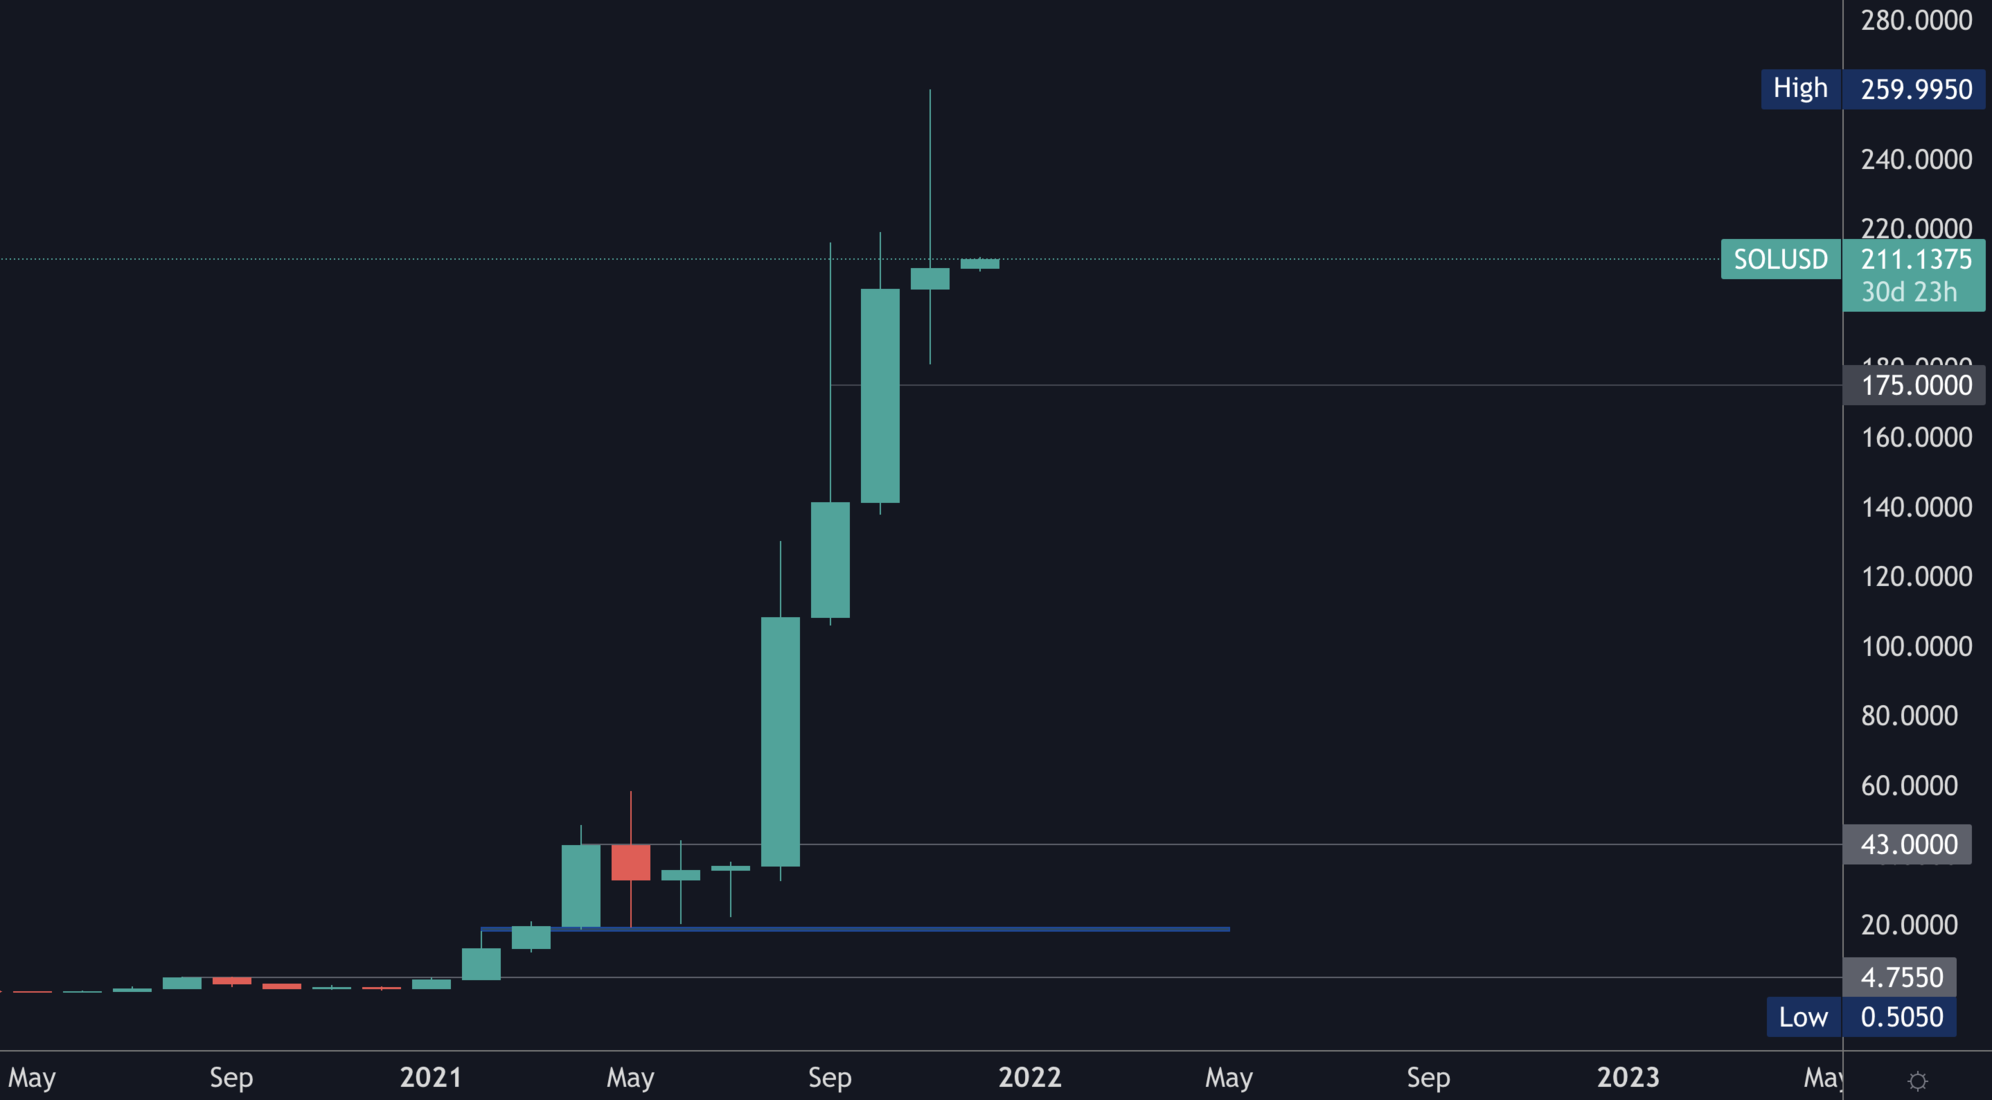
The bid weakened in November compared to Aug/Sept/Oct. Resistance was found at $250 but to be frank the monthly chart offers little information given the fact that consolidation has occurred yet. The daily and weekly timeframes however, tell us that so long as $200 holds on SOL, the next key level would remain $300.
SRM
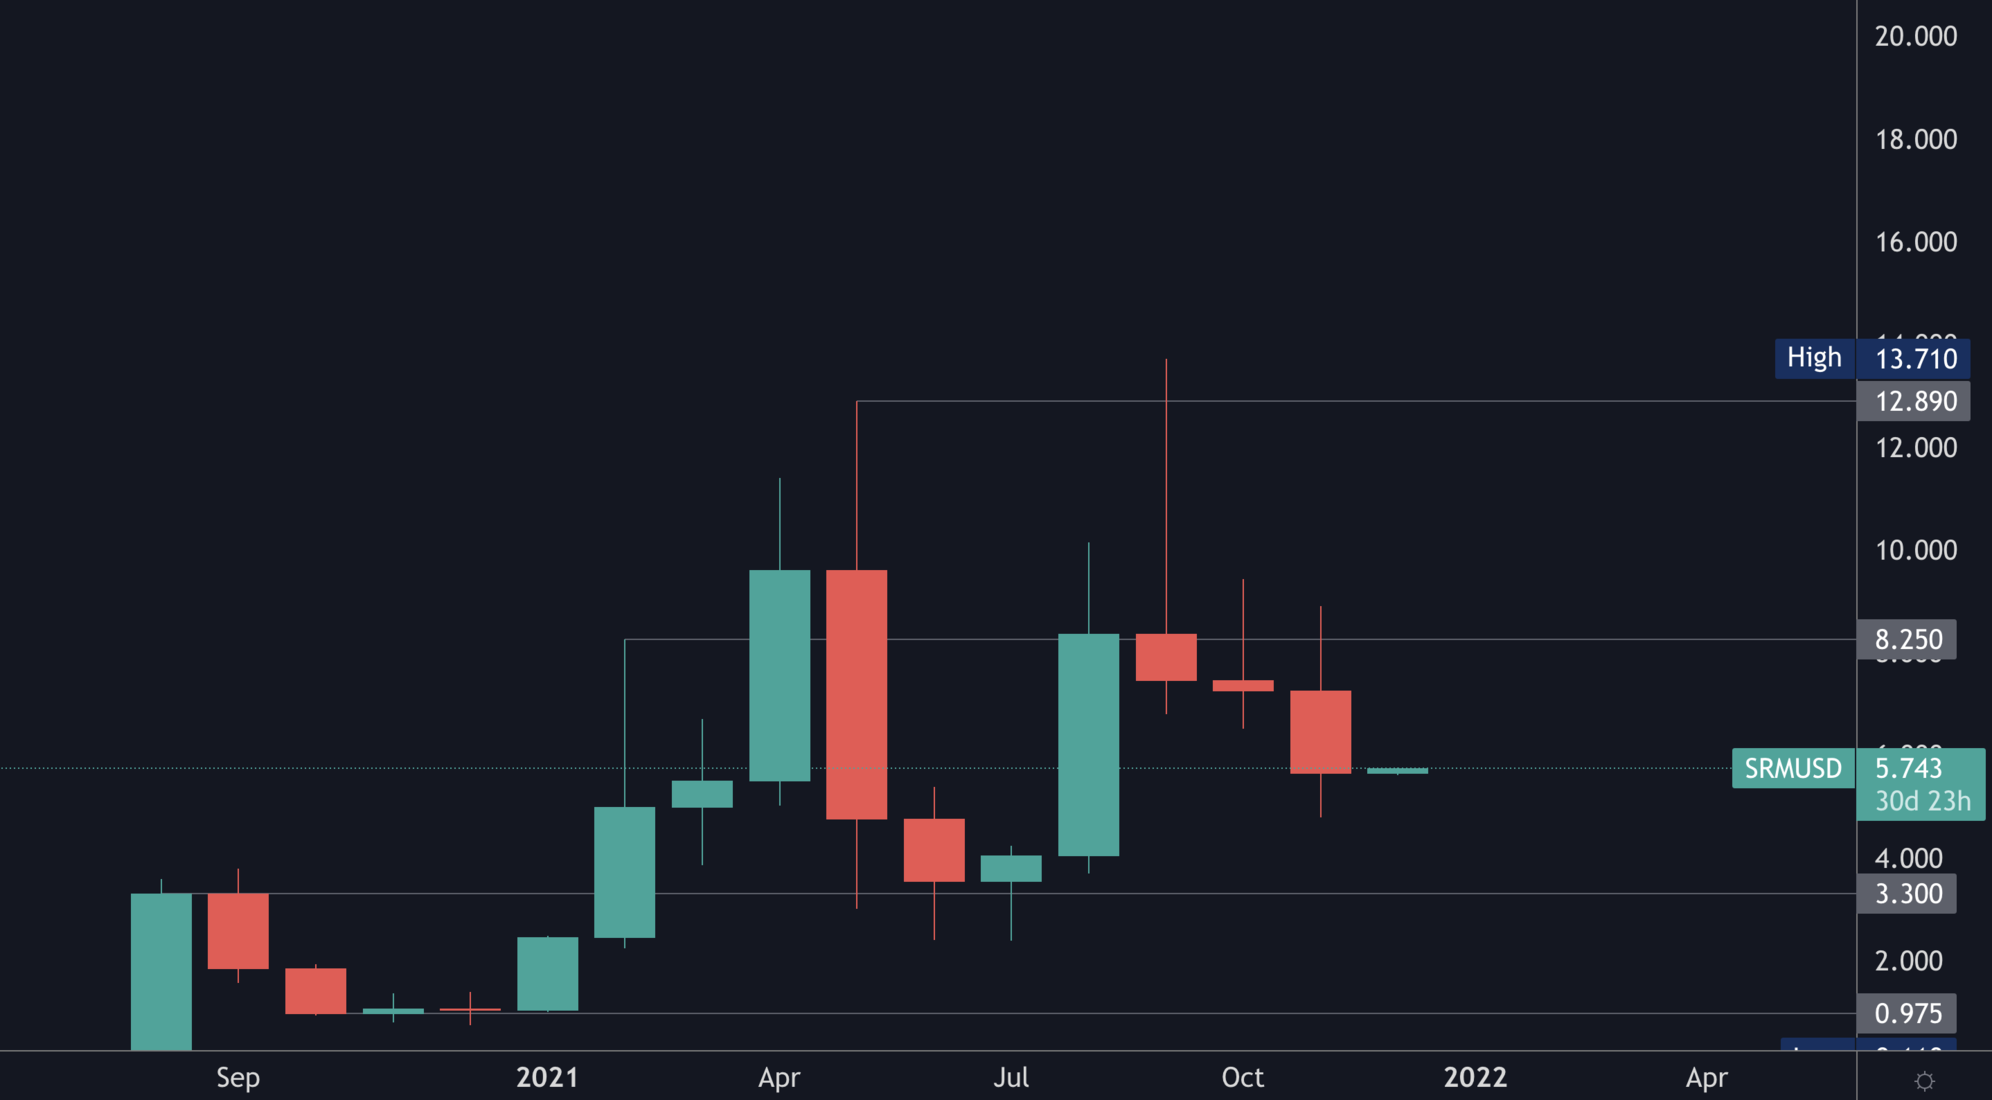
SRM found monthly resistance at $8.25. The monthly timeframe is communicating that further downside towards $3.30 is on the cards for this one.
MINA
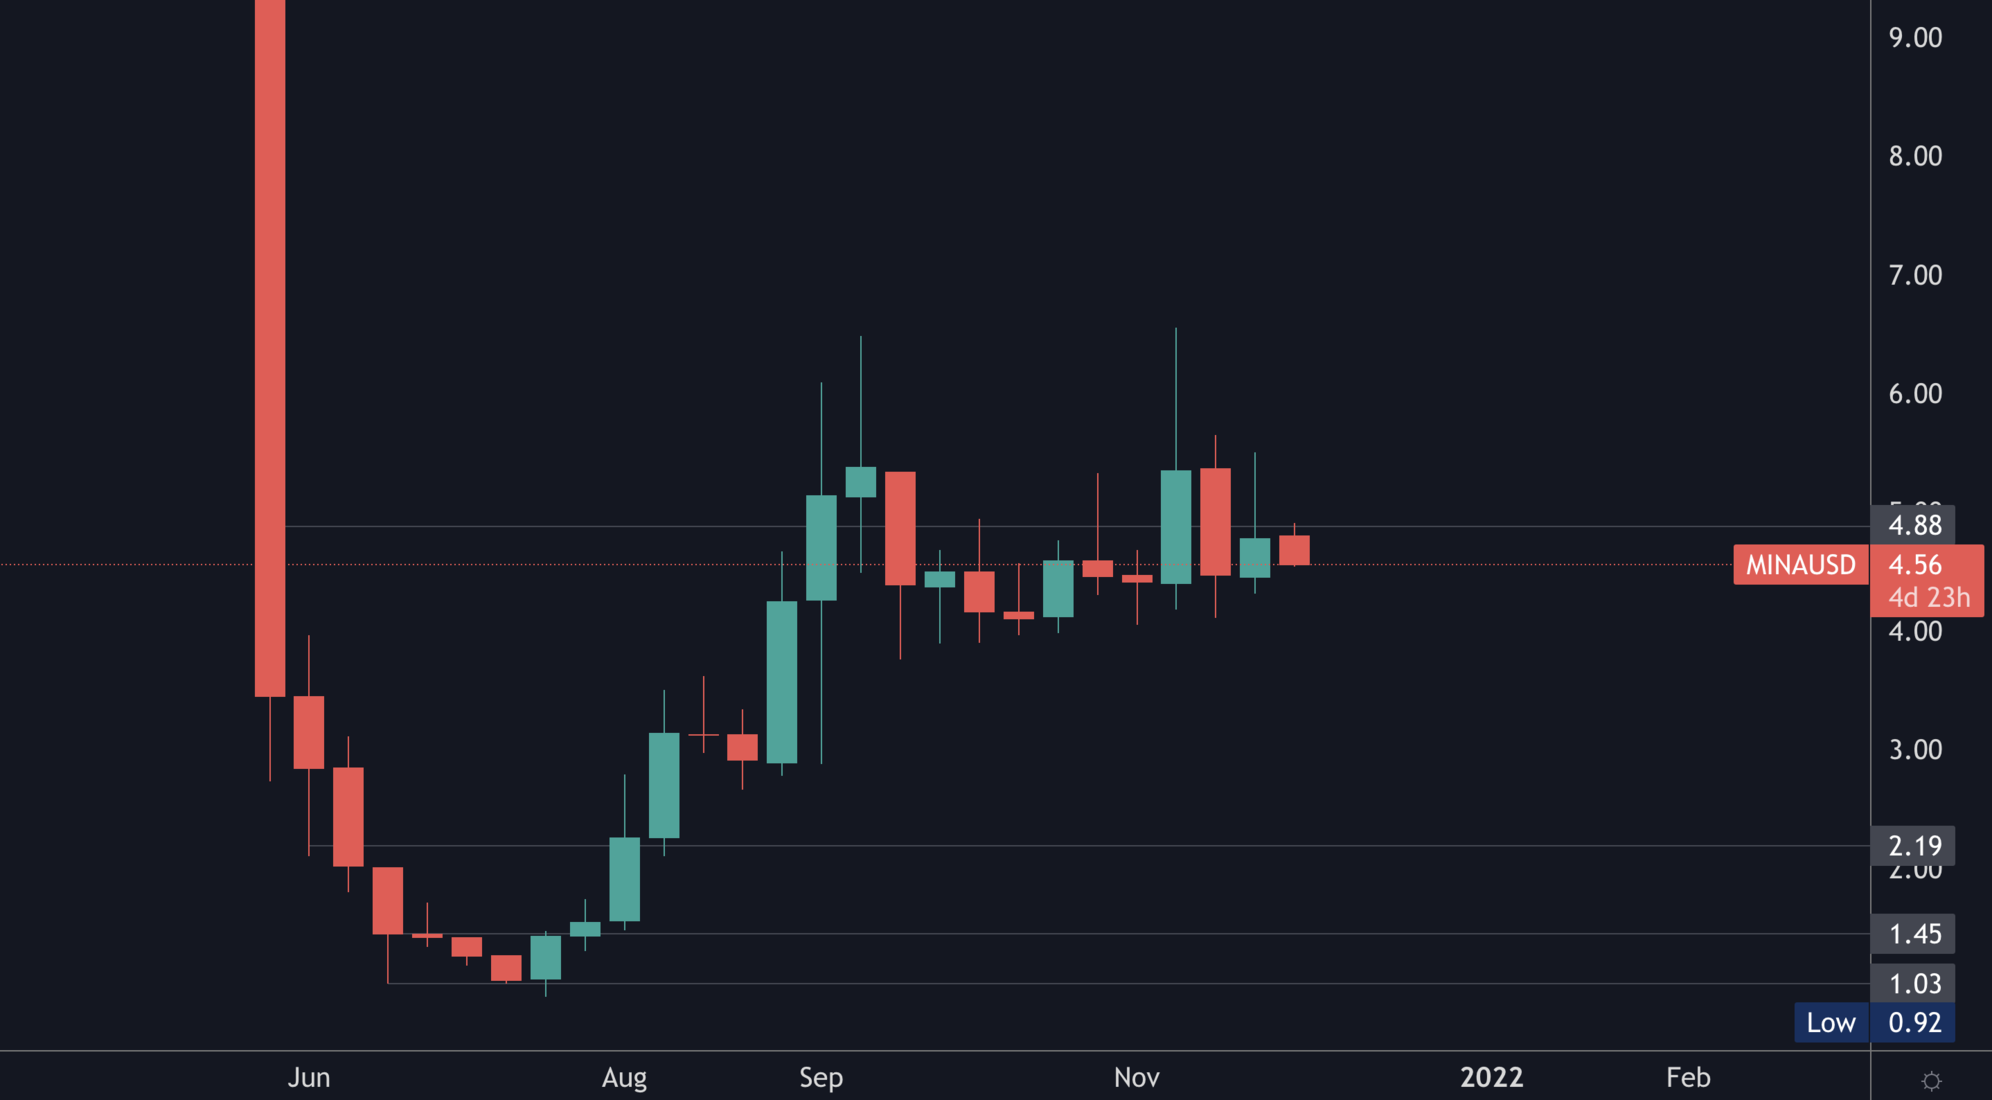
Too new for a monthly analysis, hence why we're using the weekly chart. Not to brag but we nailed MINA knowing it would:
- Dump at listing
- Bottom somewhere in [$0.75-$1]
FTT
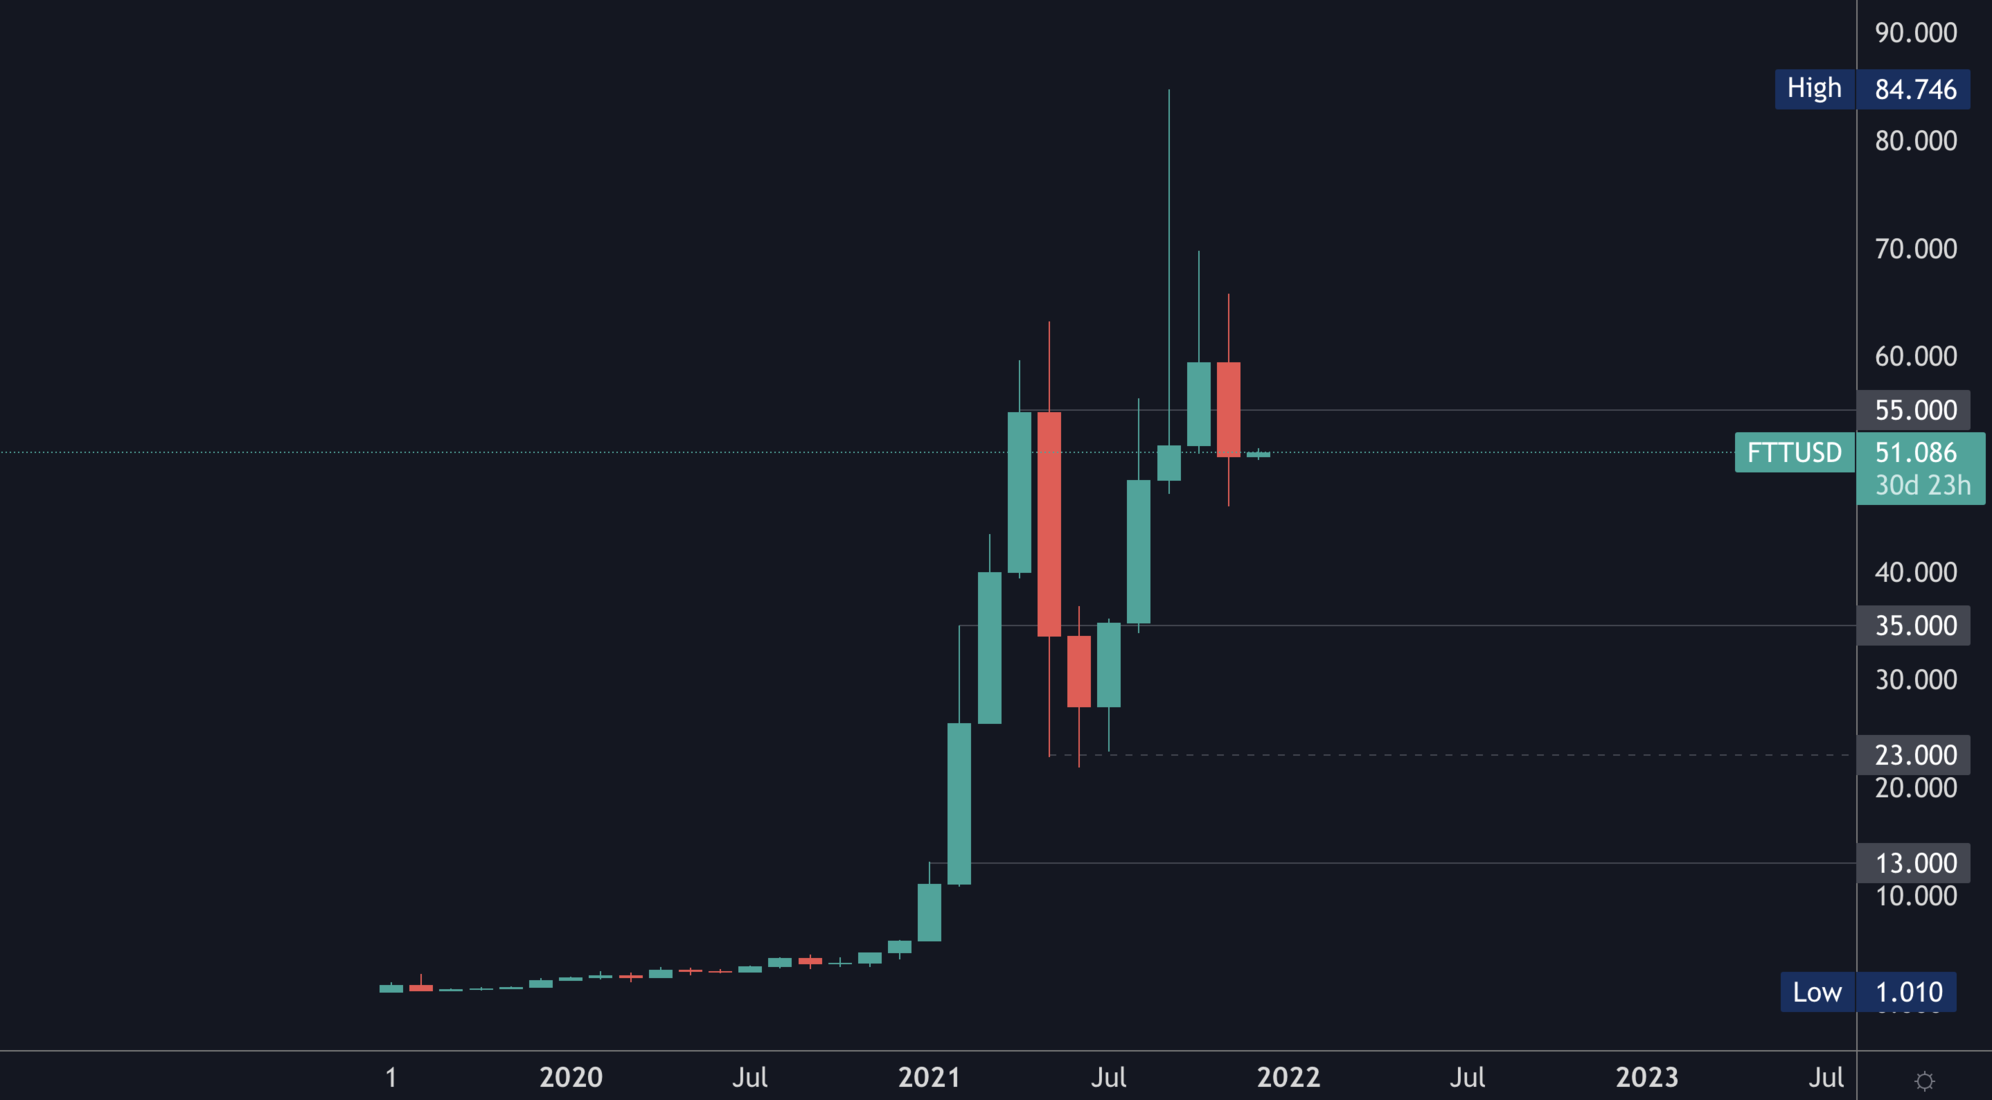
FTT has set a bearish engulfing candle on the monthly, which is not a bullish development. This actually invalidates the breakout seen from $55 and sets a target of $35.
Disclaimer: Not financial nor investment advice. Any capital-related decisions you make are your full responsibility and yours only.
Recommended from Cryptonary


