Save 23% ($351) & Get a Free 1-1 Call with our Team ⏰ : 0d 2h 59m 44s
TON, Aero, OP, and INJ technical analysis: Bullish patterns emerging?
As crypto markets retrace, TON holds steady at nearly $4.75, while Aero’s double-bottom formation strengthens support at around $1. Let's explore the key levels these assets are respecting and what could lie ahead.

Disclaimer: This is not financial or investment advice. You are responsible for any capital-related decisions you make, and only you are accountable for the results.
TON:
Market context
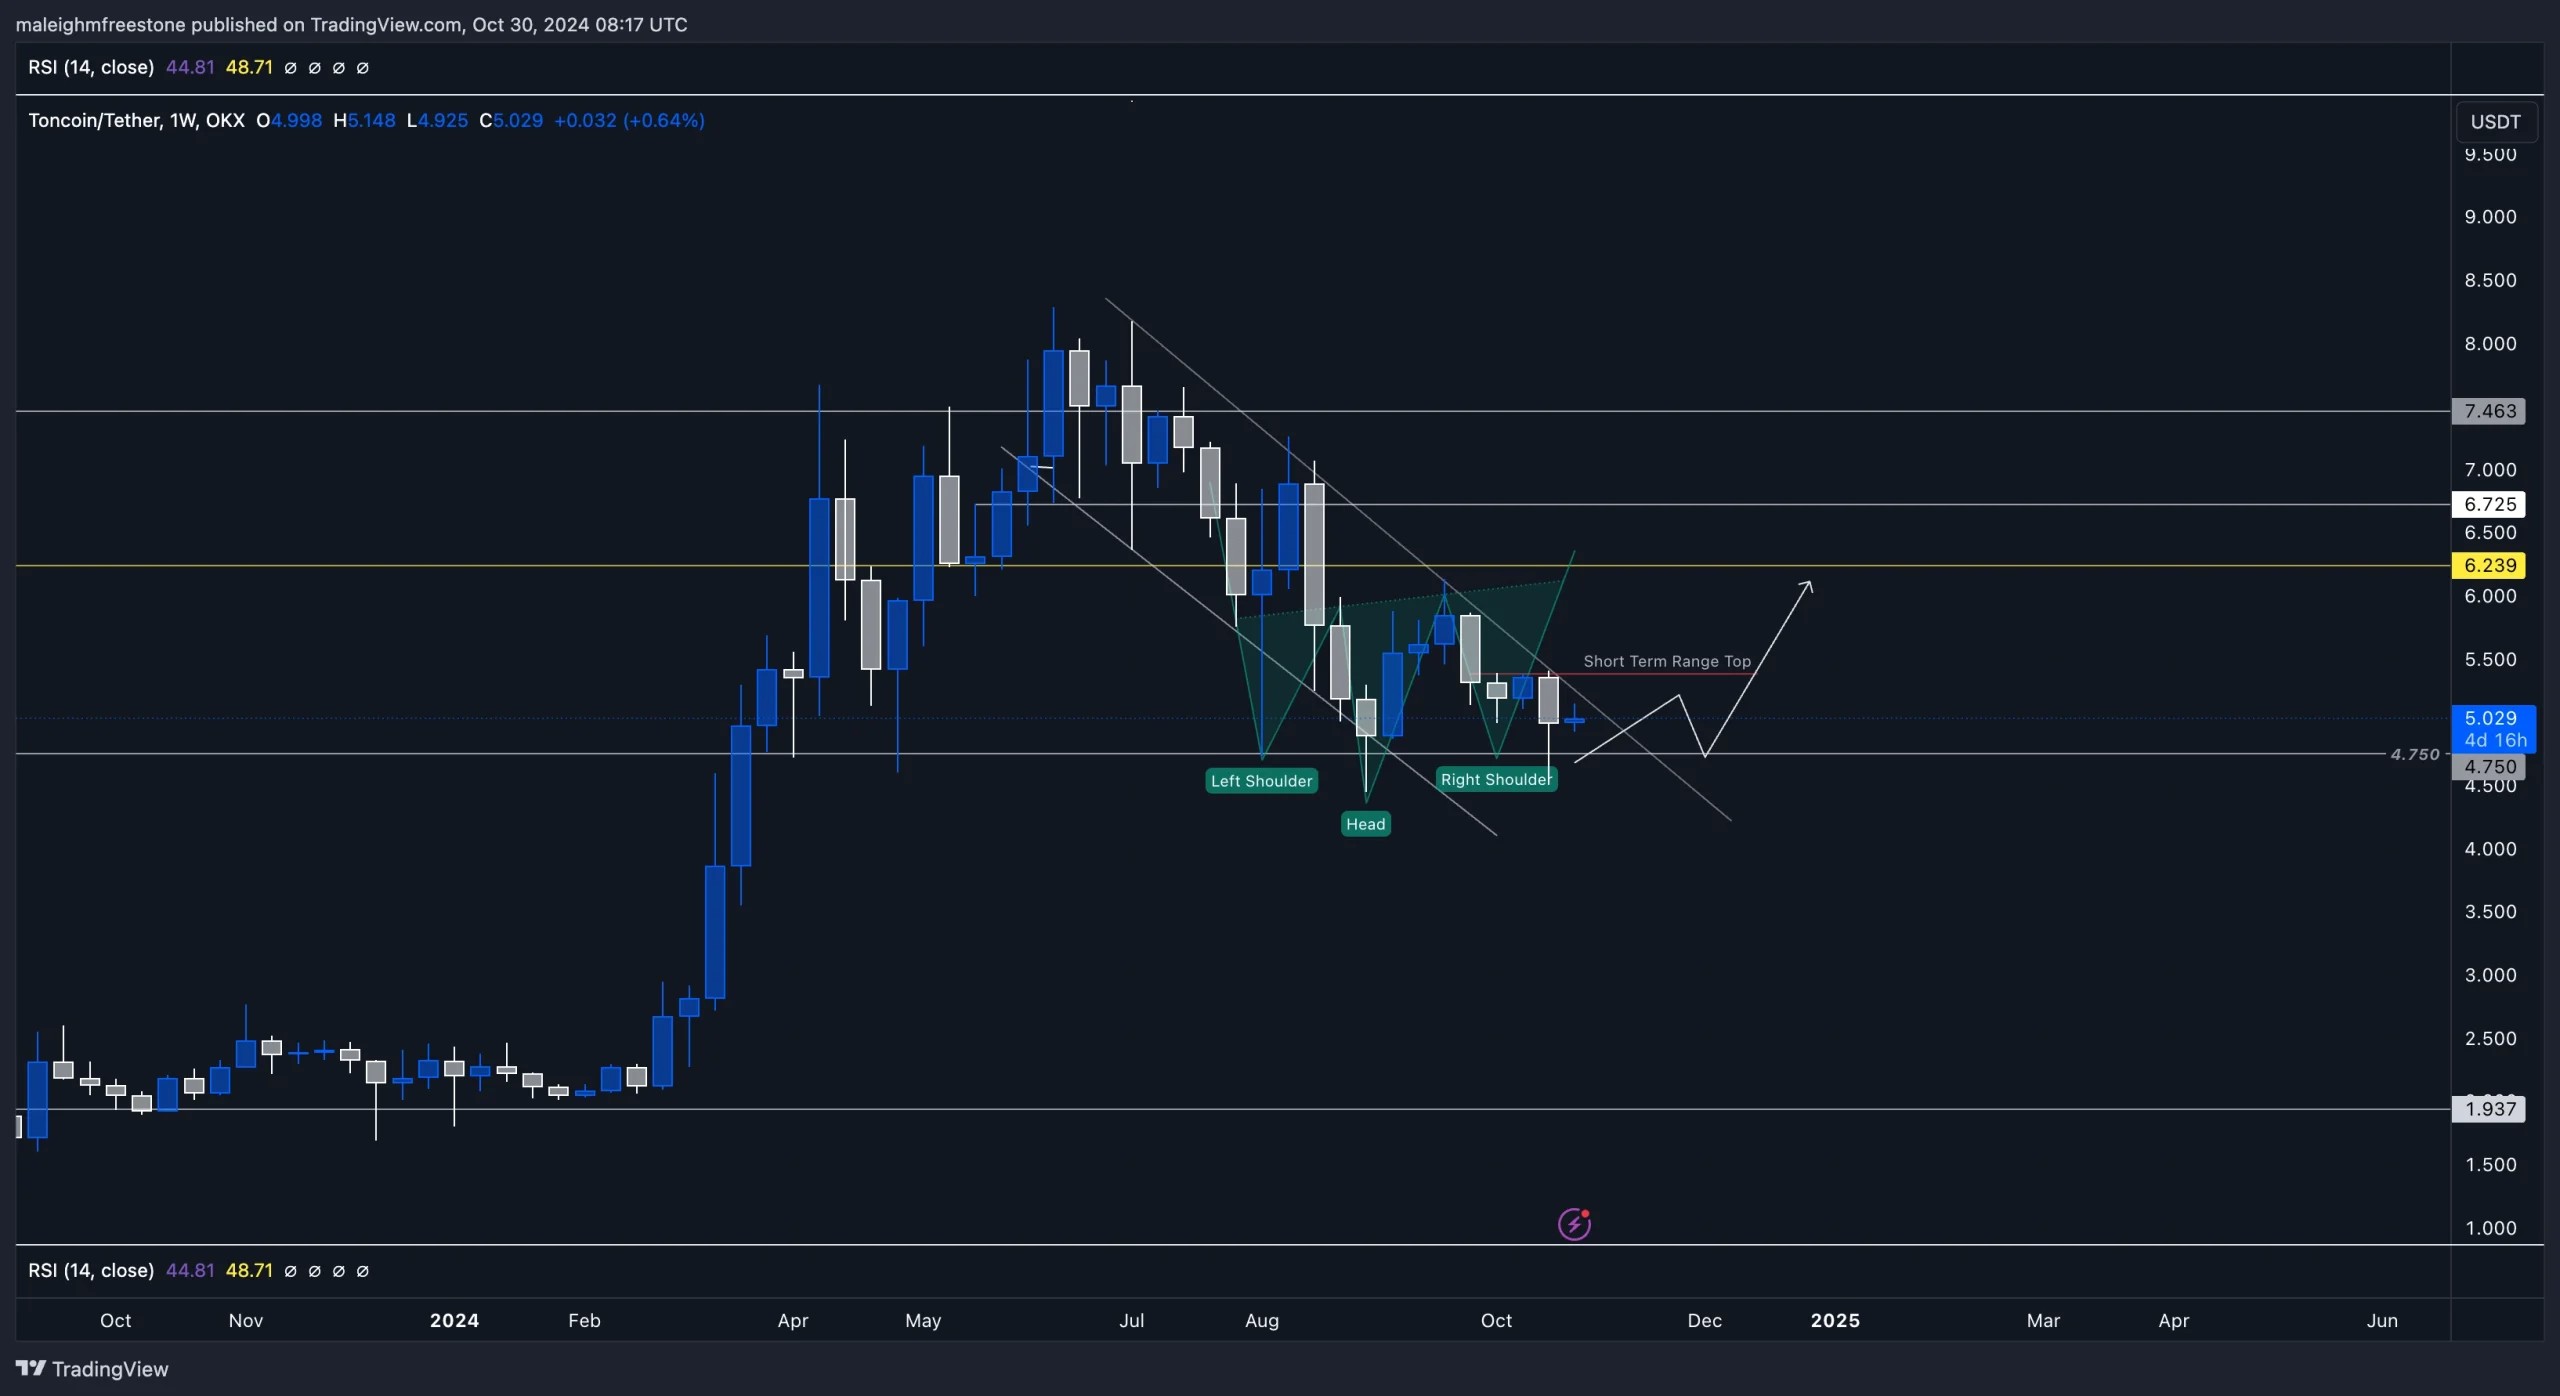
TON continues to play out as anticipated, respecting the levels we previously marked out. As we noted in our last analysis, TON is one of the more resilient assets this cycle, showing relative independence in its price action. Despite the market-wide sell-off during August and late June, TON held up above $6.2 and $6.7 for a solid period.These levels acted as consistent range tops before we saw a natural bleed-off, following a 900% run that led to substantial profit-taking. The $7.4 level proved pivotal, where many early holders likely exited, causing the pullback we identified would likely happen as capital rotated.
Currently, we've seen TON retrace back to the $4.75 region, tested multiple times this year in March, May, and August. A deviation from this level occurred in September, and now we see a well-defined inverted head and shoulders pattern shaping up at $4.75. This setup shows that demand is strong here, reinforcing $4.75 as a significant accumulation zone, especially as TON hovers just under the 50% Fibonacci retracement level from $2 to $8.20.
Playbook
Short-term range top and key accumulation zone
As we called out, TON met resistance around $5.369, the short-term range top we previously marked. It rejected here, then pulled back to $4.75, where demand has repeatedly shown up. This range top and the $4.75 level create a solid accumulation framework, especially with the inverted head and shoulders pattern forming here. If you're a TON holder or interested in a position, this is the area to watch closely for entries.Breakout setup and bearish channel
TON has been trading in a bearish channel, with lower highs and lower lows over the last few months. The last lower high formed at $6 on September 27, underscoring this channel's hold. The ideal move here is a breakout from both the channel and the range top. A break above $5.369, followed by a retest, would indicate strong potential for upside. Such a setup would confirm that the price has reclaimed the range top, adding confirmation for potential upside.Retest and potential move higher
A clean breakout above $5.369 would ideally be followed by a retest, which we'd want to hold for further upside moves. A successful retest around this level could signal a shift in momentum, with the price aiming to clear the bearish structure. This structure and strategy align well with how TON has respected key levels throughout its cycle.Key levels
- Upside Target: $5.369 - the short-term range top to break.
- Key Support: $4.75 - a consistent demand level, solidifying as accumulation territory, especially with the inverted head and shoulders pattern.
Cryptonary's take
TON's price action has lined up perfectly with our expectations. While TON isn't in our CPRO picks, our prior analysis identified this accumulation zone between $5.5 and $4.75 as optimal for a spot hold. Breaking out from $5.369 and retesting the bearish trendline would mark a high-quality setup, particularly given TON's uncorrelated nature. For TON holders or those considering a position, building within this range remains one of the most strategic plays in the current cycle.AERO:
Market context
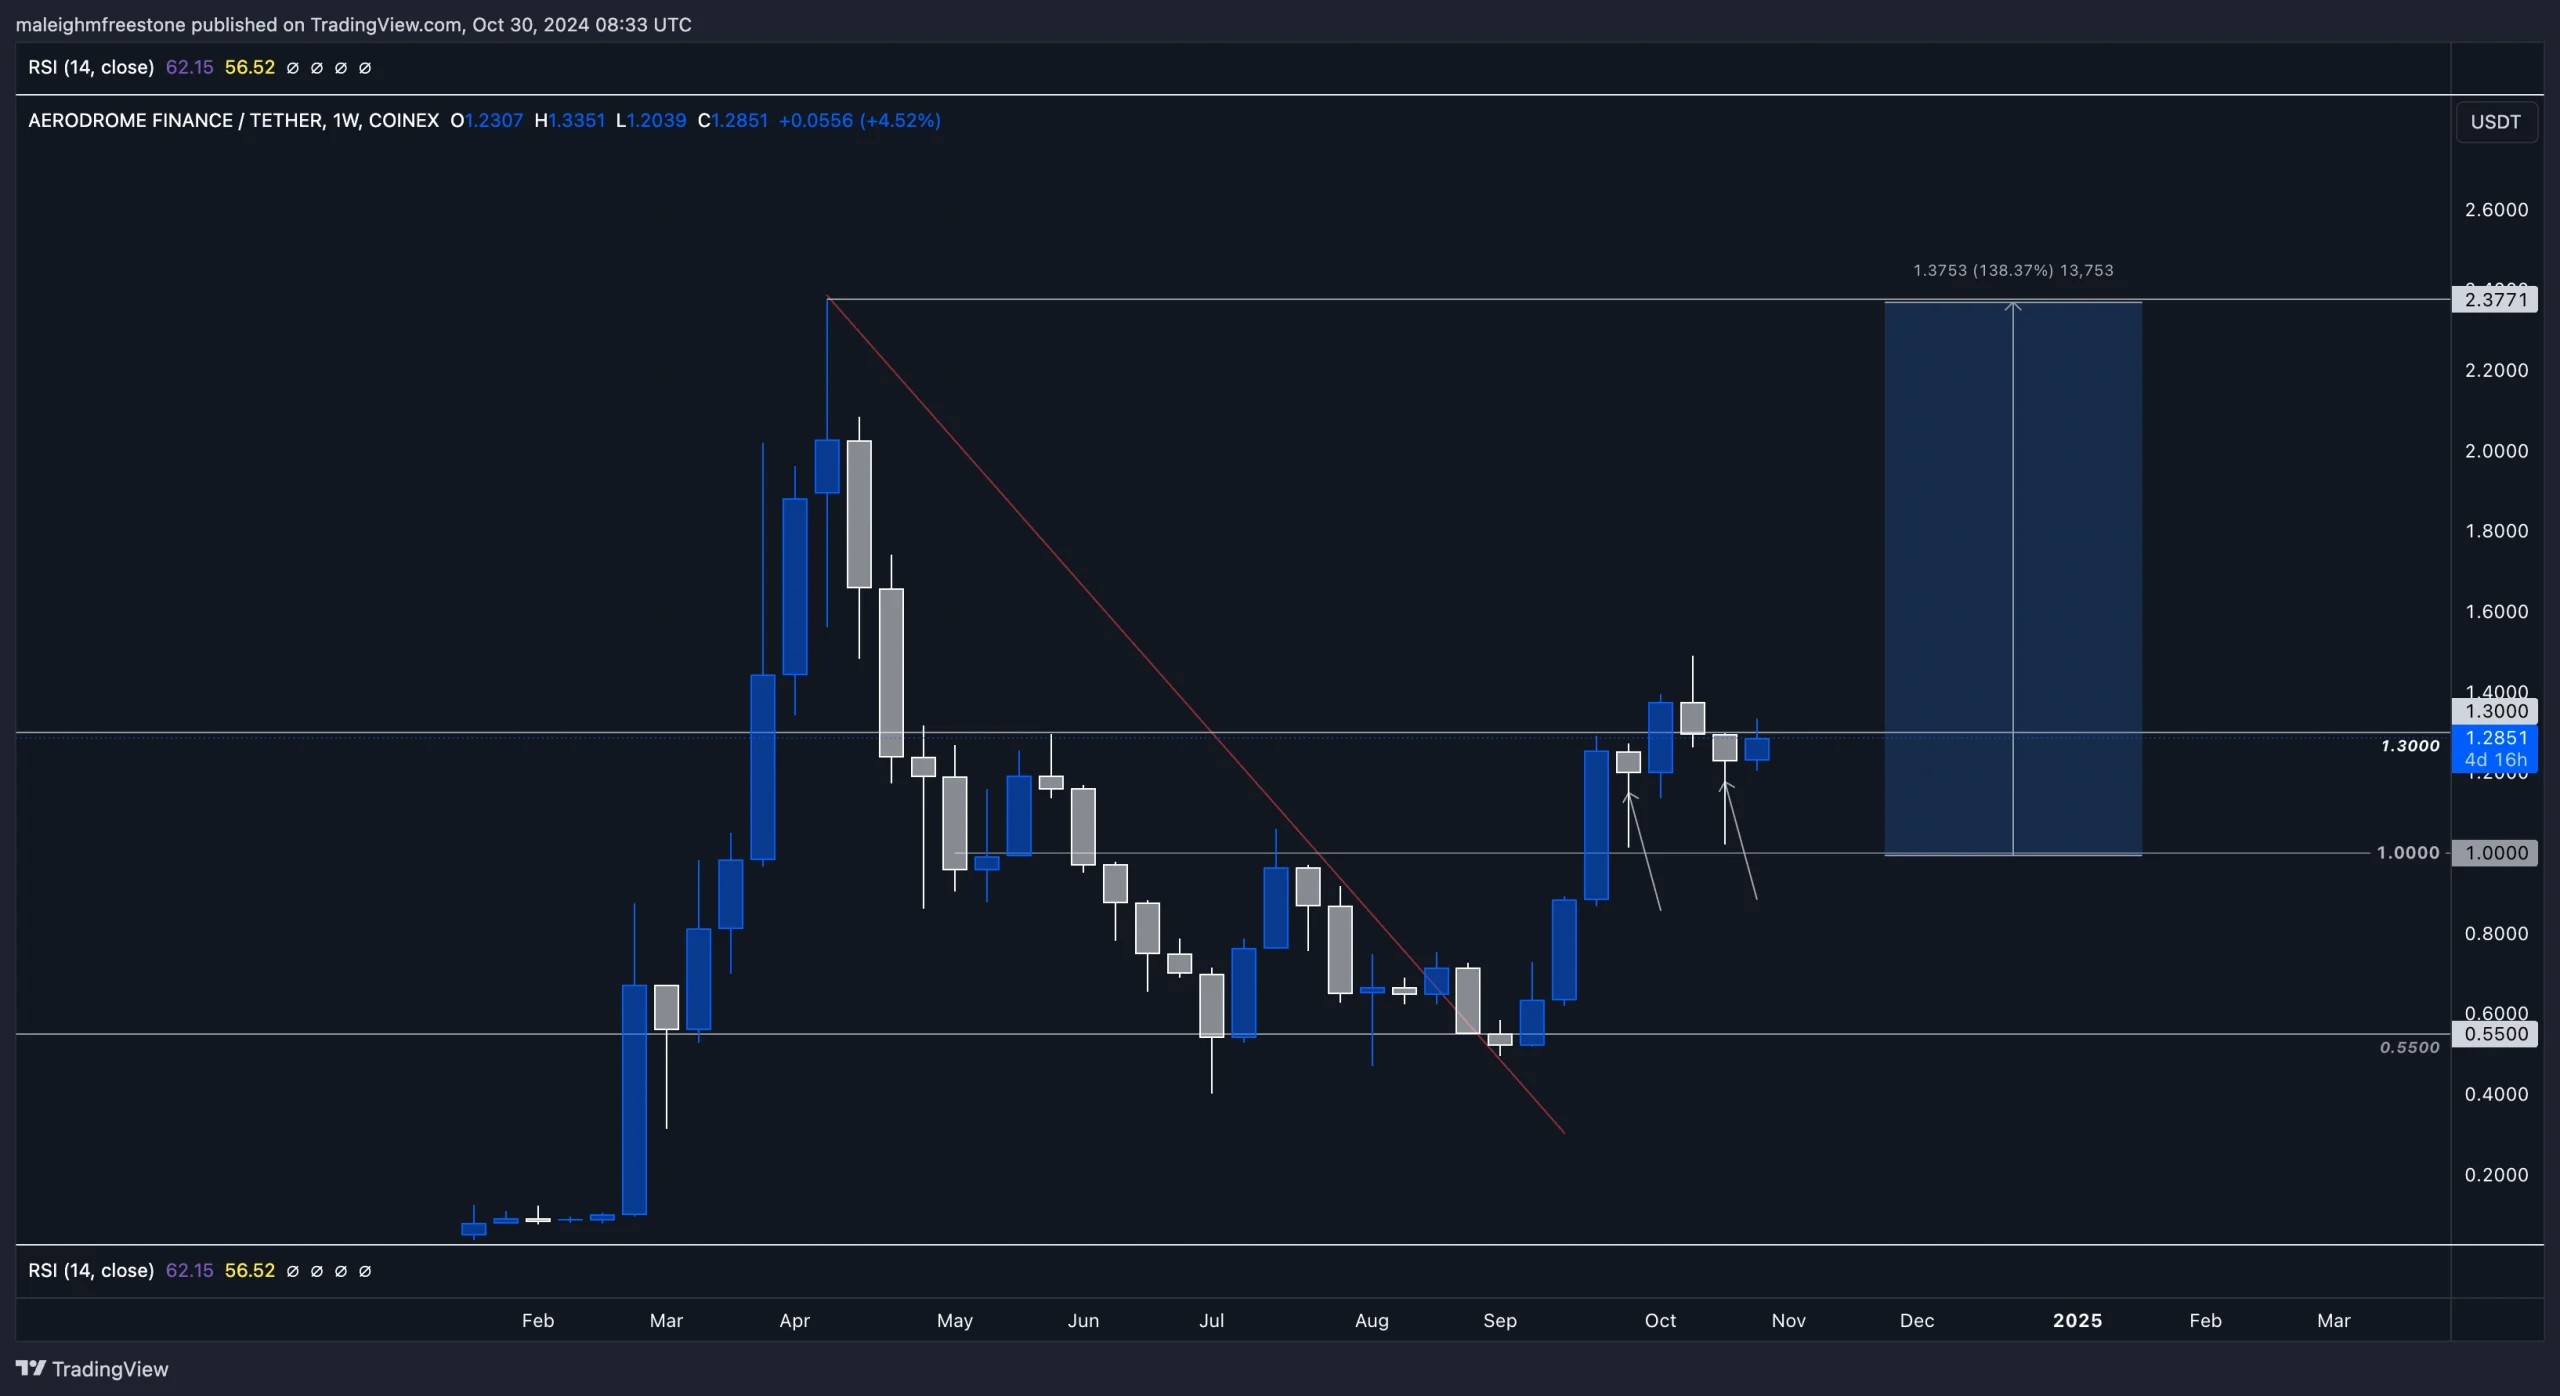
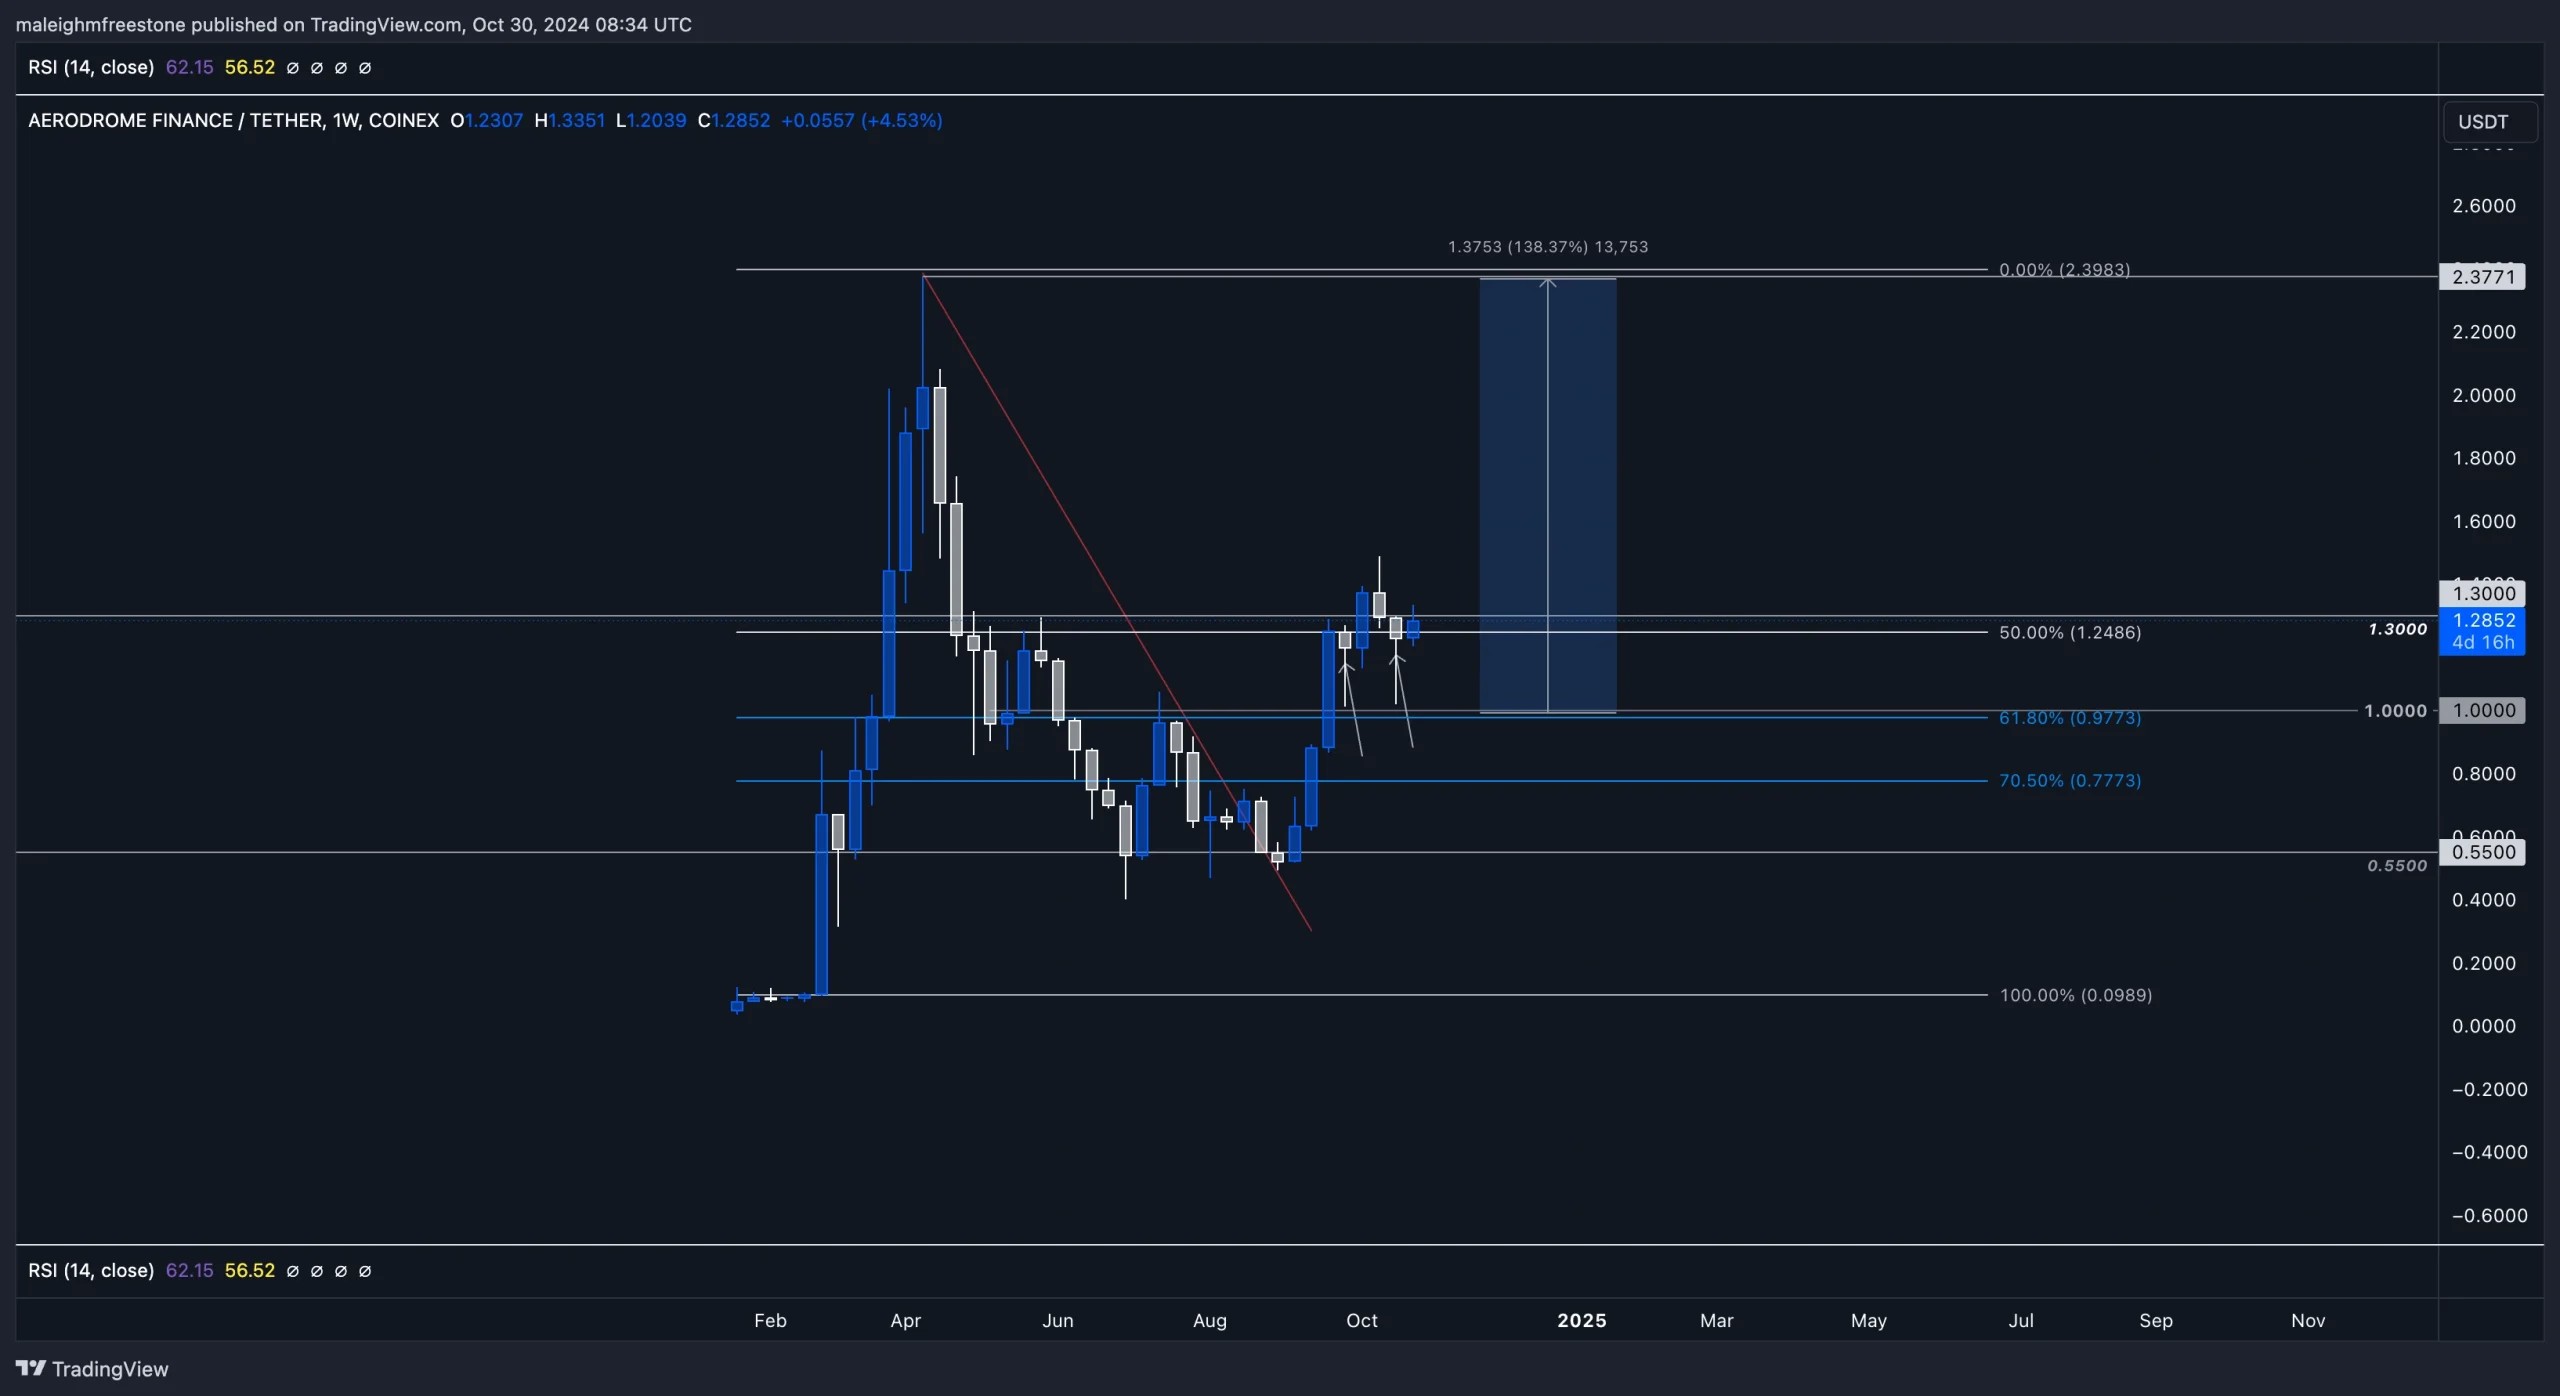
Aero is delivering exactly as we projected. In yesterday's live video, we highlighted the significance of the hammer candlesticks observed around the $1.00 mark. This level has been a focal point for support, showing strong buying pressure, especially as the double bottom formation emerged on the weekly timeframe.The dollar mark holds added weight, not only as a psychological number but as a significant 61.8% Fibonacci retracement level. This was a key element in our previous analysis, aligning both technical indicators and psychological zones to validate this support level.
The double bottom formation at $0.55 also reinforces Aero's bullish setup, having broken above the neckline and successfully retested it around the dollar level. This structure shows clear demand and solidifies the accumulation zone. Aero's price action respects historical levels too; $1.00 served as support back in May and resistance in July, making it a critical area that aligns well with our projections.
Playbook
Key accumulation zone
Aero's accumulation zone is now confirmed between $1.00 and $1.30. The dollar mark has reinforced itself with multiple supports from hammer candlestick formations, marking it at a strong psychological level with demand. Accumulating within this range provides a high-probability entry zone, especially as Aero continues to respect these levels with clean technical patterns.Double bottom and breakout
The W-bottom formation seen around $0.55 has played out perfectly, with the price breaking out above the neckline and retesting the dollar level. Two inverted hammer candlesticks emerged on the weekly, marking the strength of this retest and providing additional confirmation that Aero is positioned well for the upside. The clean double-bottom formation on the daily chart, as called out in our previous analysis, reinforces this structure as a bullish setup to watch closely.61.8% Fibonacci and psychological levels
Aero's alignment with the 61.8% Fibonacci retracement around $1.00 adds another layer of strength to this accumulation zone. The confluence of this Fib level with historical support and resistance zones around the dollar mark validates it as a key area to capitalize on.Key levels
- Accumulation Range: $1.00 - $1.30 - ideal for building positions.
- Critical Support: $1.00 - historically tested level, further validated by double bottom wicks and Fib alignment.
Cryptonary's take
Aero's price action has played out just as we forecasted, with the accumulation zone between $1.00 and $1.30 now solidified as a high-quality entry range. The double bottom formation and strong hammer candlesticks on the weekly provide added support for Aero's bullish structure.Aero's alignment with key levels and psychological markers reaffirms our outlook, and for those looking to build exposure, this is the range to focus on. With Aero respecting both Fib levels and historical price points, this setup exemplifies disciplined technical trading. This isn't an asset we hold or in our CPRO picks but its an asset worth noting with attractive price action and solid fundamentals.
Optimism (OP):
Overview
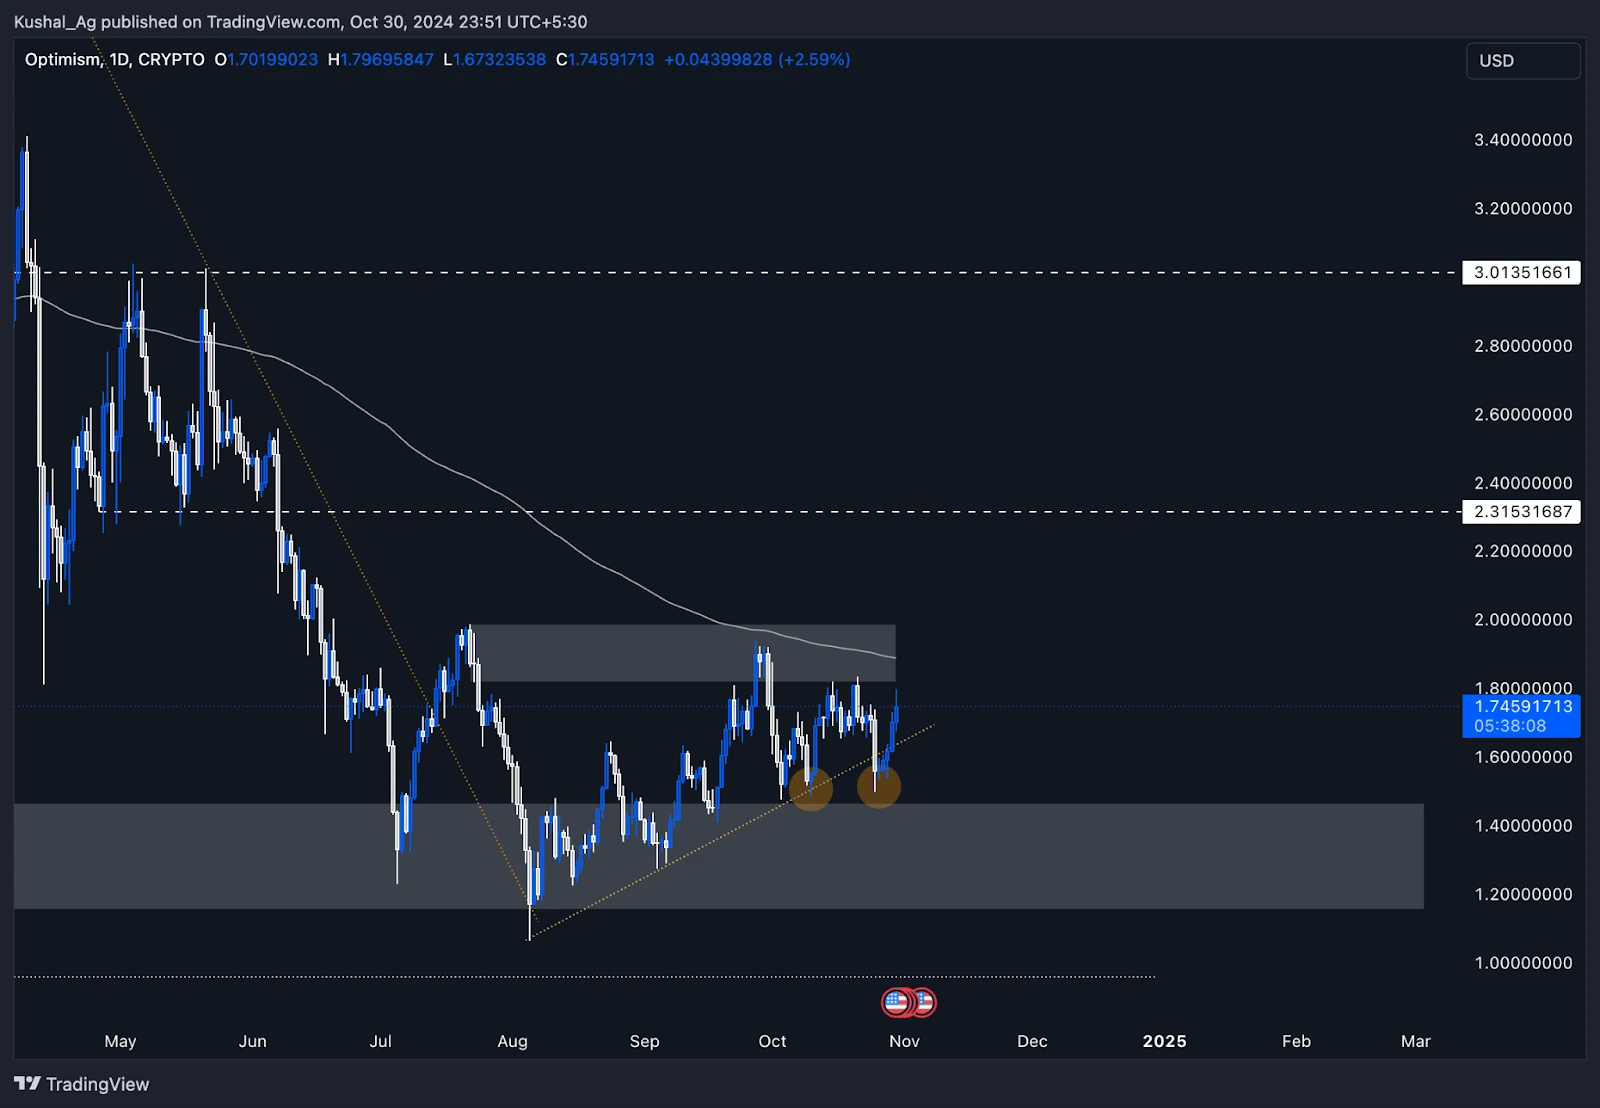
Optimism has been consolidating in a sideways range for over 100 days, between the supply zone at the top around $2 and $1.1 at the bottom, which marks a critical support level. Currently trading at $1.75, OP is testing key resistance levels, including the 200 EMA at $1.89 on the daily time frame and the supply zone between $1.81 and $2.Daily time frame analysis
- Range-bound movement: OP has maintained a tight range, with the price oscillating between $2 and $1.1. This consolidation phase shows that OP is building strength, but a breakout is essential for any significant price move.
- Liquidity grab and quick reversal: Recently, OP dipped below the $1.6 level to $1.49, breaking the yellow trend line and forming a double bottom. This move, marked by two orange circles, served as a liquidity grab, trapping short positions and quickly reversing back into the trend.
- Critical resistance: The 200 EMA at $1.89 and the supply zone at $1.81 to $2 form a crucial resistance overhead. Breaking through and establishing support above this region is vital for any continuation in the uptrend.
- Support levels: On the downside, OP's weekly demand zone between $1.46 and $1.15 provides a solid base, especially with the recent double bottom at $1.5 acting as immediate support.
Potential scenarios
- Bullish scenario: A breakout above the $2 supply zone and 200 EMA would signal a shift in momentum, potentially initiating a new bullish trend. Confirmation of this breakout with support at these levels could provide an entry for upward targets.
- Bearish scenario: Failure to breach the supply zone could see OP retesting the $1.5 level. The further downside might lead to OP testing the lower edge of the weekly demand zone.
Cryptonary's take
Optimism is at a pivotal moment. With the wider market breaking out, OP's current setup and range-bound action also suggest a breakout could be imminent if it can overcome resistance at the 200 EMA and supply zone. However, a failure to hold above $1.5 may signal further retracement into its weekly demand. The upcoming moves will reveal more about OP's strength in the current market conditions.Injective:
Overview
Injective (INJ) currently shows a strong technical setup in the three-day time frame, with a promising bullish outlook. INJ is holding steady above its 200 Exponential Moving Average (EMA), a significant support level, and has formed a double bottom structure, highlighted by two yellow dots. These indicators suggest a potential trend reversal and provide a solid base for upward movement.Three-day time frame analysis
- Support at 200 EMA: INJ has established a solid base on the 200 EMA at $19.59, currently serving as robust support. INJ is trading just above this level at $19.87, bouncing off the 200 EMA-a positive signal on a larger time frame like the three-day chart.
- Double bottom formation: The double bottom pattern, marked by two yellow dots, is a promising indication of potential price reversal from previous lows. This setup typically signals strong buying interest, adding to the asset's bullish sentiment.
- Break of structure: INJ has recently broken its intermediary structure to the upside, marked by a blue line at $23. This break signals a positive trend shift, with the blue demand zone ranging from $17.32 to $15.6 providing a strong foundation. INJ tested this demand zone on October 24 at $17.31, followed by a substantial bounce, rising over 15% since.
- Resistance levels: The next resistance on the upside for Injective is $24.8. A break above this level would indicate a new higher high, opening up a potential path to $31.1 in the medium term if bullish momentum holds.
- Support levels: On the downside, the three-day demand zone from $17.32 to $15.6 offers strong support. This zone serves as a solid foundation, reinforcing Injective's price action in case of any pullback.
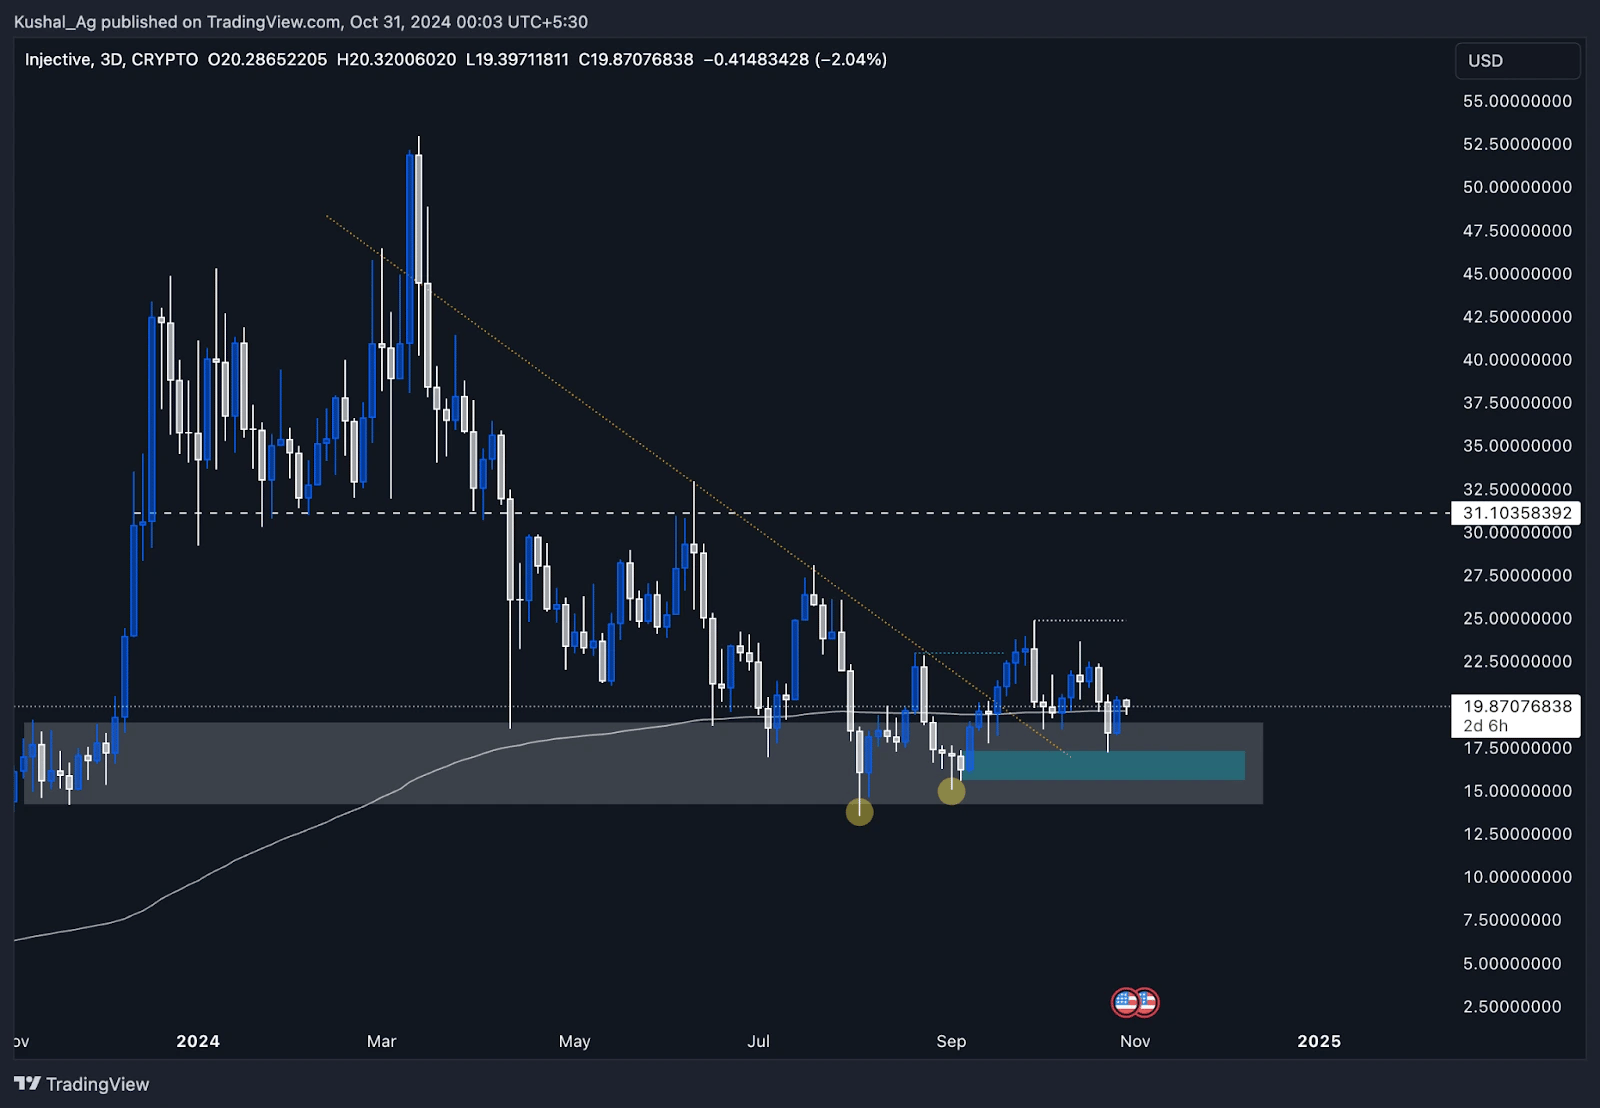
Cryptonary's take
With Injective's solid structure in the three-day time frame and a clear upside structure break, the asset seems poised for a potential rally. The strong support at the 200 EMA and the double bottom formation further reinforce this outlook.However, a sustained move above $24.8 is essential to confirm ongoing bullish momentum. As always, traders should monitor support zones closely for any retracement potential.
Recommended from Cryptonary


