Save 23% ($351) & Get a Free 1-1 Call with our Team ⏰ : 0d 2h 59m 43s
Disclaimer: This is not financial or investment advice. You are responsible for any capital-related decisions you make, and only you are accountable for the results.
TON:
Market context
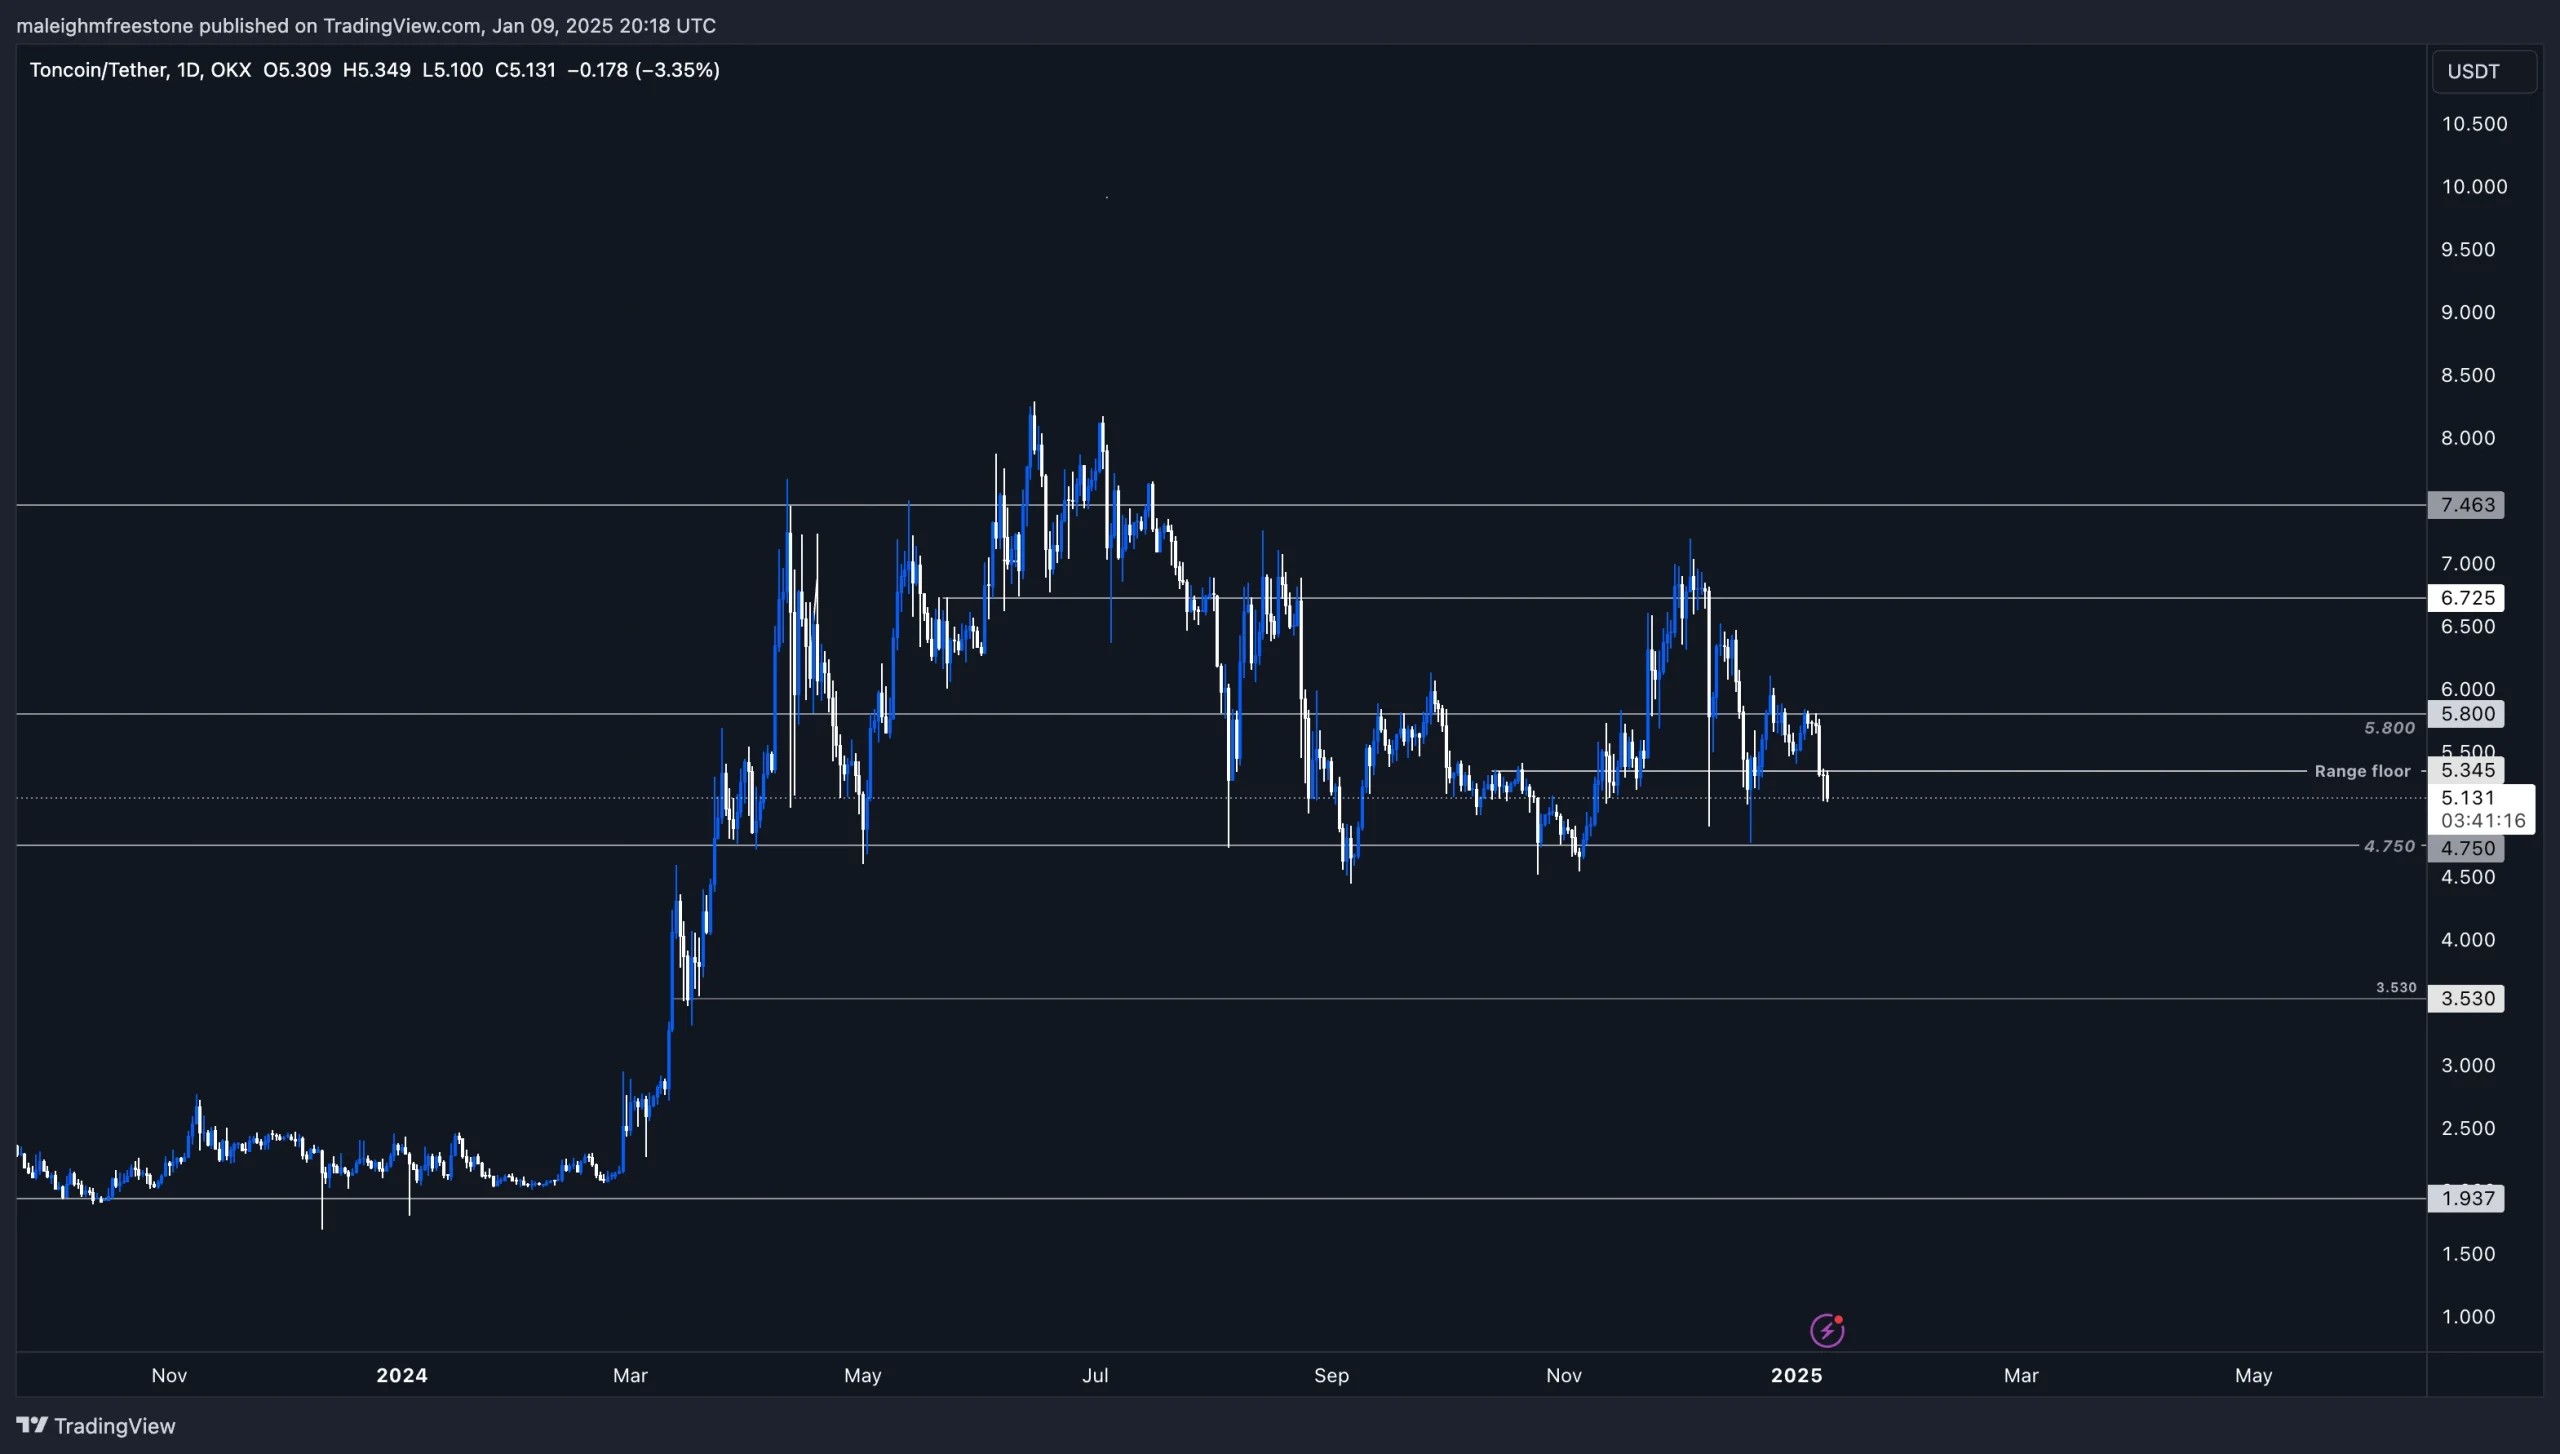
TON has broken its previous range floor, reflecting the broader market’s current state of sideways, choppy, and relatively boring price action. This aligns with the macro outlook, suggesting that we may be in for a few quarters of consolidation and potential downside across the board.Key levels to monitor for TON include:
- $4.75: This remains a critical support zone, as it has historically acted as a strong level of buyer interest.
- $3.50: While deeper, this is not out of the question and would represent a significant pullback. It’s important to remain open-minded to all possibilities, as we always emphasize in our analysis.
Price action
- TON’s previous range floor has been breached, indicating a potential continuation of the current pullback phase.
- $4.75: This is the immediate support zone to watch. If this level is maintained, it will reinforce TON’s resilience and provide an area to consider for spot accumulation.
- $3.50: This deeper level, while less likely, is an area we’ve mapped out to account for a broader market pullback scenario.
Playbook
- Patience: The focus is on being patient and observing how TON reacts at key levels.
- $4.75: Primary area to monitor for buying opportunities.
- $3.50: Secondary level to consider if the market experiences further downside.
Cryptonary’s take
With the macro environment pointing to a potentially dull and consolidative phase over the coming months, assets like TON may experience continued pullbacks. However, this is not a cause for panic—it’s an opportunity to position for the long term.We maintain confidence in TON’s strength as a standout protocol. The $4.75 level remains the immediate focal point, with $3.50 serving as a contingency in case of deeper pullbacks. As always, the key is staying disciplined, following the levels, and avoiding emotional decision-making. Patience will pay dividends here as we navigate the current market cycle.
Injective ($INJ):
Overview
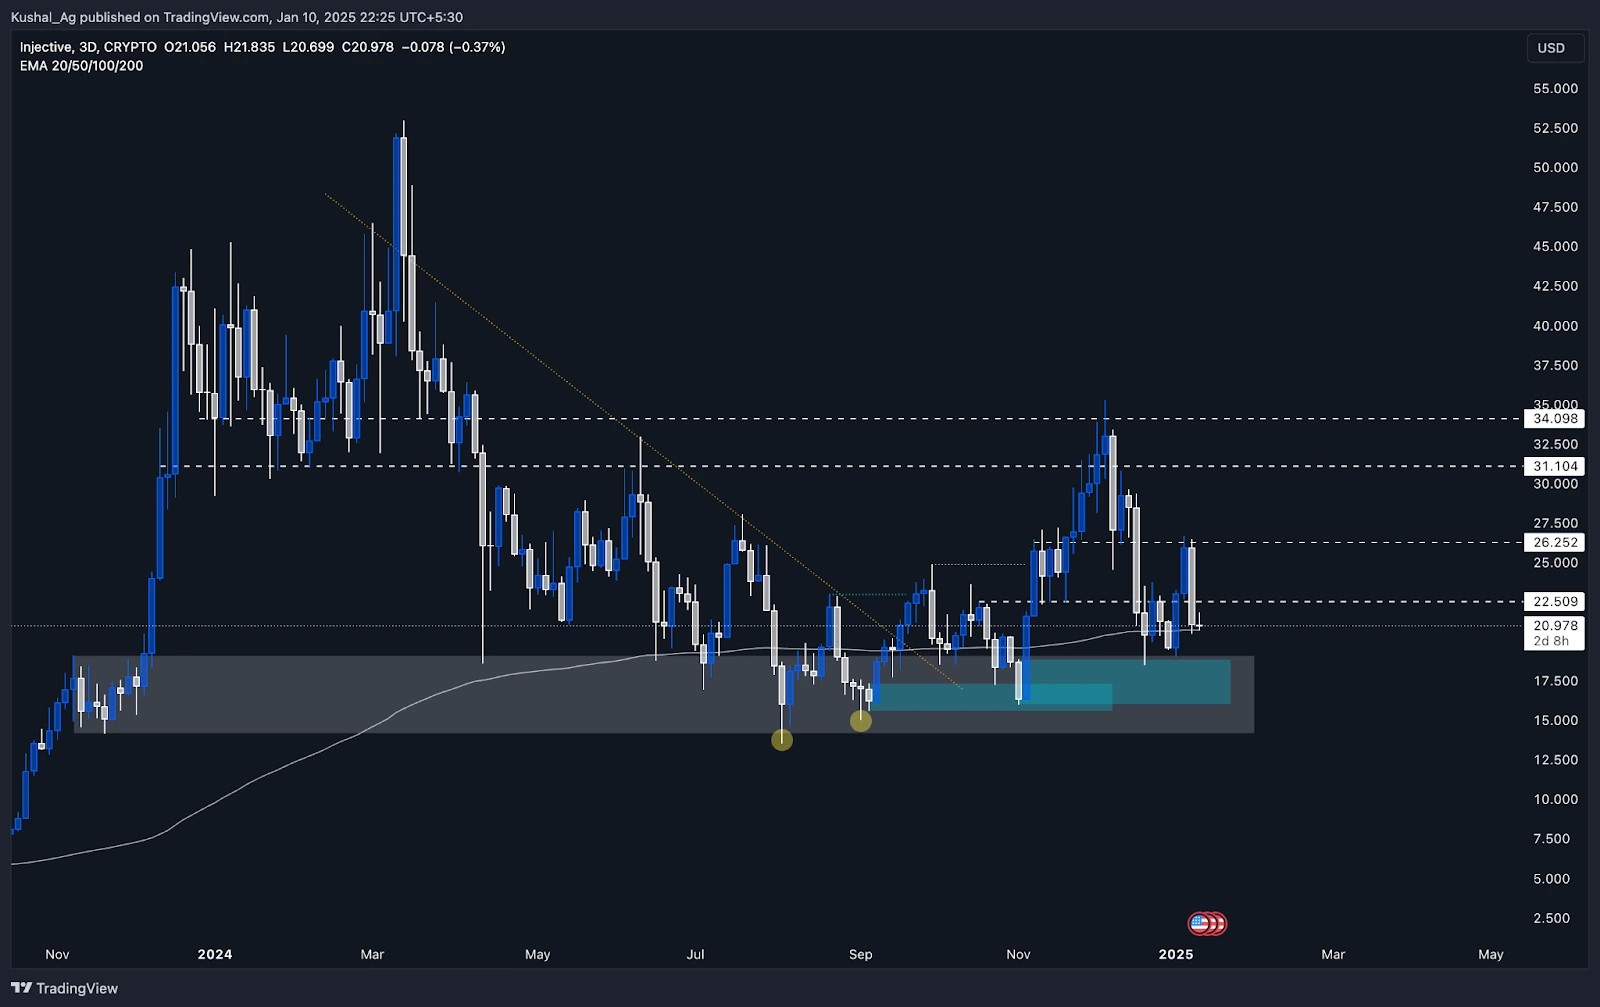
Injective ($INJ) has faced a sharp rejection from the $26.25 resistance, a key level previously identified, and has failed to hold the $22.5 support area. The price has now retraced to the 3-day time frame 200 EMA, currently trading at $20.7, with Injective holding at $21.05. The price action is now testing critical levels that will determine its next move.Key Levels to Watch
Support levels:
- 3-day 200 EMA:
- At $20.7, the 200 EMA is a critical support, previously acting as a bounce point for Injective.
- Maintaining this level could signal a recovery and prevent deeper pullbacks.
- 3-day demand zone (Blue box):
- Range: $18.8 - $16.00
- This demand zone is a significant accumulation area, likely to attract buyers if the Injective breaks below the 200 EMA.
Resistance levels:
- $22.5:
- Now, it is acting as immediate resistance after the recent breakdown.
- $26.25:
- The key resistance rejected the price sharply, representing a major hurdle for the Injective's recovery.
Analysis
- The sharp rejection from $26.25 highlights the strength of sellers at this level. This resistance zone has proven to be a significant barrier, halting Injective's bullish momentum.
- The current price action near the 200 EMA at $20.7 is critical. A stronghold above this level could provide a base for a reversal, while a break below could lead to a deeper retracement into the $18.8 - $16.00 demand zone.
- The 3-day rejection candle from $26.25 is sharp and indicates strong selling pressure. However, this pullback aligns with typical market cycles, where retracements create opportunities for accumulation at lower levels.
Cryptonary's take
Injective is navigating a pivotal zone, testing its 3-day 200 EMA and approaching the $18.8 - $16.00 demand zone, which could serve as a strong accumulation area. The current retracement, while sharp, is part of a broader healthy market structure, offering potential entry points for long-term holders.To resume bullish momentum, Injective needs to reclaim the $22.5 resistance and eventually challenge $26.25. For now, all eyes are on how the price reacts at the 200 EMA and whether it holds or dips into the blue-box demand zone for further consolidation.
SUI:
Market context
SUI, sitting as the 12th largest asset by market cap, is proving why it’s a standout performer in this cycle. Despite the market’s overall bearish sentiment, SUI continues to show strength, trading close to its all-time highs and maintaining solid bullish momentum.This highlights that even in tougher market conditions, opportunities are there if you know where to look. It’s clear that SUI is finding the liquidity and volume to push higher, showing that the market isn’t entirely doom and gloom.

Performance highlights
SUI’s recent price action has been exceptional. After printing a highly bullish three-month candle, the current one is also showing incredible strength, taking the asset close to price discovery territory. For an asset of this size, it’s no small feat to maintain such momentum in these conditions. It’s a great reminder that while the broader market might be struggling, there are always assets leading the way—and right now, SUI is one of them.Expected pullback and playbook
While the current bullish momentum is impressive, we do expect SUI to see a pullback. It’s natural for assets that have rallied like this to retrace and test previous levels, which could offer a solid re-entry opportunity.Playbook from previous analysis
- Accumulation zone: The $3.6–$3.4 range remains the key level for accumulation. Buyers have consistently stepped in here, and it’s where we’d look to reload if price retraces if we were SUI holders.
- Breakout play: A clear break and hold above $4.8 signals a bullish continuation, with potential for price discovery beyond.
- Risk management: If $3.4 fails as support, reassess positions and stay disciplined. It’s all about letting the market confirm your thesis.

Cryptonary’s take
SUI is putting on an incredible performance and standing out in a challenging market. While we don’t currently hold SUI, it’s a prime example of the type of opportunities we aim to find. The strength it’s showing now aligns with what we look for in assets, especially when they trade against the prevailing market trend.However, as always, we remain cautious and disciplined—this level of momentum isn’t sustainable forever, and a pullback is likely. Watching key levels like $3.6–$3.4 for re-entry opportunities or $4.8 for continuation is how we’d approach SUI from here. Patience and precision will pay off.
Recommended from Cryptonary


