Save 23% ($351) & Get a Free 1-1 Call with our Team ⏰ : 0d 2h 59m 44s
Total and Altcoin Market Cap Technical Analysis
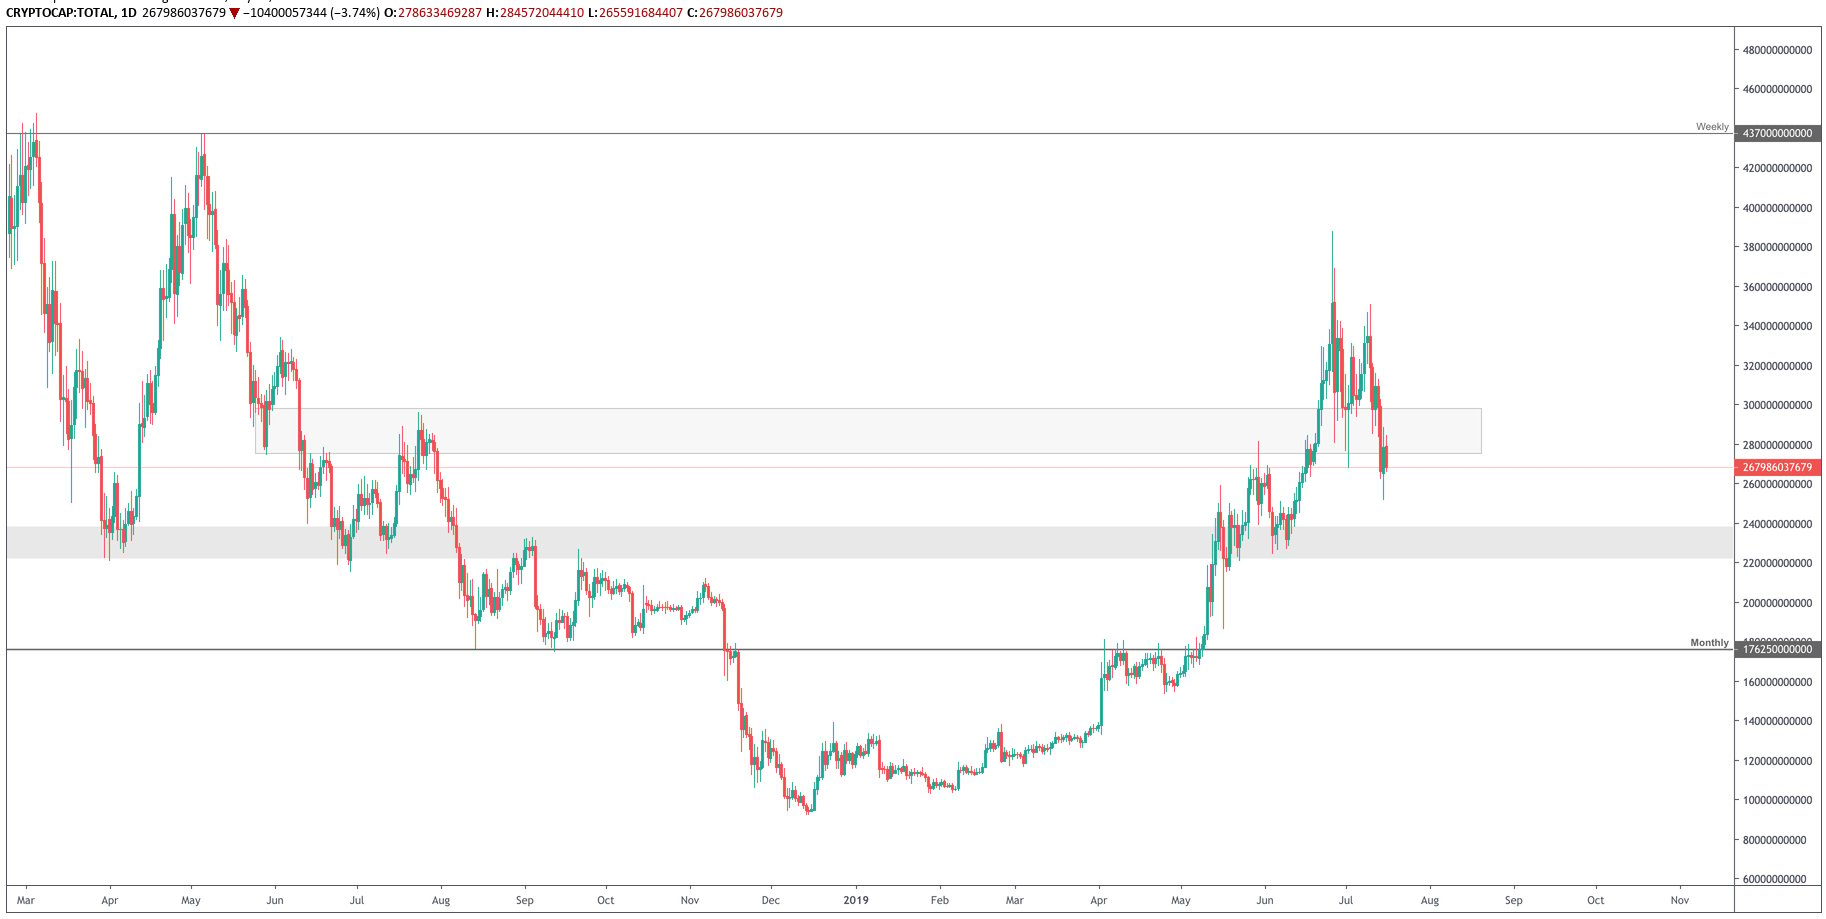
The higher timeframes still indicate a bull-run, nonetheless, retracements are natural and necessary in any uptrending market. The daily timeframe is currently showing signs of weakness. We have crossed through [$275B-$300B] and had a daily candle closure below it, we’ve retested and continuation is probable. The targeted area is the important S/R liquidity region at approximately [$220B-$240B]. The latter is a clear separation between bearish and bullish territory for the past two years.
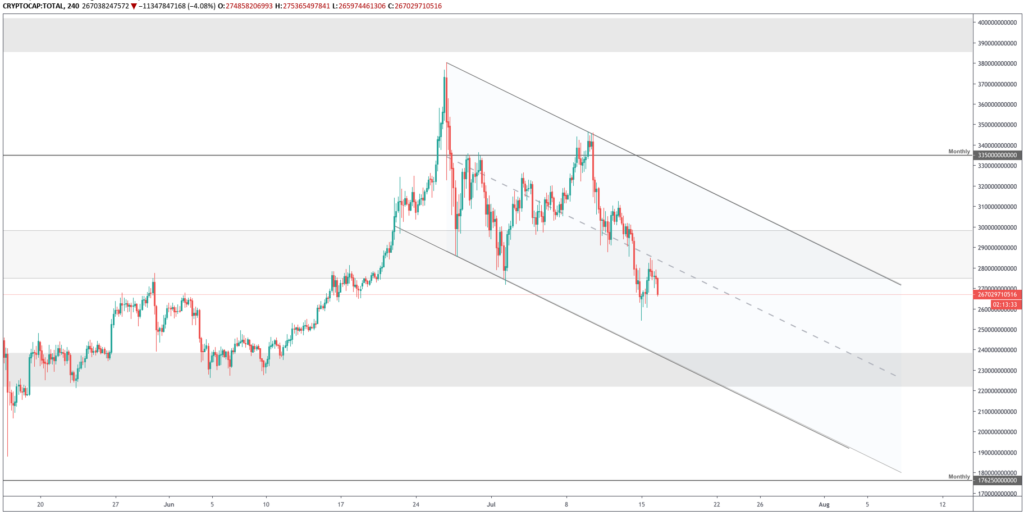
The 4H chart gives a more precise image of the current scenario at hand. We are in a clear descending channel. The $275B level broke, was retested and rejected again. We may stall at this area before further downside, but so far it indicates a further fall towards the bottom of the channel around [$220B-$240B]. This bearish scenario would be invalidated by strong momentum bringing us back inside the range and above the middle of the channel.
Altcoins’ Market Cap
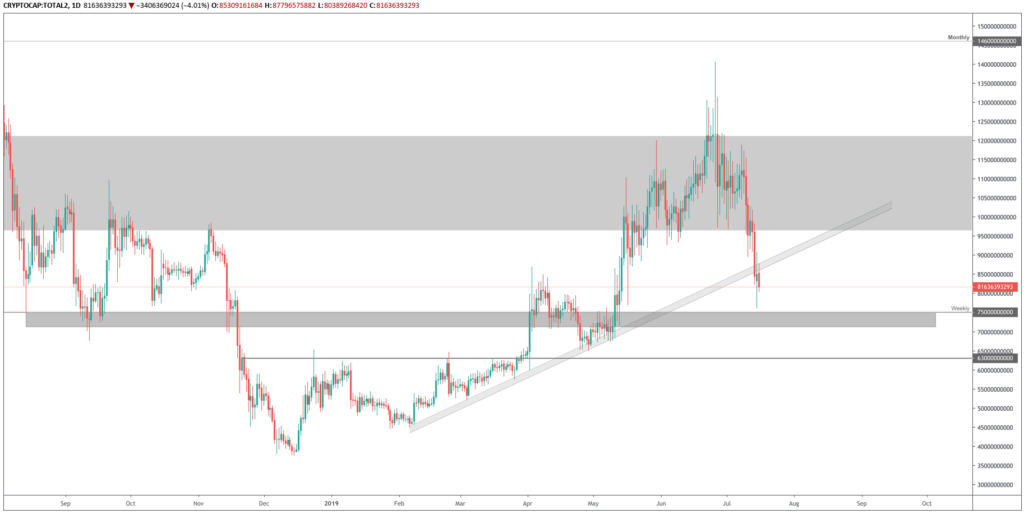
As the Bitcoin Dominance is reaching new yearly highs, the total market cap is more influenced than ever by Bitcoin. As a result, to have a clear image of the state of Altcoins we need to seek information in their own market cap chart.The daily chart has broken the supporting trendline, retested it and is sharing the same vision of further downside with the total market cap. As many Altcoins have revisited their accumulation zones, downside isn’t very deep. The next support is between [$72B-$75B] confluences with the total market cap’s $240B. This scenario’s invalidation point is simply a daily closure above the trendline where we could see further upside.
It’s worth noting that the area differentiating bullish and bearish territory on high timeframes for the Altcoins’ market cap is [$95B-$120B] and we are yet to cross it and close a daily candle above with conviction.
Recommended from Cryptonary


