Save 23% ($351) & Get a Free 1-1 Call with our Team ⏰ : 0d 2h 59m 44s
Total MCap Update - Bullish trend confirmed?
Looking at the weekly (mid-term) timeframe, we can see where the Total MCap found enough liquidity to shift the trend; [166B-176B]. Since then, PA was able to reclaim 216B and close two weekly candles above it, the last one showing good buying pressure on a retracement, which further more confirms the trend. Until now we have likely seen a new higher low. The next level we’ll look for to be reclaimed is 246B, by a weekly closure above it. The latter will fully break the LH-LL (lower high-lower low) structure; the definition of a downtrend.
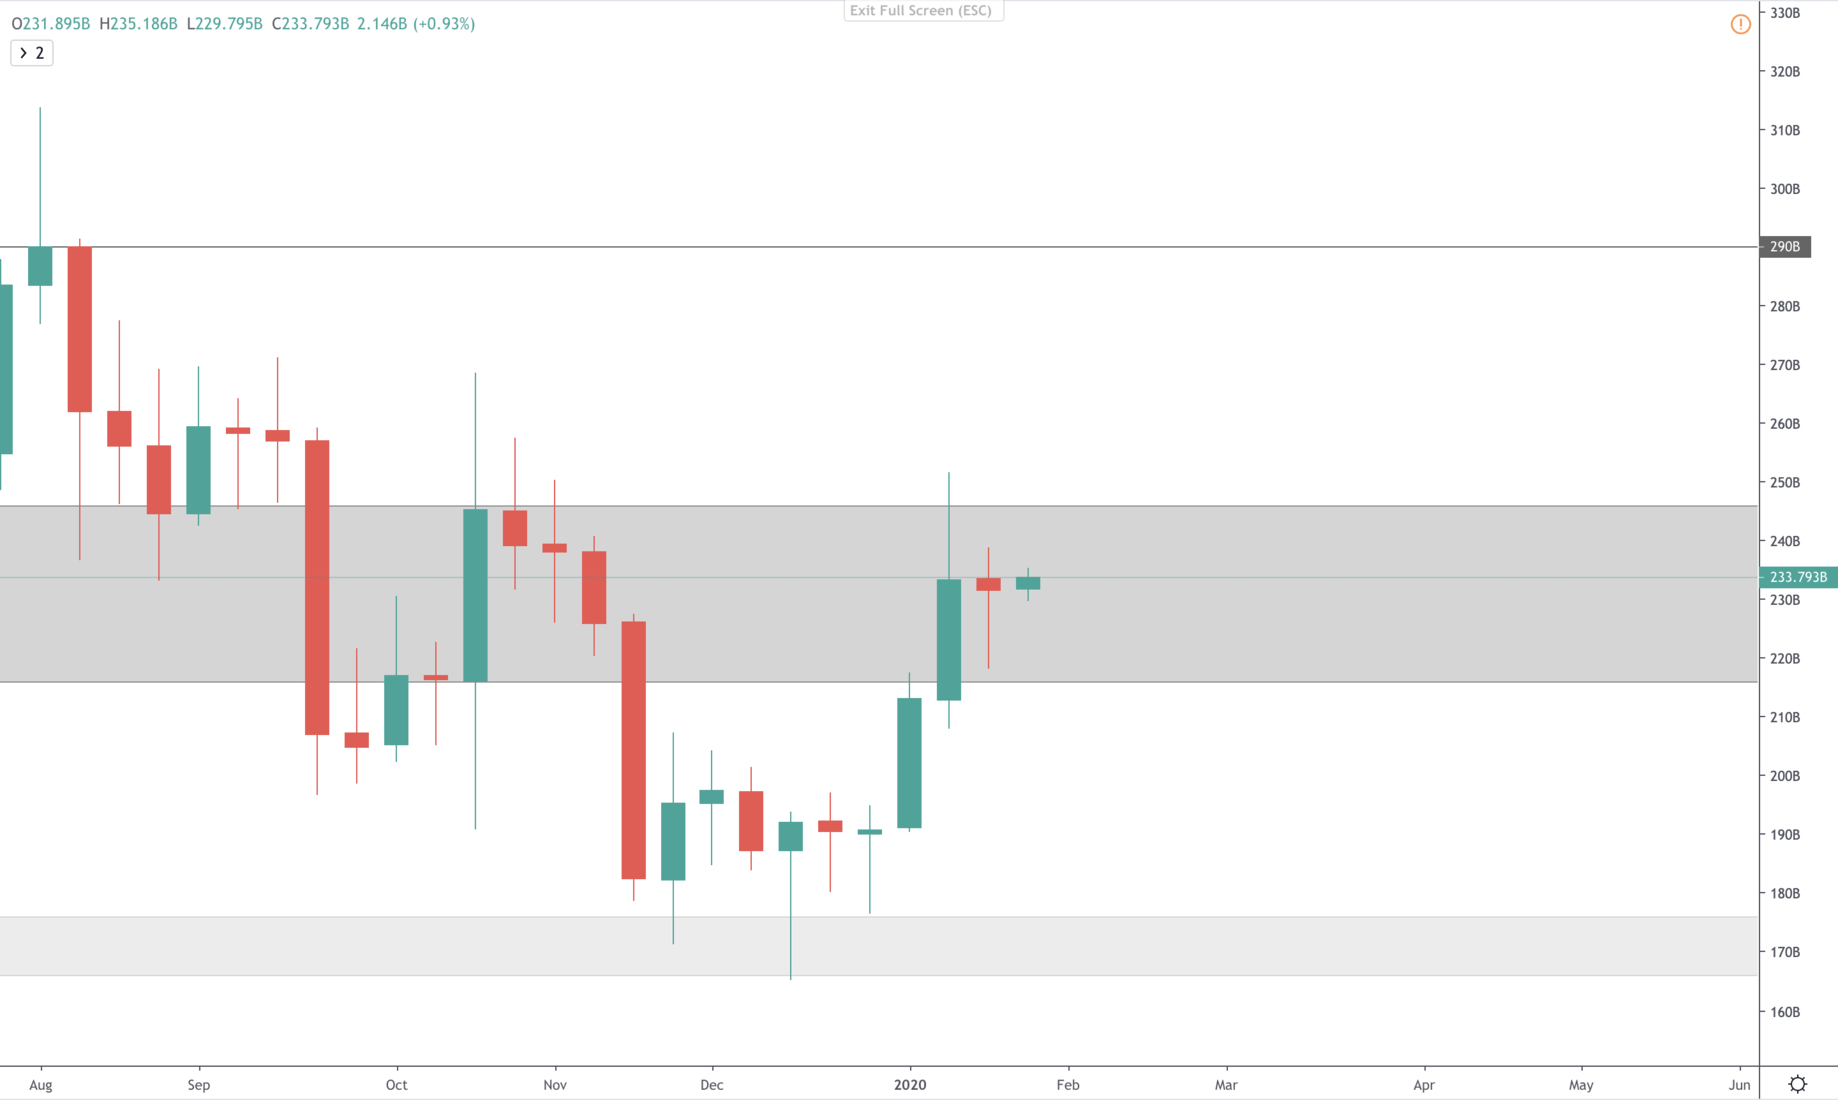
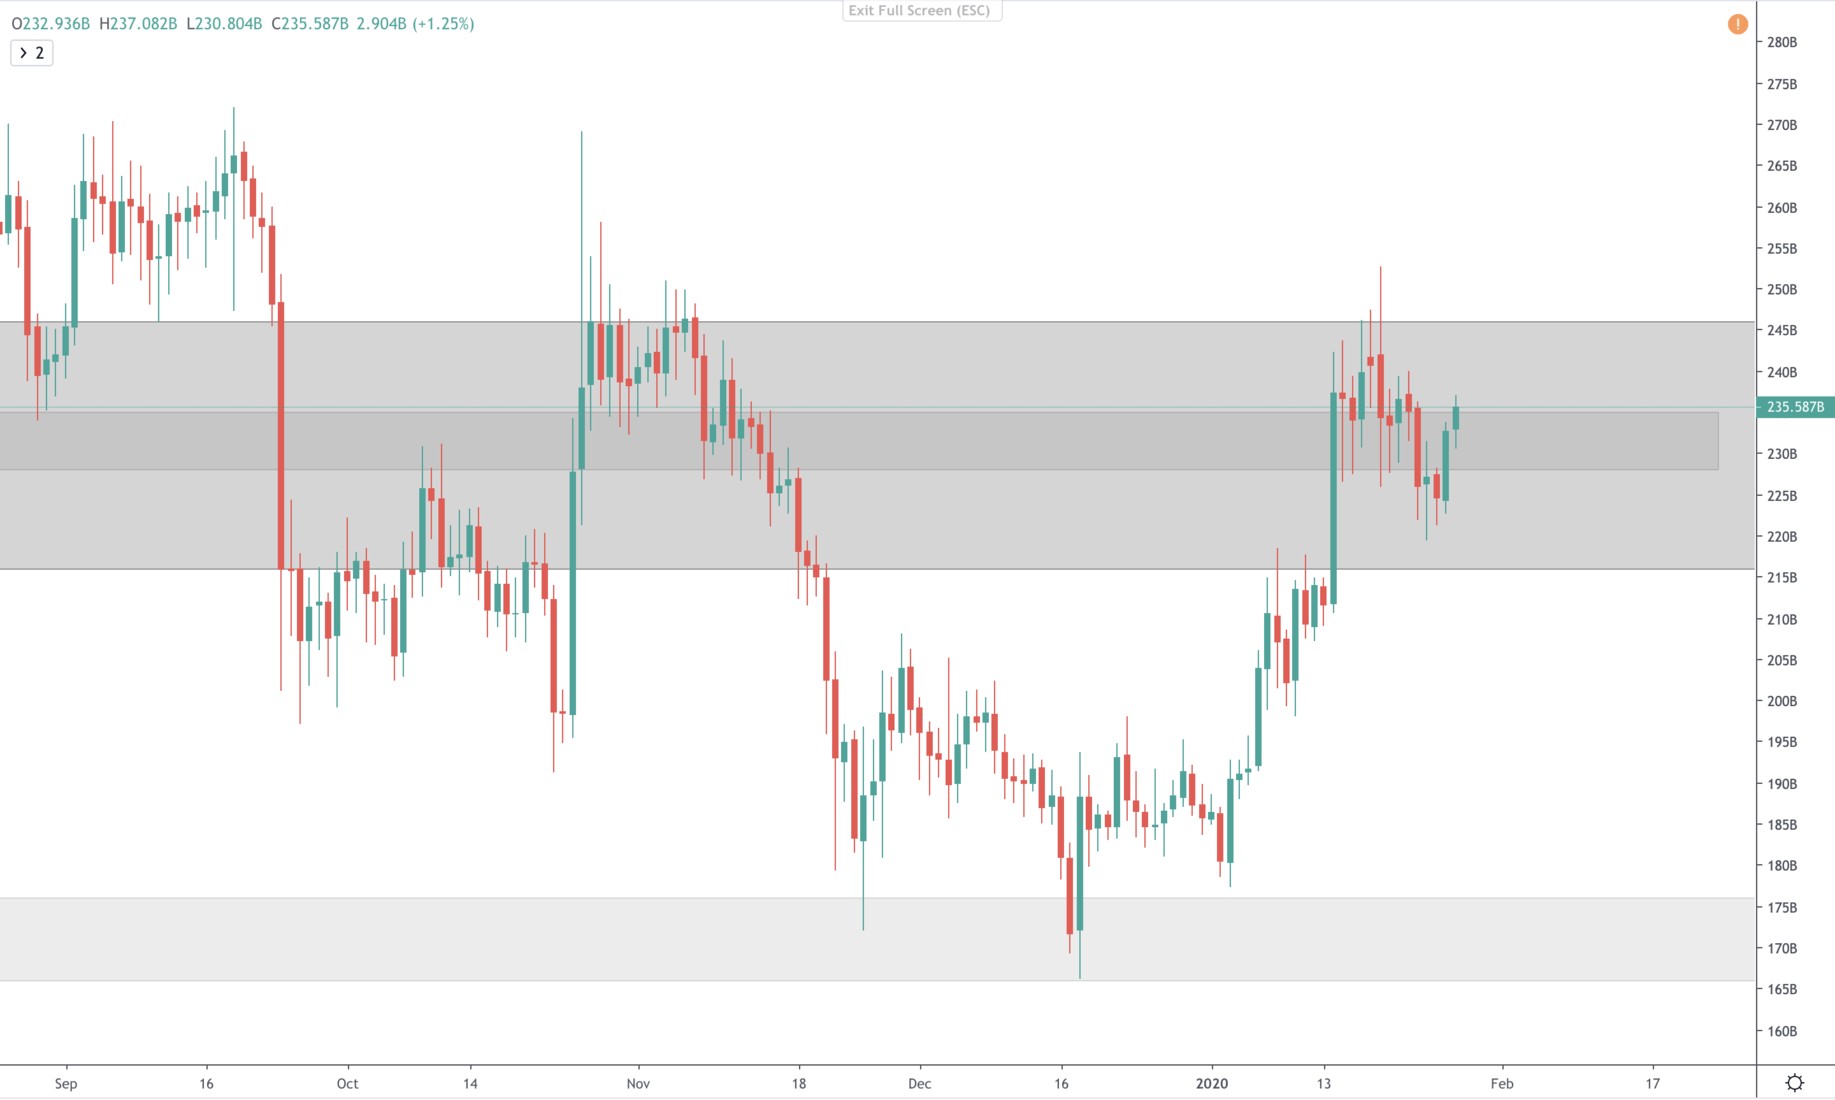
Now taking a look at the daily (short-term) timeframe, we can see PA clearly rejected 246B, broke down below 228B but was able to reclaim it in a couple of days. For another test of 246, we’ll first need a daily closure above 235B. If and when 246B breaks, the next target would become 290B.
The reason we monitor the Total MCap is because it gives us the clearest image, especially when other assets’ PA is choppy and unclear. These levels, can be mimicked on particular digital assets, especially large caps; it wouldn’t work as well on small caps.
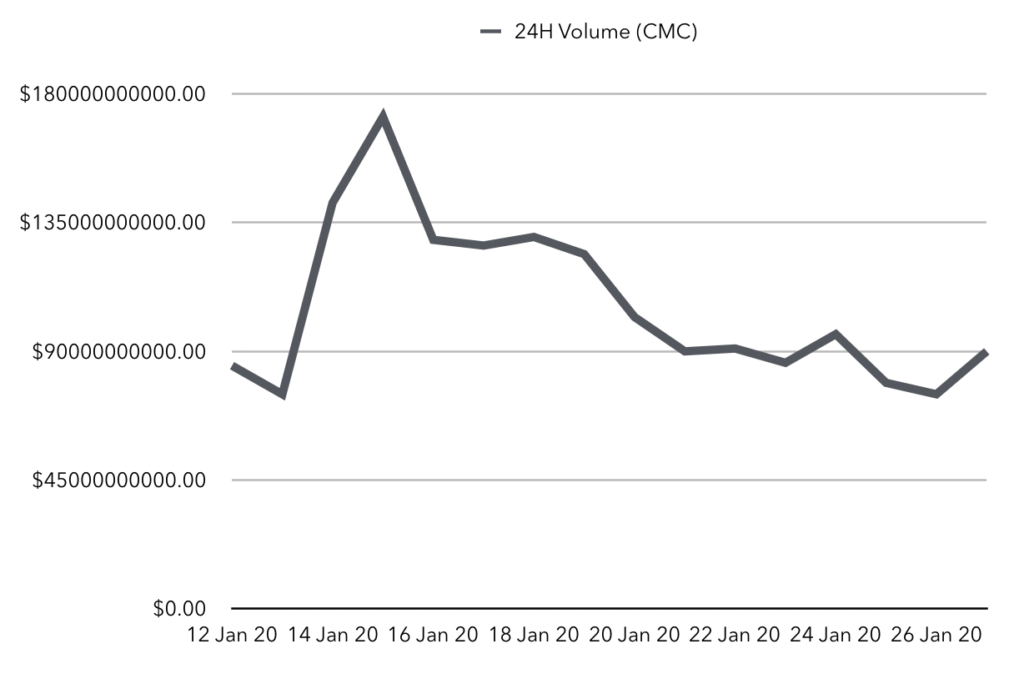
Another very important factor to take into consideration is the volume. The particular number differs from one source to another (Messari's 24H volume is around $11B), but the number itself does not matter. What we look for is a relative increase/decrease in volume. In a bullish trend, what we'd like to see is an increase in volume during upswings and a decrease during pullbacks. That's what we have here.
Recommended from Cryptonary


