Save 23% ($351) & Get a Free 1-1 Call with our Team ⏰ : 0d 2h 59m 44s
Tracking the winners: Which token will break out next?
Hey traders, it's Cryptonary back again with our weekly watchlist report. This week, we're looking at some of the major cryptos, like BTC and ETH, and a few altcoins that have been making moves lately, like SOL, LINK, RUNE, and ARB.

Overall, the market is in an interesting spot right now. BTC is testing some key resistance around $27k, which could determine if we get a bullish breakout or rejection backdown. Meanwhile, some Alts are showing relative strength and breaking local resistance levels.
As always, we'll look at key technicals like price action, RSI, and funding rates. We aim to find the best risk/reward setups for potential longs and shorts. Some coins have better trading opportunities than others this week, so we'll call those out.
Alright, let's dive in!
TLDR 📃
- Bitcoin facing critical test at major resistance level - which way will it break?
- Ethereum is showing relative strength against Bitcoin - will it continue?
- Solana bounced off support - can it take out overhead resistance?
- Chainlink hit our target, but watching for a shift in momentum
- Thorchain's surge tempting a short despite some mixed signals
- Arbitrum approaching its moment of truth after breaking out
Disclaimer: Not financial or investment advice. You are responsible for any capital-related decisions you make, and only you are accountable for the results. “One Glance” by Cryptonary sometimes uses the R:R trading tool to help you quickly understand our analysis. They are not signals, and they are not financial advice. Any capital-related decision you make is your responsibility and yours only.
Trading BTC | Bitcoin

BTC - we are sceptical here. Some contrasting signals.
Technical analysis
As expected in our last few watchlist updates, we suggested BTC would try to move higher and test the $27,100 horizontal resistance, which we now have.
There is confluence with the downtrend line as a resistance at this price point also, so this adds to the resistance that BTC will now need to break above.
RSI
The RSI is clean here. We're at 57, which is neutral territory, and BTC’s price has put in a lower high so far, while the RSI has done the same, so no bearish divergences here or even looking like they'll form.So that's positive, knowing this shouldn't be a worry on the short-term horizon. This is the main thing that goes against the bearish view.
Funding rates
The funding rates are negative, although only slightly. However, this does tell us that shorts are now paying longs. Yesterday, the funding rate was positive, and there was a huge increase in Open Interest (the amount of leverage being taken).
So, this leverage that was built up yesterday was likely powered by longs, while we've had more shorts build up over the last 8 hours or so. This move has reset the funding rate to more neutral levels. Of course, the current level is slightly negative, which will likely continue fluctuating. We have tagged a chart showing yesterday's large increase in Open Interest.
Liquidation levels
Looking at the liquidation levels, we can see there isn't much above us regarding liquidations.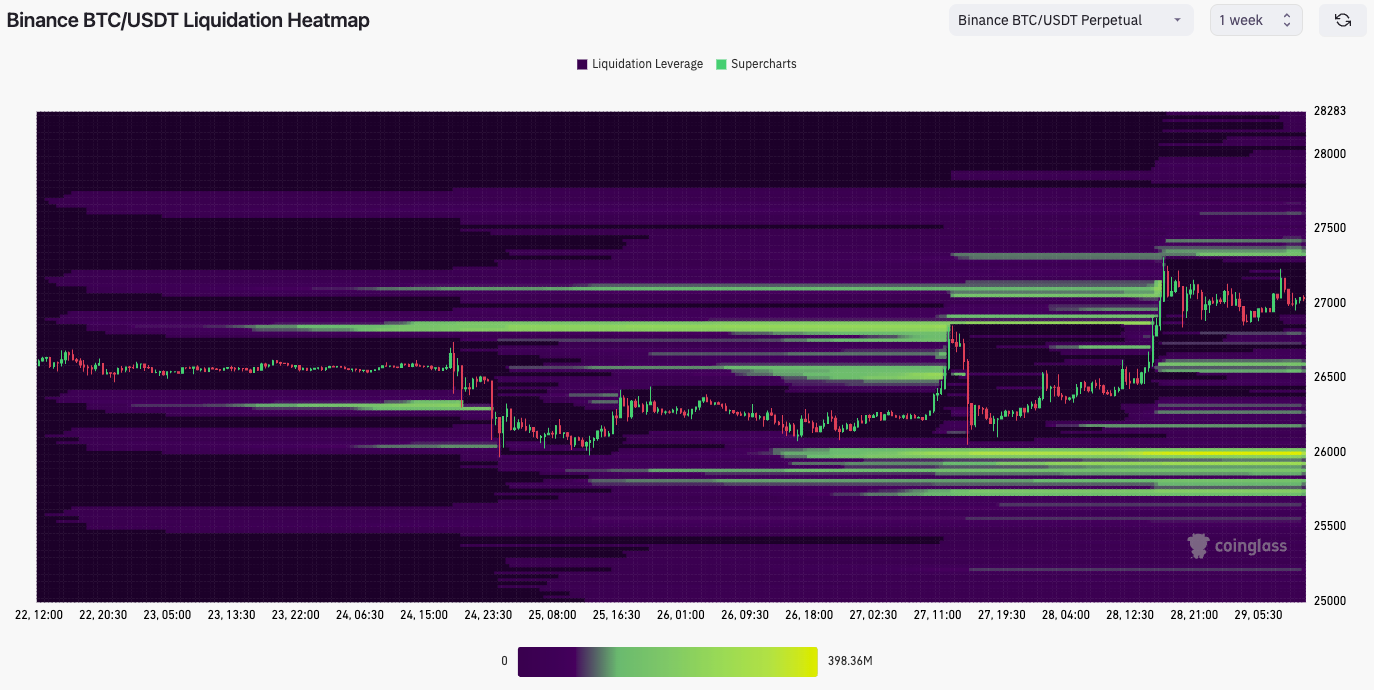
There are some short liquidations at $27,300, but not large in terms of the amount of USD that would be liquidated. Where a lot of USD could be liquidated in leveraged positions at the $25,700 to $26,000 level, these are longs.
Conclusion on trading BTC
We see on Twitter that there's quite a lot of excitement about this move-up, and perhaps that's been driven by some of the Alts doing well. However, we are sceptical. We're at a more major resistance while many longs were taken out yesterday. Also, the current move hasn't been driven by Spot buying, which is usually not a positive sign.Market makers will likely look at this and want to get BTC’s price to $27,300 and liquidate those shorts. And then, they'll likely sell spot BTC to drive the price down to $25,700 from $26,000 to try to liquidate the longs.
Overall, this is really mixed here, but we don't share in the enthusiasm that BTC will go substantially higher. we can always be wrong, but we side with seeing BTC reject and go lower from here.
Action
Personally, we are doing nothing, and we are not looking to trade this current setup as there are too many mixed signals that don't clearly outline a specific direction for BTC's price to travelTrading ETH | Ethereum

Price action-wise, ETH has certainly moved better than BTC has.
Technical analysis
We’ve had a good breakout of the red downtrend line, and now we've breached above the $1,660 local horizontal resistance. This has shown real strength, but it's important we get a good daily candle closure above the $1,660 horizontal resistance.
This will enable/fuel a follow-through, which could see more volume come in, which in turn should drive Eth’s price higher. $1,745 is the next major overhead horizontal resistance.
RSI
Eth’s RSI is similar to BTC in that we've got a higher high in price and a higher high on the oscillator, while the RSI sits in a relatively neutral territory of 59. So again, this is positive and could help see more upside price action, assuming BTC doesn't sell off and bring the market down with it.Funding rates
Funding rates are extremely mixed again. The past few weeks have seen widely varying funding rates among the different exchanges, which is usually uncommon.ETH here is slightly positive on the more major exchanges (Binance, ByBit, and Bitmex) but not full-blown 0.01% positive (currently around the 0.003% level), so there's potential for more upside here price-wise.
Conclusion on trading ETH
If BTC can hold up and not get a bad rejection from $27,100, then we think ETH can continue higher here. $1,700 is a likely target, with $1,745 also doable.Action
For now, we are not doing anything; however, for the more degens among you, a plausible trade might be to Long a retest of $1,650 - $1,660 (layer orders in there). We would want to see the price come down and retest that price level, close a candle there to show it's holding as support, and then move on higher from there.Trading SOL | Solana
We saw a nice bounce from SOL, and we're now getting into the main testing territory.
Technical analysis
A beautiful bounce from the local horizontal support of $19.11, which we identified as a key local support area in our prior watchlist.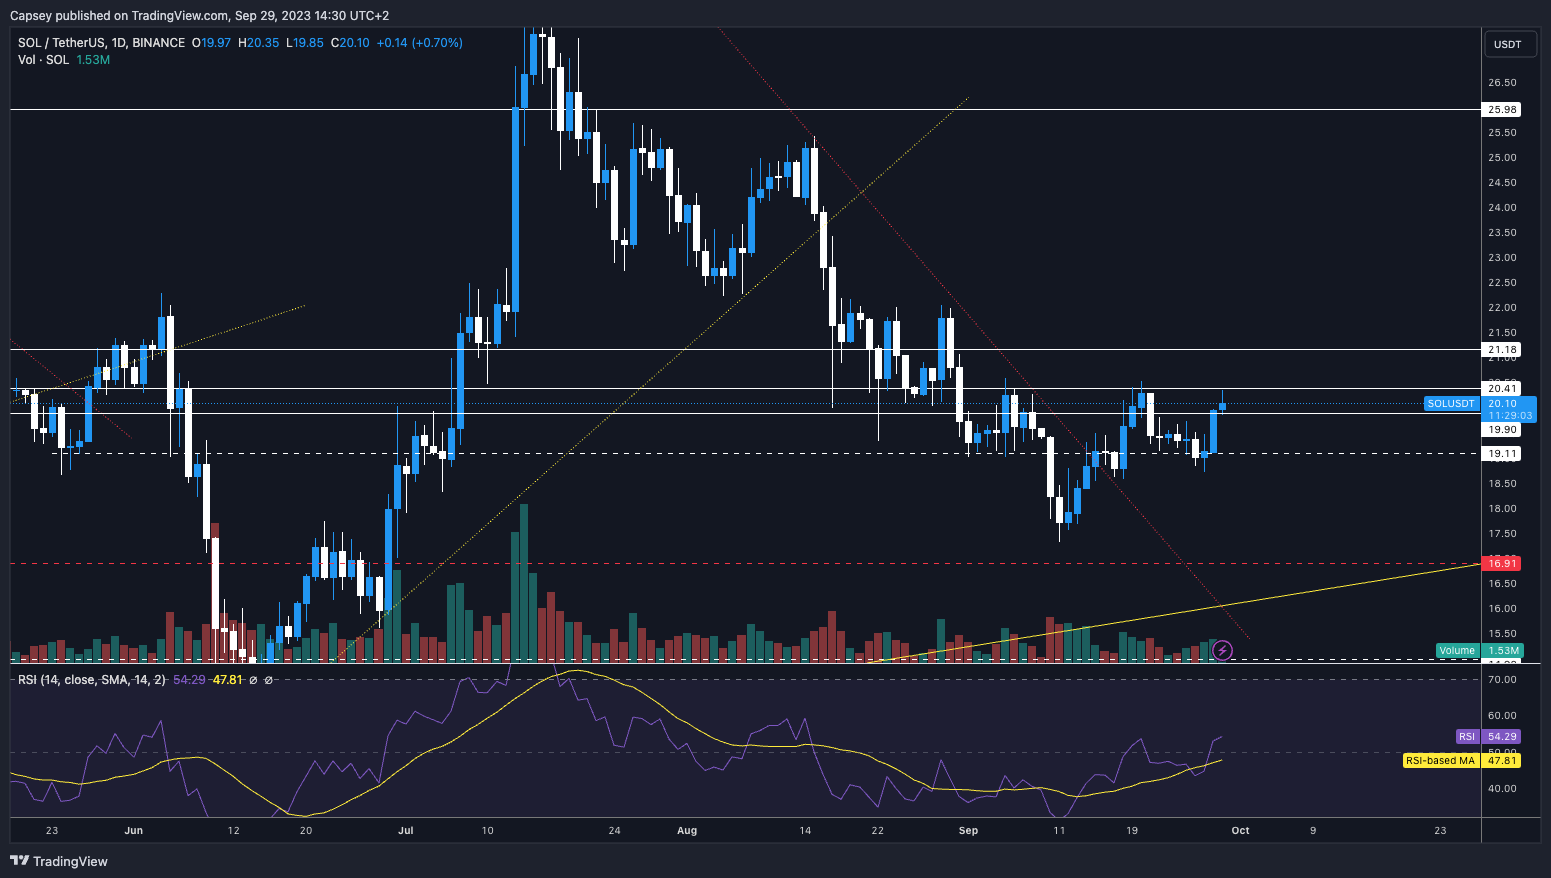
We have also outlined the $19.90 to $20.40 area as a major resistance point for SOL. It's positive that we're above $19.90, although we have initially rejected the $20.40 horizontal resistance.
Going forward, we need to see SOL hold above $19.90 and hammer that in as the new support. If we get this, this would improve the chances of another retest of $20.40 and potentially breaking above that.
RSI
SOL on the RSI isn't similar to BTC and ETH, unfortunately. The positive is that the RSI is in the middle territory at 54, so there is still room for more upside – we're not anywhere near overbought levels. But, the negative is that the RSI is creating a higher high while the price is creating a lower high. This is a hidden bearish divergence, and this might provide some headwind for SOL going higher.Funding rates
Funding rates are mostly negative, so the market is net short here, with shorts paying longs that premium to be short. The funding rate isn't ridiculously negative, though, so if we do get some whip-sawing in price action, this could shake some traders out and reset the funding rate So, we wouldn't be overly worried with this current funding rate.Conclusion on trading SOL
We feel that SOL can try to test higher here, as it can be fuelled by the rest of the market doing okay, i.e. If BTC can hold in and around $27,100, then ETH can probably outperform.If ETH outperforms, this can pull SOL up with it. our worry is that major horizontal resistances are overhead at $20.40 and even more so at $21.18. So, when we look at the potential Long here, we ask ourselves: is the upside of 6% worth the downside (very possible still that SOL retests $19.11 - a 5% decline)? Is the risk/reward worth playing? we don't think it is.
Action:
As mentioned, we don't think this play is really worth it. If we were desperate to trade, ETH looks to be the better/more viable setup, in our opinion.Trading LINK | Chainlink
Looking back at Wednesday's Watchlist, we got this pretty spot on. We got a nice move into the low $8's, where it got rejected exactly off of the horizontal resistance, almost perfectly to the price level.
Technical analysis
Wicked move up that we also thought would continue until the main horizontal resistance of $8.07. We've now initially perfectly rejected this resistance and have pulled back a tad.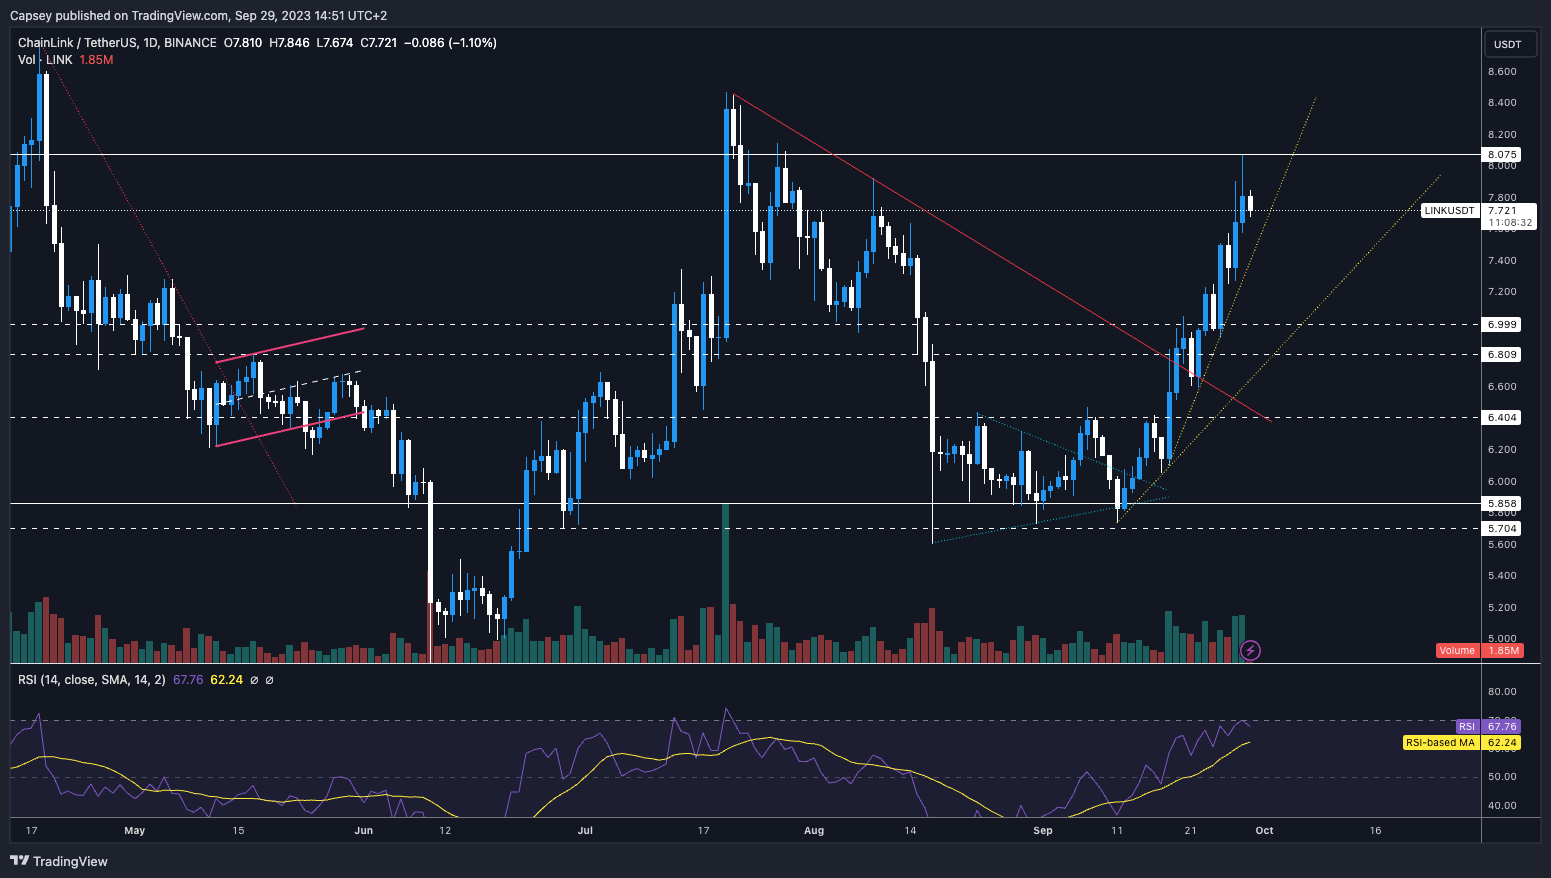
Again, if BTC can hold in and around $27,100, then we think LINK could have a slight reset into, say, the $7.50's before moving back up and retesting the $8.07 horizontal resistance again. This would maintain the local uptrend, but we think it would create bearish divergences if we get another move up to $8.07 (or possibly even slightly higher).
If we got the move back up and bearish divergences created, this would provide a good short opportunity. This is especially relevant if LINK can then break below the local uptrend line due to a bearish divergence being formed.
RSI
At 67, it is very close to overbought levels on the daily timeframe. On the 12-hour, we've been at 73. No bearish divergences have been created for the moment, but if we do get a bounce from the $ 7.50 back into the $8.07. We do think that’ll start the formation of some bearish divergence.Funding rates
Funding rates are again ridiculously mixed but mostly negative, so shorts are more prominent. If we can get a further move higher in price, this may wipe out a substantial amount of the shorts and, therefore, actually clean up some of the Open Interest, which would then re-favour getting short.It's important not to be trading on the same side as everyone else, if you are, most of the time, you'll be wrong. funding rates are good for indicating positioning and then taking the opposite side.
Conclusion on trading LINK
LINK is currently in a wait-and-see spot. If we get back to $8.07 and form some bearish divergences, then this would entice us to short it. However, we will re-assess at that time. We'll want to see bearish divs being created, the RSI in over-sold territory on several timeframes, and we'll want to see BTC at a resistance point. If we get all that, then we'll definitely be in with a short.Action
Nothing for now, but if we get the move back to $8.07 and the indicators I've outlined above align for us (as outlined above), we'll look for a short at $8.07.Trading RUNE | Thorchain
This is one indicator away from being a prime candidate for a short. The degens among you may still want to short. Let's dive into it.
Technical analysis
It has had a good bounce off of the $1.68 horizontal support that we predicted in Monday's Watchlist. We did expect it, however, to move into the $1.80 level and potentially find some resistance, but it's surged past.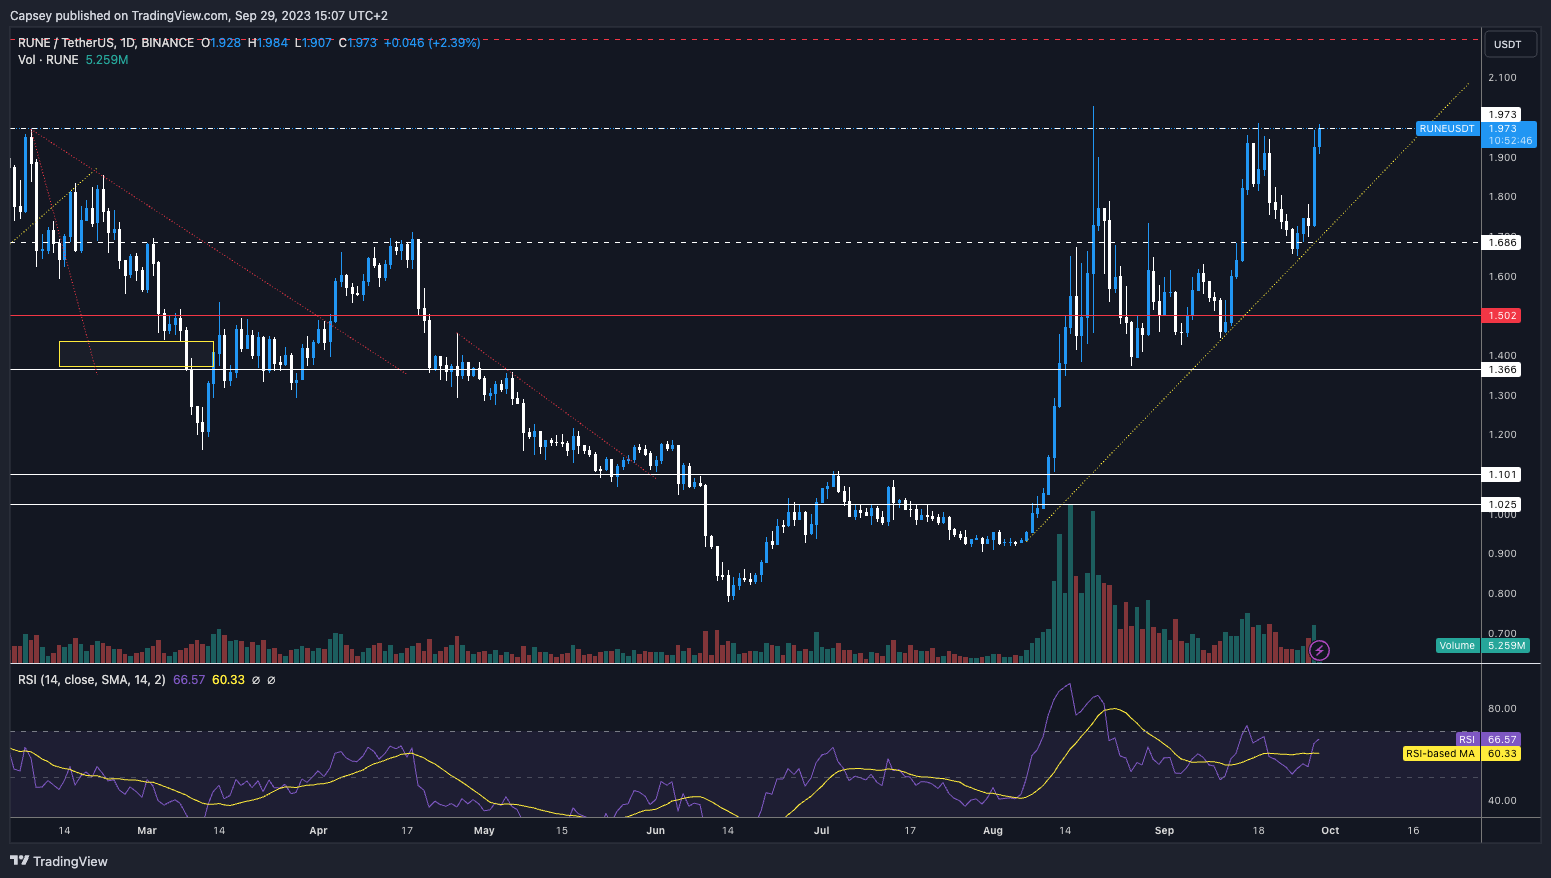
So this is a really good move. We are now at the overhead horizontal resistance of $1.97, which, over the past 7 months, has acted as major resistance. The next overhead resistance is at $2.19; important to be aware of this.
RSI
The TA looks set up for a short trade, but the RSI is slightly mixed. So we now have 3 higher highs in price and 3 lower highs on the oscillator, giving us back-to-back bear divs. Not good.However, the RSI on the daily timeframe is at 67, just shy of overbought territory. The 12-hour timeframe is at 70, so over-bought. Ideally, we'd want this to be in the late 70s (majorly over-sold) to really encourage us to short. This is the one indicator potentially letting us down.
Funding rates
Funding rates for RUNE across the board are 0.01% or close to, so this is being quite heavily longed.Conclusion on trading RUNE
We are very sceptical here. It's possible that there is enough momentum and buying power here that RUNE shoves higher to, say, $2.19 (the next horizontal resistance). This is especially valid if BTC can go higher or comfortably hold the $27,100 level. However, all the technicals suggest that this is the local top for RUNE.Back in our more degen days, this would have been a short we’d be playing at every opportunity. Our only slight worry here is the possible momentum that this has behind it. But we are very close and tempted to play a short here ourselves. Put it this way, you couldn't pay us to long this trade from the current price here.
Action
We are doing nothing here, but the inner degen in us is screaming at us to short this at the current horizontal resistance of $1.97. If we were to play the short, we'd look to fill some short orders at the current price of $1.97 with another cluster of short orders between $2.06 to $2.10.Trading ARB | Arbitrum
It’s had a nice breakout of the local red downtrend line, and it is now coming to a more major inflection point.
Technical analysis
ARB has broken out of the local downtrend and comfortably cleared above the $0.86 horizontal resistance.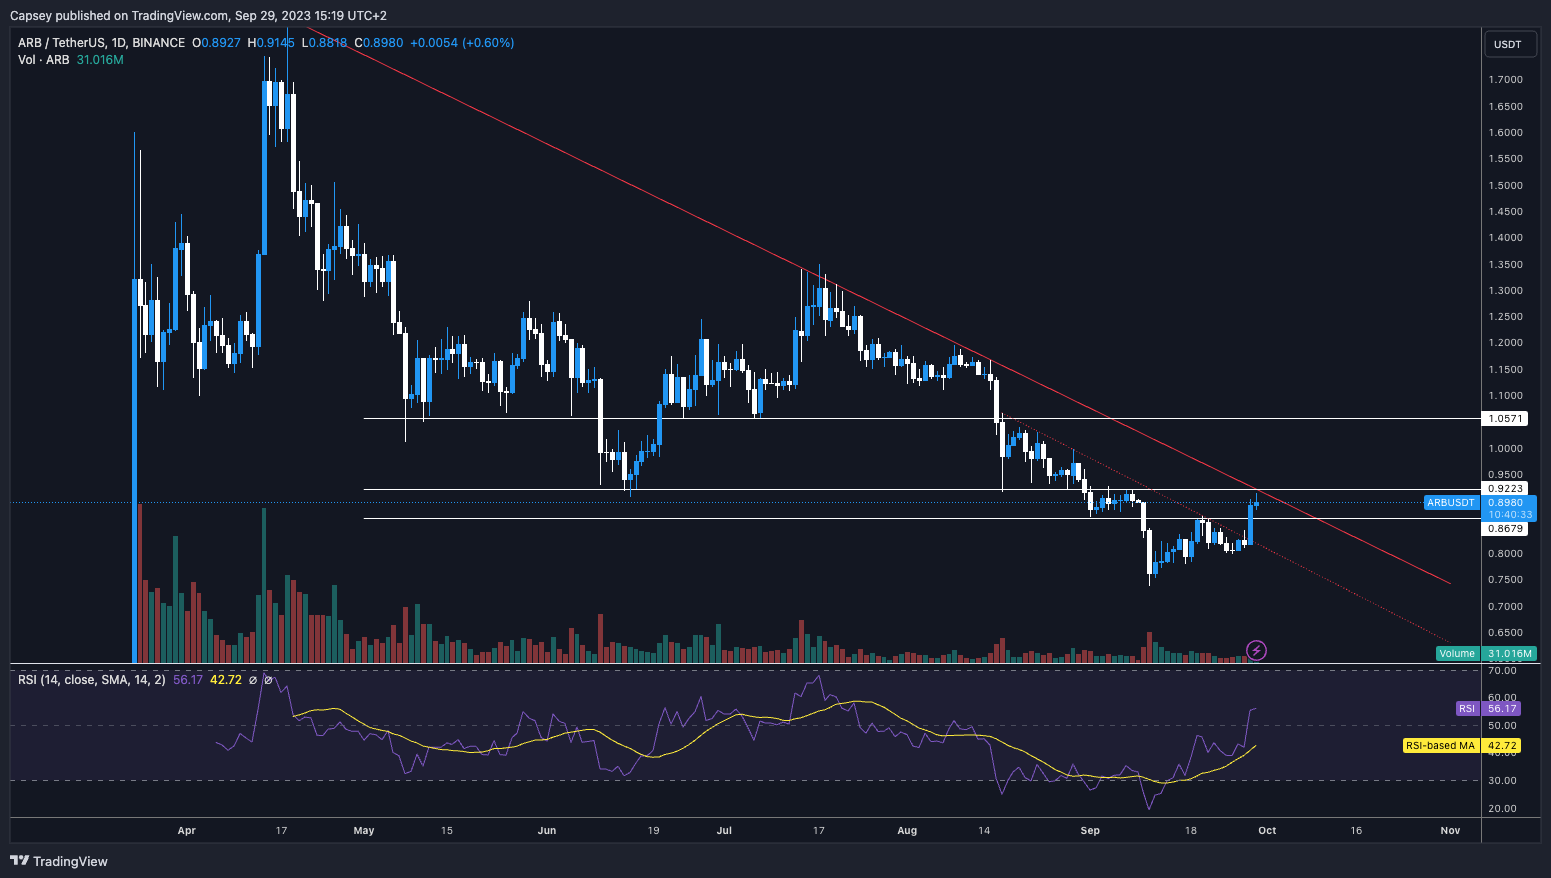
It's now moving into the more major resistance of the main red downtrend line and the $0.92 horizontal resistance. This is a big confluence of resistances in this zone, hence why we've probably seen the initial rejection on the first attempt.
RSI
On the RSI, there are no issues here. At 56 on the daily RSI, there’s still room for upside and no issues with any divergences. All clear here.Funding rates
Funding rates are mixed among exchanges but mostly positive at 0.01%. This is relatively healthy as funding rates go, and we think probably aids the theory for more upside.Conclusion on trading ARB
Having been right on most of this week's watchlists, we also have to say when things have surprised us, and we may be wrong.Our initial feeling in the week was that the $0.92 horizontal resistance may prove to be too heavy a resistance and that ARB could find it as its major rejection point. However, we have been surprised at how well ARB has broken out of the local downtrend line and how close to the $0.92 level (just 4% or so away) it is.
If this can prove us wrong and break above $0.92, we will look for a small breakout above $0.92 – a retest back to $0.92 – so flipping this area from resistance to support. If we get that, then it may be a good long from there. But only if it can break out, turn $0.92 from resistance into support, and close some daily candles above that level.
Right now, though, our theory still stands that $0.92 is a major resistance level, so that we wouldn't be opening fresh longs into this, that’s for sure. But, we also have to be aware that we could be wrong and, therefore, need a plan of action to get above and flip $0.92.
Action
Doing nothing here personally as we don't own any spot bags of this. Just watching to see how the price does in and around $0.92.Cryptonary’s take
And now, we’ve come to the end of this week’s trading watchlist. has been completed. The following coins have been charted:We received and analysed the trading potential of the following coins:
- BTC
- ETH
- SOL
- LINK
- RUNE
- ARB
We have covered other Alts that have moved significantly and now have some hype/momentum behind them. Just be careful with some of these; some are at major resistance levels and will likely need BTC to kick on for them to do the same.
As always, thanks for reading.
Cryptonary, OUT!
Recommended from Cryptonary


