Save 23% ($351) & Get a Free 1-1 Call with our Team ⏰ : 0d 2h 59m 43s
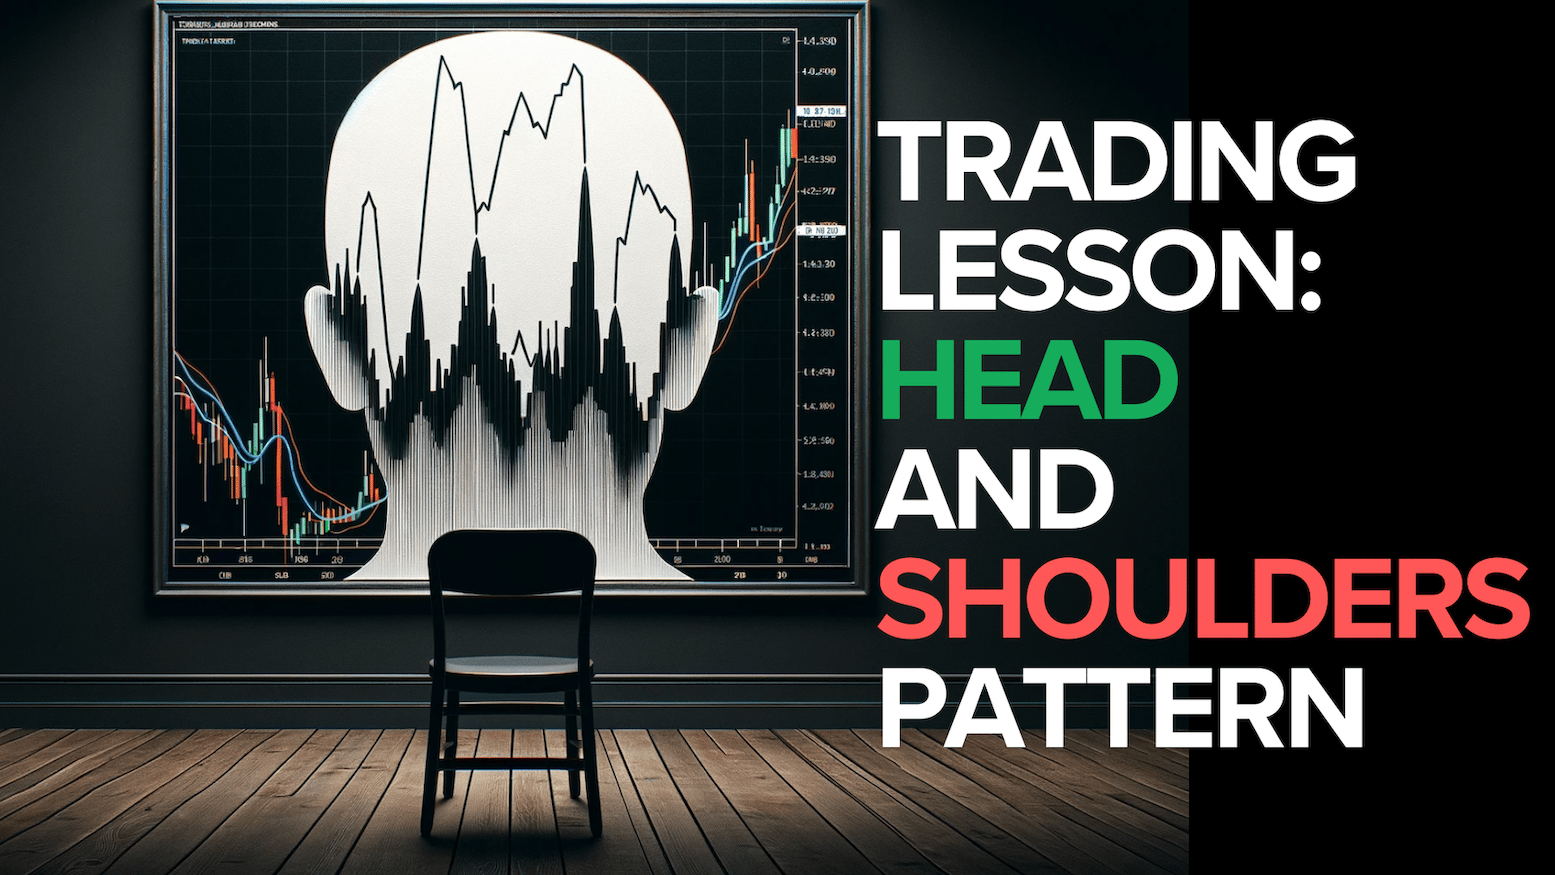
Today, we are breaking down a popular trading setup known as the head and shoulders pattern.
As we always say, the key to successful trading is an understanding of the psychological battle between buyers and sellers. This battle is often reflected in the price action. 📈📉
And human behaviour tends to rhyme over time, even with money on the line. 💰
Now, the head and shoulders pattern shows when a key resistance level is being respected.
First, price hits resistance and gets rejected down (the left shoulder). 🥺 Then it breaks through but quickly retreats back down (the head). 😵💫 Finally, it tests resistance again but gets rejected again (the right shoulder). 😤
It's like a fish sticking its head out of the water for too long before diving back under. 🌊
The bearish candlesticks clearly show the market's attitude about those prices - you must listen to what price action tells you!
We walked through a great example on the BTC daily chart (see video below)👇.
We used this same pattern in our recent Arbitrum trade idea, which was super helpful to see it play out live. 🎮
So, what’s the point of telling you about this pattern? 🤷♂️
Well, the idea is to give you a better understanding and more clarity as to why we make certain trading decisions. 💡
When you understand these core ideas, you can start spotting them yourselves; start marking up the charts yourselves, and you might even be able to start framing your own trading ideas.
Whether you trade or not, this knowledge will give you more clarity about the market.
Wishing you lots of good setups and winning trades ahead. 🤑🤞
Recommended from Cryptonary


