Save 23% ($351) & Get a Free 1-1 Call with our Team ⏰ : 0d 2h 59m 44s
Trading opportunities: FARTCOIN, PEPE, TRUMP, and XRP approaching key sell zones?
Over the past week, we've seen exaggerated relief rallies across both meme coins and major altcoins, with assets like Fartcoin, PEPE, Trump, and XRP all pushing into key resistance zones.

While short-term momentum remains intact, the broader structure suggests these moves are running into exhaustion. Liquidity remains thin, volatility is high, and most of these assets are trading into well-defined historical resistance levels.
The market environment - shaped by weakening macro sentiment and fading speculative appetite - continues to favour tactical short setups over bullish continuation. Each of these assets presents a clear opportunity to fade strength within structured frameworks, respecting the broader downtrend and capitalising on late-stage euphoria.
This update consolidates our outlook across all four names, with precision levels, momentum analysis, and execution strategy for each.
Fartcoin:
Technical analysis & market mechanics
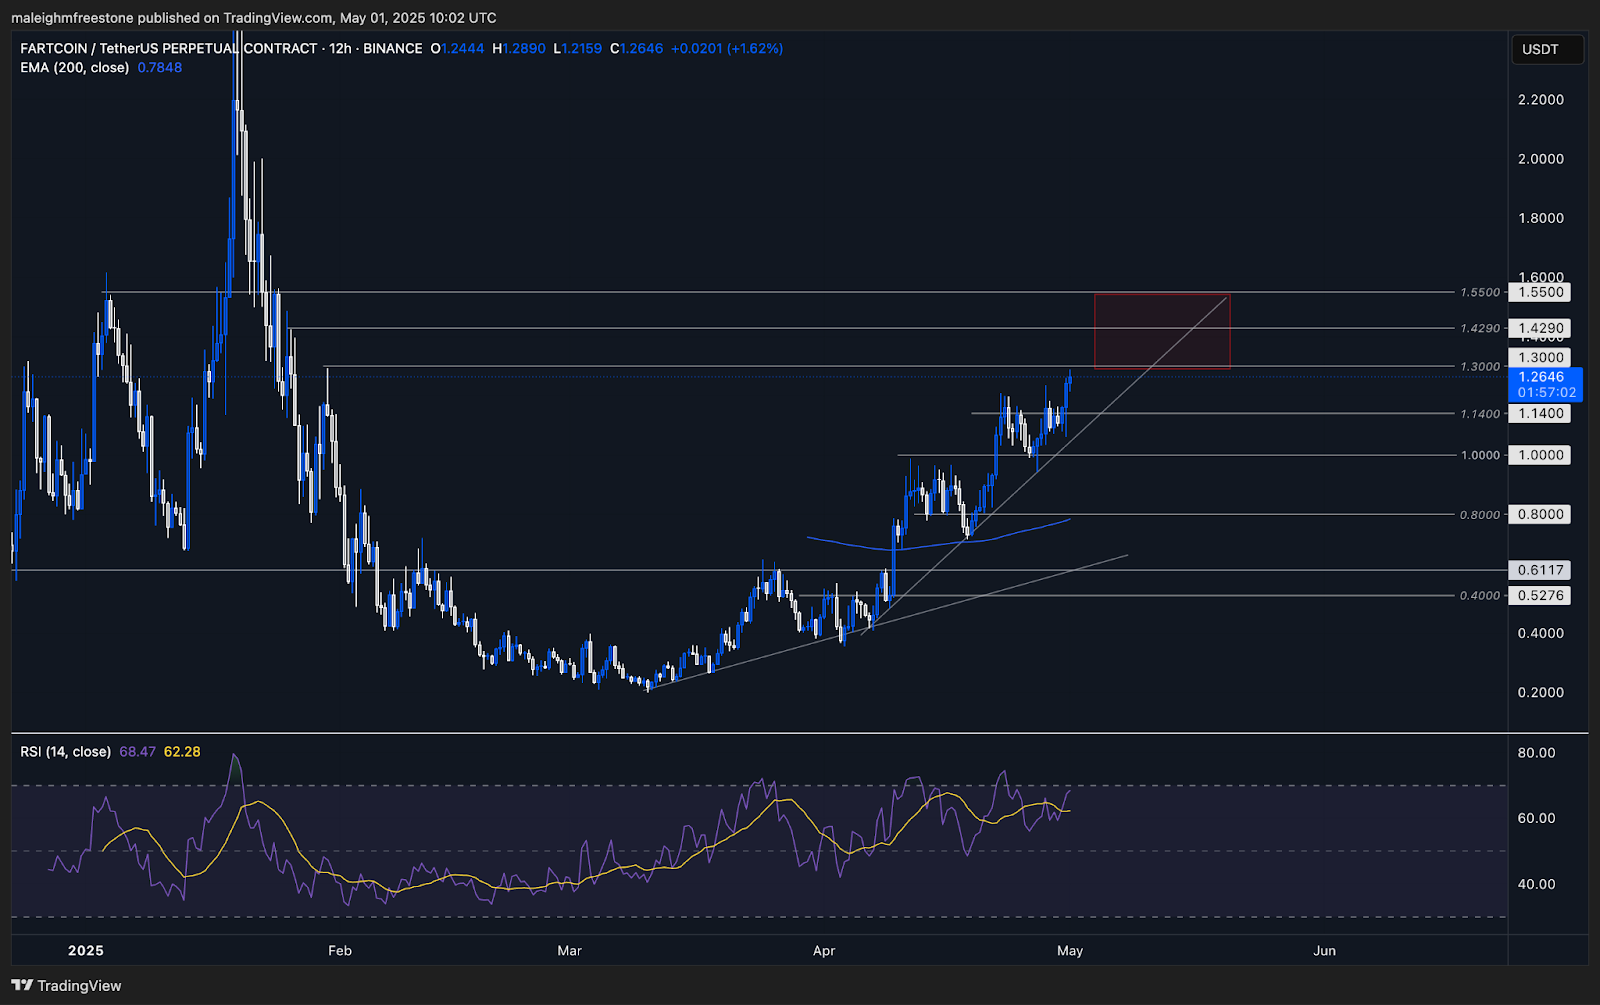
- Price is currently trading around $1.30, testing local resistance with strong upside momentum.
- $1.14 is now confirmed local support, previously acting as a resistance in recent consolidations.
- $1.429 is a key midpoint within the resistance range - aligns with price memory and prior sell-offs.
- $1.55 marks the upper resistance bound and acts as a magnet level if momentum continues.
- Price structure remains within a bullish channel, but the asset is overextended, increasing the probability of short-term exhaustion.
- RSI has room to rise - not yet overbought, which suggests upside targets may be reached before any reversal begins.
- Downside levels to watch: $1.00 - psychological round number and first support on pullback.
- $0.80 - deeper support, still within bullish structure.
- A steep support trendline is in play - a break of this line could shift the structure and initiate a broader move down.
- Next Support: $1.140
- Next Resistance: $1.300
- Direction: Bullish
- Upside Target: $1.550Downside Target: $1.000
Cryptonary's take
Fartcoin remains in an aggressive bullish trend, but the current price action is showing signs of overextension. Our strategy is to scale into a short position within the resistance zone: $1.30, $1.429, and $1.55, with a stop at $1.62 to allow space for a final momentum push. We expect these levels to be tagged before any reversal due to continued upside pressure.If price begins to break the steep trendline after filling, we'll be positioned early for a deeper retrace. Downside targets remain $1.00 and $0.80, both offering solid risk-reward exits while keeping the larger trend intact. This is a tactical exhaustion short - let price extend, then fade the move with clear levels and size discipline.
What's next?
You've seen the Fartcoin setup. The next three charts - PEPE, Trump, and XRP - reveal exact trigger zones and fade levels into exhausted rallies. One of them has a 40% downside risk if the channel breaks. Don't miss this timing window.PEPE:
Technical analysis & market mechanics
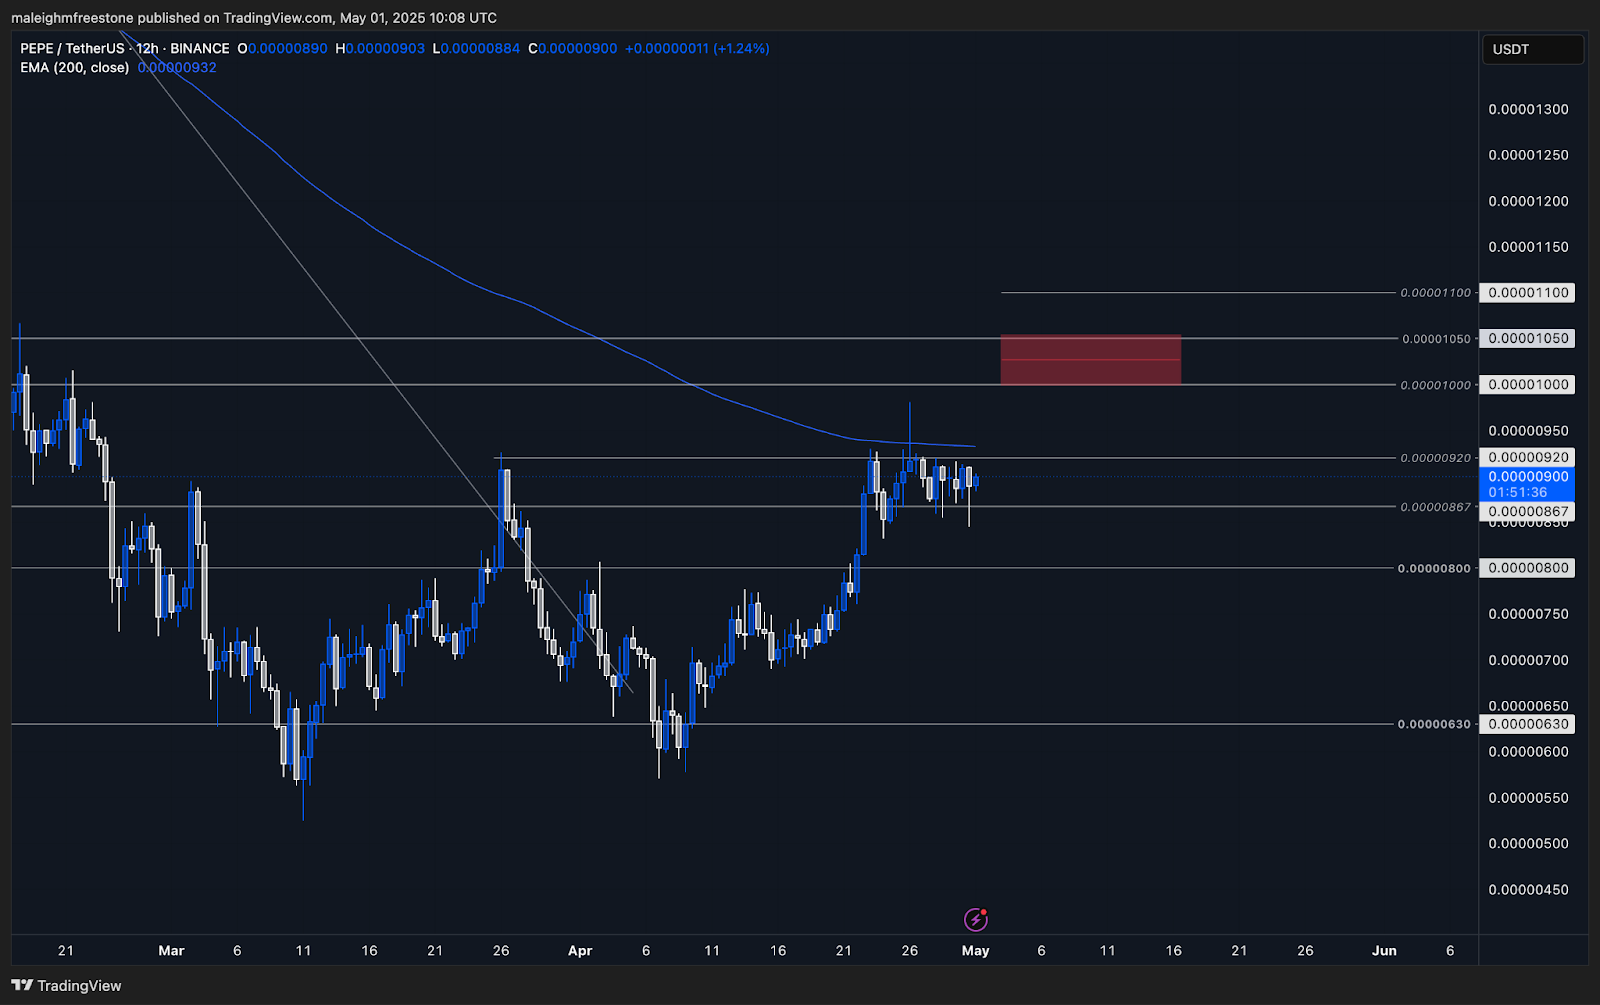
- RSI is currently at 59, trending upward with headroom before reaching overbought - the previous RSI top was on April 23rd, marking a recent local high.
- Local Resistance at 0.00000920 - capping current price action and forming the top of a tight consolidation range.
- Previous key resistance at 0.00001000 - 0.00001050 remains valid - historical rejection zone ideal for short positioning if price tags these levels.
- Local Support at 0.00000867, with 0.00000810 as the next support level - both providing reactive zones for short-term pullbacks.
- 200 EMA is overhead and unclaimed - PEPE is still trading below it, but price action is beginning to show a bullish tilt, with potential trend reversal.
- Macro double bottom structure formed - indicates a possible long-term bottom may be in place.
- Despite this, the current move is classified as a short-term relief rally, and the structure is still vulnerable to short-term weakness
- RSI has room to rise into the short trigger zone, creating an opportunity to fade strength before trend continuation.
- The downside target for any rejection is 0.00000800, a structural support with strong historical demand.
- Next Support: $ 0.00000867
- Next Resistance: $0.00000920
- Direction: Bullish
- Upside Target: $0.00001050
- Downside Target: $0.00000800
Cryptonary's take
PEPE may have found its macro bottom, but the current move feels like a relief rally within a broader downtrend. This is an opportunity to fade short-term strength with clear invalidation. We're positioning to build shorts between 0.00001000 - 0.00001050, targeting 0.00000800 on the downside.This would still leave PEPE in bullish structure, but offer a clean high-RR setup as momentum stretches. If we fill and roll over, we'll take profits at support. If momentum sustains and the trend shifts further bullish, we'll reassess for long exposure in the next major swing cycle. For now, the play is tactical - fade strength, secure downside, and remain flexible for larger trend confirmation.
Trump:
Technical analysis & market mechanics
- The price is trading around $13. $12 is acting as local support following a steep and overextended upside move.
- $15.73 is the next local resistance - marks the top of the current rally range and aligns with prior rejection.
- $17.62 is the secondary resistance - a historical pivot where price previously failed to hold.
- $19.50 is the upper resistance boundary level where exhaustion is likely based on past price behaviour.
- RSI is currently at 60, trending upward, indicating further upside potential before overbought conditions hit.
- Structure remains technically bullish in the short term but shows signs of weakening momentum.
- Trump remains a low-liquidity asset, which amplifies volatility and exposes it to sharp price spikes.
- Broader meme sector momentum is deteriorating, with similar assets rolling over from local tops.
- Key downside levels to monitor: $12 - local support, recently flipped and likely to be the first retest zone.
- $10 - psychological round number and structurally important level.
- $7.50 - deeper structural support from past cycle pivots.
- $6.00...
Recommended from Cryptonary


