Save 23% ($351) & Get a Free 1-1 Call with our Team ⏰ : 0d 2h 59m 43s
TRON and PEPE technical analysis: TRON targets $0.18, PEPE at $0.0000114
TRON shows bullish momentum, trading above $0.166 and holding key support at the 200 EMA, while PEPE consolidates near its trendline. Will these assets maintain their strength or face pullbacks? Let's dive into the details.

Disclaimer: This is not financial or investment advice. You are responsible for any capital-related decisions you make, and only you are accountable for the results.
TRON:
Overview
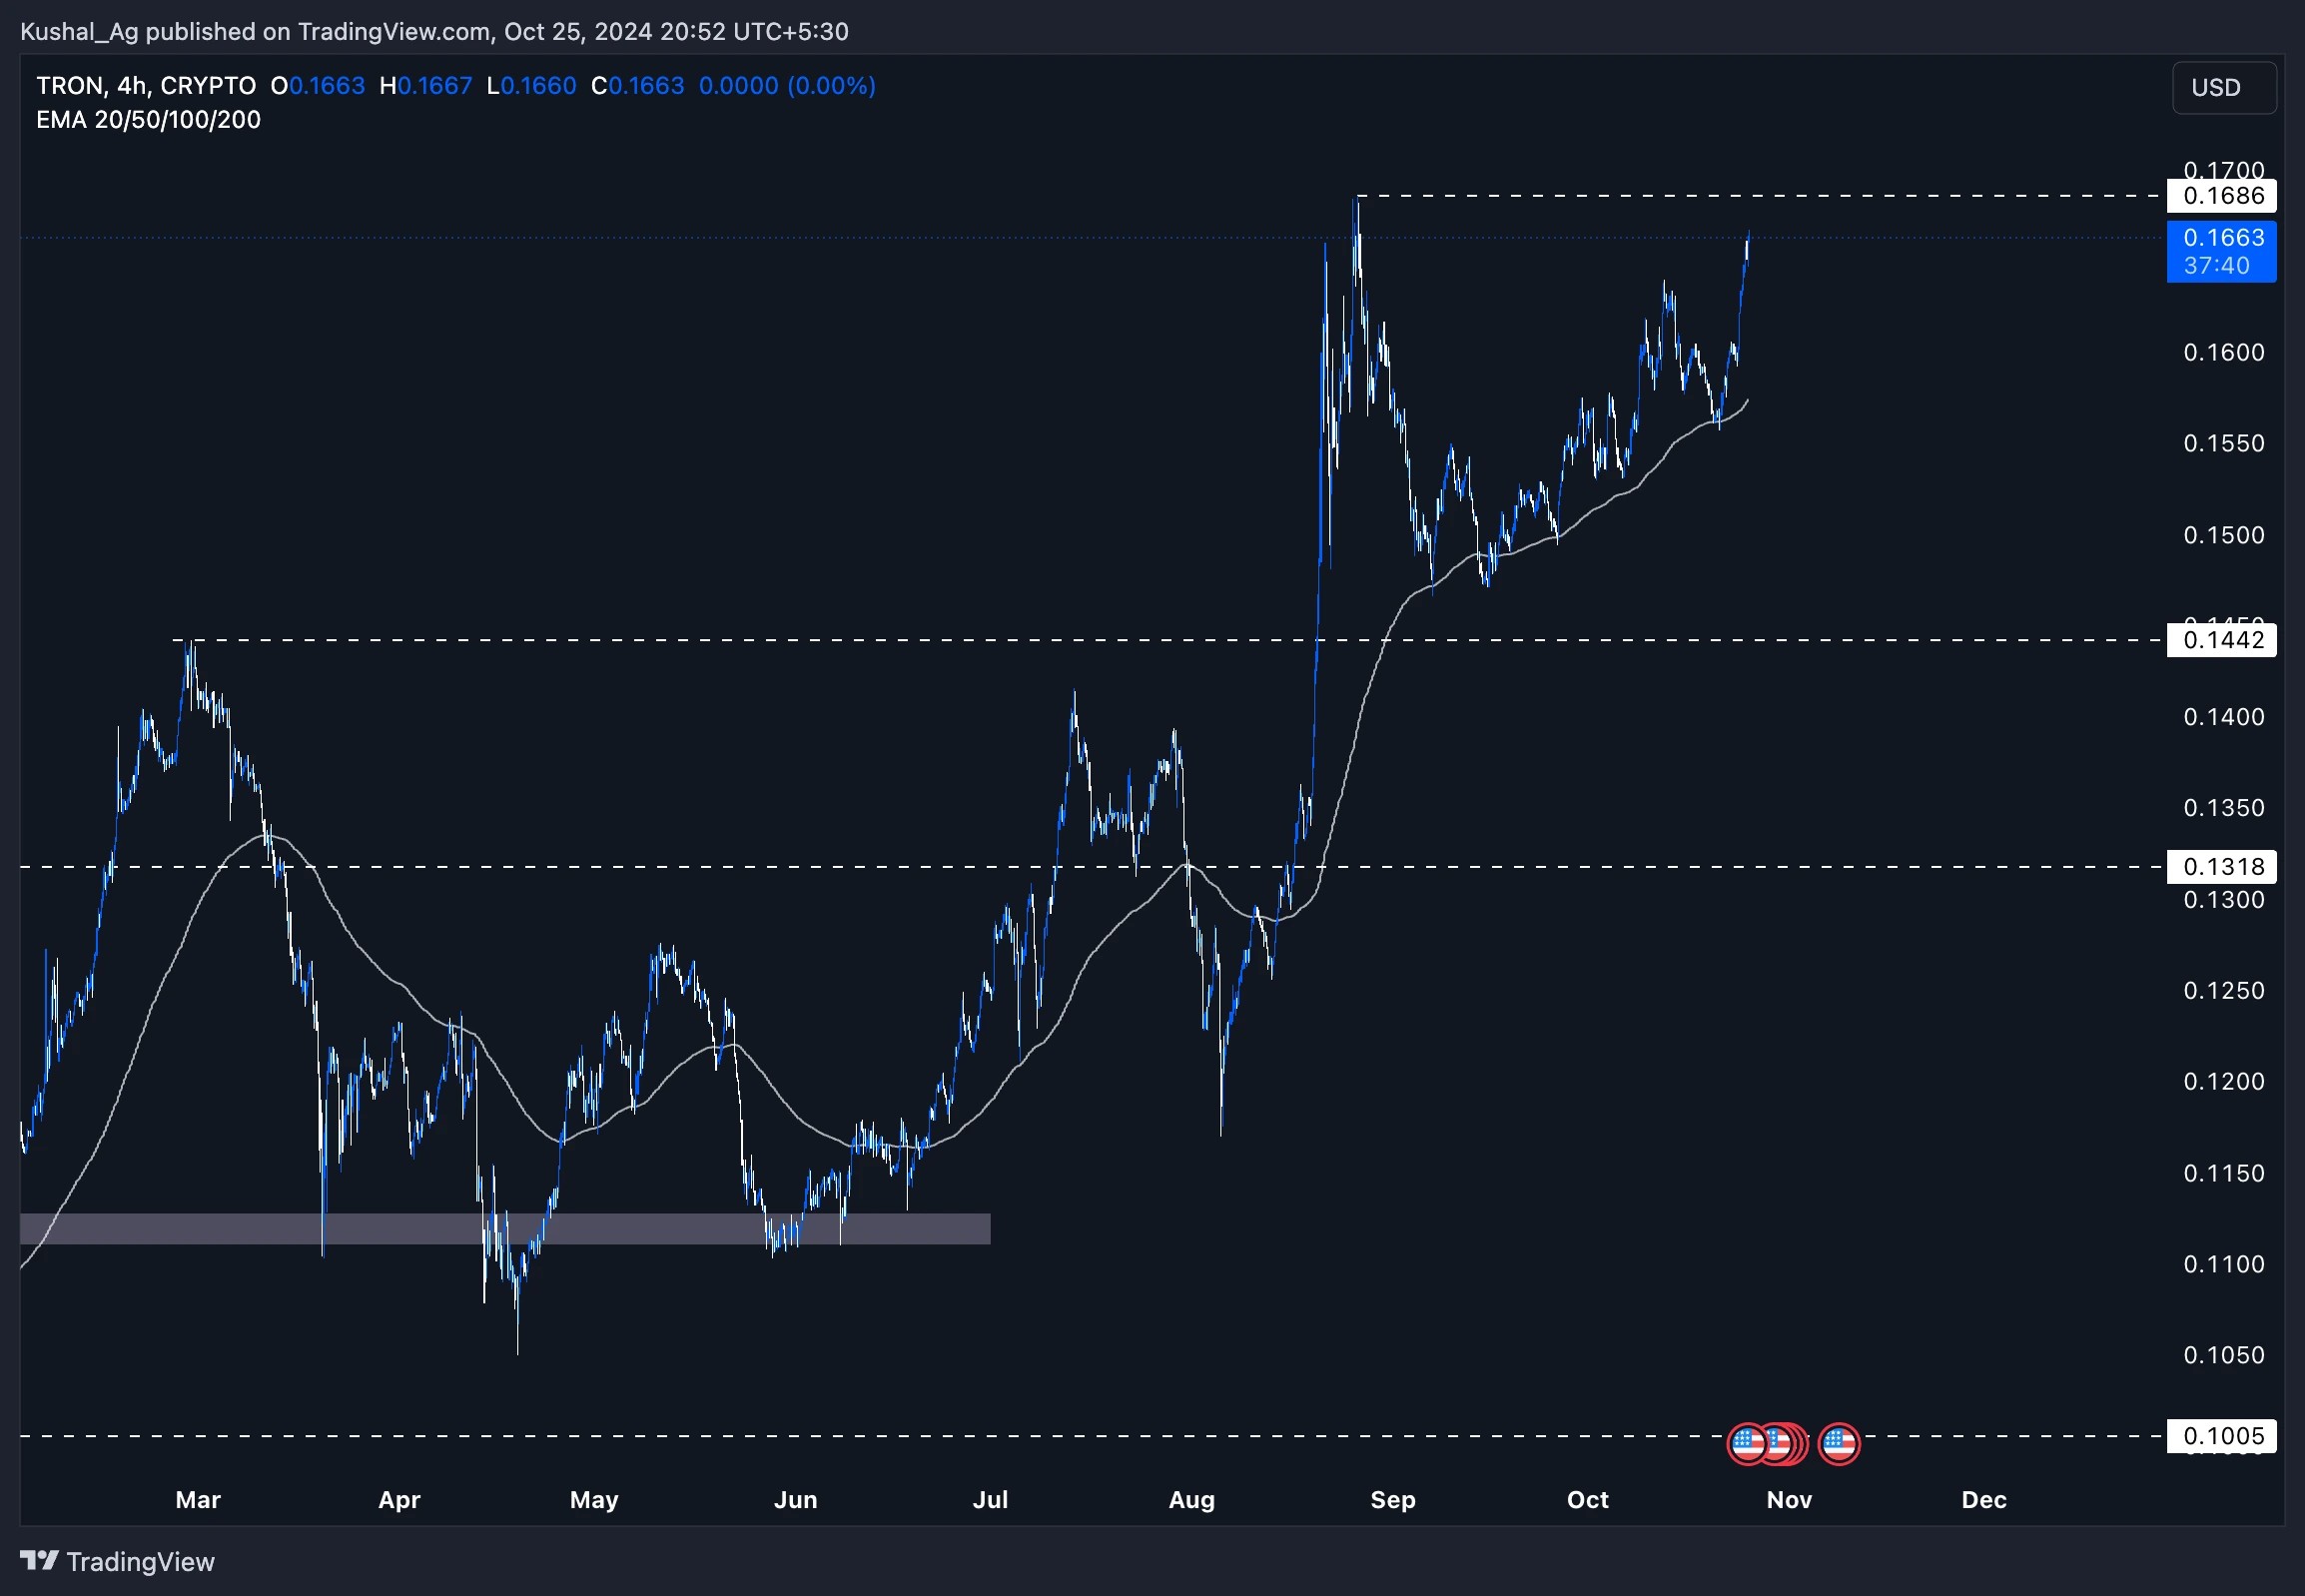
TRON ($TRX) has been displaying strength over recent weeks, outperforming many other altcoins in the current market. Trading at $0.166, TRON continues to hold bullish momentum and is trading near a significant resistance level. Given its structure on the 4-hour timeframe, TRON appears to be maintaining a clear uptrend, with key support levels that have reinforced its bullish movement.4-hour timeframe analysis
Since our last analysis, TRON has demonstrated strength by holding above the 200 EMA on the 4-hour chart. Around two weeks ago, TRON saw a pullback from $0.16 to the 200 EMA at $0.156, where it found strong support and bounced back. This 6% move from the 200 EMA has allowed TRON to break above $0.16, signalling continued bullish sentiment.- Current Price: $0.166
Immediate resistance
- $0.168 - This level marks a recent local high, presenting the next barrier for TRON to overcome.
- $0.18 - As previously identified, this is a notable resistance level for the short to medium term.
Support levels
- $0.157 (200 EMA) - Continues to act as a key dynamic support level on the 4-hour chart.
- $0.144 - Strong support level below the 200 EMA, offering further downside protection.
- $0.131 - Another critical support for TRON, providing a solid base if the broader market experiences a pullback.
- Higher Highs and Higher Lows: TRON's intermediate structure remains bullish, consistently forming higher highs and higher lows.
- Potential Price Action: Should TRON face rejection at $0.168, the 200 EMA at $0.157 will likely be a key support for a potential bounce. A successful breakout above $0.168 could propel TRON toward the $0.18 level, which would indicate stronger bullish momentum.
Cryptonary's take
TRON's price action on the 4-hour timeframe reveals a bullish structure reinforced by the 200 EMA support, making it an asset to watch. With momentum building and clear resistance and support levels in play, TRON holds potential for both short-term traders and those looking for medium-term swings.However, cautious monitoring is advised near $0.168 and $0.18 resistance levels. Should the wider market pull back, the $0.144 and $0.131 levels offer strategic support zones for accumulation.
PEPE:
Overview
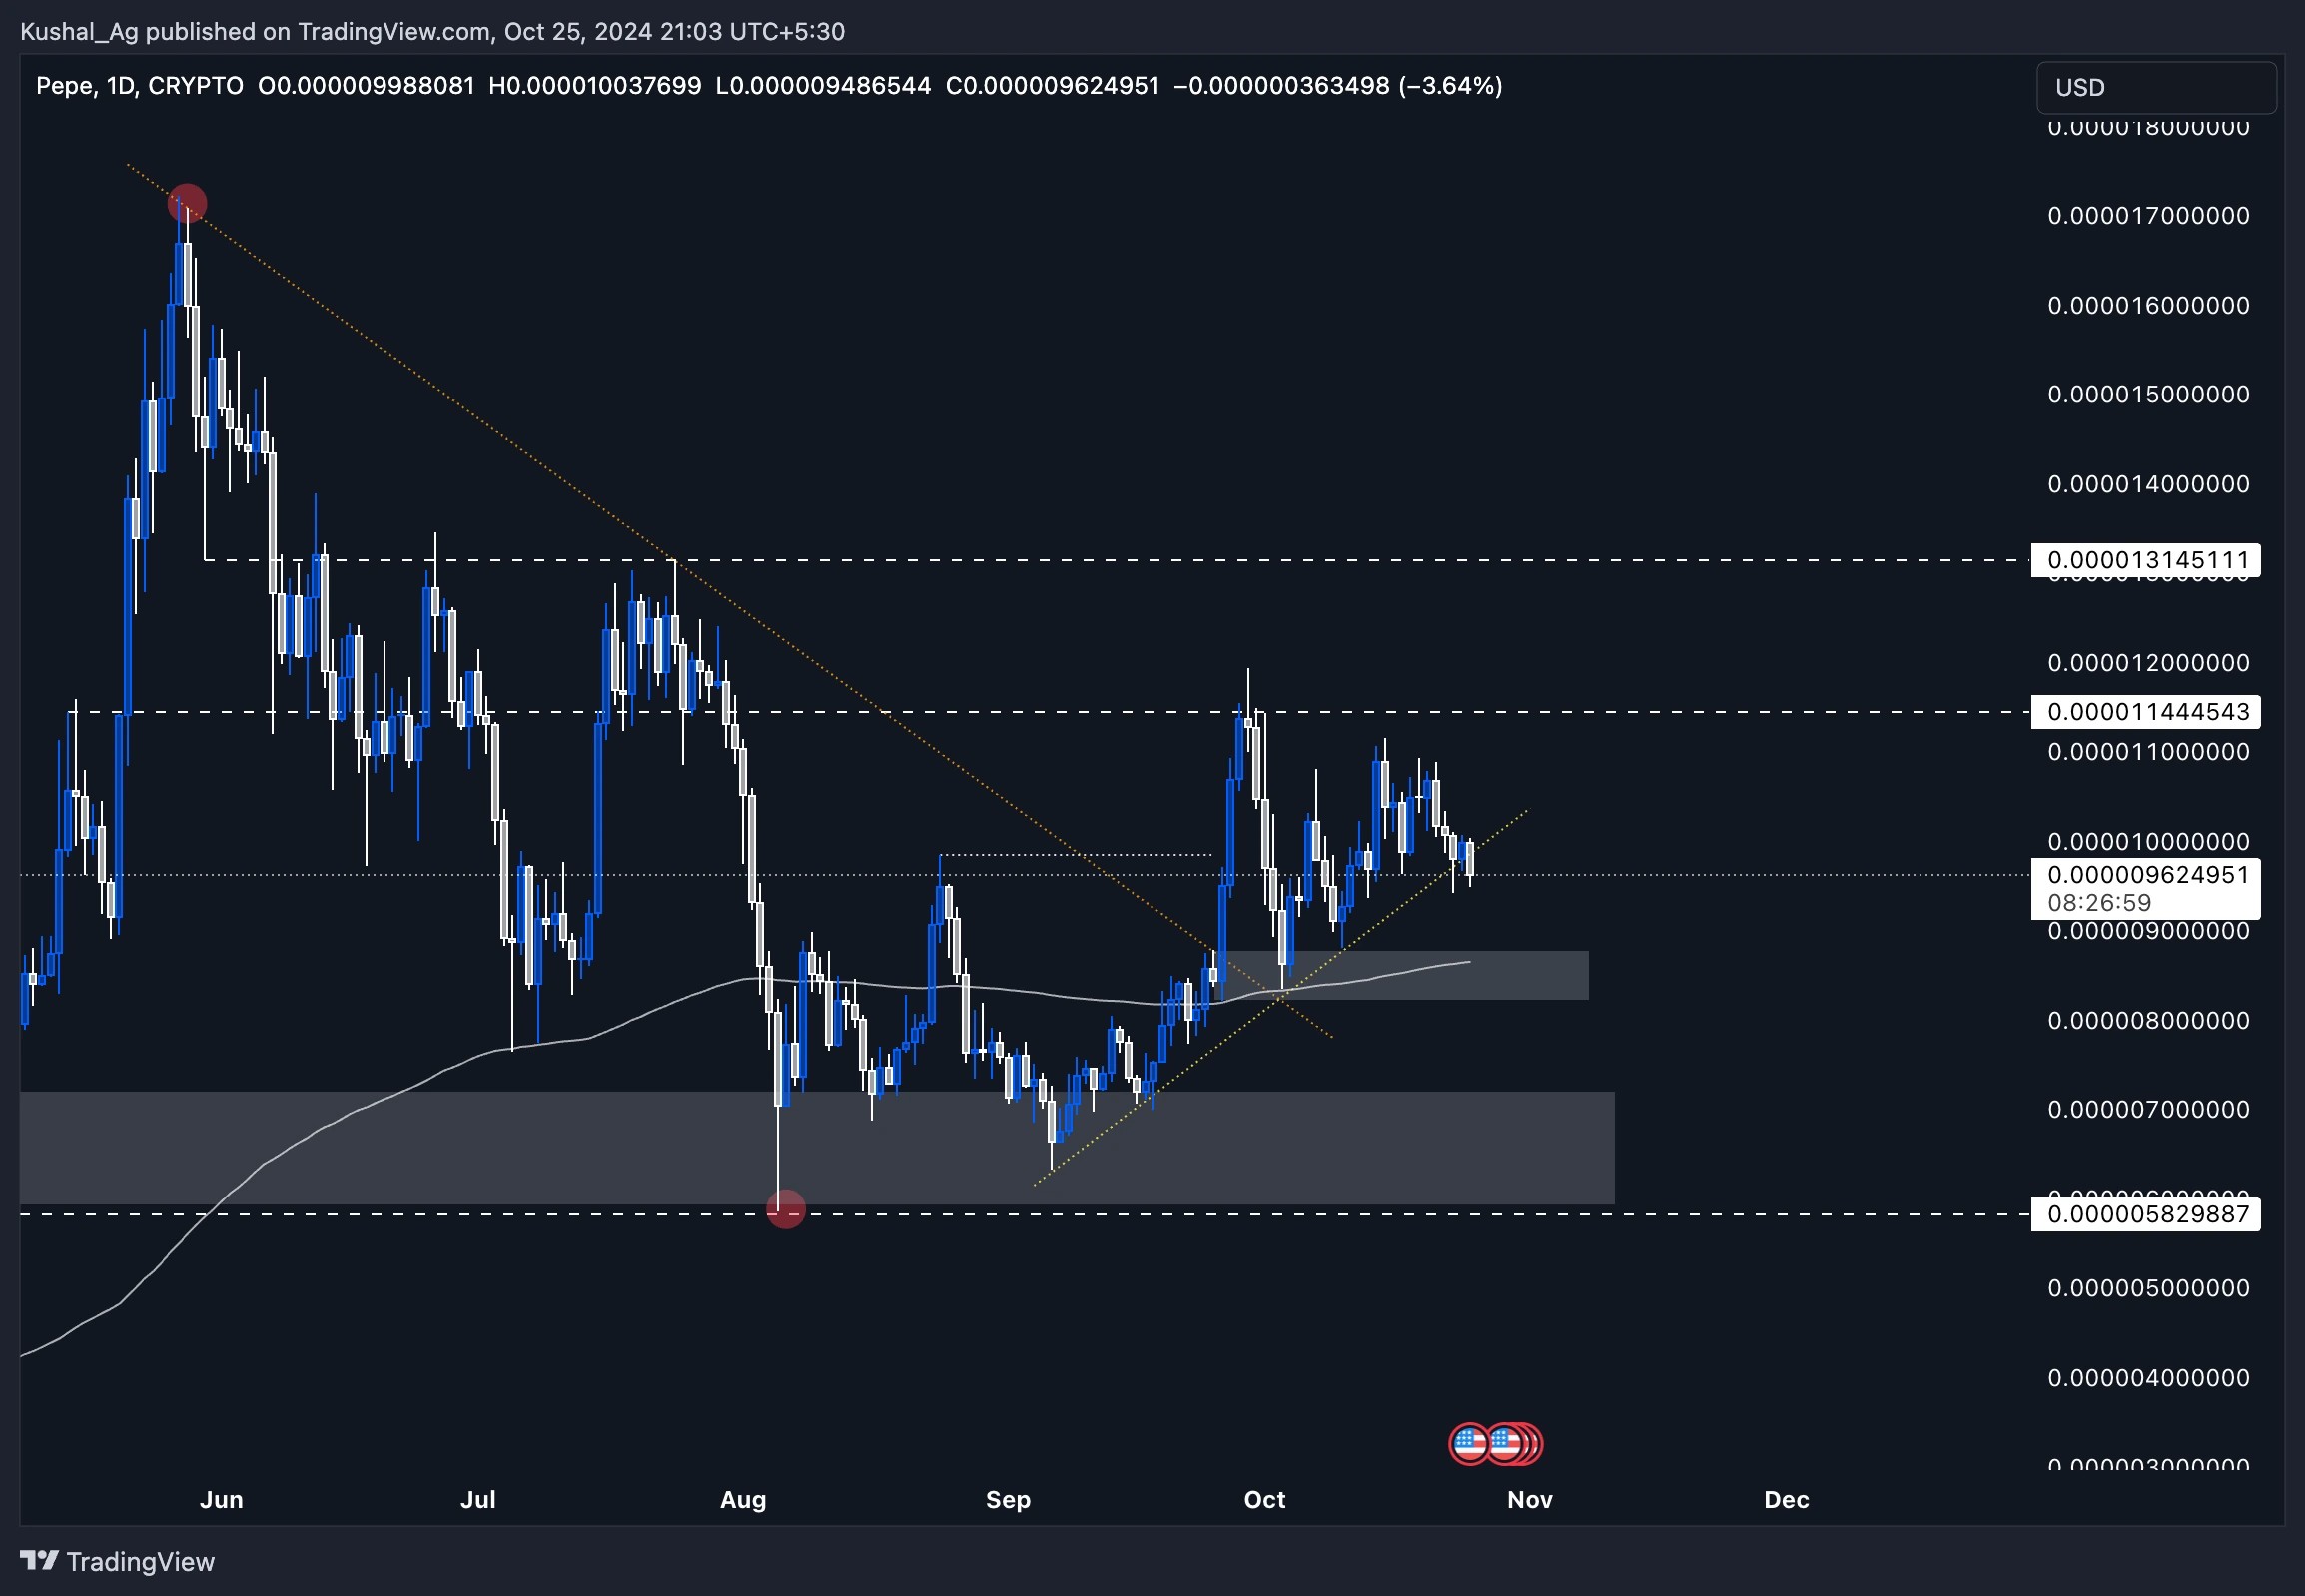
Pepe ($PEPE) remains one of the more active meme coins in terms of both trading volume and market interest. As the broader market consolidates, $PEPE also appears to be in a consolidation phase, forming a tight price structure. Currently trading around $0.0000096, the price is consolidating after rejecting the $0.0000114 resistance level, which has kept the asset in a range for the past few weeks.Daily timeframe analysis
During the daily timeframe, we can observe that Pepe has maintained support above a newly marked yellow-dotted trendline. This trendline appears to be a critical level where many traders are taking long positions, making it a potential liquidity zone.Typically, when an asset relies on such trendlines for extended periods, we can sometimes see a quick breakdown for a "liquidity grab," where the price briefly dips to capture stop-losses, allowing larger traders to accumulate before potentially reclaiming the trend.
Key observations
- Daily demand zone: The primary daily demand zone sits between $0.0000082 and $0.0000087, which also aligns with the 200 EMA on the daily at $0.0000086. This confluence of the 200 EMA and demand zone creates a strong support area.
- Secondary demand zone: A larger daily demand zone extends from $0.000006 to $0.0000072. This zone represents deeper support should the price break below the initial demand area.
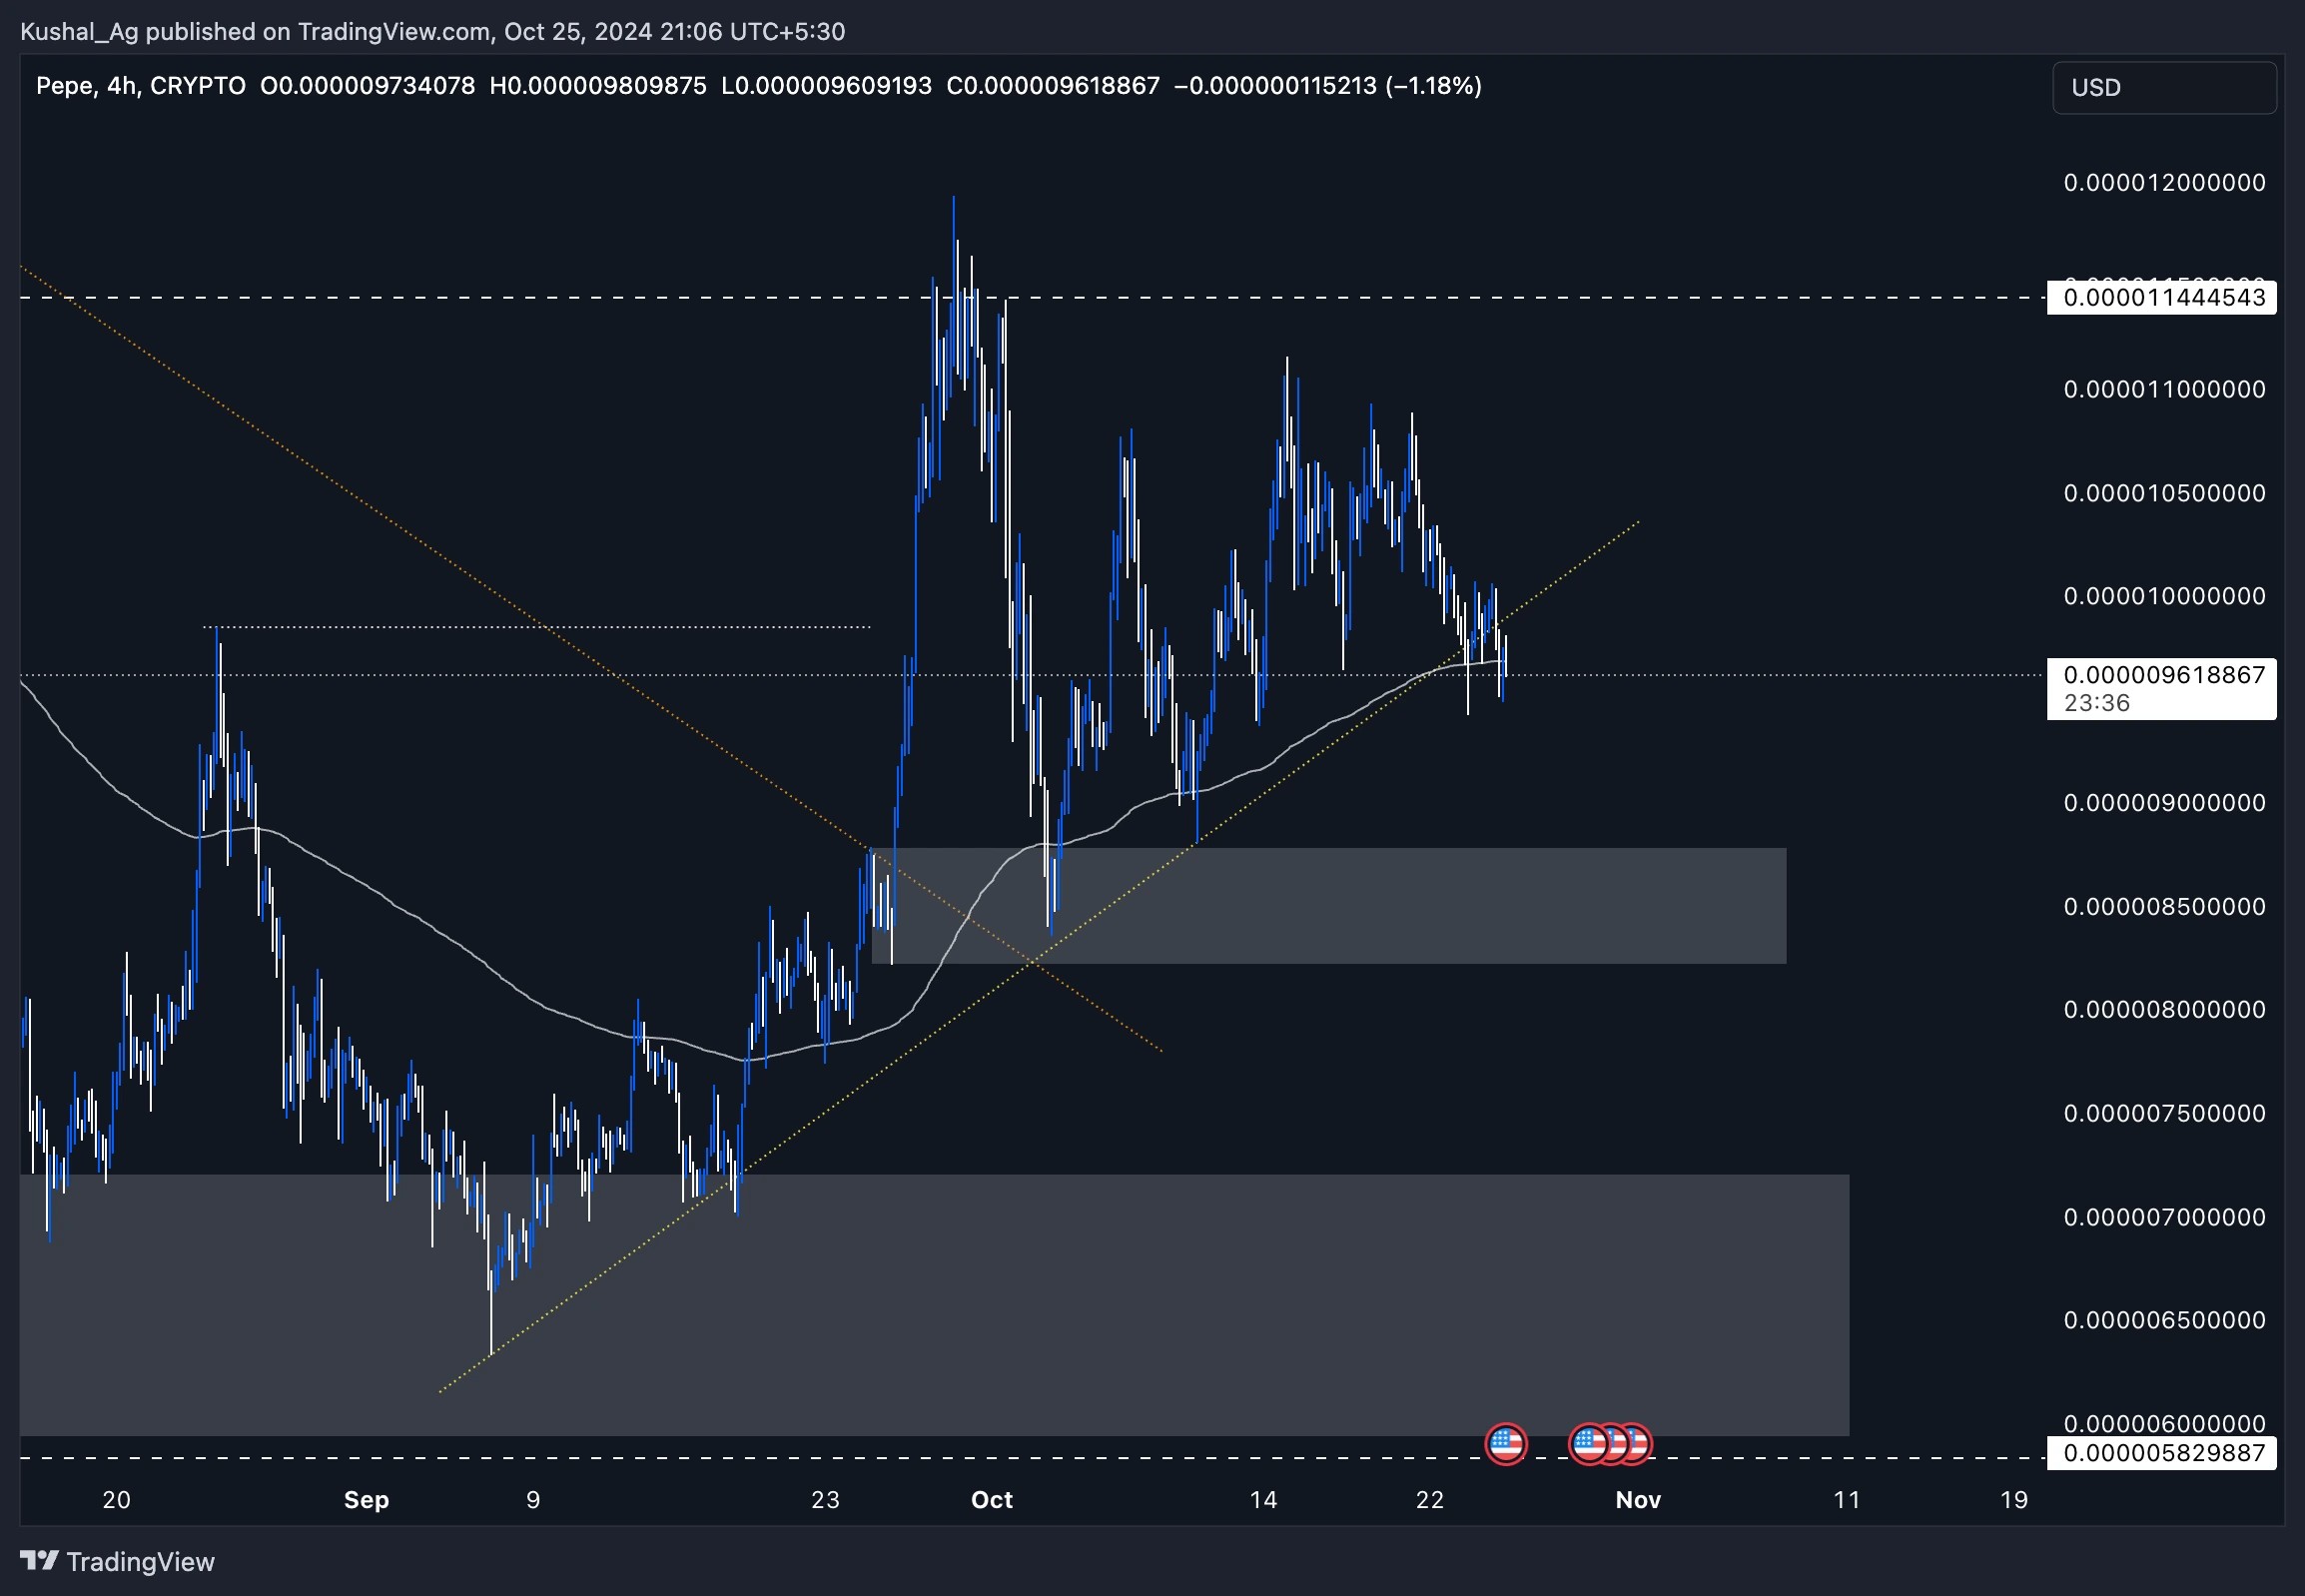
4-hour timeframe analysis
On the 4-hour timeframe, the yellow dotted trendline and 200 EMA (at $0.0000096) are more prominent. This trendline has acted as support for Pepe, and the 200 EMA currently coincides precisely with the asset's trading price.Key observations
- 200 EMA on the 4-hour: If the price holds above the 200 EMA on this timeframe, the likelihood of a deeper liquidation event decreases. However, if the 200 EMA fails to hold, the price may revisit lower support zones, as discussed in the daily timeframe.
- Trendline significance: A breakdown below this trendline on the 4-hour could trigger a temporary dip as the price seeks support from the daily demand zone.
Cryptonary's take
Pepe remains interesting from a technical perspective as it consolidates within a defined structure. The presence of multiple confluences ranging from the demand zones to the 200 EMA on both daily and 4-hour timeframes suggests a substantial support base. While this structure provides a favorable setup, maintaining a cautious, neutral stance is wise, given the unpredictable nature of meme coins.A sustained move above the 200 EMA in the 4-hour timeframe could signal potential upside momentum, while a breakdown might offer opportunities for re-entry in the demand zones.
Recommended from Cryptonary


