Save 23% ($351) & Get a Free 1-1 Call with our Team ⏰ : 0d 2h 59m 44s
Technical Analysis
Tron (TRX) technical analysis: TRX up 97%, can it hit $0.18 next?
We will be looking at Tron's price action on the monthly timeframe using a logarithmic chart and the weekly timeframe, highlighting the key levels and trends that could influence its next moves.

Tron ($TRX) has shown impressive resilience since its 2017 launch, rallying nearly 97% in recent months. As TRX approaches key resistance at $0.18, traders are closely monitoring potential breakouts and key support levels for further upside.
Disclaimer: This is not financial or investment advice. You are responsible for any capital-related decisions you make, and only you are accountable for the results.
Overview
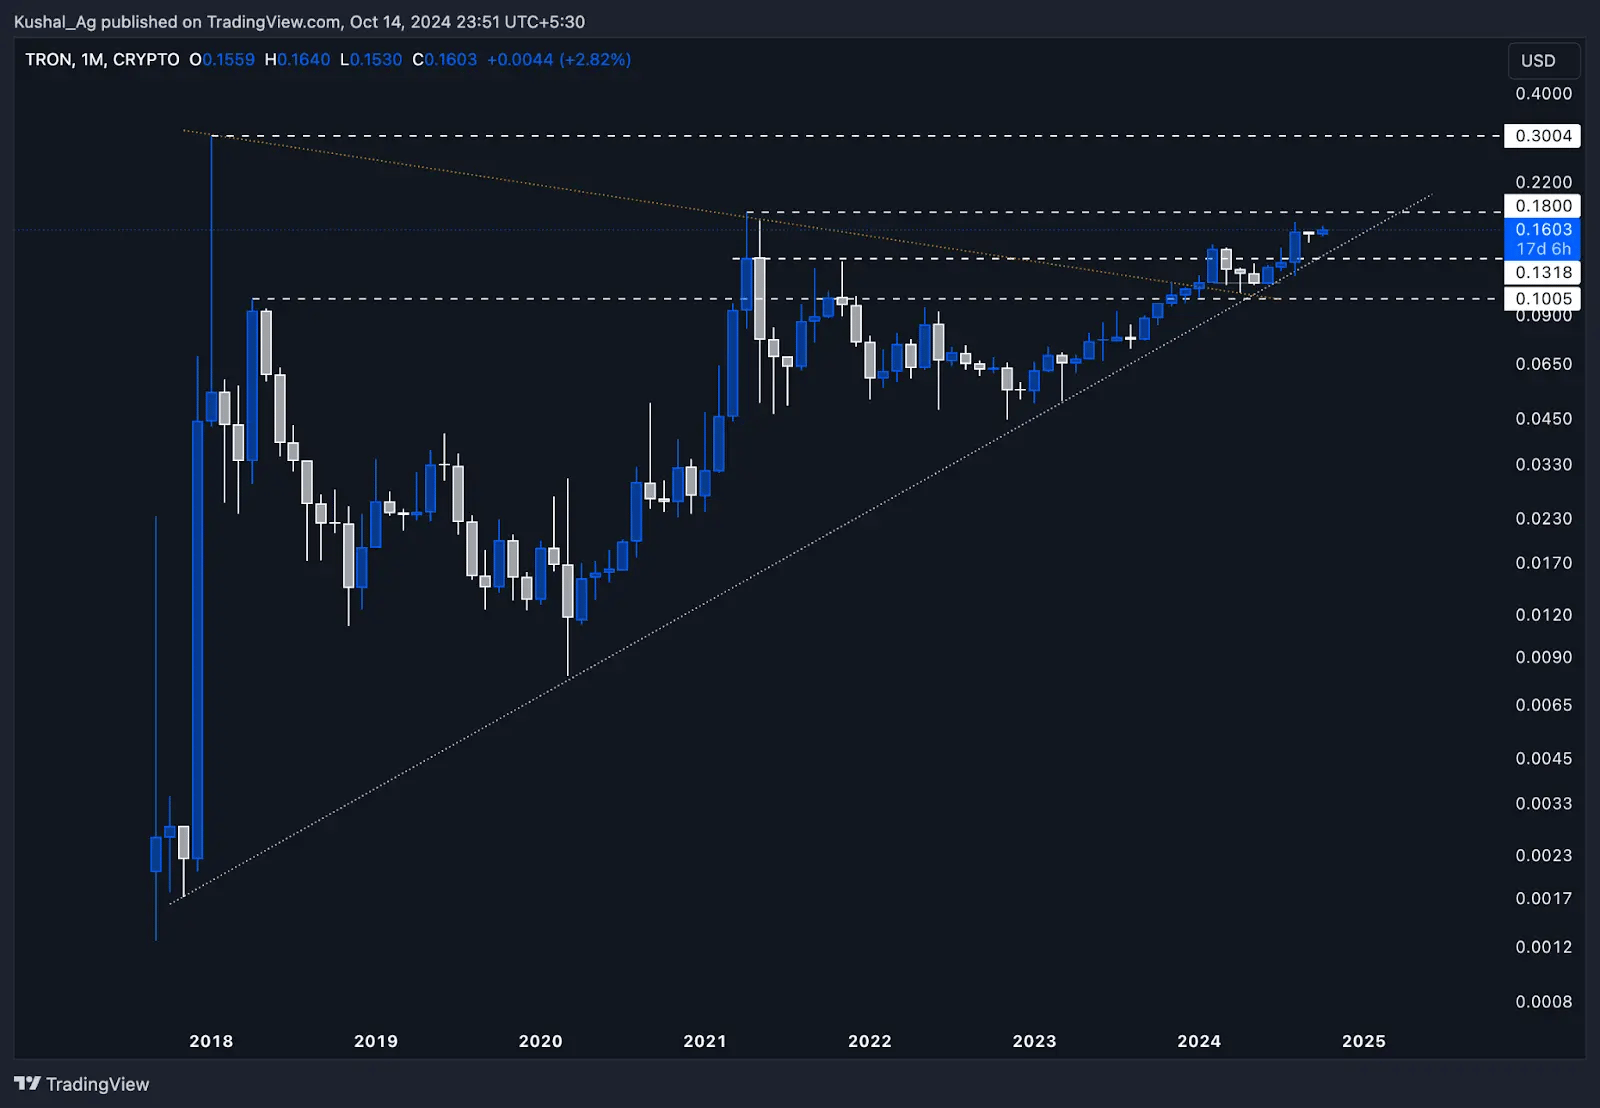
Tron ($TRX) continues to be one of the standout altcoins in terms of both longevity and market capitalization, having remained relevant since its launch in 2017. Although it may not fully align with the current meme coin supercycle, Tron's technical setup and price action have shown solid performance, making it an interesting candidate for long-term charting.Monthly timeframe analysis (logarithmic chart)
Tron has exhibited an overall uptrend since its launch in 2018 despite its initial extreme volatility. After its 2017 launch, Tron went on to make a 13,000% move in just one month, blasting from $0.0022 to $0.297 in January 2018, marking its all-time high (ATH).However, after this explosive move, the price retraced significantly, but interestingly, Tron has continued to follow a steady uptrend ever since, reflected by the dotted white trendline.
Key points:
- Major ATH rally: $0.0022 to $0.297, a 13,000%+ move in January 2018.
- Long-term uptrend: Tron has been following a steady uptrend since then, consolidating and respecting key levels.
- Pennant breakout: Tron broke out from a monthly pennant pattern in February 2024, which had kept it in consolidation for over five years. Since then, Tron has been trading between $0.10 and $0.13 before giving another move on the upside.
- Key resistance levels: Tron is currently trading near $0.16, with the next major resistance at $0.18. Once this level is flipped, there is a clear space for a move toward the ATH level of $0.29, as there are no significant resistances between $0.18 and $0.29.
- If Tron can flip the $0.18 resistance, it could potentially rally toward its ATH of $0.29 in the longer term.
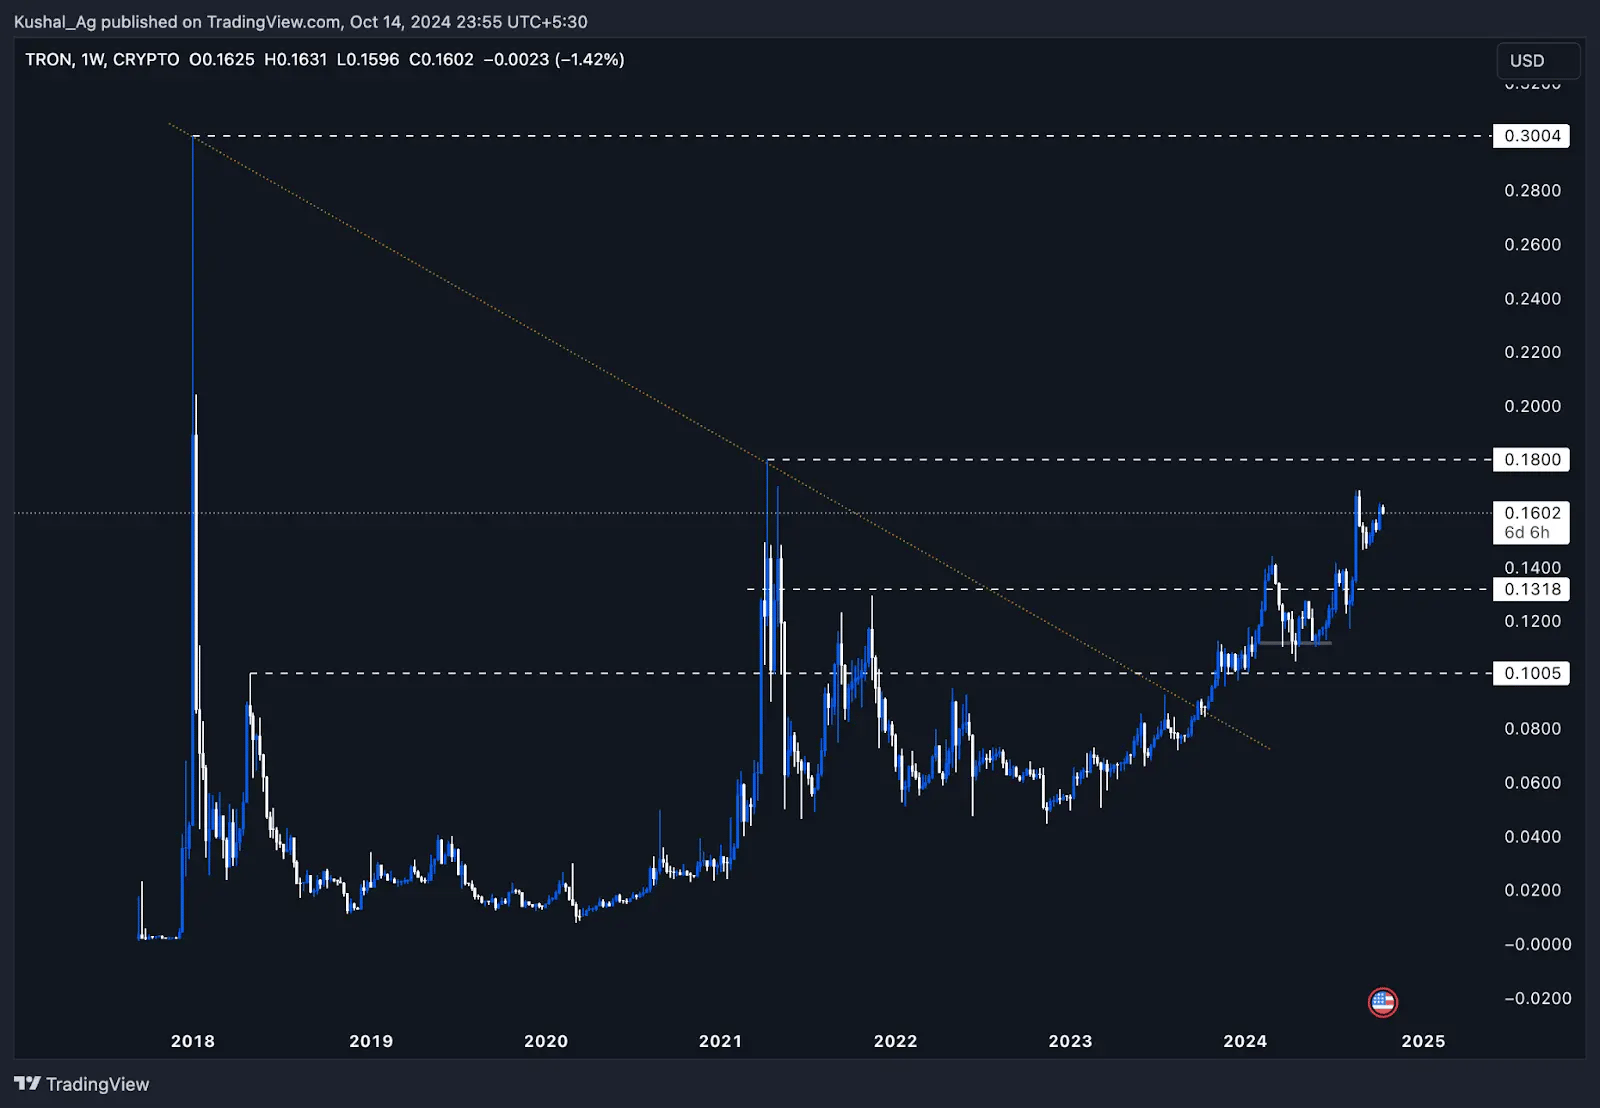
Weekly timeframe analysis
Shifting to the weekly chart, we can see a clear breakout for Tron in October 2023 from a long-standing downtrend trendline marked by the orange dotted line. Since this breakout, Tron has moved upwards by 97%, rallying from $0.086 to a high of $0.168, and currently trades at $0.16.Key points:
- Weekly breakout: Tron broke out from its downtrend in October 2023 at the $0.086 level, pushing nearly 100% higher.
- Higher highs and higher lows: Tron has been forming higher highs and higher lows since its breakout, confirming its bullish structure.
- Clean space to ATH: There is no major supply or resistance zone between the $0.18 resistance and the all-time high of $0.29, which opens up the possibility of an extended move if Tron can hold its current support levels and break past $0.18.
Support and resistance levels
- Support: $0.1 and $0.13 levels act as strong supports on the downside, with the 200 EMA on the weekly timeframe currently holding the price up.
- Resistance: $0.18 is the next major resistance. A clean break above could lead to a run toward $0.29.
Cryptonary's take
Tron may not fit the thematic focus of the meme coin supercycle, but from a technical perspective, it presents a solid and consistent price action pattern. With its long-term uptrend intact and the potential for a breakout from key resistances, Tron's price action on the monthly and weekly timeframes is worth monitoring closely.As always, while Tron is presenting a favourable setup, traders should exercise caution, as broader market conditions will also impact its price movement.
Recommended from Cryptonary


PRO
Market Direction
11 min read
Mar 24, 2026

PRO
Market Updates
8 min read
Mar 23, 2026
PRO
Market Direction
13 min read
Mar 20, 2026
