Save 23% ($351) & Get a Free 1-1 Call with our Team ⏰ : 0d 2h 59m 44s
Technical Analysis
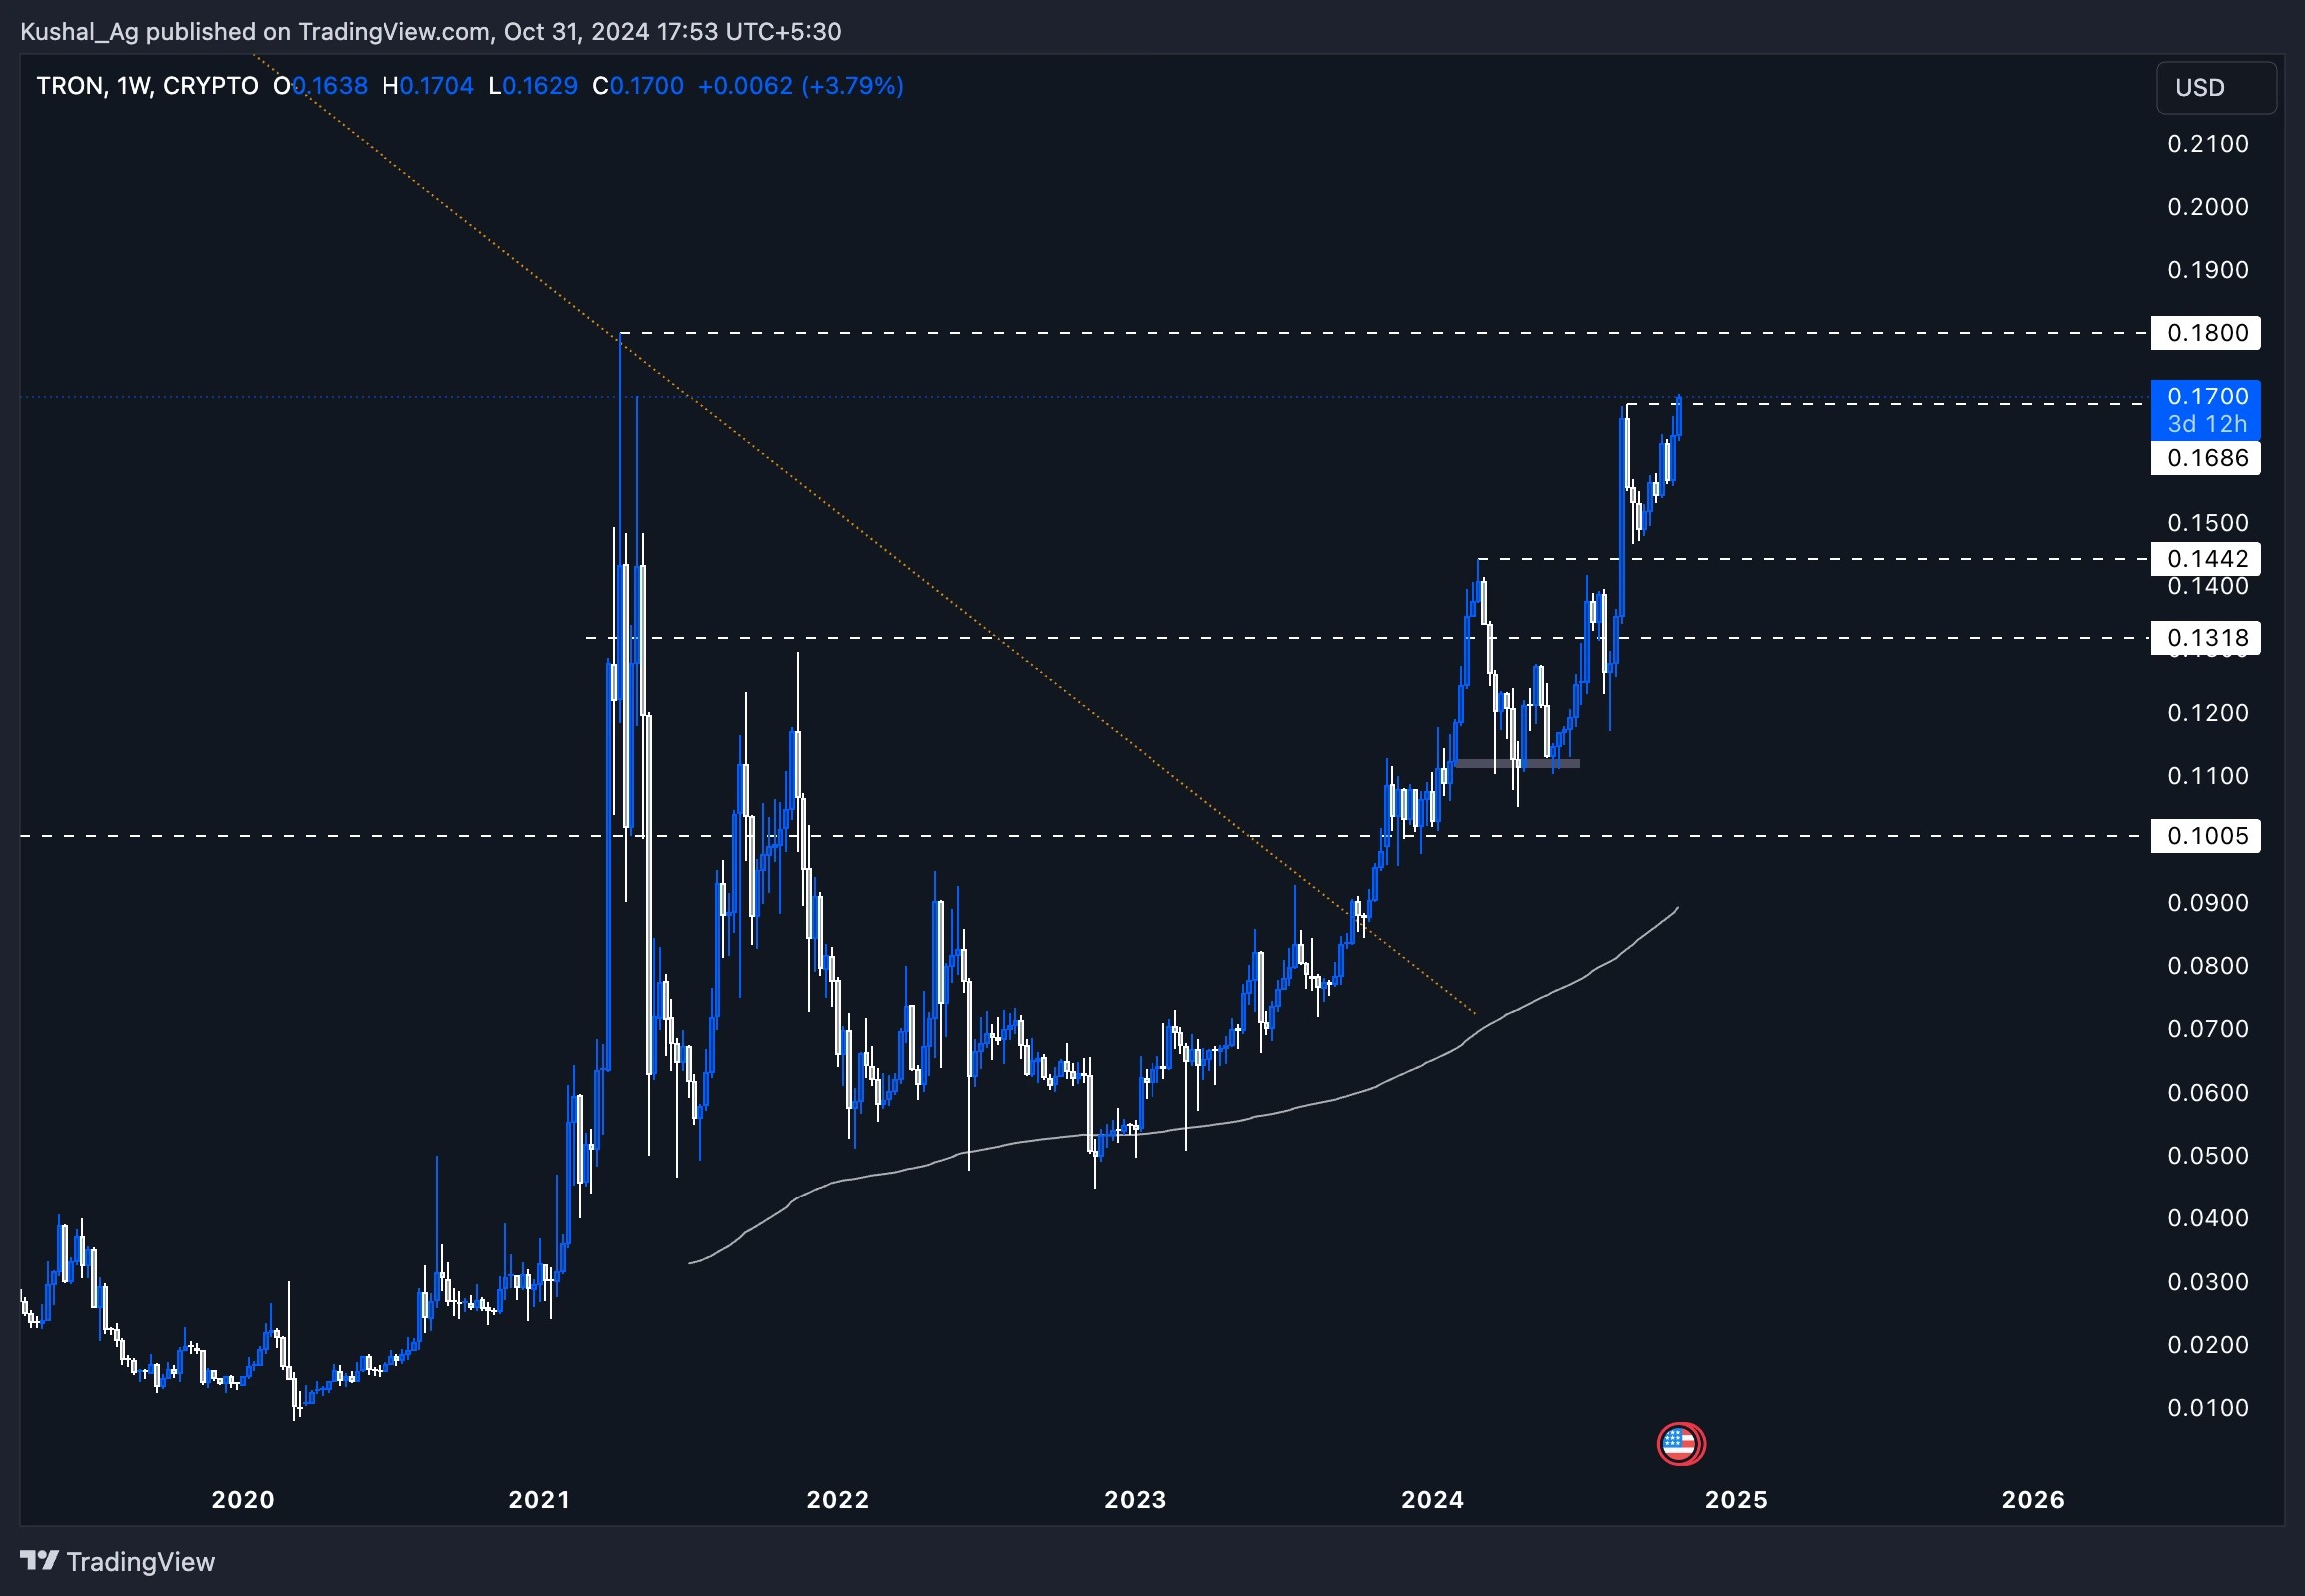
TRON (TRX) technical analysis: Will $0.168 hold for further gains?
TRX’s bullish structure remains strong as it consolidates above $0.168. With potential resistance at $0.18, the current breakout could lead to continued gains. TRON’s independent rally offers unique momentum compared to a sideways market.

Disclaimer: This is not financial or investment advice. You are responsible for any capital-related decisions you make, and only you are accountable for the results.
Overview
TRON ($TRX) is currently displaying a solid technical structure on the weekly time frame. Unlike many other assets in the market, which are consolidating or moving sideways, TRON has maintained a strong bullish trend, consistently forming higher highs and higher lows. The asset is now breaking through the critical $0.168 resistance level and is trading around $0.17. This performance positions $TRX as one of the standout assets, independent of broader market trends.Weekly time frame analysis
- Resistance levels: With $TRX pushing past the $0.168 resistance, the next key level to watch on the upside is the $0.18 resistance. Given $TRX's momentum, it's likely this level will be tested in the coming days or weeks.
- Support levels: Previously, support was set at $0.144. As $TRX continues to break higher, we could see new support levels forming above this mark. However, confirmation of this breakout is essential before identifying higher support levels.
- Momentum: $TRX's upward trajectory, while the market at large remains sideways, is notable. This independent movement suggests that $TRX is benefiting from its own bullish momentum, a trend often seen in assets with strong buying interest.
Potential scenarios
- Upside potential: If $TRX sustains its momentum above $0.168 and firmly establishes this breakout, the asset could soon target the $0.18 level. A break above this point would open space for further bullish moves.
- Downside risk: Should $TRX fail to maintain this breakout, it could pull back to retest the $0.144 support level. This level remains a critical area for any potential retracements and could offer another buying opportunity if tested.
Cryptonary's take
TRON's bullish performance amidst a consolidating market positions it as a unique asset. Breaking the $0.168 resistance and targeting $0.18 could lead to substantial upward movement. However, caution is advised until the breakout is confirmed, as these levels are crucial for maintaining its bullish structure.Recommended from Cryptonary


PRO
Market Updates
11 min read
Mar 27, 2026

PRO
Market Direction
11 min read
Mar 24, 2026

PRO
Market Updates
8 min read
Mar 23, 2026
