Save 23% ($351) & Get a Free 1-1 Call with our Team ⏰ : 0d 2h 59m 43s

What a mad 48 hours. Let's dive into it and break it down.
In this report:
- Trump Tweets, and Price Action Reverses.
- Reasons For The Reversal? - Macro.
- Data This Week.
- Cryptonary's Take.
Disclaimer: This is not financial or investment advice. You are responsible for any capital-related decisions you make, and only you are accountable for the results.
Trump tweets, and price action reverses
As many of you will already know, on Sunday Trump tweeted (or through Truth) that he'd be looking to include XRP, ADA and SOL in a Crypto Reserve. Now, XRP and ADA scam coins aside, any reserve (and outright buying) will likely need congressional approval.Yep, that's right. US tax dollars might be spent on XRP and ADA. SOL you could make more of an argument for, but XRP and ADA, you can't really. We don't expect this to be approved, and potentially, it might not even make it to Congress. We're very sceptical.
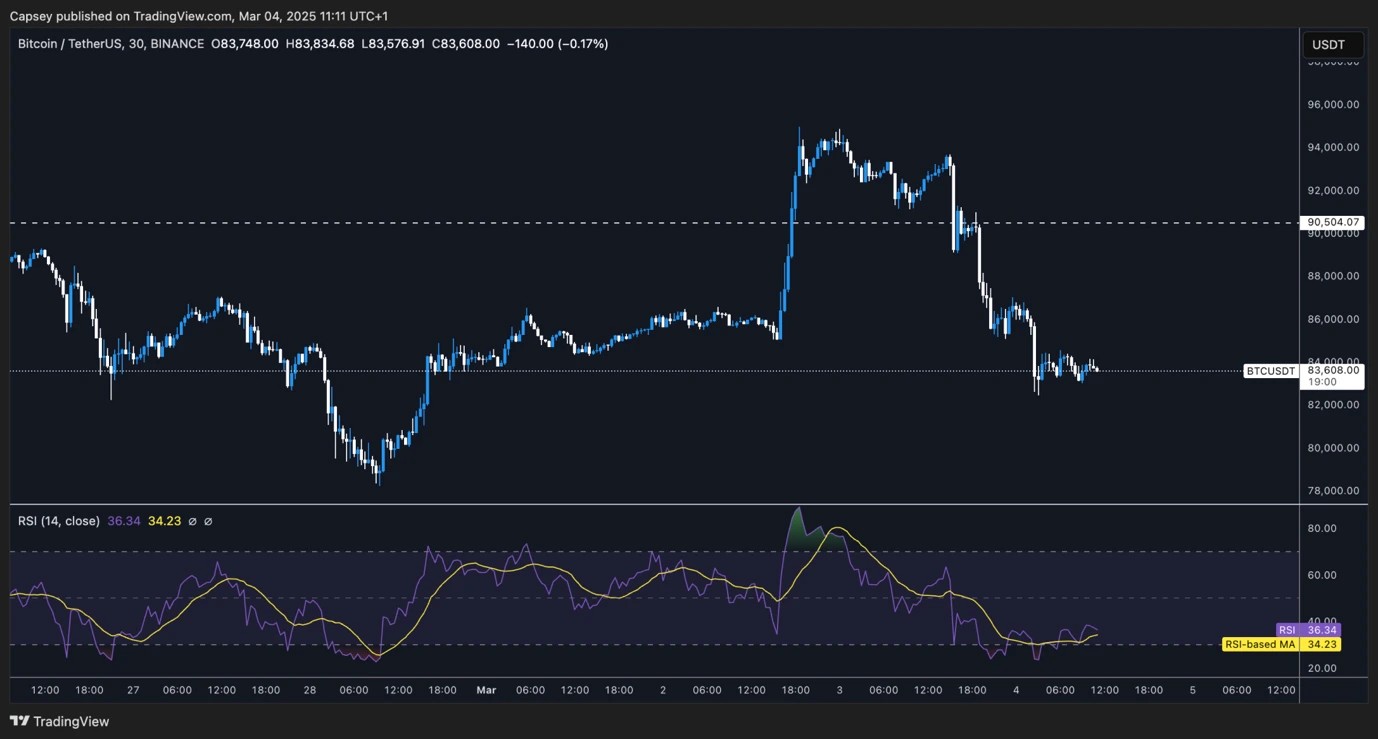
On the Monday open, the price pretty immediately began reversing. Check out the $BTC 30-minute candles chart below. You can guess where the Trump tweet went out, and since then, we've fully reversed.
BTC 30min timeframe:
Reasons For The Reversal? - Macro
We expect it's mostly macro, and with BTC retesting the higher timeframe resistance at $95k, TradFi participants likely saw this as an attractive spot to exit positions and Short.On the macro side, we've seen consumer sentiment surveys come in recently showing that the consumer is pulling back and becoming more reserved in their spending. We then saw this in the data in that Consumer Spending number, which came in at -0.2% MoM, with the prior reading at +0.8% (we tagged the chart in the last Market Update).
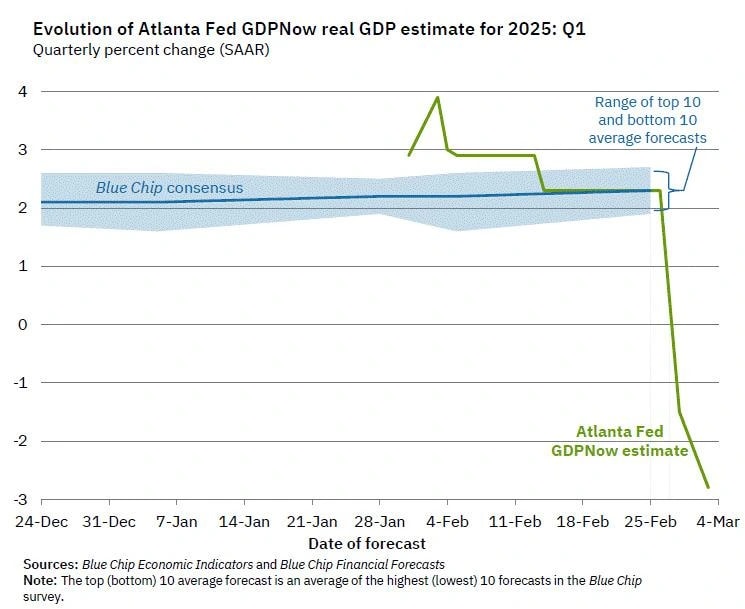
Alongside this, we had the Atlanta FED release their GDPNow update yesterday, which showed Q1 2025 growth potentially coming in at -2.8%. However, this is likely overstated due to the fact that imports increased substantially (tariff front-running).
Net exports coming in substantially lower reflect lower GDP, but again, this can be somewhat looked through, and it'll unwind in the coming months.
Atlanta Fed GDPNow:
Ultimately, we're just surrounded by a tonne of uncertainty from the policies of the new administration, and that feels even more heightened this week as tariffs are being implemented and we're seeing the retaliations from other nations in response to them. This, along with the weakening economic data is all pointing towards at a minimum, a growth scare.
The result of this has been a strong move away from risk assets. This is shown well in CrossBorder Capitals' 'Investors Risk Exposure' chart.
Investors risk exposure:
![]()
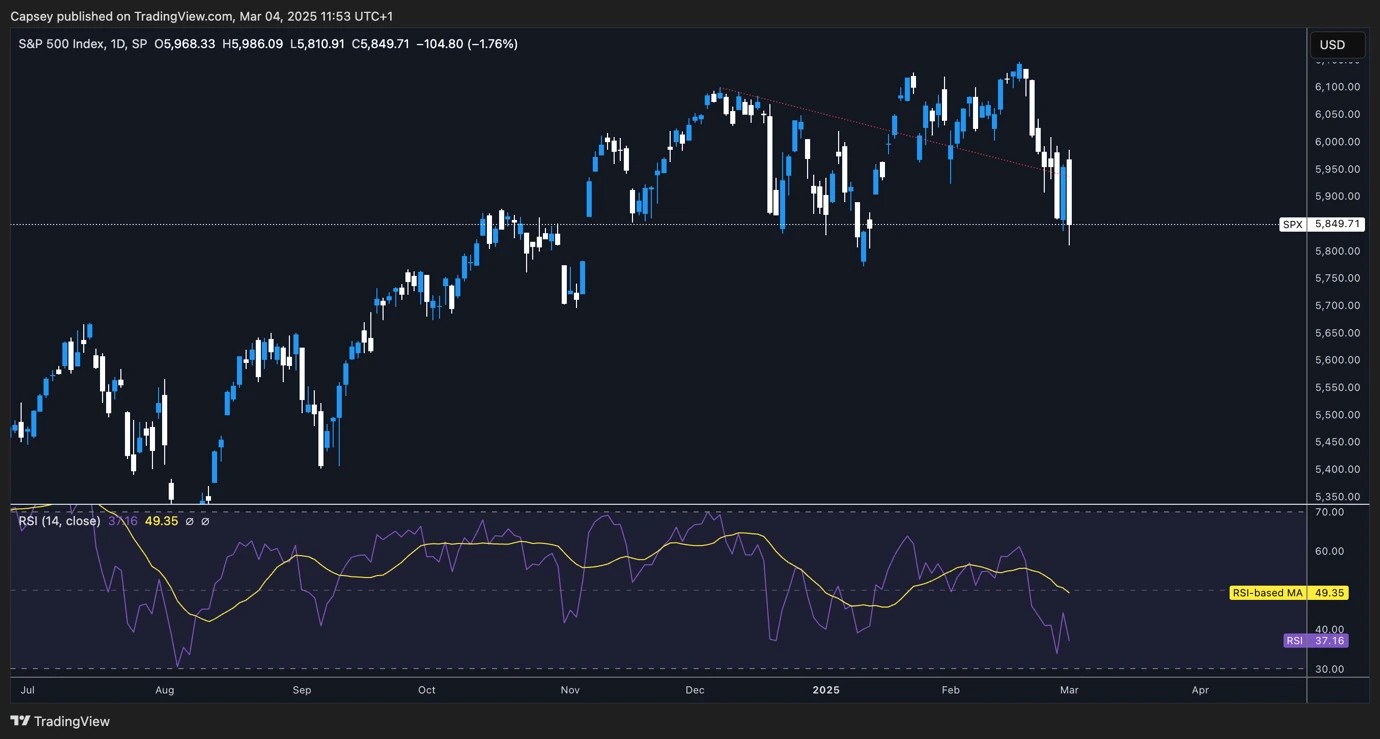
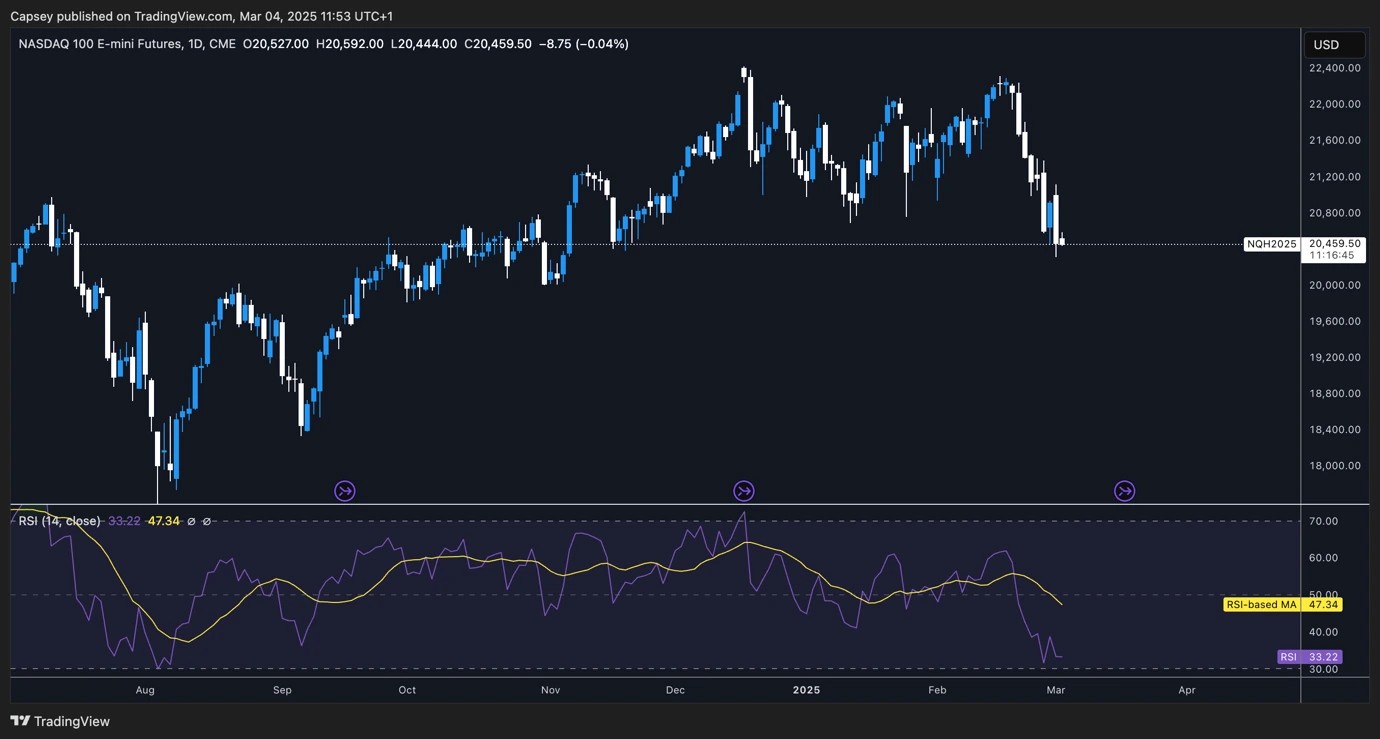
Looking at the Index's, we've seen the S&P and the Nasdaq both fully reverse Friday's strong bounce, whilst the US10Y Yield has continued to move lower.
S&P 1D chart:
Nasdaq 1D chart:
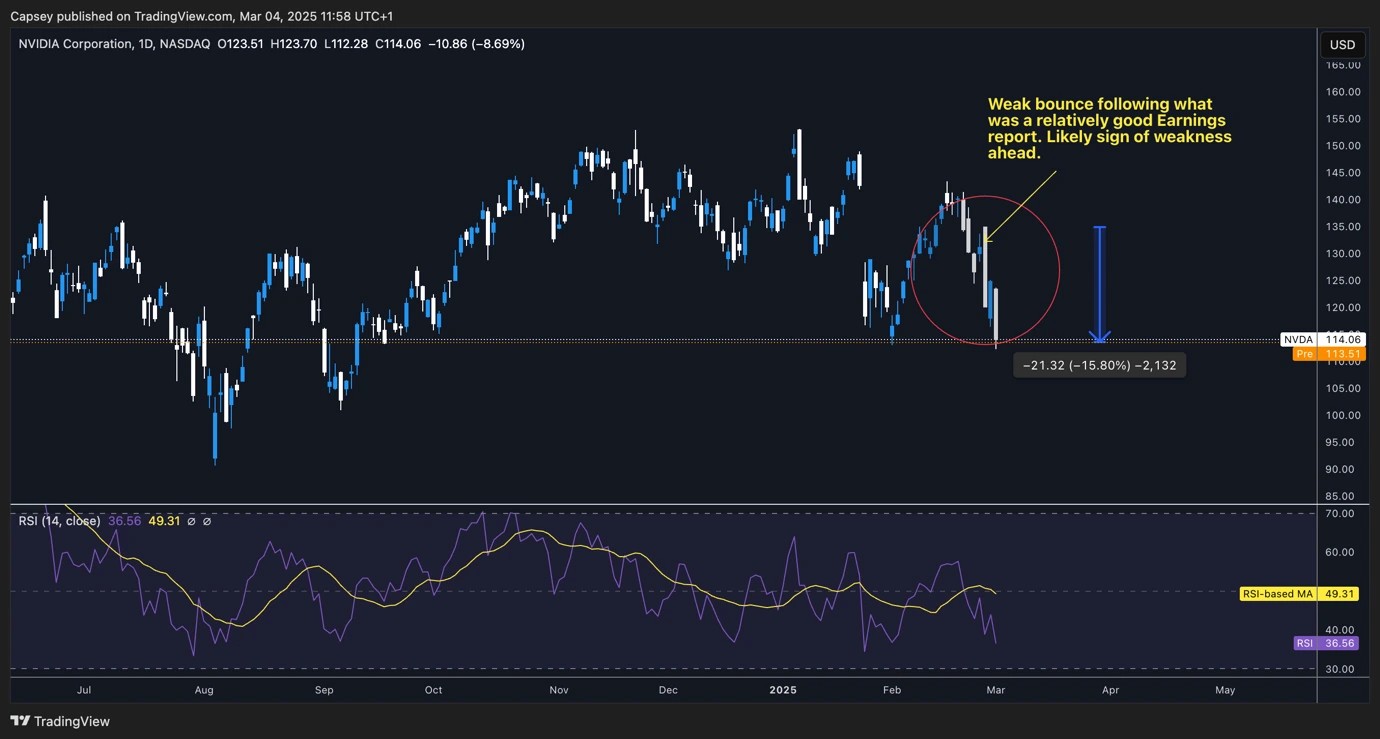
Now, we were well ahead of this risk-off period, and we really highlighted it last week when Nvidia's Earnings were announced. The numbers were very positive, and the outlook was still pretty good, but it was being questioned by analysts.
The next day, Nvidia's share price couldn't sustain any meaningful bounce, and we noted that in the 28/02/2025 Market Update as a sign of likely further weakness ahead.
Nvidia is since down 15.8%. The S&P is down 2.6% and the Nasdaq is down 4.4% since. BTC? Down 5.2%
Nvidia 1D chart:
With all the above playing out on the macro front, it was no wonder we've seen Crypto be heavily sold into considering prices were run up on that Trump tweet into high timeframe resistance on an illiquid Sunday.
All of this on a Trump tweet, which is a catalyst you can really question its likelihood of implementation. We perhaps didn't expect Crypto to reverse as quickly as it has done, but the reverse we expected, called for and was right on.
Now, with all the above laid out, we look out to the important data points of the week.
Data This Week:
Labour market data on Friday. Non-farm payrolls are expected to come in at 150k, whilst the Unemployment Rate is expected to come in at 4.0%. So, not much change from the prior months' reading. However, there is the potential that this print can come in materially lower.Some estimates are suggesting the number might be closer to the 60-70k figure. If this were to come in at those figures, this would really fuel the growth scare argument, and risk will likely continue to sell down.
Cryptonary's take
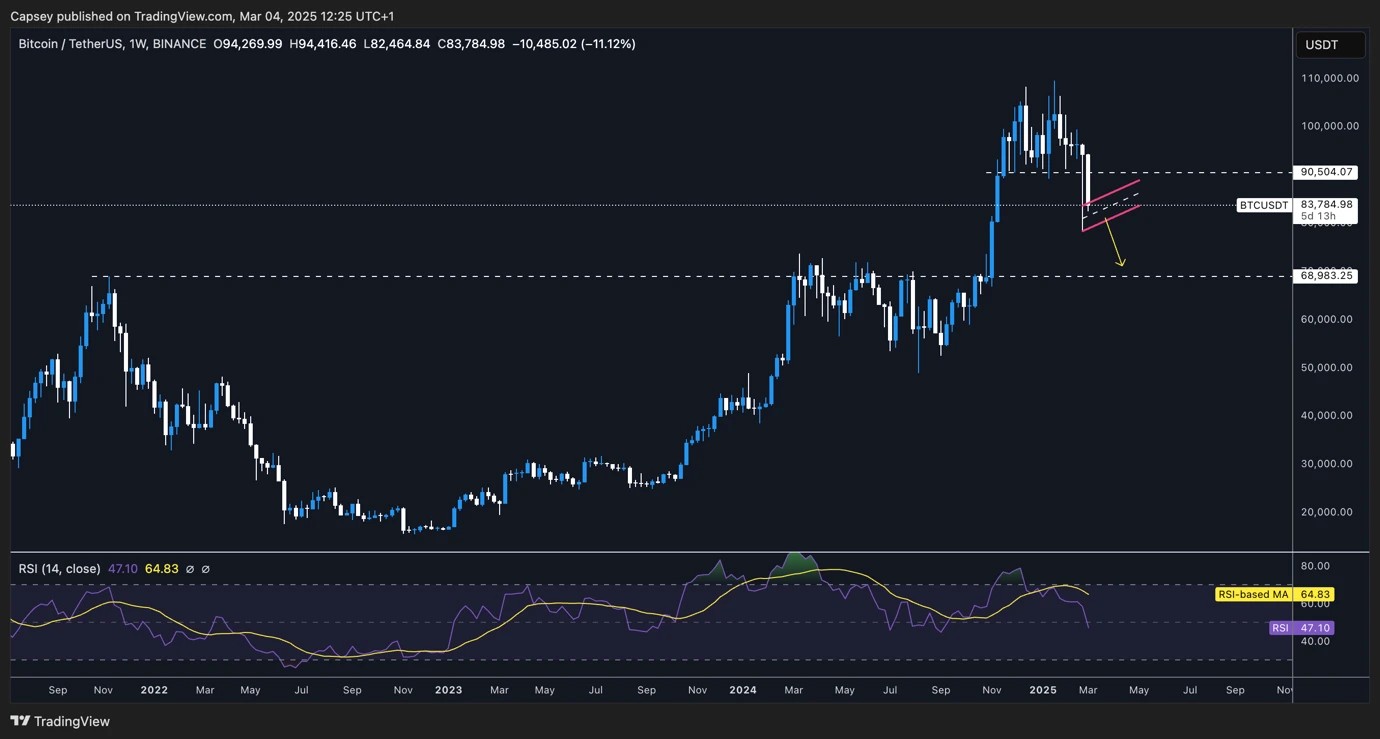
For now, the macro and the new Trump administration are ruling markets. And the story really points to a continuation of the risk-off.If we look at BTC on the Weekly timeframe, last week's candle was "saved", however, as we explained above, this just gave TradFi participants a good entry to re-short Crypto, upon a pretty false catalyst.
For BTC, the key level is $90k to $91k. Right now, the price is retesting the wick. We do expect BTC to break down again below $80k and potentially to even test the $60k's.
But, it's possible we see prices stagnate for a week or so before breaking down further. In the chart, we've shown this as the formation of a potential bear flag, and then price breaking down from there.
BTC weekly chart:
We still very much expect this to be a first half of the year story, and for risk assets to get a much better second half of the year. Whatever damage is done now, an undoing of this can be a tailwind for risk assets in the second half of the year.
Two great examples of this are; growth declining, which can be remedied by rate cuts in the second half of the year. And strong tariffs today, can incentivise trade deals, that then see a reduction or even a complete removal of the tariffs. Both 'unwinds' would most likely be bullish for risk assets in the second half of the year.
Patience is the key here.
Recommended from Cryptonary


