Save 23% ($351) & Get a Free 1-1 Call with our Team ⏰ : 0d 2h 59m 43s
Market Direction
Trump’s tariffs & market chaos: The fallout on BTC, alts & memes
Trump’s tariff news has shaken the crypto market, sparking liquidations across BTC, altcoins, and memes. Bitcoin lost key support, ETH saw a major leverage wipeout, and SOL struggled to reclaim ground. With volatility high and traders uncertain, here’s a breakdown of key levels and what’s next.
Disclaimer: This is not financial or investment advice. You are responsible for any capital-related decisions you make, and only you are accountable for the results.
BTC:
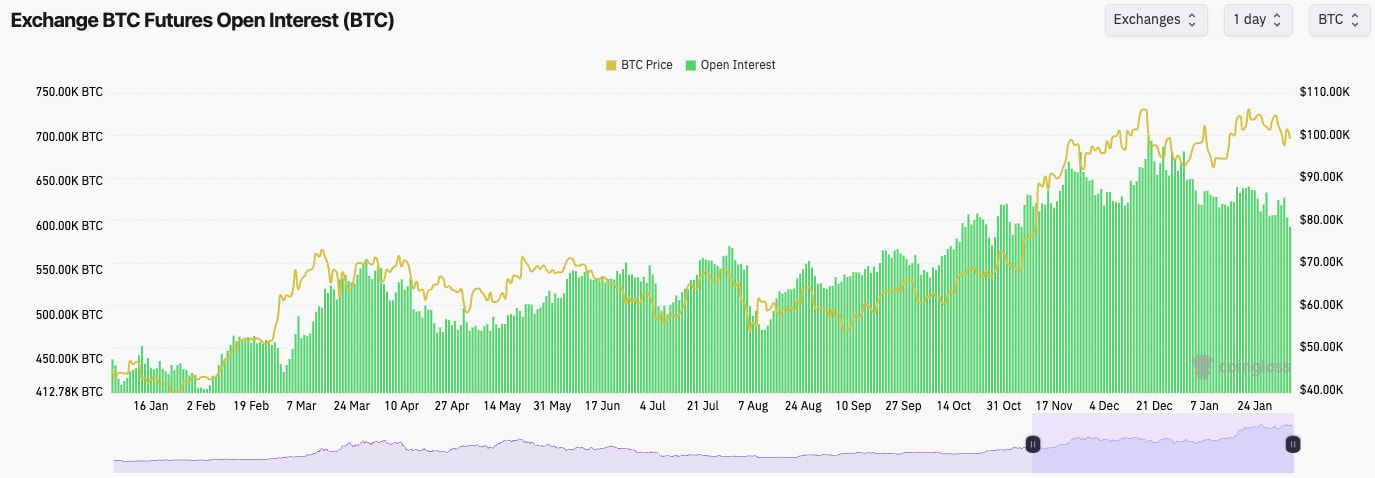
- BTC's Open Interest has been downtrending since mid-December, and we've seen a further 5% decline over the last 48 hours due to the liquidation event on Sunday/Monday.
- Funding Rates have been choppy between slightly positive and slightly negative, indicating traders have been chopped up. We've seen Funding Rates go from negative to positive as the price has moved up (Shorts getting hit) and then the opposite on the way down (Longs being hit).
- Ultimately, there's indecision amongst traders in the current market, and we've seen the froth come out of the market over the last month.
Technical analysis
- BTC rejected from the $105k - $106k level (top of the range) as we expected.
- Price then collapsed below the horizontal supports of $98,900 and $95,700 on the Trump tariff news.
- Price found support at the major horizontal support at the bottom of the range at $91,700. This is a key area we have marked for the last few months.
- Price recovered nicely off the back of progress around deals with Canada and Mexico. It reclaimed $98,900, and the price is now using that horizontal level as new support.
- The RSI is in the middle territory, but it remains beneath its moving average.

- Next Support: $95,700
- Next Resistance: $102,000
- Direction: Bearish/Neutral
- Upside Target $102,000
- Downside Target: $91,700
Cryptonary's take
It's very positive that we've seen a capitulation event like we saw on Sunday/Monday, and BTC is at $99k and holding in the upper end of the major range (between $91k and $107k). In the short term, we wouldn't be surprised to see a return back to $102k. However, we are expecting more downside in the coming week or two, whether that be from $102k or from the current levels. We are expecting a retest of $95k, at least in the short term.ETH:
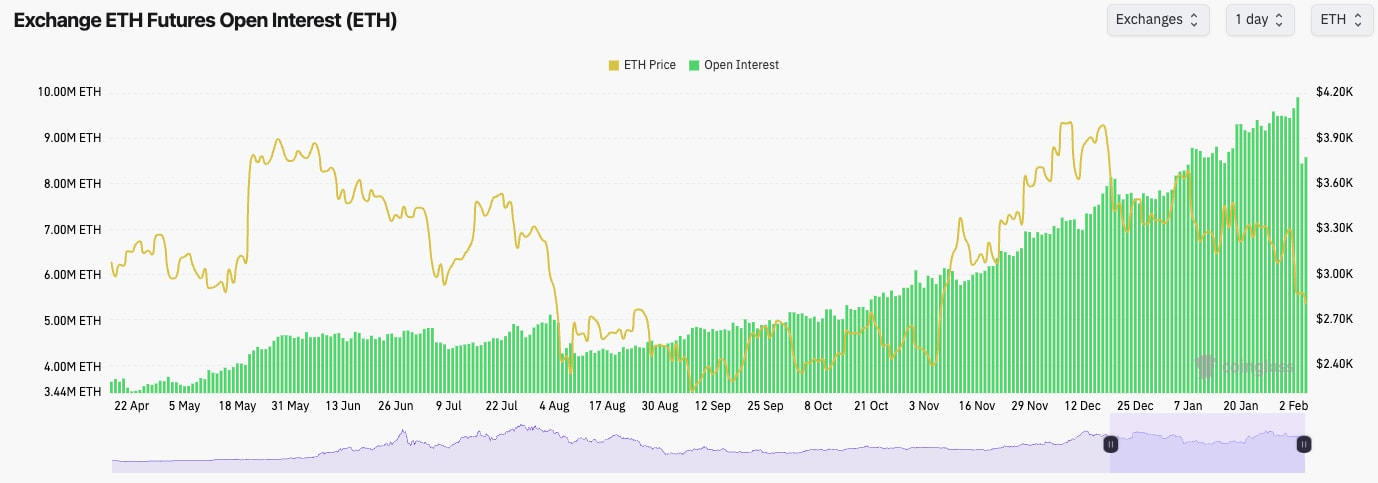
- ETH's Open Interest plummeted over the last 48 hours, showing that this was a large leverage washout event.
- ETH's Open Interest (by number of coins) fell by 16%.
- ETH's Funding Rate was very negative on Monday, but it has now returned to slightly positive. However, funding keeps flip-flopping between positive and negative, showing indecision among traders, who are most likely being chopped up.
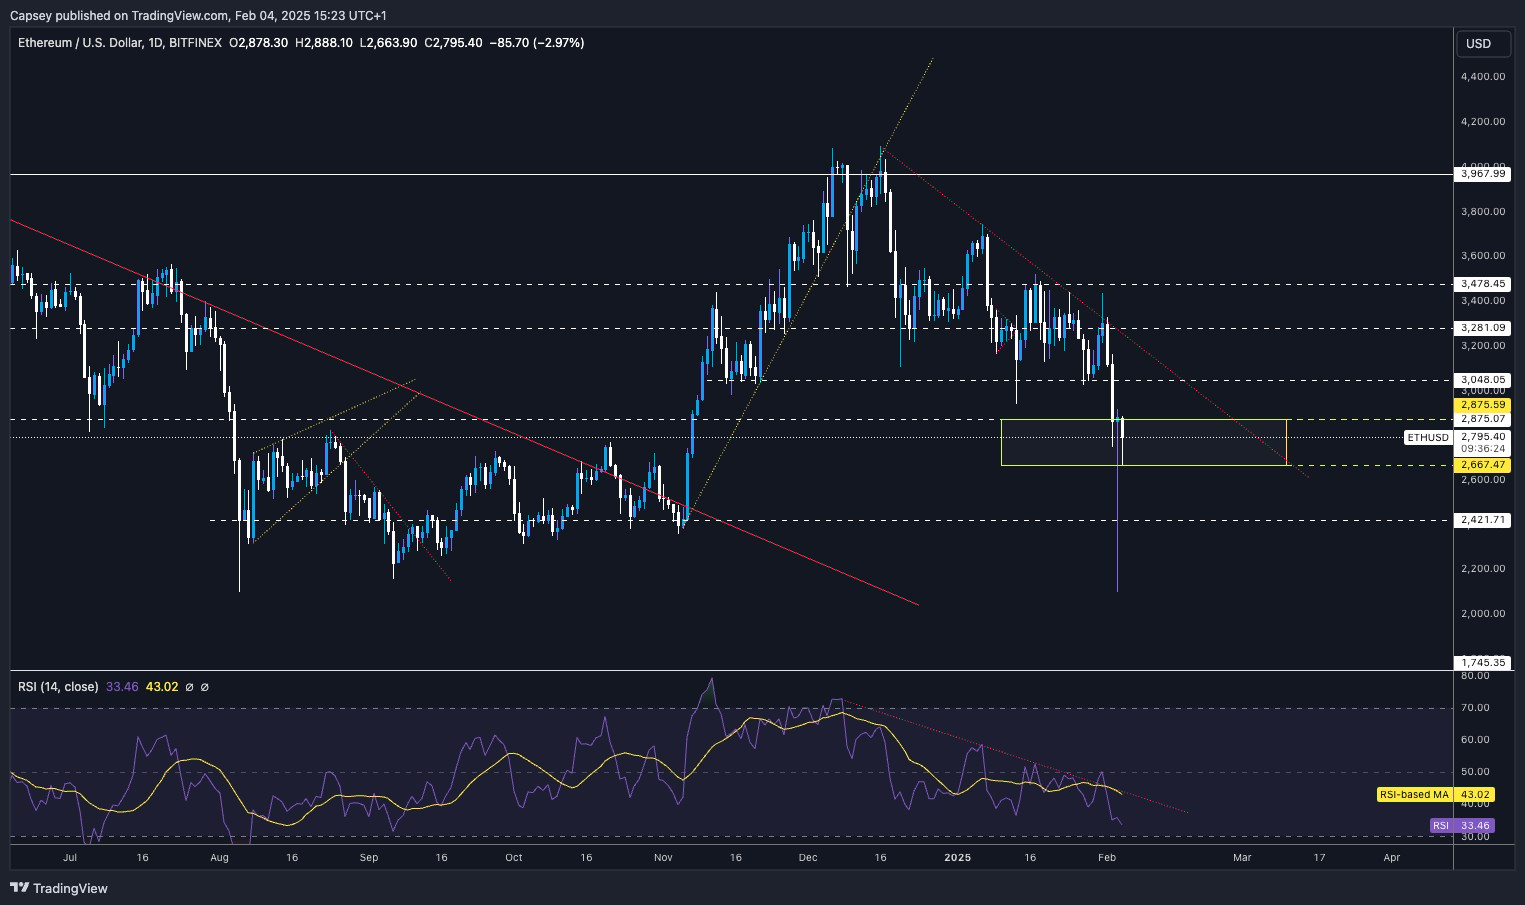
Technical analysis
- ETH rejected into the horizontal resistance of $3,480. A failed breakout then sent the price to $3,280, which also couldn't hold.
- The capitulation event sent ETH well below the next horizontal support of $2,420, but the price has recovered and is now trying to stabilise around the Yellow Box - which has now been filled, as we called for.
- $2,600 is the next horizontal support, whilst $2,875 is the next horizontal resistance.
- ETH's RSI is close to being oversold, and it remains well below its moving average.
- Next Support: $2,600
- Next Resistance: $3,050
- Direction: Bearish/Neutral
- Upside Target $3,050
- Downside Target: $2,400
Cryptonary's take
We'd expect the price to take some time to establish a new range here, likely between $2,600 and $3,050. Whilst the price remains in the downtrend, we'd expect it to be range-bound, and therefore, we're not expecting any major breakouts anytime soon. If the price were to revisit the $2,300's, that might be worth a bounce play. But, other than that, we're not too interested in ETH at this moment in terms of trading opportunities.SOL:
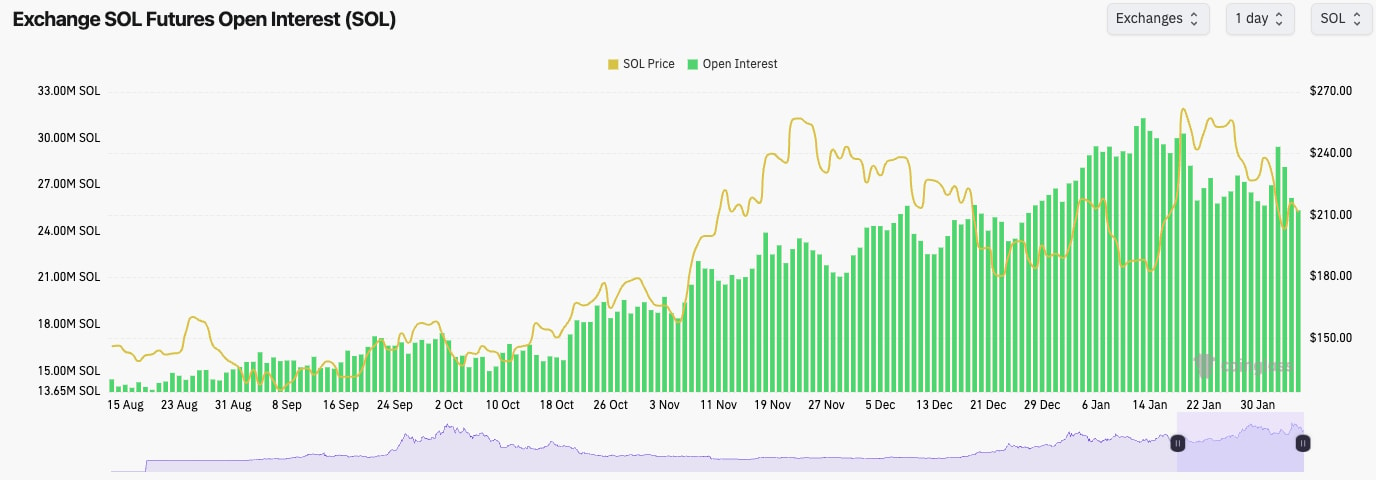
- SOL's Open Interest kicked up but then pulled right back down again as the Sunday/Monday liquidation event unfolded. Ultimately, the OI has remained in a downtrend since the start of the year.
- Like ETH, SOL's Funding Rate fluctuates from positive to negative, indicating indecision amongst traders who are likely also being whip-sawed by the price action.
Technical analysis
- SOL did really well in bouncing aggressively and recovering at the $203 horizontal level.
- Today, the price has moved lower and bounced off $203 as new support.
- For now, the price remains below the horizontal level of $222. A reclaim of that level would be the bullish reversal we'd be looking for.
- If the price breaks back below $200, the key level to then hold will be $182.
- The RSI is in the middle territory, but it's currently well below its moving average, which may mean the price can rebound higher in the short term.
- Next Support: $203
- Next Resistance: $222
- Direction: Bearish/Neutral
- Upside Target $240
- Downside Target: $183
Cryptonary's take
SOL has broken down into the lower end of the major range (between $200 and $260). Ultimately, SOL needs to remain above $200, but we wouldn't rule out a revisit to $180 in the short term. To get the bullish reversal, we'd need to see a breakout of the downtrend line and a breakout of the horizontal resistance of $220. Until we see that, we'd remain patient, and in the immediate term, we're open to seeing some more downside (possibly $180).HYPE:
- HYPE has continued to use the horizontal support of $19.95 and the uptrend line as support.
- We've seen the $23 to $25 range act as a small resistance, but the price has managed to break above this level and head into $28, but the capitulation event brought it back.
- We've now seen HYPE break out to the upside again. If $28 can be surpassed, then $32 will be the next target. But we need to see that breakout of $28 to be convinced of this.
- The RSI is in the middle territory and above its moving average, so there is potential for this to break out higher.
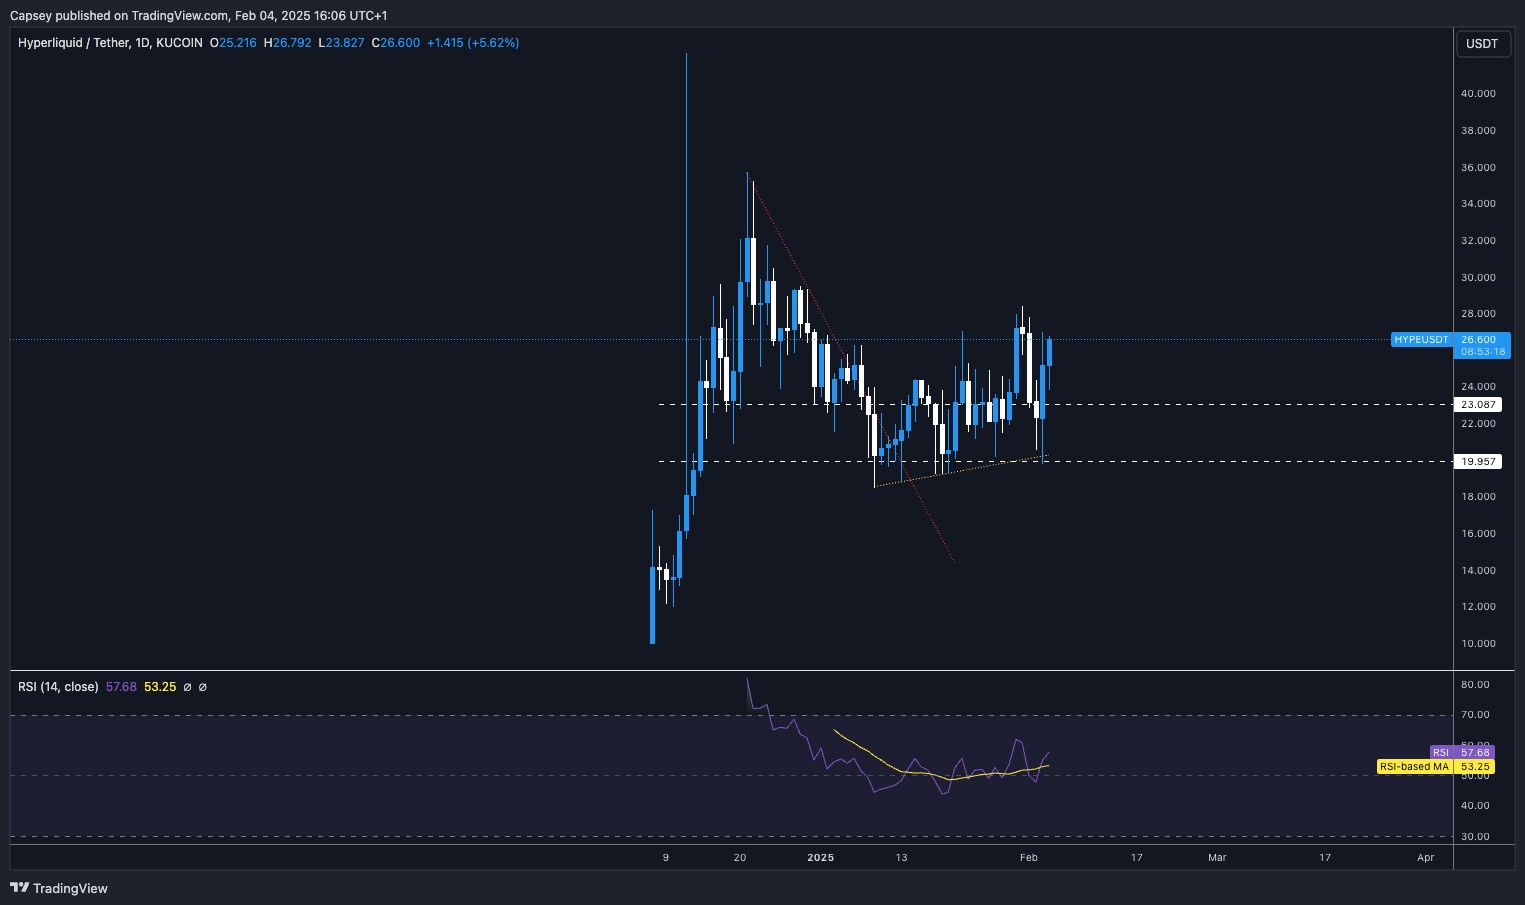
- Next Support: $19.95
- Next Resistance: $28
- Direction: Neutral
- Upside Target $32
- Downside Target: $20
Cryptonary's take
If BTC and the rest of the market hold up, then HYPE might be the next outperformer. But, we will need to see it break out of the $28 level to then get a more substantial upside. Ultimately, a break below $23 and then $19.95 would be a cause for concern. But we don't expect the price to lose $19.95 in the short term.SPX:
- SPX remains in its downtrend, and the price has now lost the horizontal supports of $1.00 (psychological level) and the $0.92 horizontal level.
- Price has found support at $0.76 horizontal support, but this was with big buying pressure (check the volume candle), and the price still wasn't able to reclaim back above $0.92. Note that a lot of the majors, BTC, SOL, etc, were able to recover the horizontal supports from which they initially broke down.
- Price will now potentially remain in the range of $0.76 to $1.00 in the short-term.
- If the $0.76 horizontal support is lost, we'd expect that $0.56 is only a matter of time.

- Next Support: $0.76
- Next Resistance: $1.00
- Direction: Bearish/Neutral
- Upside Target $1.00
- Downside Target: $0.56
Cryptonary's take
We're more cautious on SPX going forward. It's been a great play and is still a good meme, but we have seen ceilings for memes between the $1b and $3-$4b MCap range. SPX has hit $1.6b, which is high, and now it's possible that we'll see this capital rotate. Perhaps we're already seeing it.Hence, we'd always suggest profit-taking along the journey. In the short to medium term, we'd expect SPX to revisit the $0.56 horizontal support, but we do potentially see more range-bound price action between $0.76 and $1.00 in the very immediate term.
Recommended from Cryptonary


PRO
Market Direction
13 min read
Mar 17, 2026
PRO
Market Direction
12 min read
Mar 13, 2026

PRO
Market Direction
13 min read
Mar 10, 2026
