Save 23% ($351) & Get a Free 1-1 Call with our Team ⏰ : 0d 2h 59m 44s

Disclaimer: This is not financial or investment advice. You are responsible for any capital-related decisions you make, and only you are accountable for the results.
Tron ($TRX):
Overview
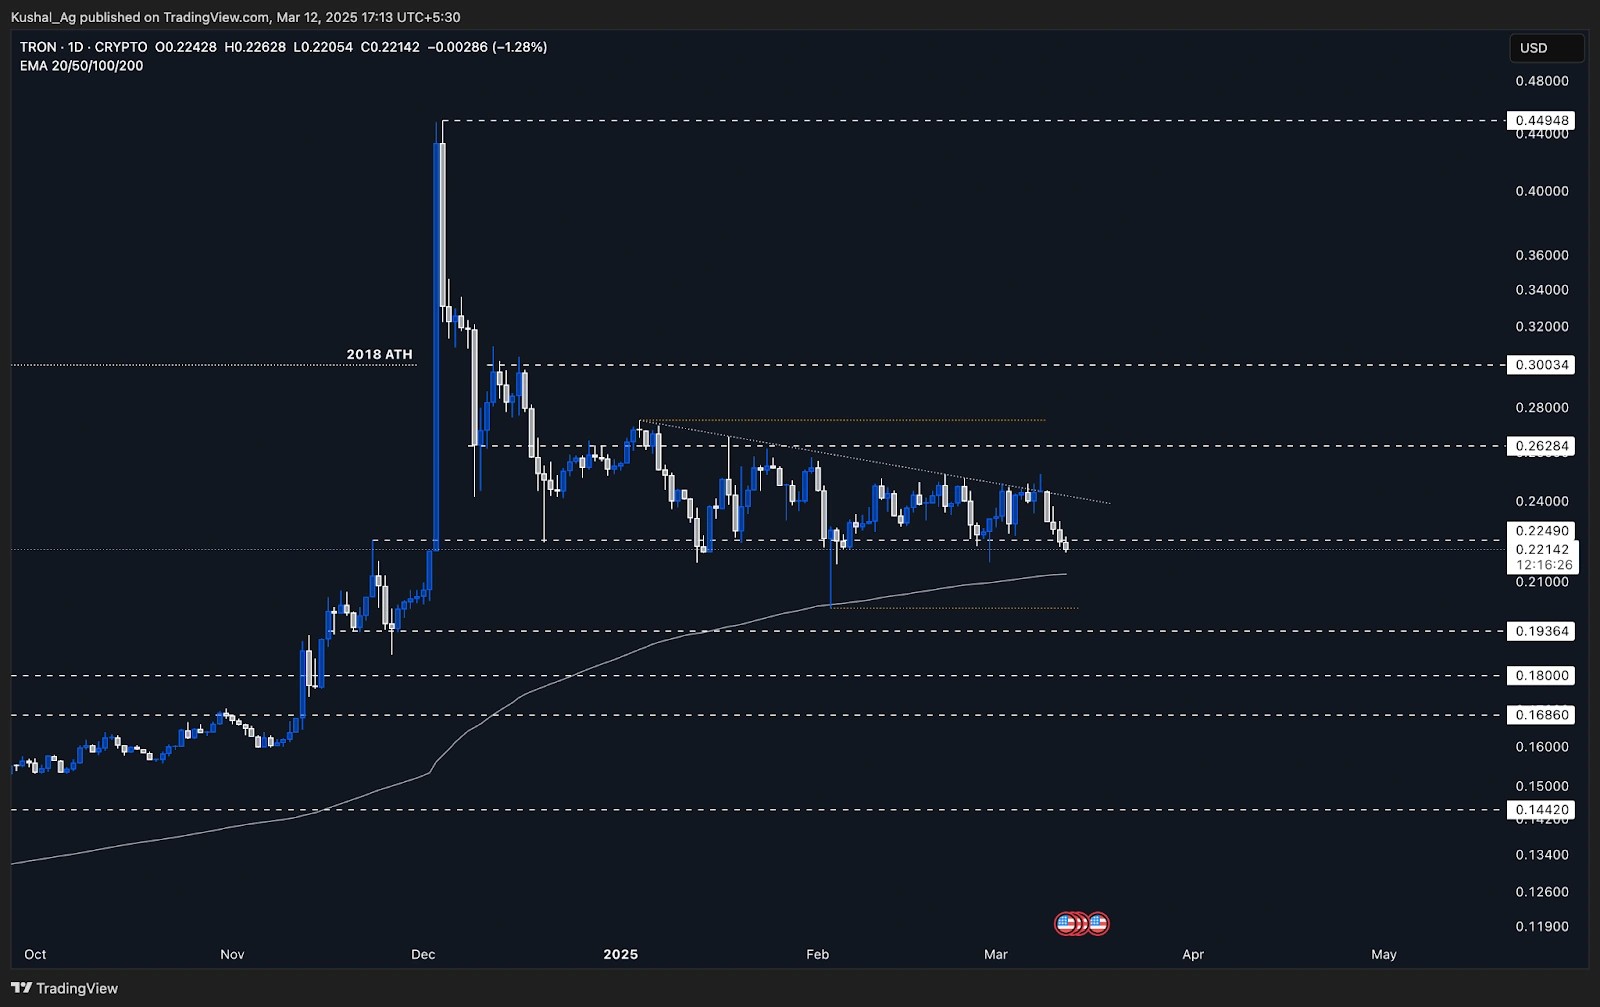
Tron ($TRX) has finally broken down below the $0.224 support area, which had held up well for the past few weeks. This break suggests increased downside pressure, and the price is now trading at $0.221, looking weaker compared to its previous structure.Given this breakdown, TRX appears to be heading toward its next major support-the 200 EMA on the daily timeframe, currently positioned at $0.212. The last time TRX tested the 200 EMA (in early February), it saw a strong bounce and recovery.
However, with the current broader market weakness, we need to wait and observe how the price reacts when it reaches this level.
Analysis
- Key Support Levels:
- $0.212 (200 EMA on Daily Timeframe): This is the immediate downside target and could provide a strong reaction if TRX follows its past behaviour.
- $0.200 (February Low): If the 200 EMA does not hold, TRX could slide further down to retest the February low at $0.200.
- Key Resistance Levels:
- $0.224 (Previous Support, Now Resistance): A reclaim of this level would indicate that the breakdown was a deviation and that TRX is ready to continue ranging.
- $0.262 (Upper Range High): If TRX reclaims $0.224 and bounces, this is the next major upside resistance.
- Current Market Structure:
- TRX has lost its range of support and is now shifting lower toward critical support zones.
- A reaction from the 200 EMA will be key to determining if TRX stabilises ostabilisess lower.
Potential Scenarios
- Bullish Scenario:
- If TRX holds the $0.212 (200 EMA) level and bounces, it could re-enter the previous range and attempt a reclaim of $0.224.
- Breaking back above $0.224 would invalidate this breakdown and could lead to a move back toward $0.262.
- Bearish Scenario:
- If TRX fails to hold the 200 EMA and breaks below $0.212, we could see further downside toward the February low of $0.200.
- If broader market weakness persists, a breakdown below $0.200 could accelerate losses further.
Cryptonary's take
TRX has broken its long-standing range, and unless it quickly reclaims $0.224, downside momentum is likely to continue. The 200 EMA at $0.212 is the key level to watch, and we need to see if TRX can hold this level and bounce like it did in February.If the $0.212 level does not hold, we could see TRX testing $0.200 in the coming days. However, if TRX reclaims $0.224, it would suggest this breakdown was a fakeout, and we could see a re-entry into the range. For now, we remain cautious and will wait for price action confirmations.
Pendle ($PENDLE)
Overview
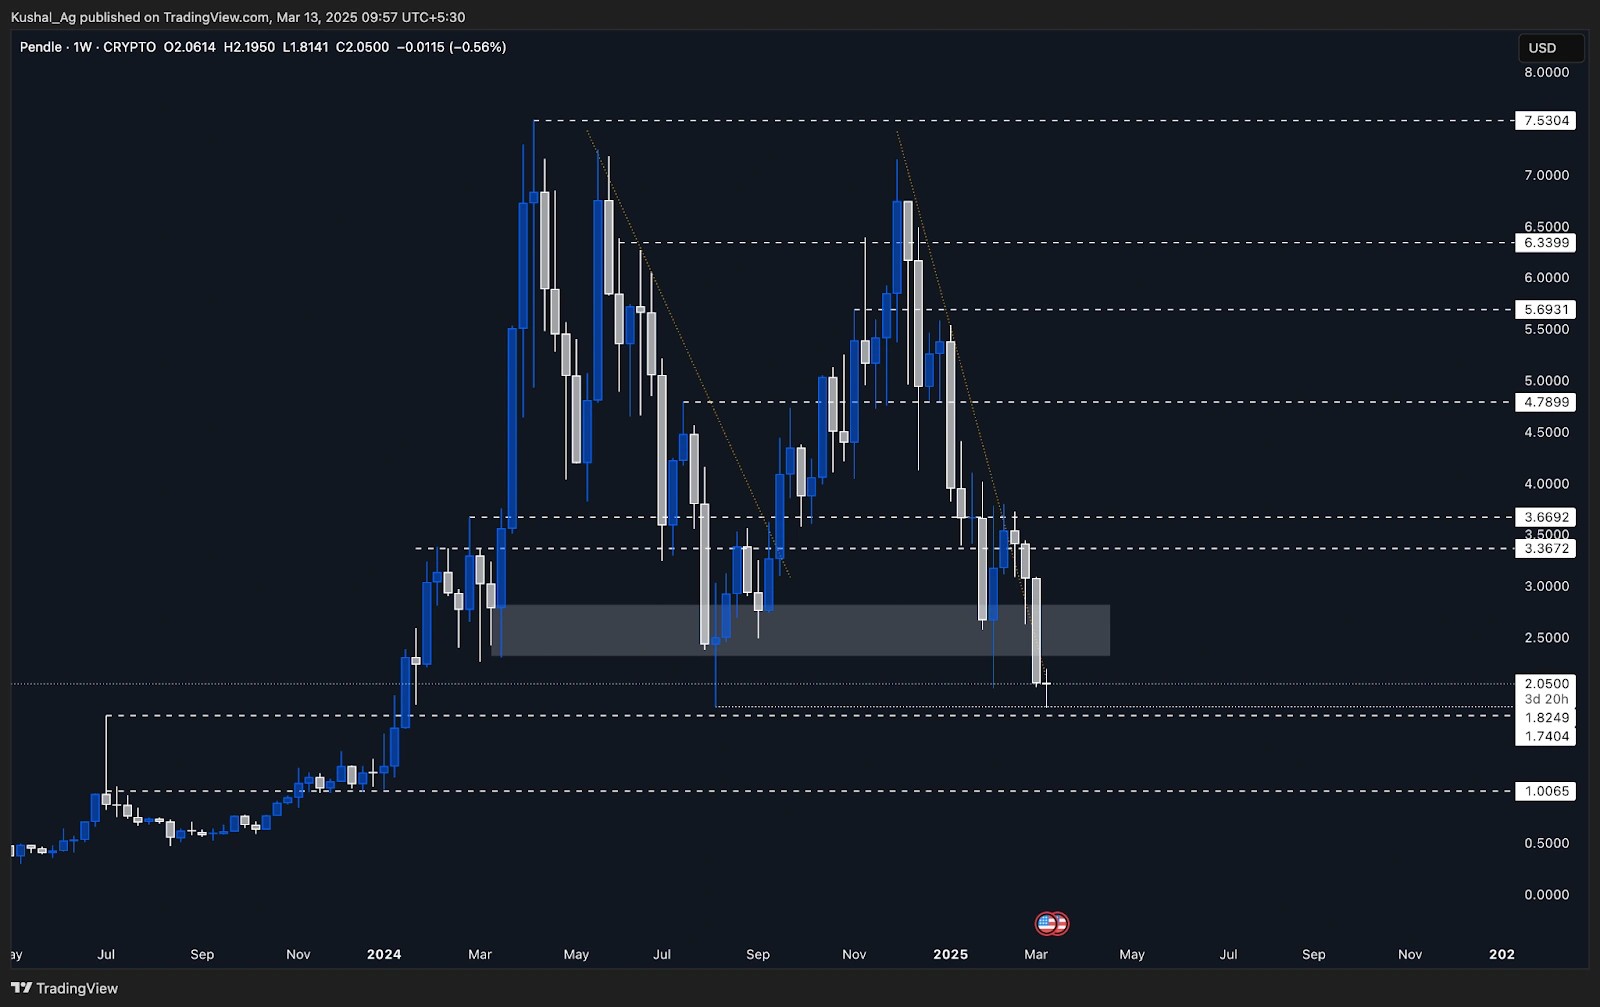
Pendle has shown significant weakness over the past few weeks, breaking below the critical 3-day timeframe demand zone and now on the weekly timeframe as well. The grey box demand zone (ranging from $2.80 to $2.32) has now been cleanly broken down, leading to a structural shift in price action.The market has retested August 2024 lows, where Pendle previously wicked to $1.825 before rallying to near its all-time high just north of $7 in December. However, this time, the breakdown below the demand zone suggests a deeper retracement and a need for Pendle to find a new base before any meaningful recovery.
Pendle made a fresh low around $1.814, compared to August 2024, and it looks relatively weaker than the rest of the altcoin market, which has seen some assets holding their key supports while Pendle has lost its crucial demand zone.
Analysis
- Key Support Levels:
- $1.824 (August 2024 Low): This was the previous structural low from which Pendle rebounded massively in 2024.
- $1.73: Another structural support level.
- $1.59 (200 EMA on the Weekly time frame): This is the major confluence zone, and if the price reaches here, it could act as a strong support level.
- Key Resistance Levels:
- $2.32 - $2.80 (Lost Demand Zone): This previously held as strong support but now acts as a resistance. Pendle needs to reclaim this zone to show any bullish strength.
- $3.36: If Pendle manages to reclaim the demand zone, this would be the next upside target and resistance zone.
- Current Market Structure:
- The break below the demand zone signals further downside unless reclaimed.
- Multiple strong supports are stacked between $1.824 and $1.59.
- If buyers step in around the 200 EMA ($1.59), it could mark a long-term accumulation area.
Potential Scenarios
- Bullish Scenario:
- If Pendle finds support around $1.824 - $1.73 and shows a strong bounce, we could see a reclaim of the $2.32 - $2.80 demand zone.
- Breaking back above the demand zone could lead to a rally toward $3.36 in the medium term.
- Bearish Scenario:
- If Pendle fails to hold above $1.824 and loses the $1.73 level, we could see a deeper retracement toward the 200 EMA at $1.59.
- A break below $1.59 would indicate further downside, and we would have to re-evaluate the price structure for potential support levels.
Cryptonary's take
Pendle has now entered a deeper retracement phase after losing its critical 3-day and weekly demand zone. The fact that August lows have been tested suggests this is a key inflection point.The next major move depends on whether buyers step in around the $1.824 - $1.73 region or if the price extends toward the 200 EMA at $1.59. Until we see a confirmed reclaim of the lost demand zone ($2.32 - $2.80), Pendle remains in a weak state.
For now, we are watching price action closely in this critical range, as multiple support layers make this a potential accumulation zone. If a base is formed, Pendle could stage a strong recovery, similar to its August 2024 structure. However, without confirmation of demand stepping in, downside risks remain.
Recommended from Cryptonary


