Save 23% ($351) & Get a Free 1-1 Call with our Team ⏰ : 0d 2h 59m 43s

Overall, the technical picture points to further near-term weaknesses. For instance, DOT has broken below its main uptrend line. SHDW continues its downtrend as hype fades. ARB and LDO have also broken uptrends, with lower support zones likely to prompt bounces. And SNX faces a pivotal test at the bottom of its key support zone.
However, as we’ve been saying over the last few weeks, the weakness in the market is pushing these assets towards more attractive long-term entry points.
At what point would we be interested in buying the dip on DOT, SHDW, ARB, LDO, and SNX?
Let’s dive in.
Disclaimer: Not financial or investment advice. You are responsible for any capital-related decisions you make, and only you are accountable for the results. “One Glance” by Cryptonary sometimes uses the RR trading tool to help you quickly understand our analysis. They are not signals, and they are not financial advice.
DOT update
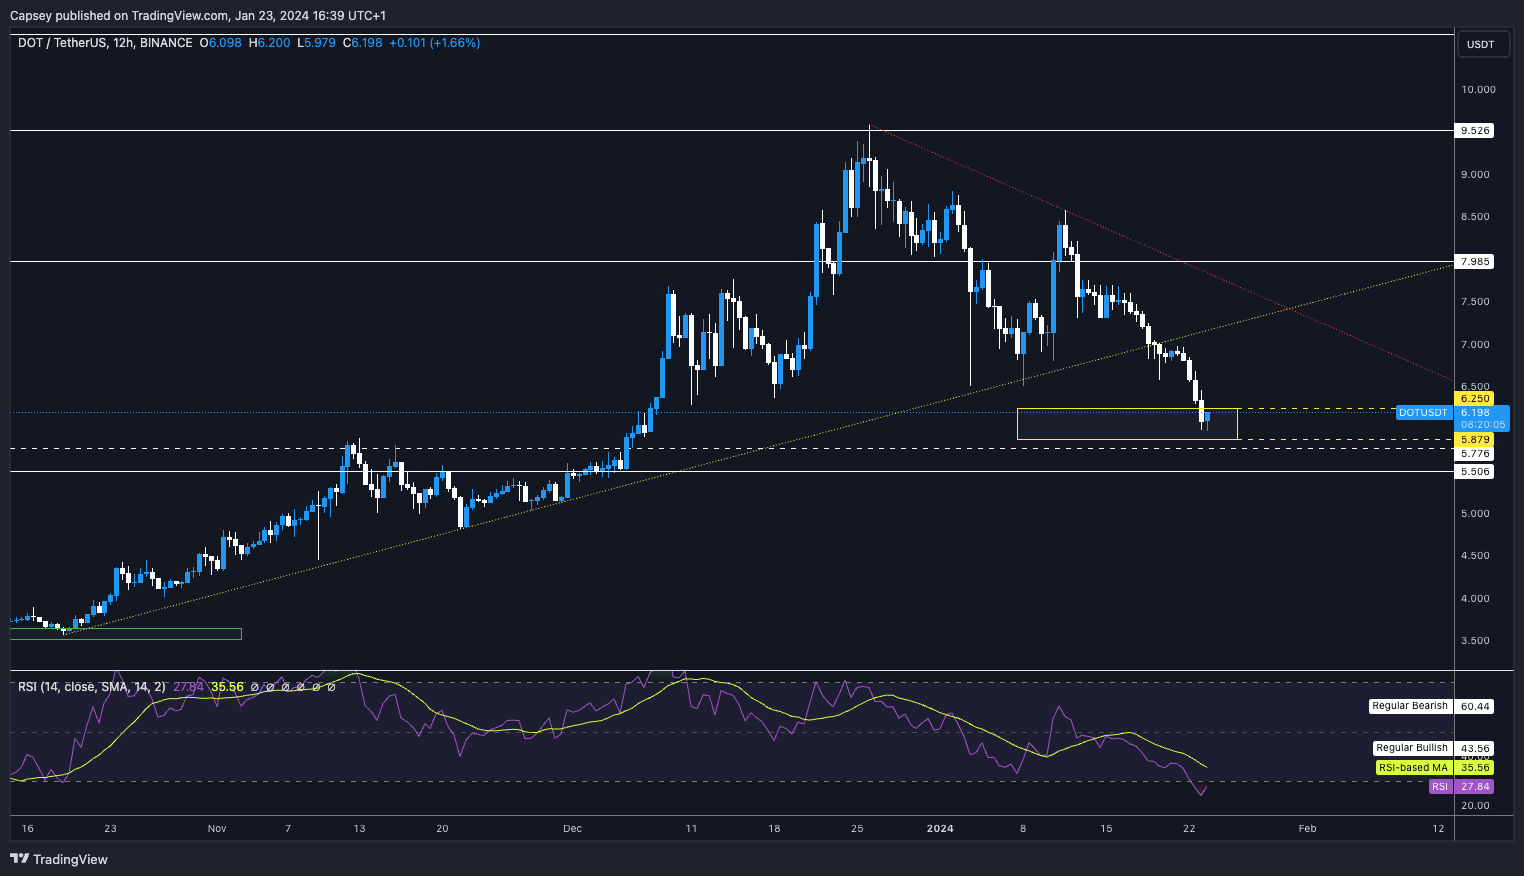
- DOT has an interesting setup here, having rejected from the horizontal resistance of $9.52.
- Price then could not hold the next horizontal level of $7.98 before finding some support and a bounce from the uptrend line.
- Price has now broken below the main uptrend line and has entered the yellow box. This will likely become a new support, and we could see a relief bounce from here.
- The RSI on the 4hr is heavily oversold, while the 12hr is also in oversold territory.
Cryptonary's take
DOT is now entering a support zone and an area from which price could bounce. It's possible that price will move higher from the yellow box to test the $6.80 level. That will then be the key level to assess whether price can overcome that local resistance.SHDW update
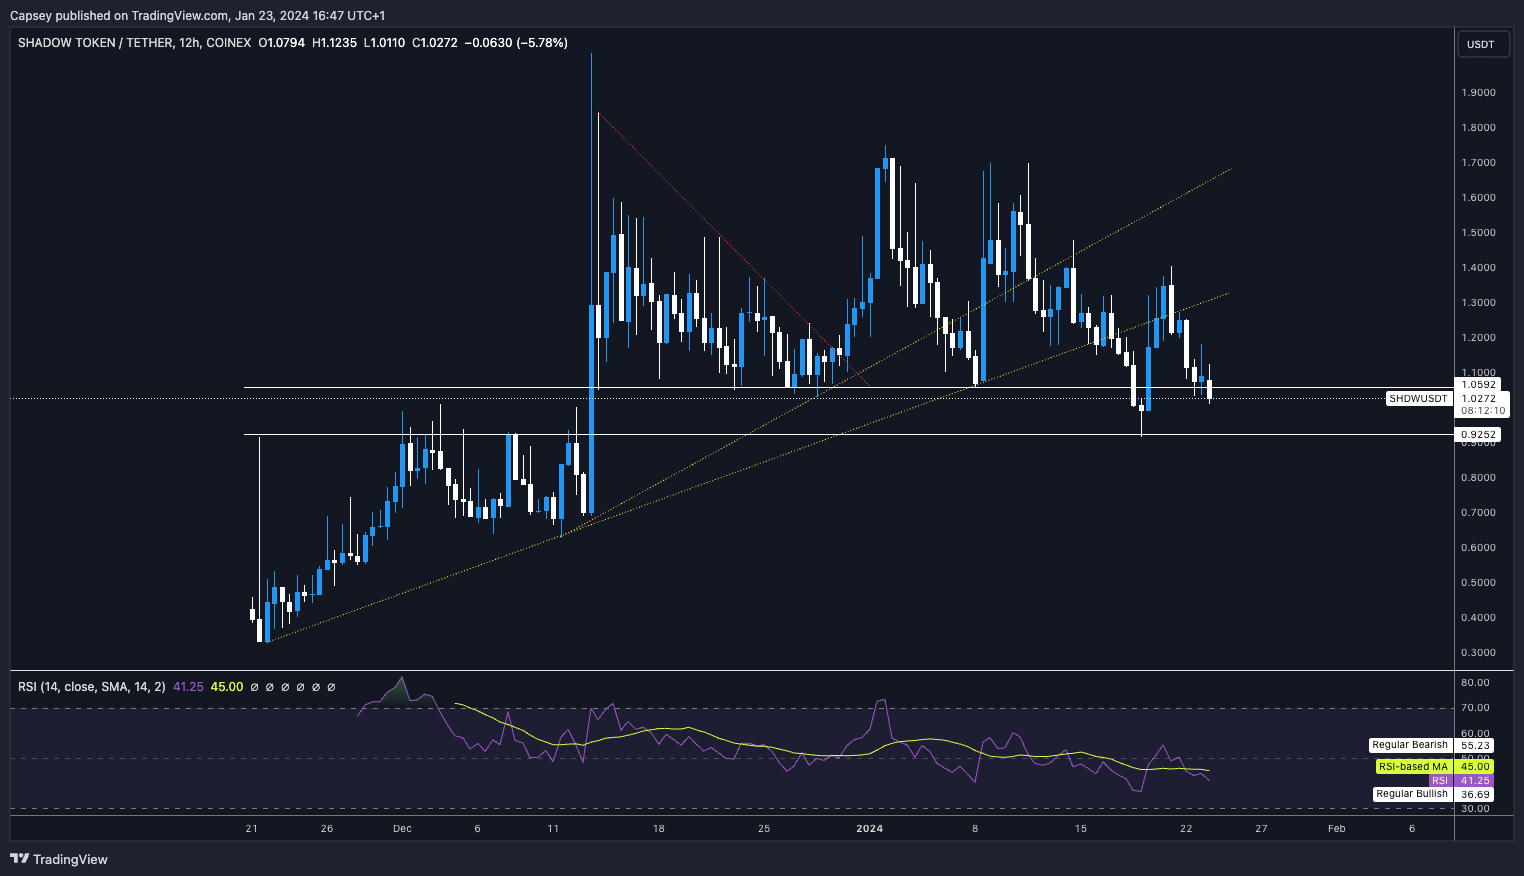
- SHDW is an asset we like for the long-term, but we are greedy with this – we want it cheaper.
- SHDW is now out of both its uptrend lines, and now into a more sustained downtrend.
- There is a key range for price at and between both the horizontal level of $0.92 and $1.05.
- The RSI is clean here, there is no real major sell-off here. This makes us think this could be one of those coins that if it loses $0.92, you could see $0.50 to $0.70.
Cryptonary's take
Tough one to play this as the chart doesn't give you bundles of info. Our feeling is that anything sub $0.92 is good for the long run. Therefore, orders at and just below $0.92 should be light in USD value. And then, the more price goes below $0.80, the greater the size of the new orders should be.Patience on this; there will be a period where the hype fades, and that's the time to pick it up.
Let this come to you, patience in the meantime.
ARB update
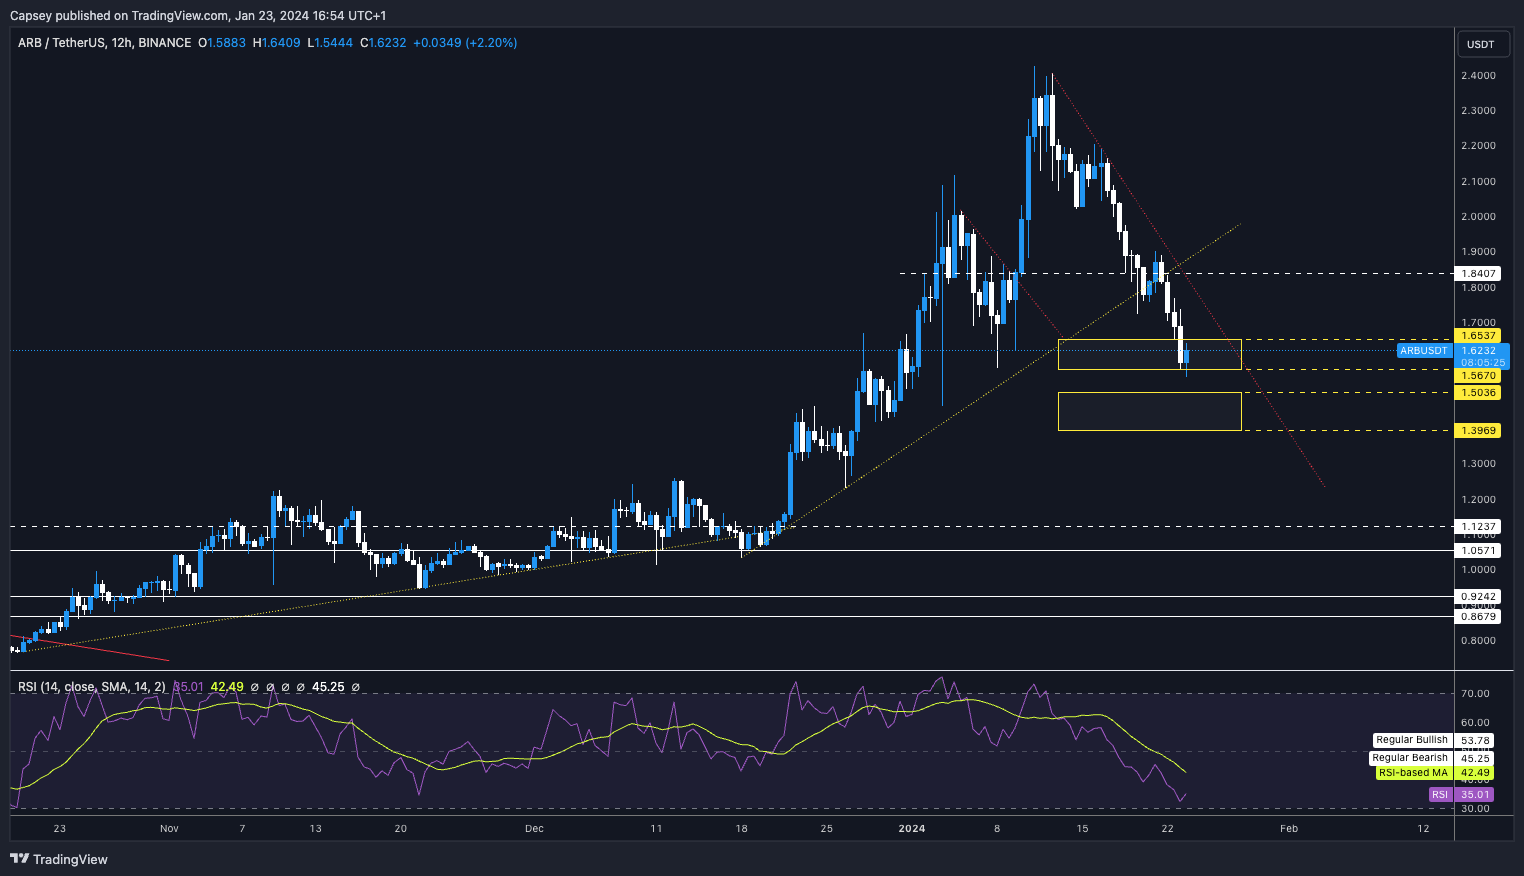
- Tricky spot here with ARB with price moving into the top yellow box, but not near oversold territory.
- Price put in a new high with a bearish divergence, which saw a major rejection.
- Price then lost its uptrend while continuing in a really clean downtrend.
- There are now two key levels of support, both are the yellow boxes.
Cryptonary's take
Due to price being in the top yellow box and not being in oversold territory yet, we are more inclined to wait for the lower yellow box to add to ARB.However, ARB isn't one we hold or will look to buy in the future. we’d rather hold ETH and other ETH beta plays.
But if you're a fan of ARB, the second/lower Yellow box looks the more attractive price point for an entry.
What we'd then be looking for is for price to form a support and breakout of the red downtrend line.
LDO update
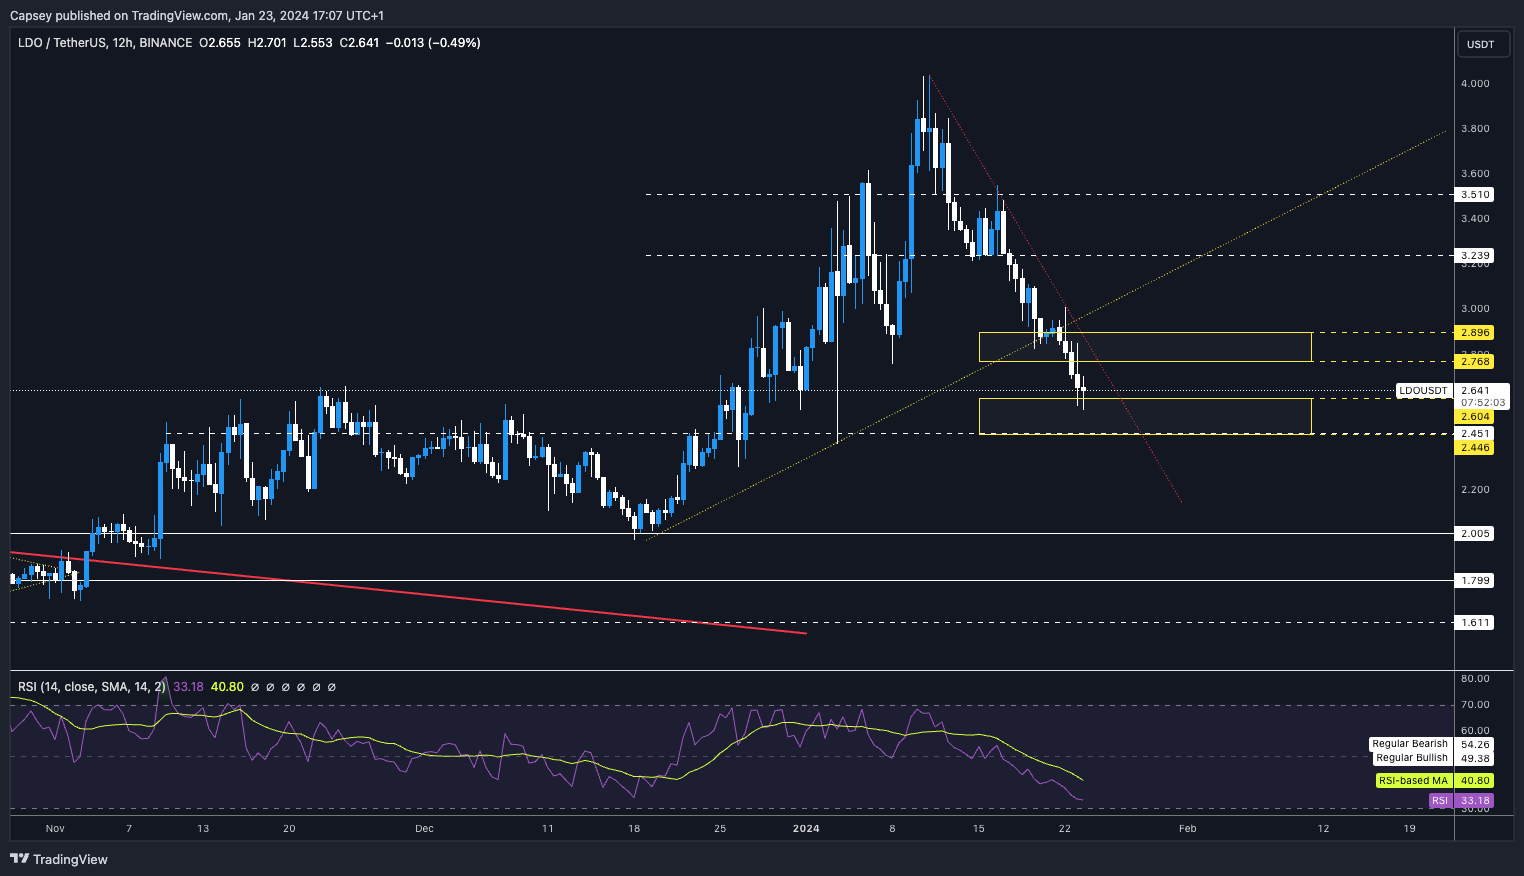
- Similar setup to ARB in that there are two yellow boxes layered, with the lower being the more likely bounce zone.
- The top yellow box, along with the convergence of the uptrend line, should have been a relatively strong support. However, after a few days, it was unable to hold.
- LDO is now approaching oversold levels on the RSI but not yet oversold.
Cryptonary's take
The lower yellow box between $2.44 and $2.60 feels as if it'll be the bounce zone.However, we would like to see the RSI move more into oversold territory first. Once support is formed in the yellow box (hopefully), we would then look for a breakout of the downtrend line.
This would be the signal for a bullish reversal.
SNX update
- SNX is at a really pivotal level here at the bottom of the yellow box. Having tested it already a number of times, it's possible price may struggle.
- The RSI is oversold on the 12hr but not 4hr, quite uncommon.
- Ideally, price needs to hold the yellow box and push for a breakout of the downtrend line, if not, the $2.74 horizontal level is the next target.
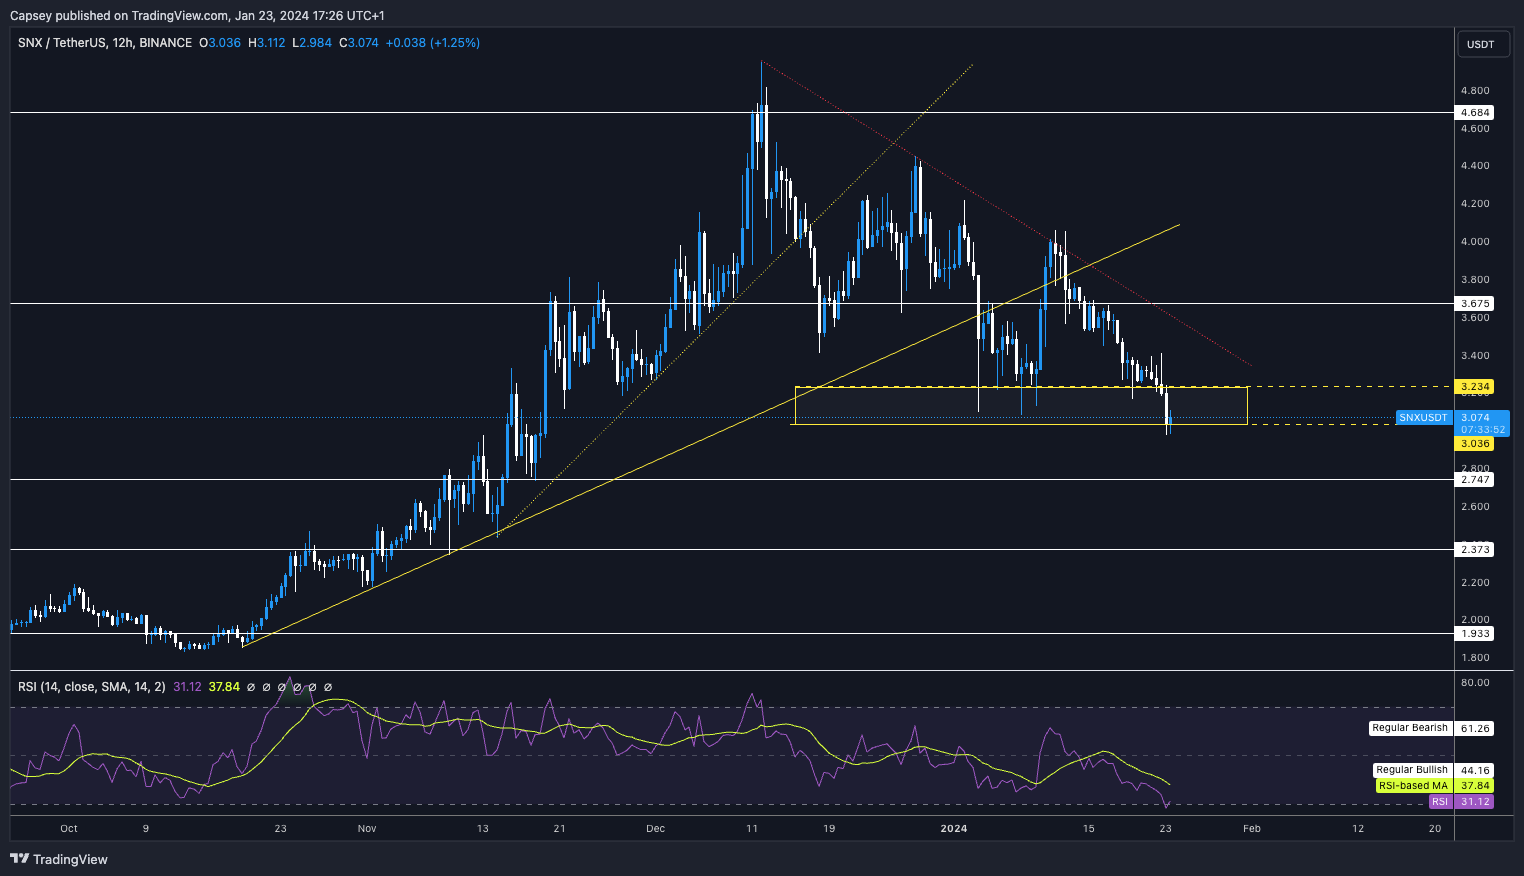
Cryptonary's take
Ultimately, we're watching to see if this can hold its support level and then break out of the downtrend line.We see the longer-term accumulation levels for SNX between $2.37 and $2.74.
Recommended from Cryptonary


