Save 23% ($351) & Get a Free 1-1 Call with our Team ⏰ : 0d 2h 59m 44s

Disclaimer: Not financial nor investment advice. You are responsible for any capital-related decisions you make, and only you are accountable for the results.
Macro
The picture at the moment is quite clear, inflation is the highest it’s been for over 40 years (9.1%) whilst we are beginning to see some cracks in the economic data. The FED has a dual mandate of price stability and a healthy job market. FED Chair Powell has been clear in that the FED’s current priority is to bring inflation down which they are doing through aggressive rate rises. However, we are beginning to see that some of the data in the jobs market is beginning to decelerate whilst some of the components that make up the Inflation Rate are beginning to accelerate. This indicates that we may have more higher inflation prints to come and that the FED may need to continue raising rates to bring down demand, but we are seeing this creep into some of the economic data.Currently, the markets are at an inflection point. It seems in recent weeks that the markets have turned their attention more towards the information on slowing growth rather than inflation. This is possibly wrong and the markets may be steered back to the inflation narrative if we continue to get higher prints.
TLDR
- Recently, the markets have placed a greater focus on lower economic growth rather than inflation. This may be a mistake from the markets.
- Many of the address’s cohorts have been increasing in total addresses number, signaling a buying approach among them. However, the key cohort we watch – the ‘Addresses with Balance > 1,000 Bitcoin’ is still risking-off (of not buying).
- The Hash Ribbon metric indicates that miner capitulation may be coming to an end in the coming weeks/months. This is usually the last stage of a bear cycle.
Total Market Cap
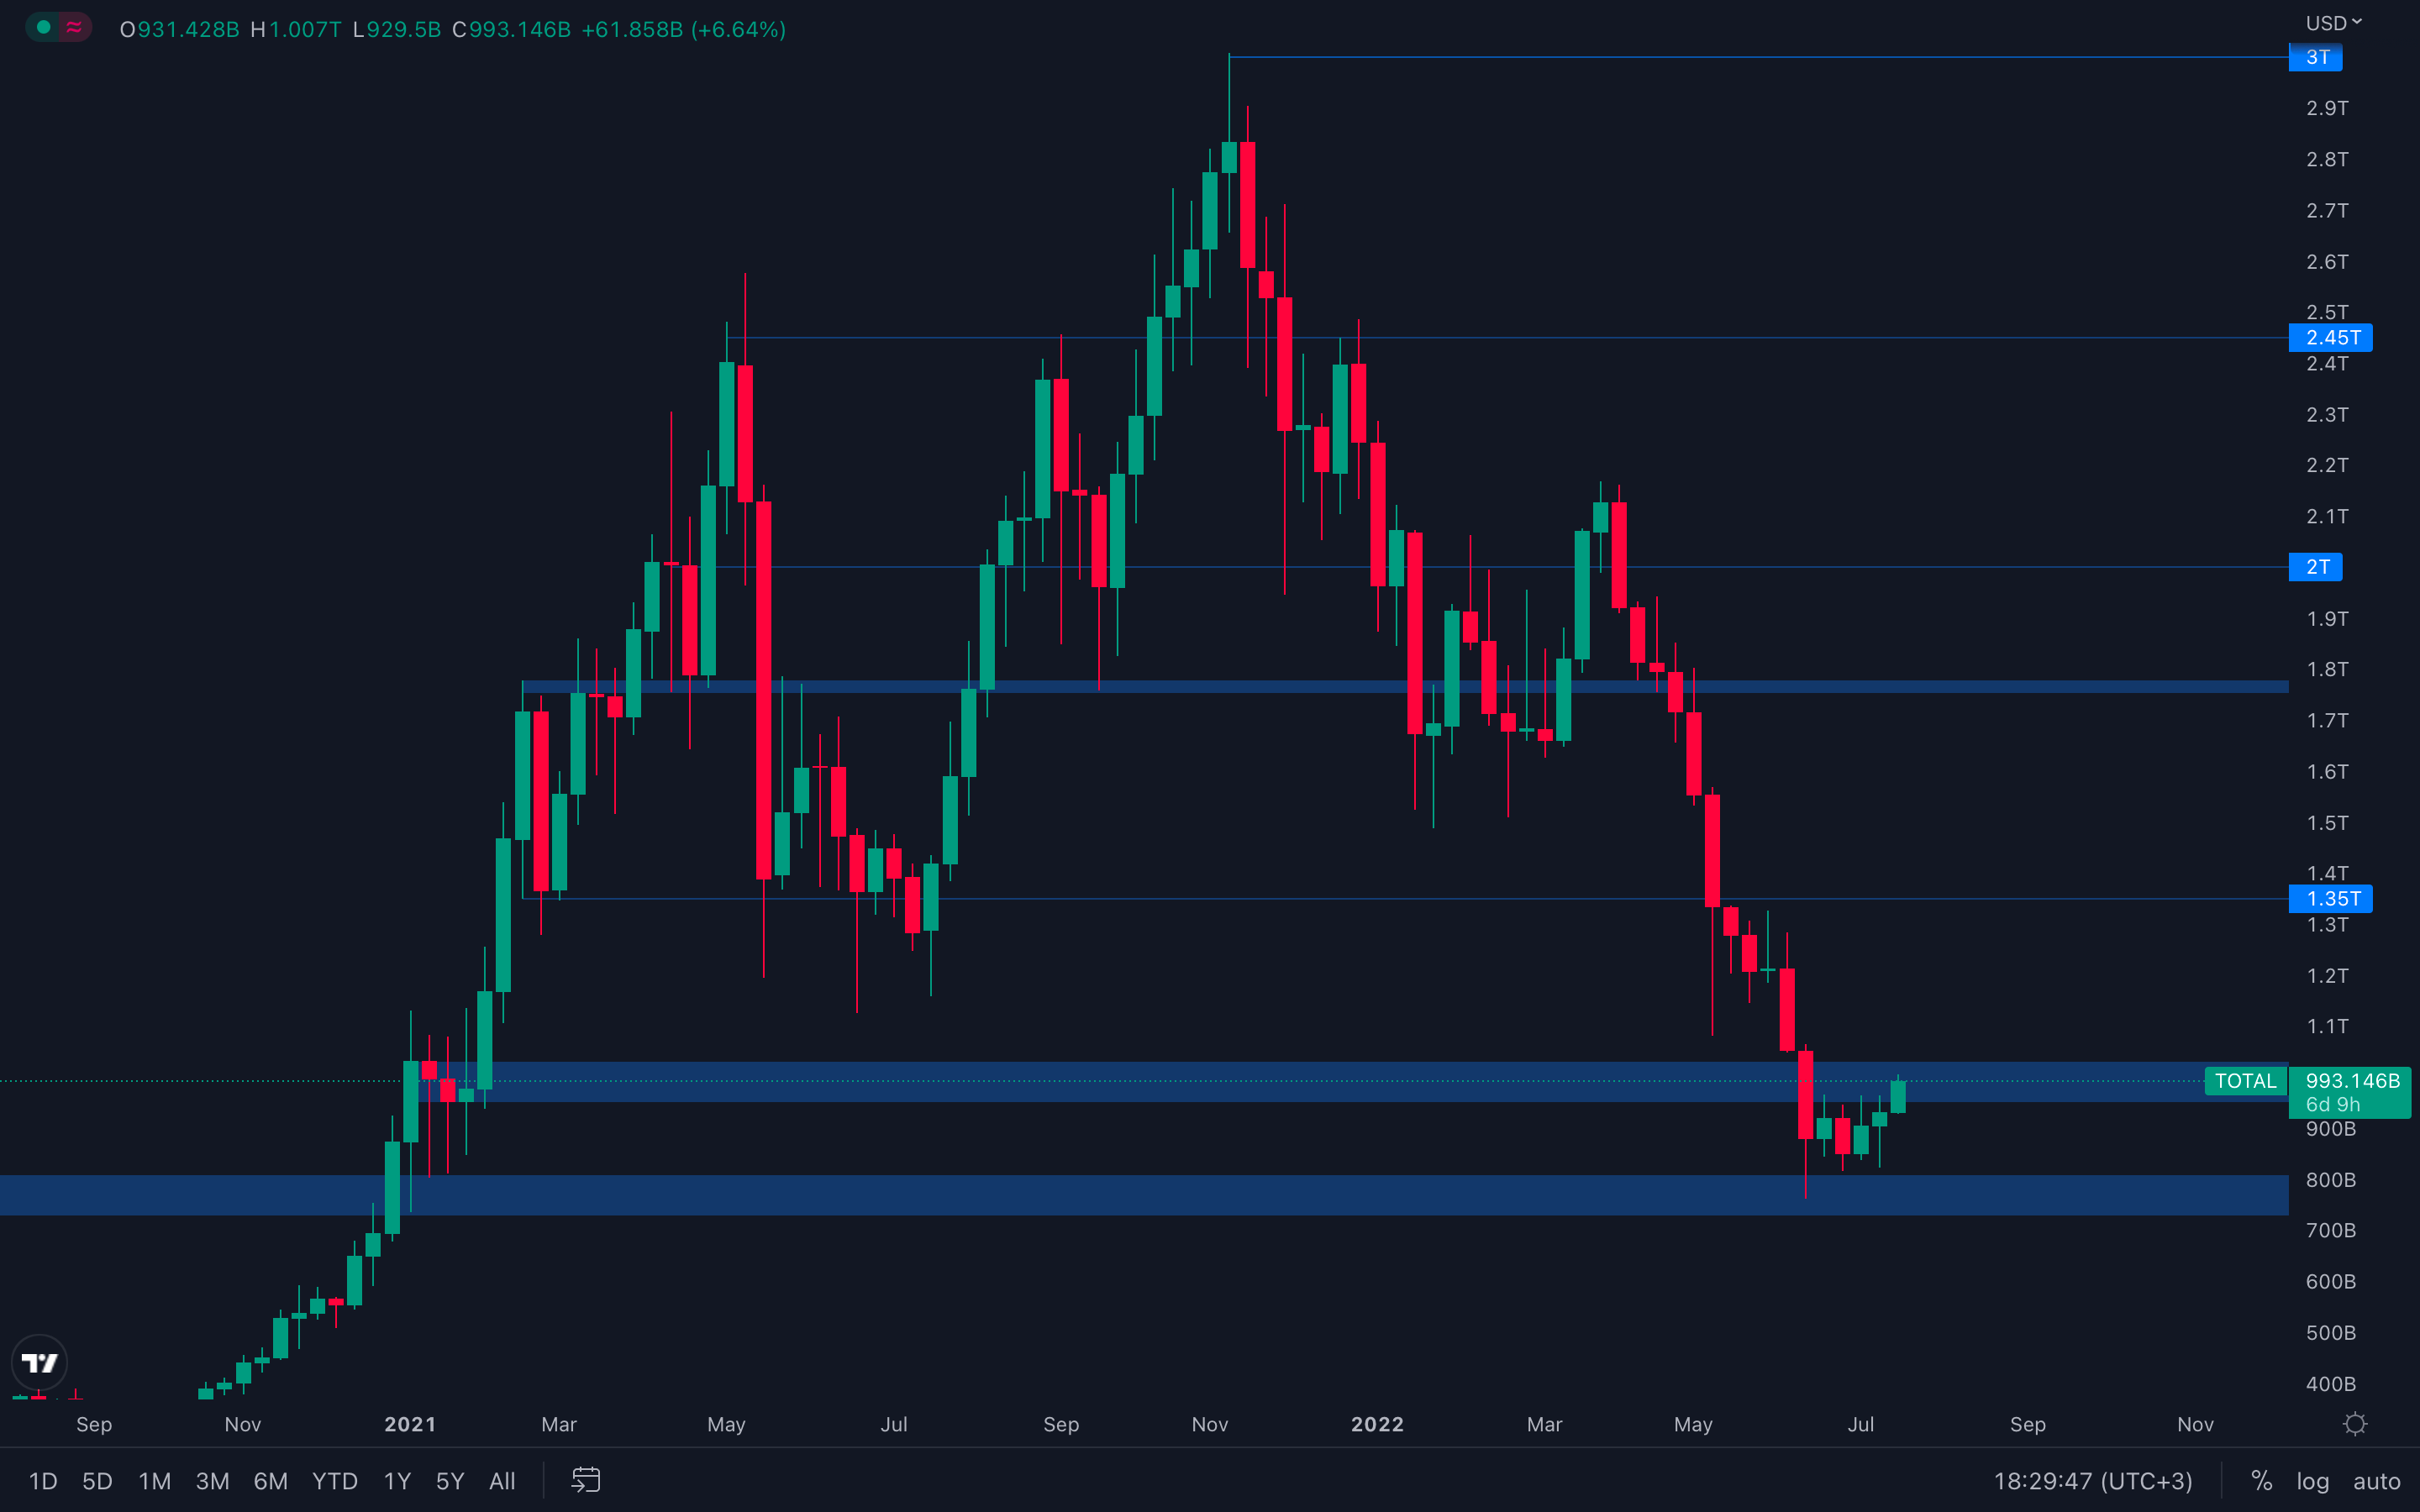 Interesting turn of events for the crypto market - last week, we mentioned the possibility of the Total Market Cap testing the top part of its $800B - $700B range, but it only managed to descend to $824B before buyers stepped in and closed another green weekly candle, something we haven't seen happen in months. A strong early-week rise followed, with the Total Market Cap finally testing its $1T psychological level. However, the question remains - what's next?
To answer that question, we'll first need to remind ourselves that the macro conditions still haven't changed and that the crypto market is still at risk. Think of the current price action as what it is at its core - a bear market pump, nothing more and nothing less. At some point, the buying pressure will be put to an end and sellers will regain control once more. Now, to directly answer the question, unless the $1T is reclaimed on the weekly timeframe, no further upside can actually be confirmed. This level acts as a threshold between two different territories, as a $1T reclaim can indicate a rise as high as $1.35T, a 35% increase. Until that happens, the Total Market Cap can easily find resistance at this level and start to descend further.
Altcoins Market Cap
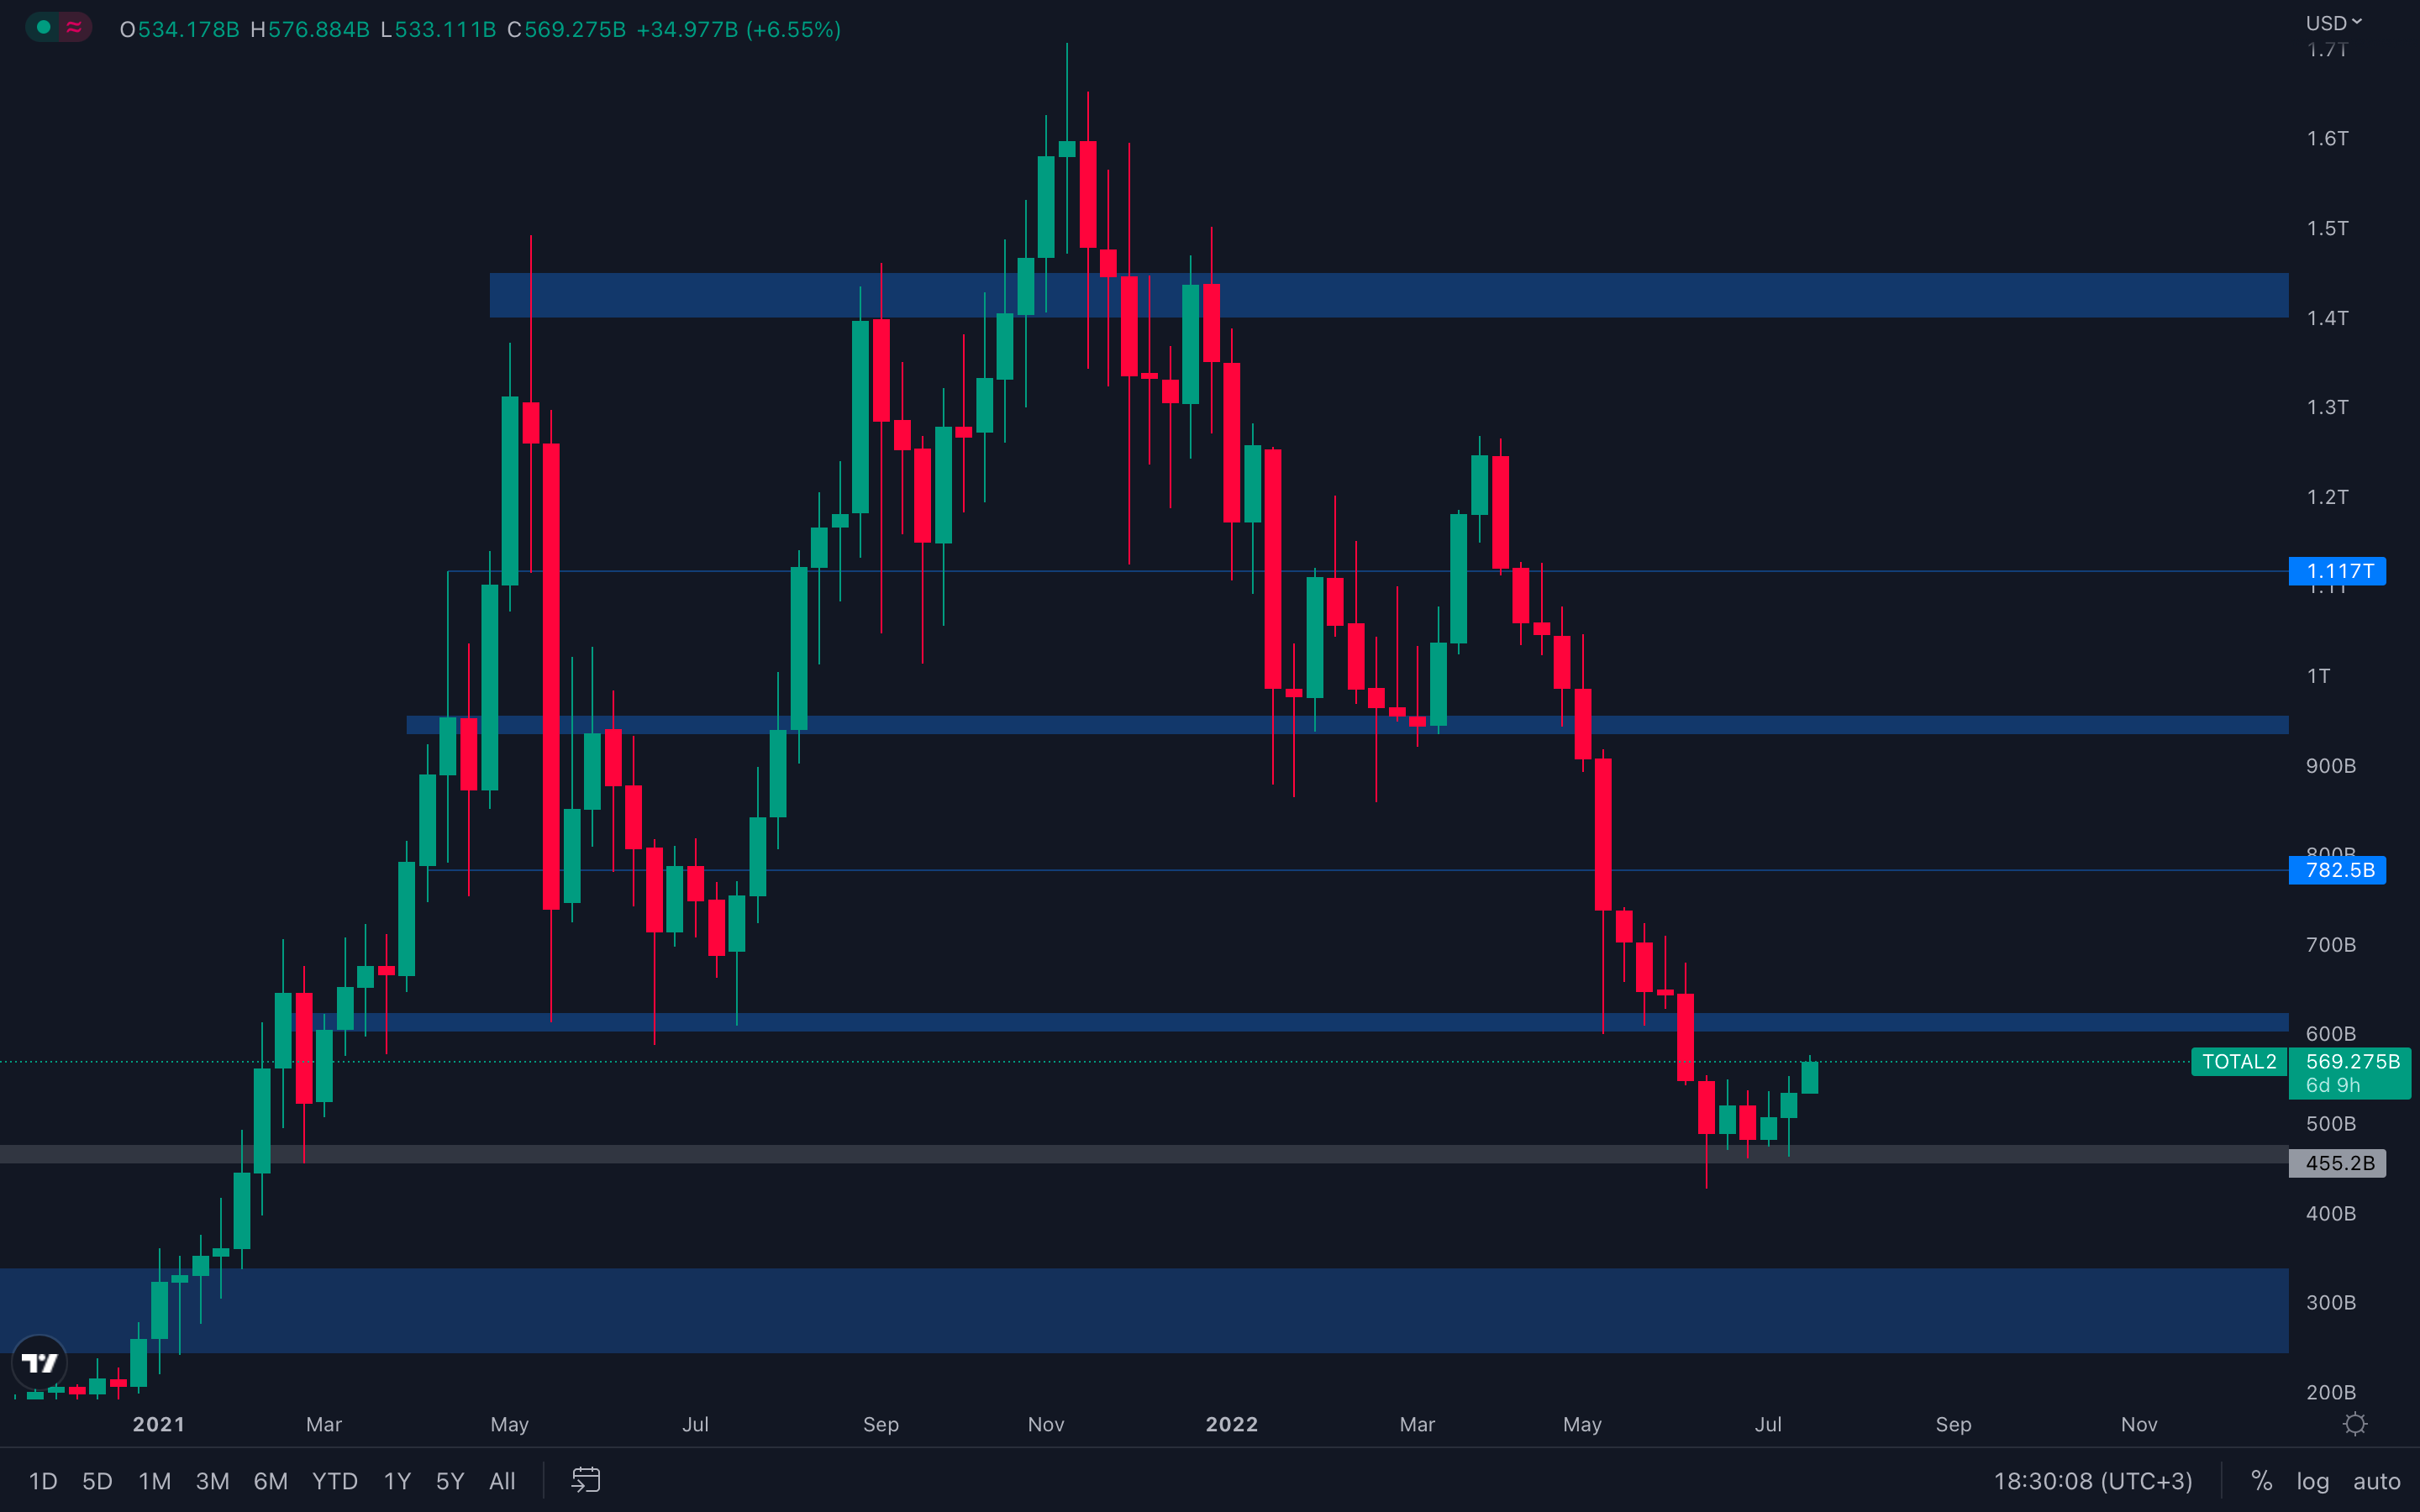 The Altcoins Market Cap has also experienced strong buying pressure last week and is currently aiming for a $600B resistance test. Unless Bitcoin starts to aggressively descend, it's safe to assume the Altcoins Market Cap will test $600B in the near-future, but not the same can be said for higher levels. Prices will most likely start to descend once the Altcoins Market Cap reaches its $600B resistance level, as there's not really enough pressure required to break above it and reclaim the level on higher timeframes - don't forget, we're still experiencing uncertain times, no need to put our hearts and hope into the market, just our logical thinking. However, everything is possible in the crypto space, so if the $600B level is reclaimed on the weekly timeframe, expect further upside to the index's next key level, $782.5B.
Bitcoin - Technical & On-Chain Analysis
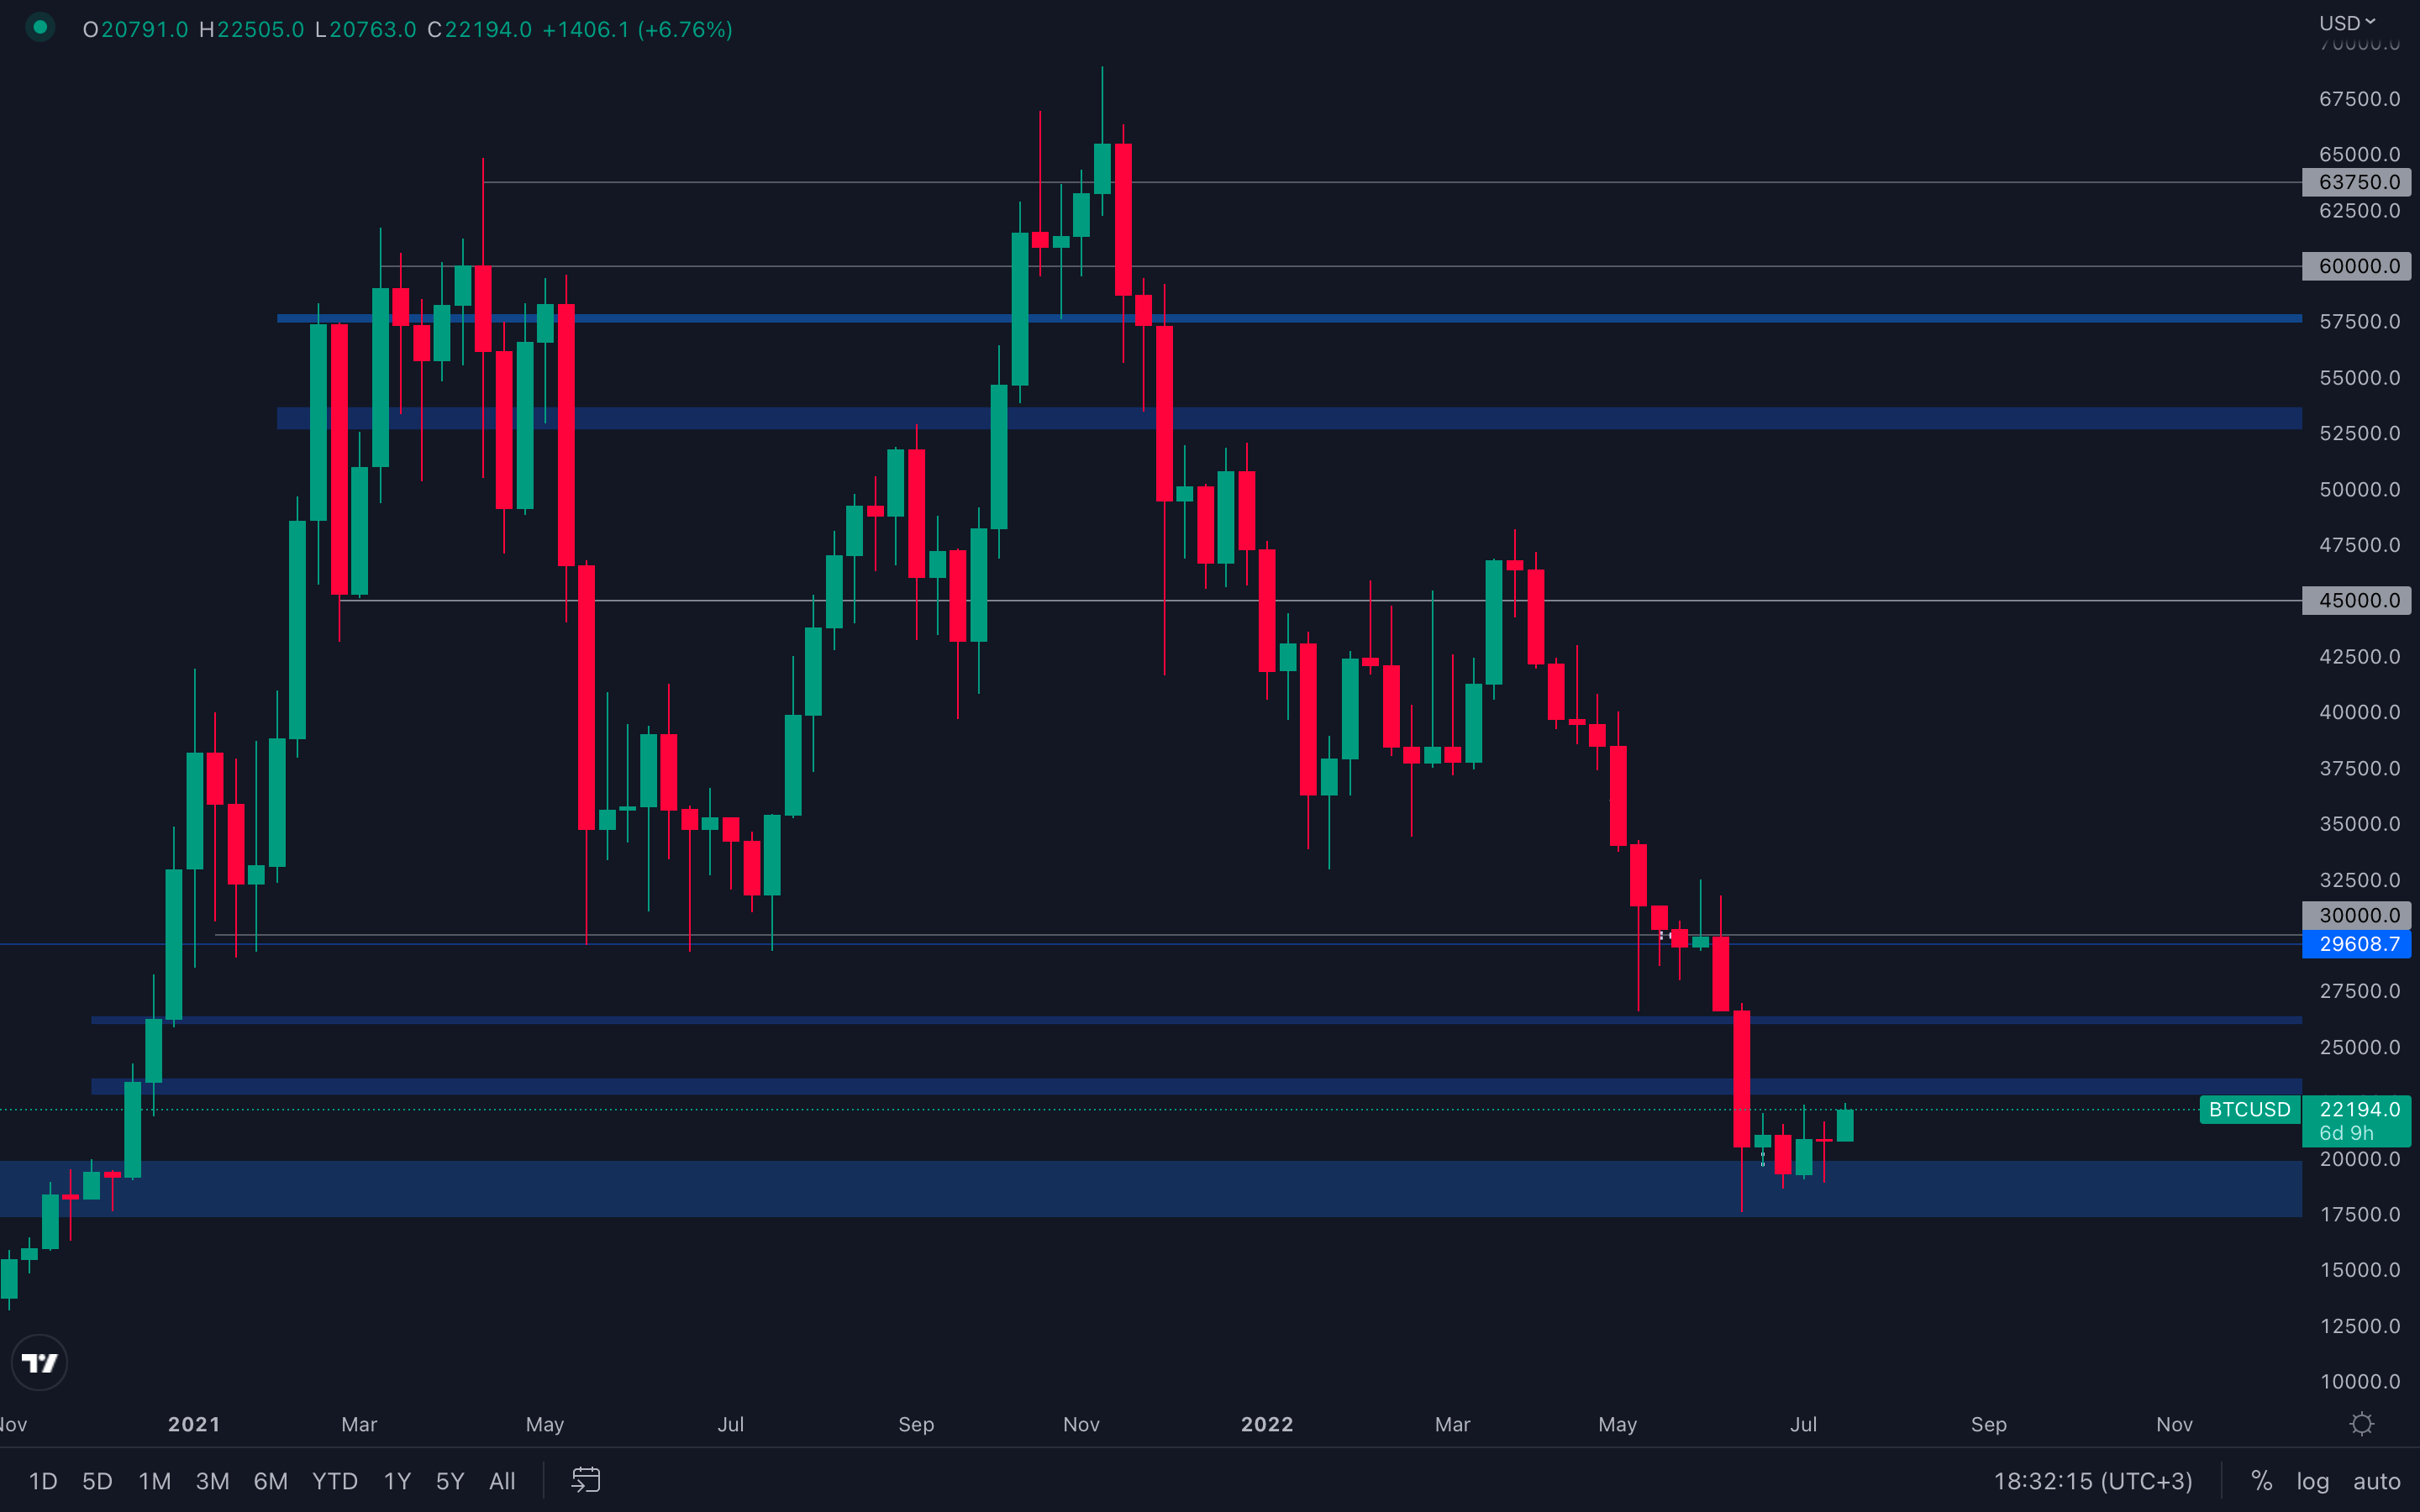 Not the best candle for a weekly closure, especially when expecting further upside. Even though Bitcoin is currently experiencing increased buying pressure, the price is slowly approaching a resistance level sitting at around $23,000. When also combined with the Total Market Cap data we've extracted above, the probabilities of Bitcoin getting rejected upon a test of resistance are considerable.
However, we also have to consider the possibility of Bitcoin closing this week above its $23,000 level. This weekly closure will provide a necessary confirmation for further upside to the next key resistance level sitting at $26,000. As we've mentioned already, we recommend treating this increase in price as nothing more than a bear market pump, because we all know how most of these end - back from where they started.
Metric 1 – Addresses
A significant portion of this report will focus on the Addresses metric. We have seen prices climb relatively well over the past week and it seems for the first time in a long time, that some assets are able to get some upside momentum. We will dive into the individual Addresses metrics to see possibly where the buy pressure has come from and if it is from the cohorts we should be trying to emulate. We will start with Bitcoin.
If we look into the below set of charts (list of the cohorts of wallets from the smallest wallets up to the largest wallets), we can see that the smallest wallets (from > 0.01 Bitcoin to > 1 Bitcoin) are as always increasing. No surprises here.
Bitcoin – Addresses with Balance > 0.01 Bitcoin
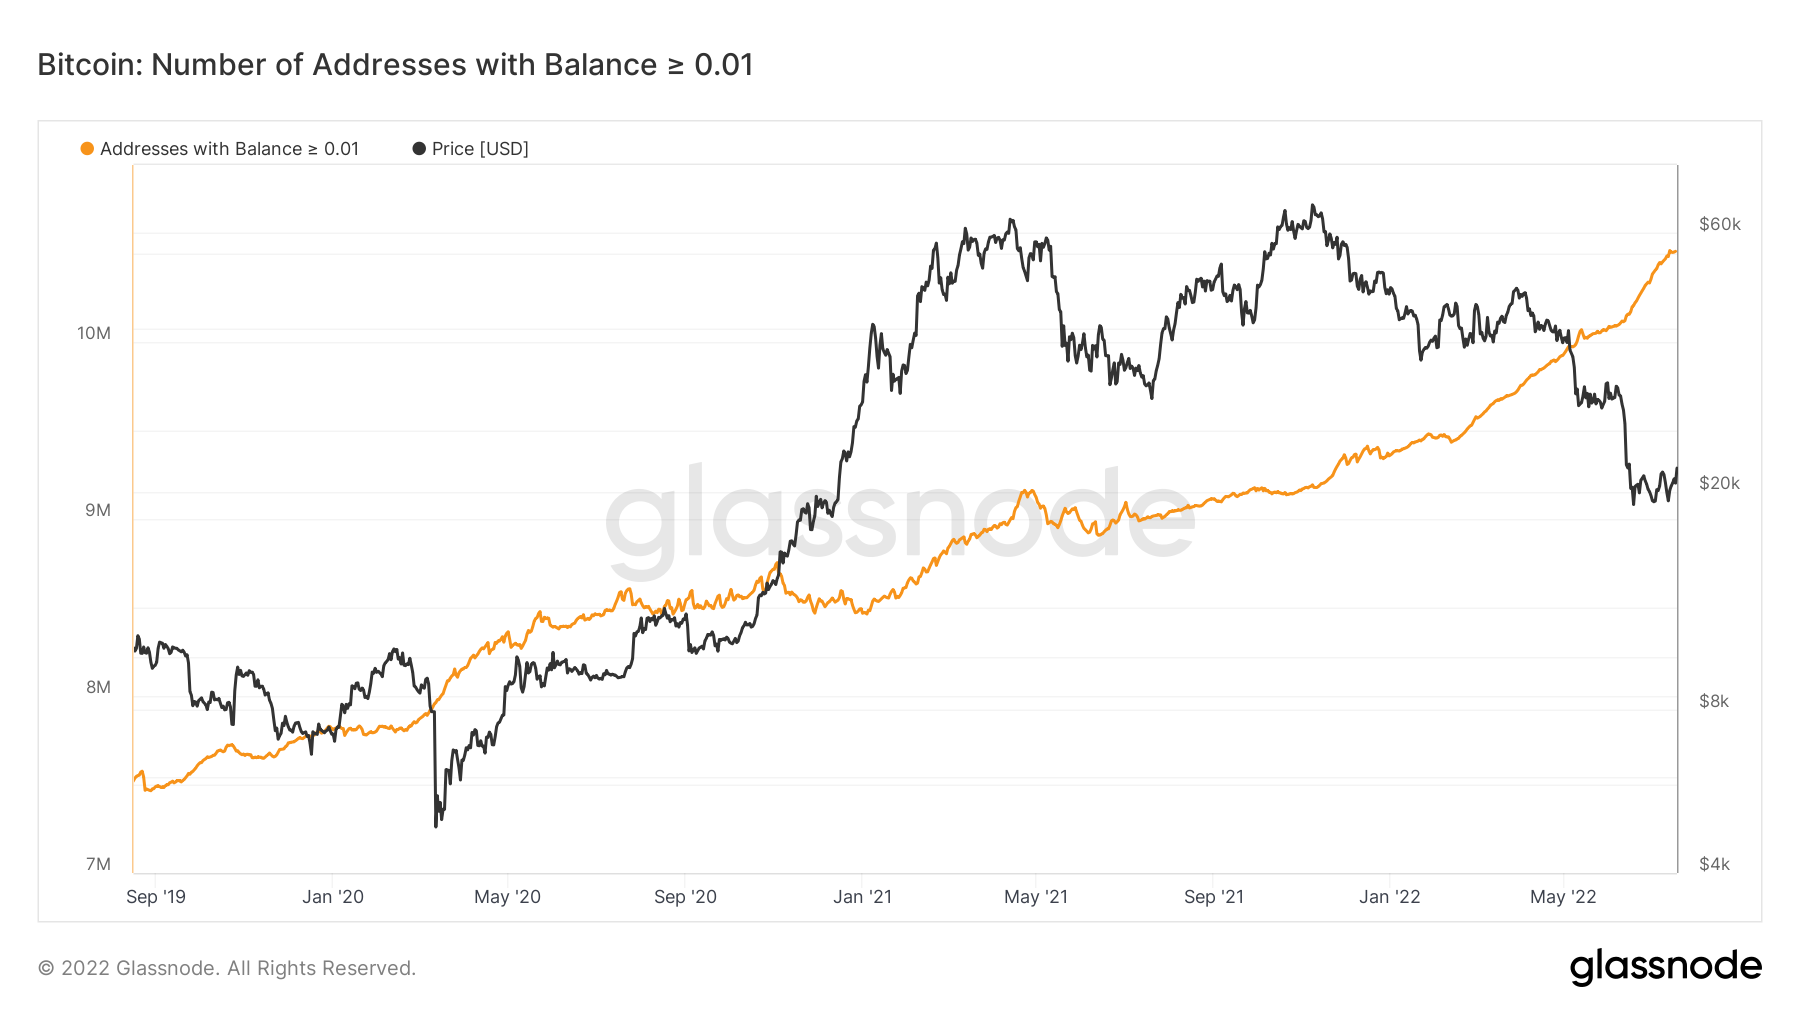 After the price lows were hit in mid-June, one of the key things we look out for is are the historically most profitable Bitcoin investors buying in? The large wallet inflows metric can show figuratively how much Bitcoin was bought. We can see in the graph below that there was a purchase of 185,000 Bitcoin at the $18,000 lows seen on June 18th.
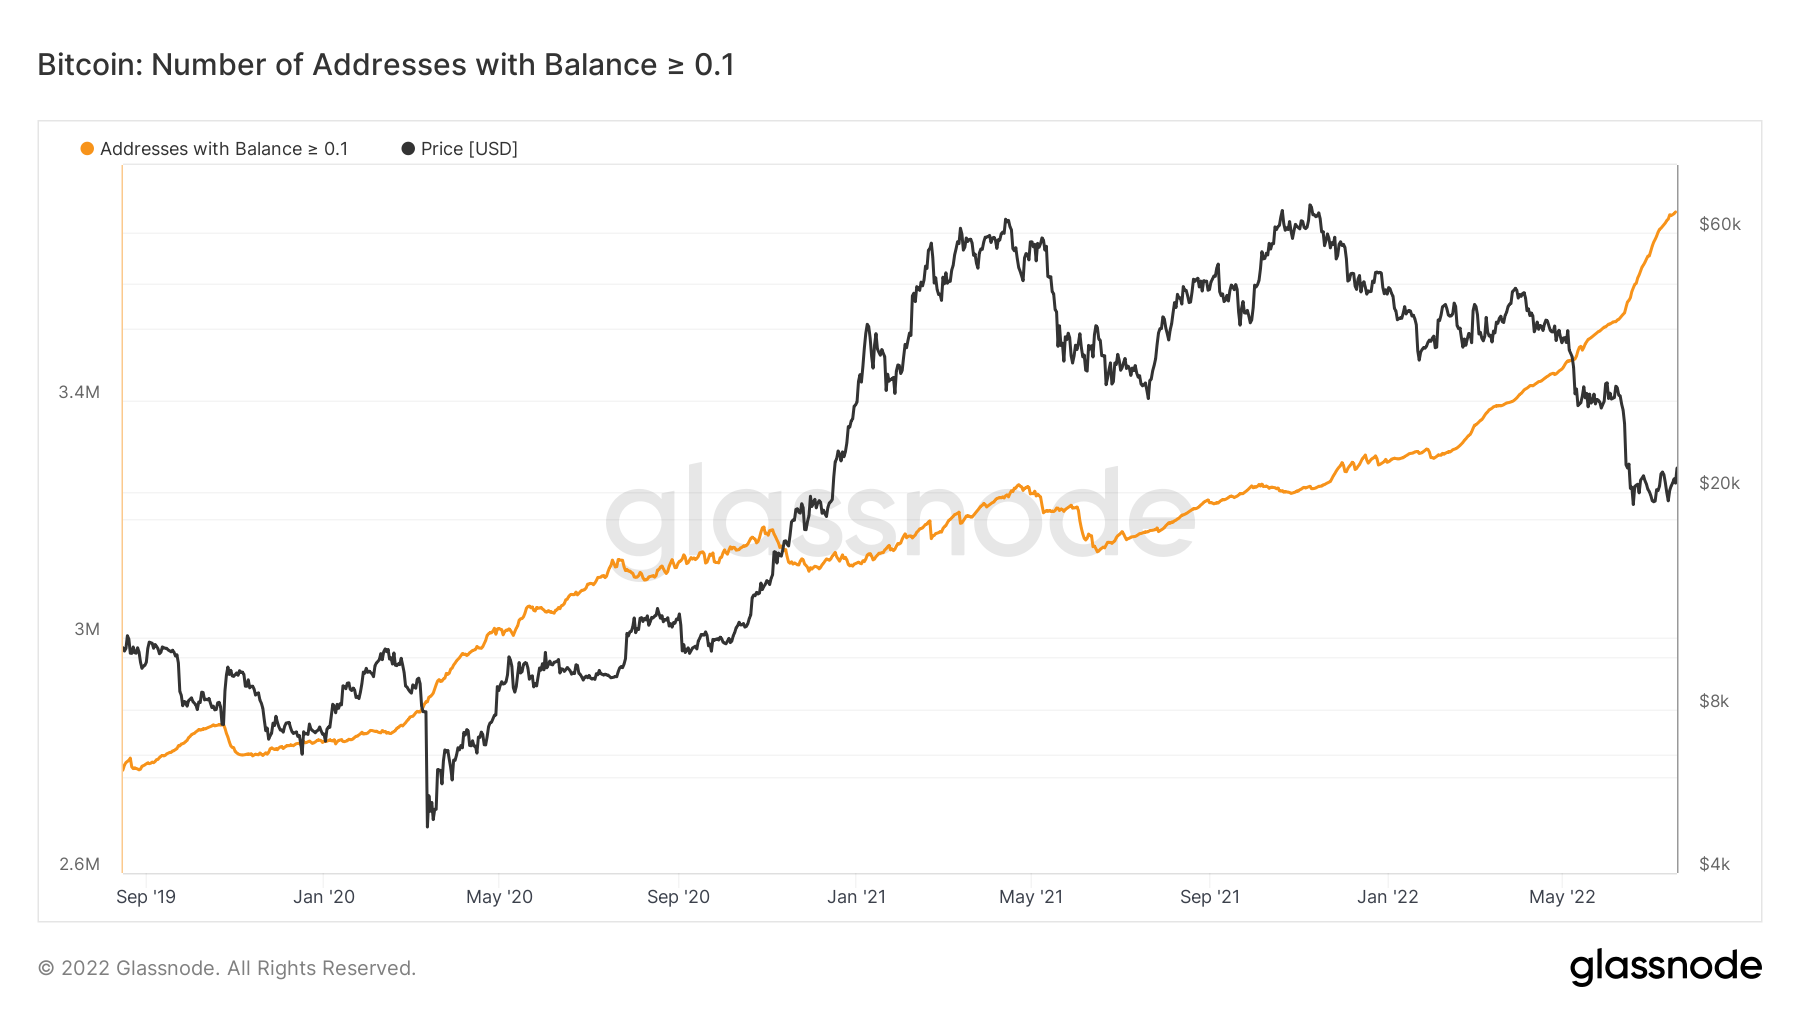
Bitcoin – Addresses with Balance > 0.1 Bitcoin
Bitcoin – Addresses with Balance > 1 Bitcoin
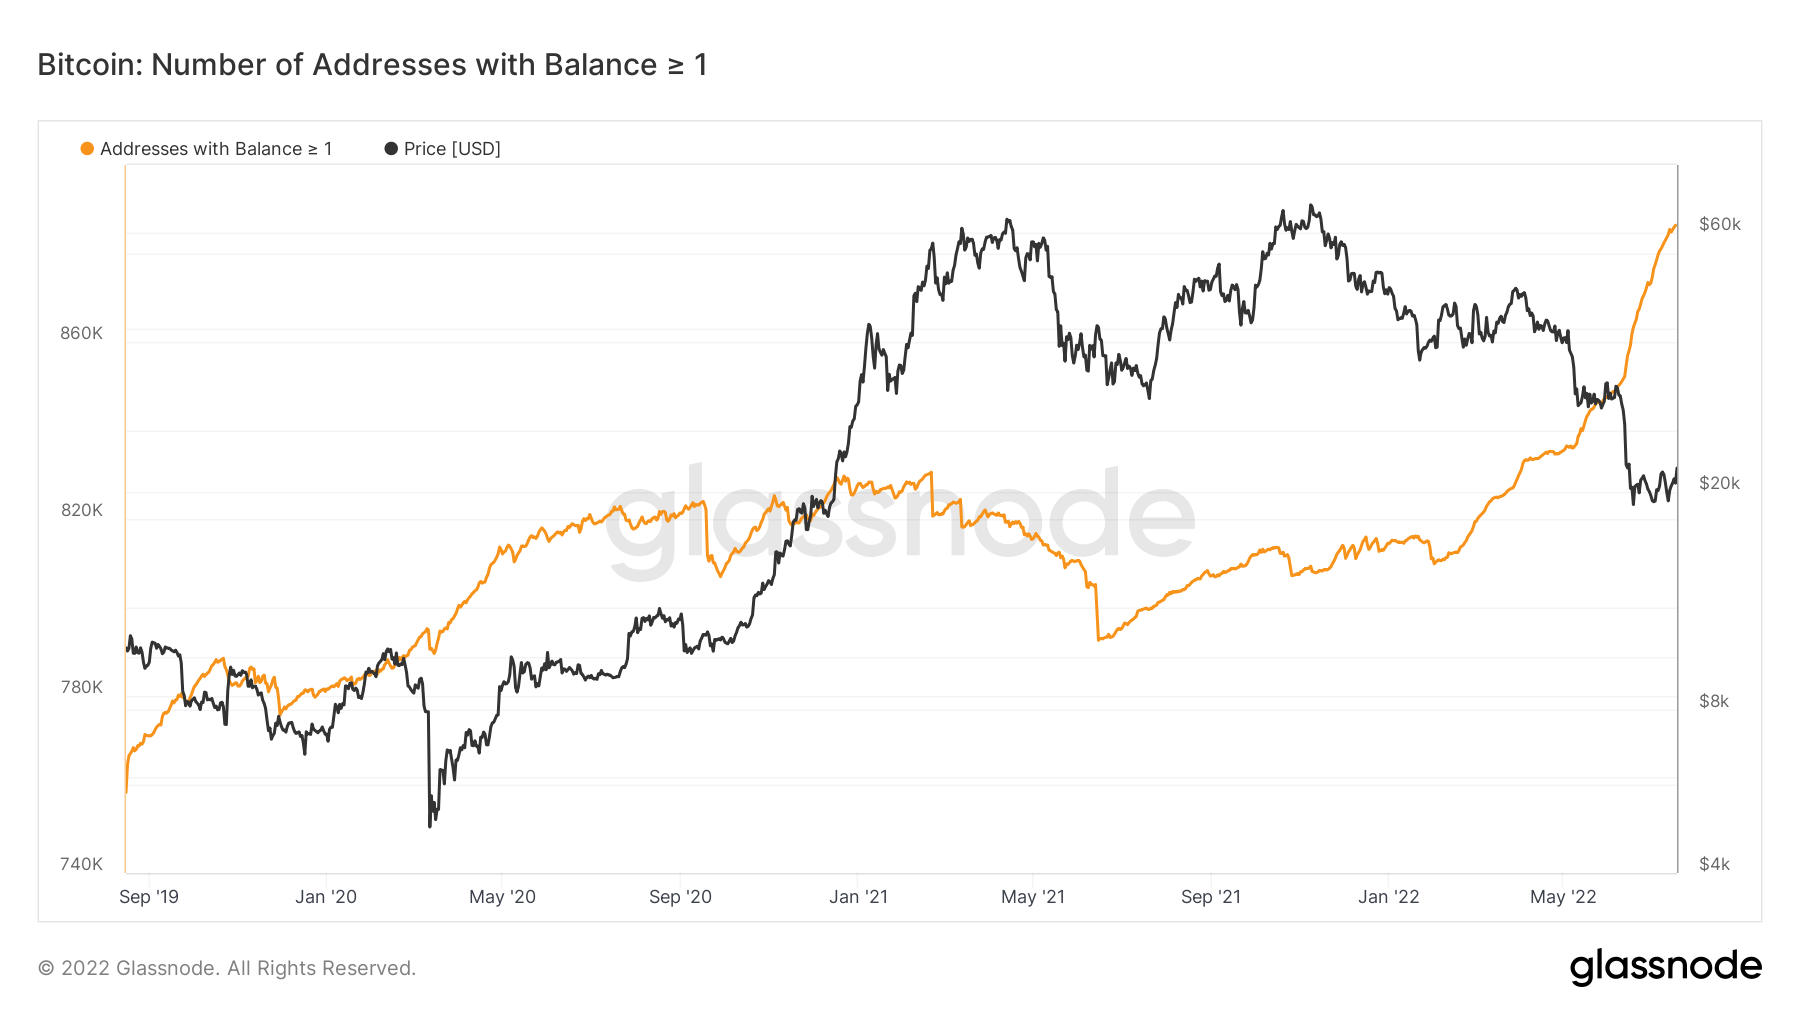 The above charts we could have probably predicted before we even sat and opened the metrics today, so there is no real surprise here, these wallets have continued to increase as Bitcoin has gone lower and lower in price. Our focus is not on these cohorts as historically they’re not the most profitable.
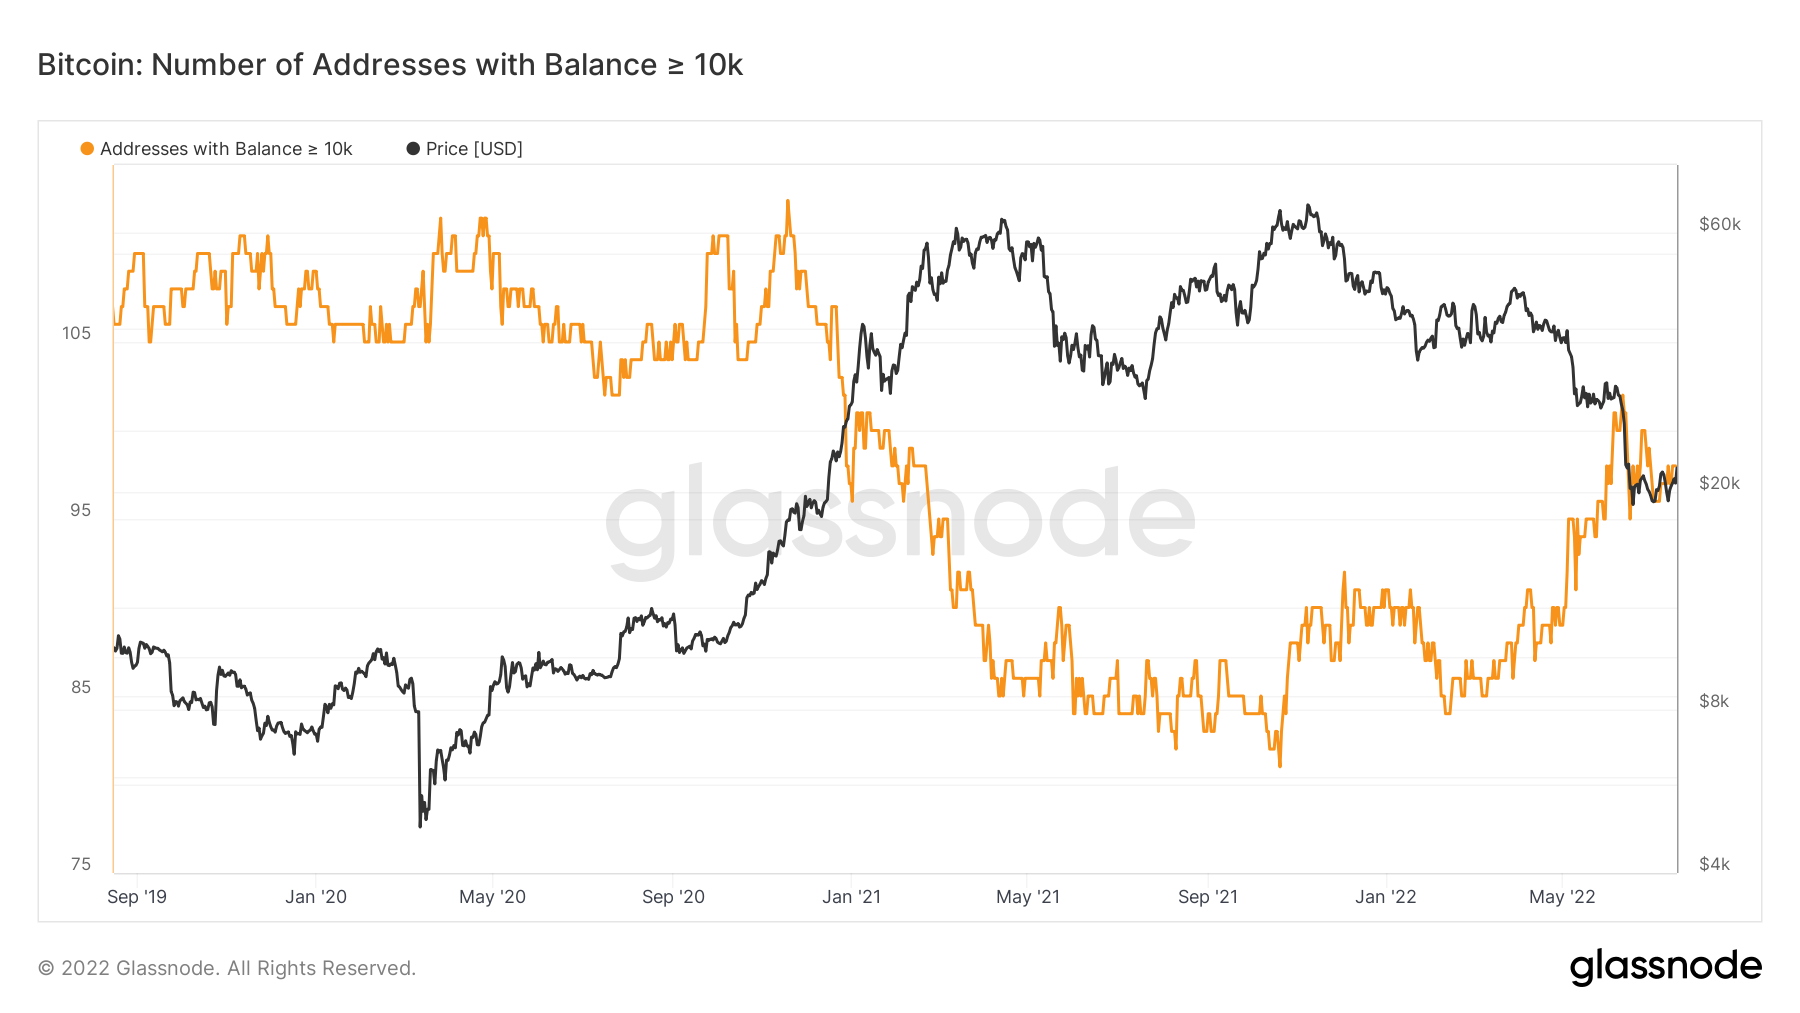
We know from previous reports that the ‘Addresses with Balance > 10,000 Bitcoin’ is actually not a great cohort to follow. They seem to accumulate at lows, but also panic sell into a final flush out in price. It is also a really small subset of data (usually just 100 wallets or so). For this reason, we actually don’t use them as a metric to watch. We can see in the below, that this cohort has seen an increase in the number of wallets since early February 2022 – going from 84 wallets to a high of 102 and now currently 98. During this time, Bitcoin has gone from $42,4000 down to today’s price of $22,000, although we have seen its price as low as $18,000.
Bitcoin – Addresses with Balance > 10,000 Bitcoin
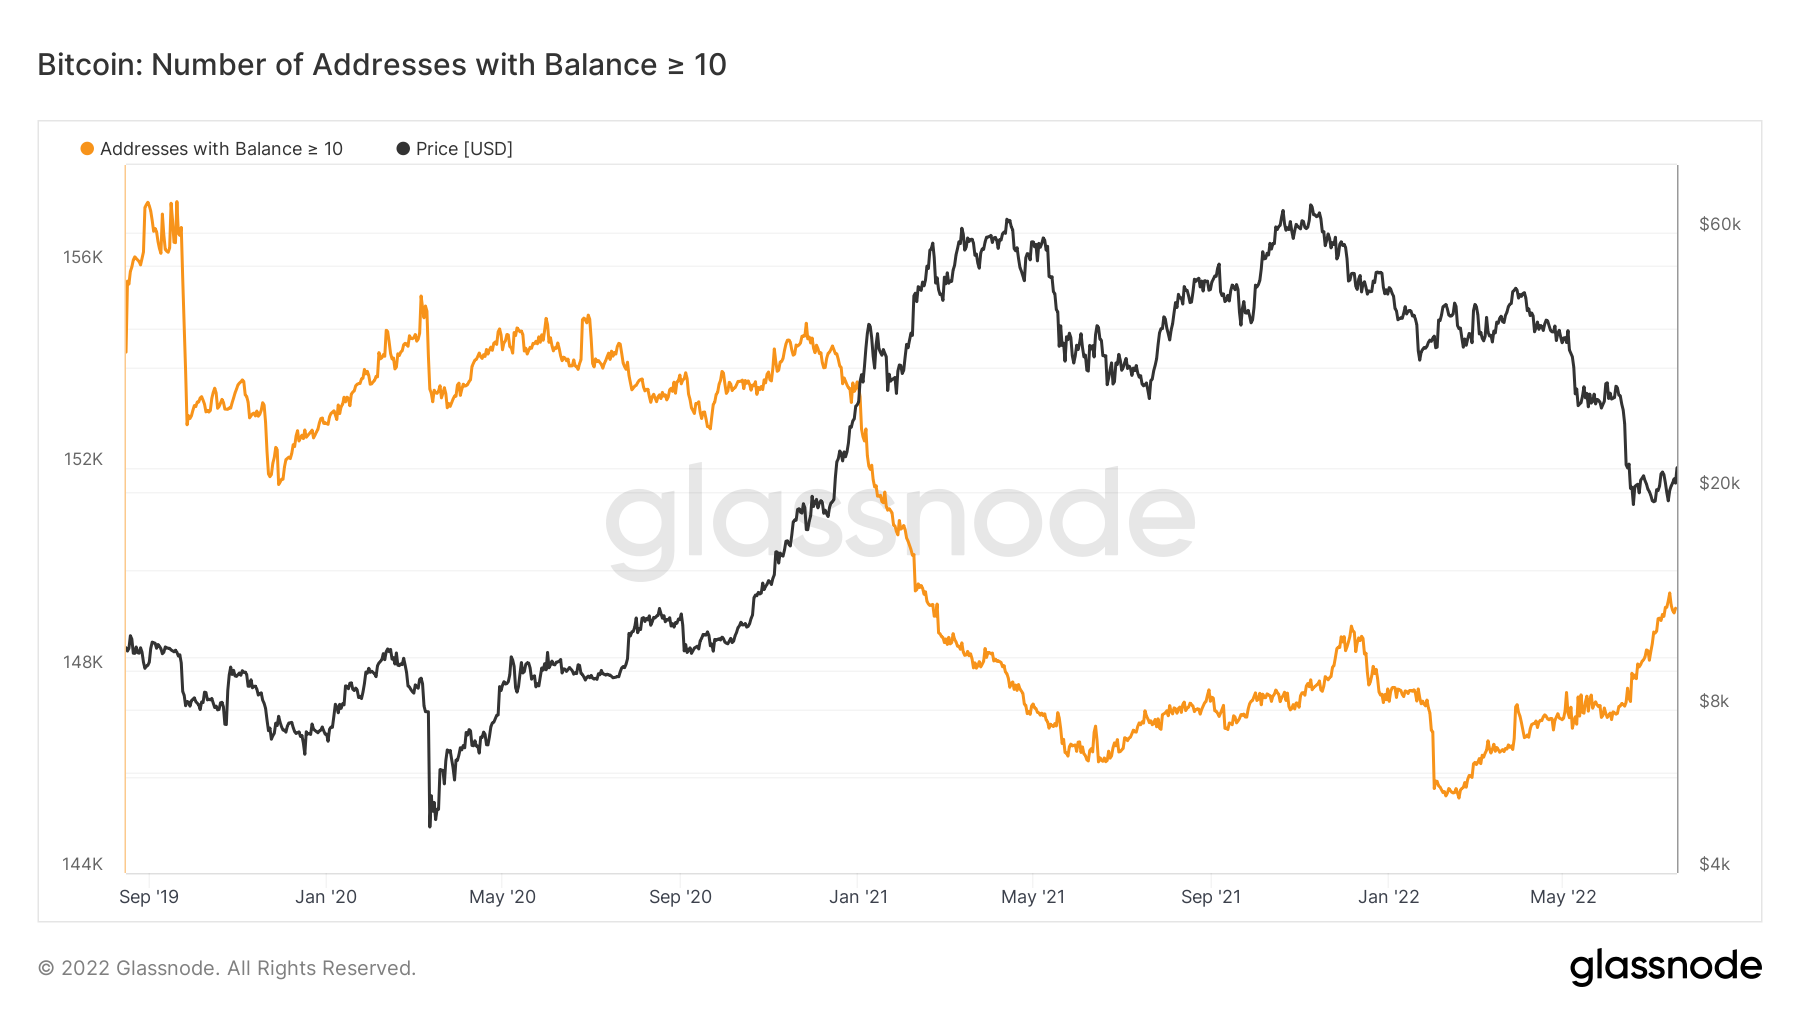
The ‘Addresses with Balance > 10 Bitcoin’ has also seen a risk-on appetite, similar to that of the ‘Addresses with Balance > 10,000 Bitcoin’. Again, we don’t follow this cohort too closely either, they can sometimes be considered a counter trade.
Bitcoin - Addresses with Balance > 10 Bitcoin
 The main cohort we focus on is the ‘Addresses with Balance > 1,000 Bitcoin’, they are often excellent at knowing when to risk-on and when to risk-off, hence we follow them so closely.
Bitcoin – Addresses with Balance > 1,000 Bitcoin
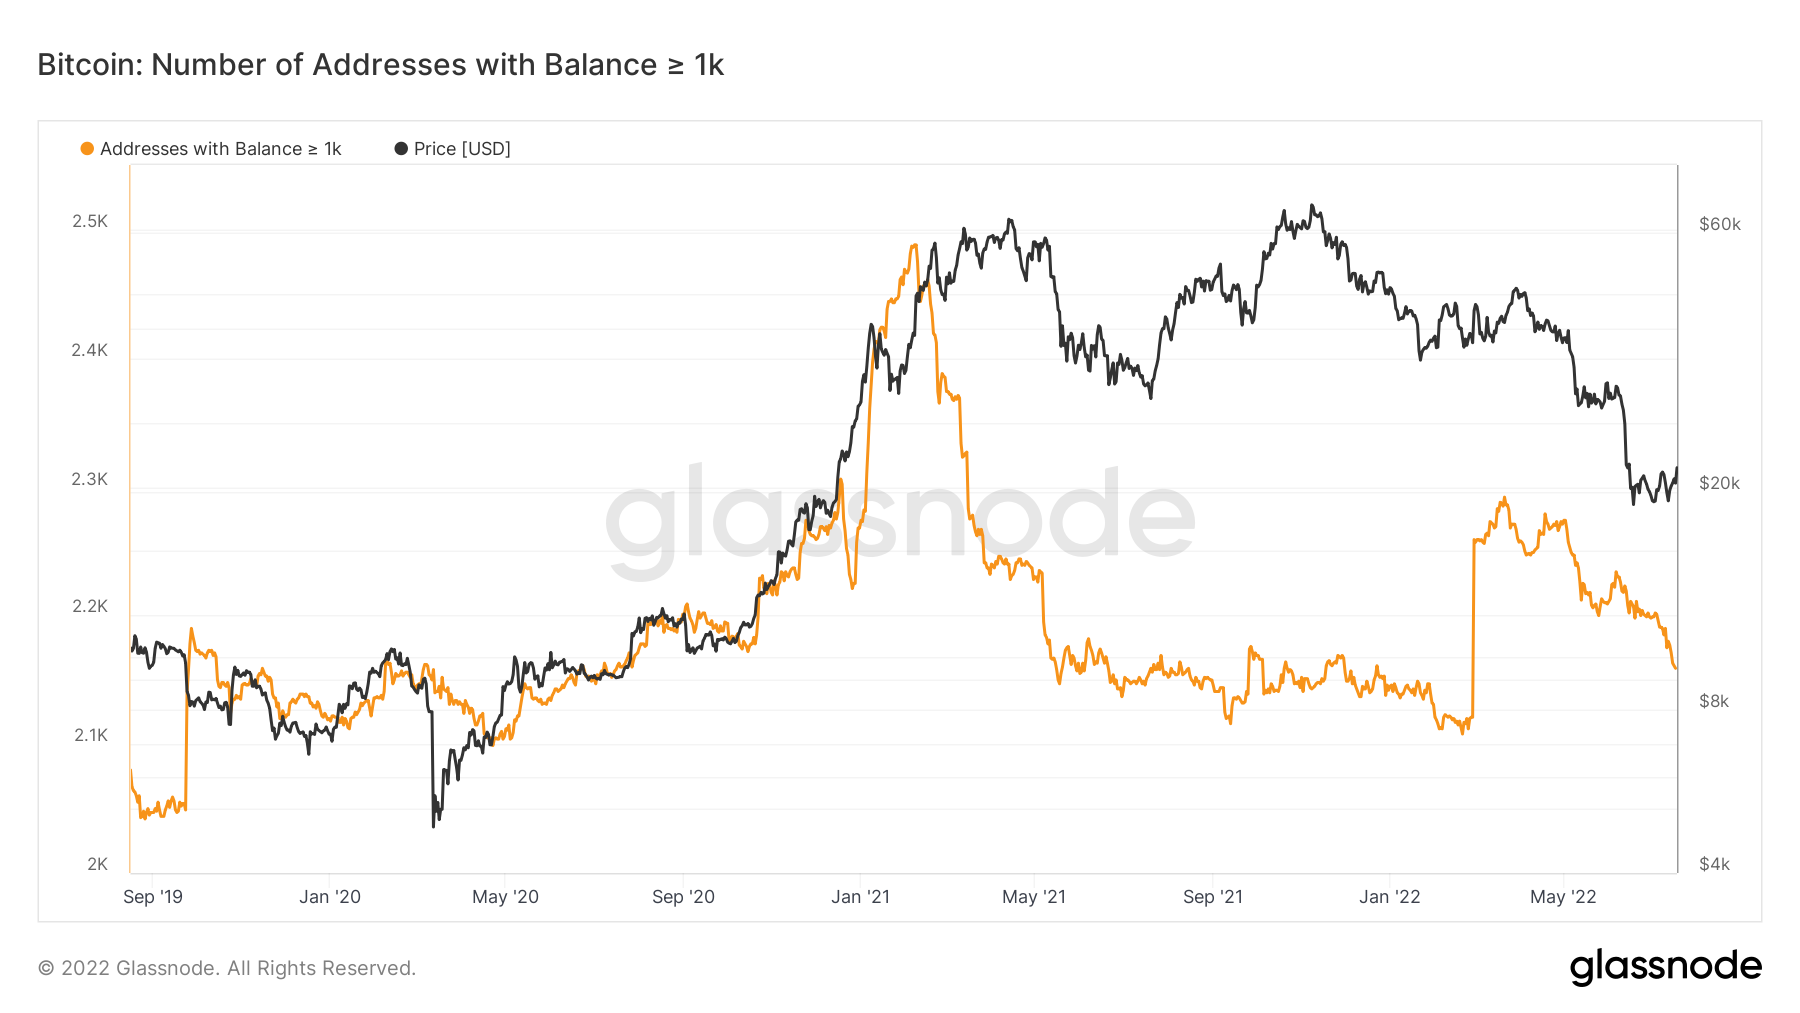 We can see from this cohort that they have sold this rally quite significantly as the number of wallets in this cohort has dropped. This is potentially a good indication that the current mild rally in prices may just be a bear market rally, as this cohort of addresses is not often wrong when it comes to risking-on and off.
Metric 2 - Hash Ribbon
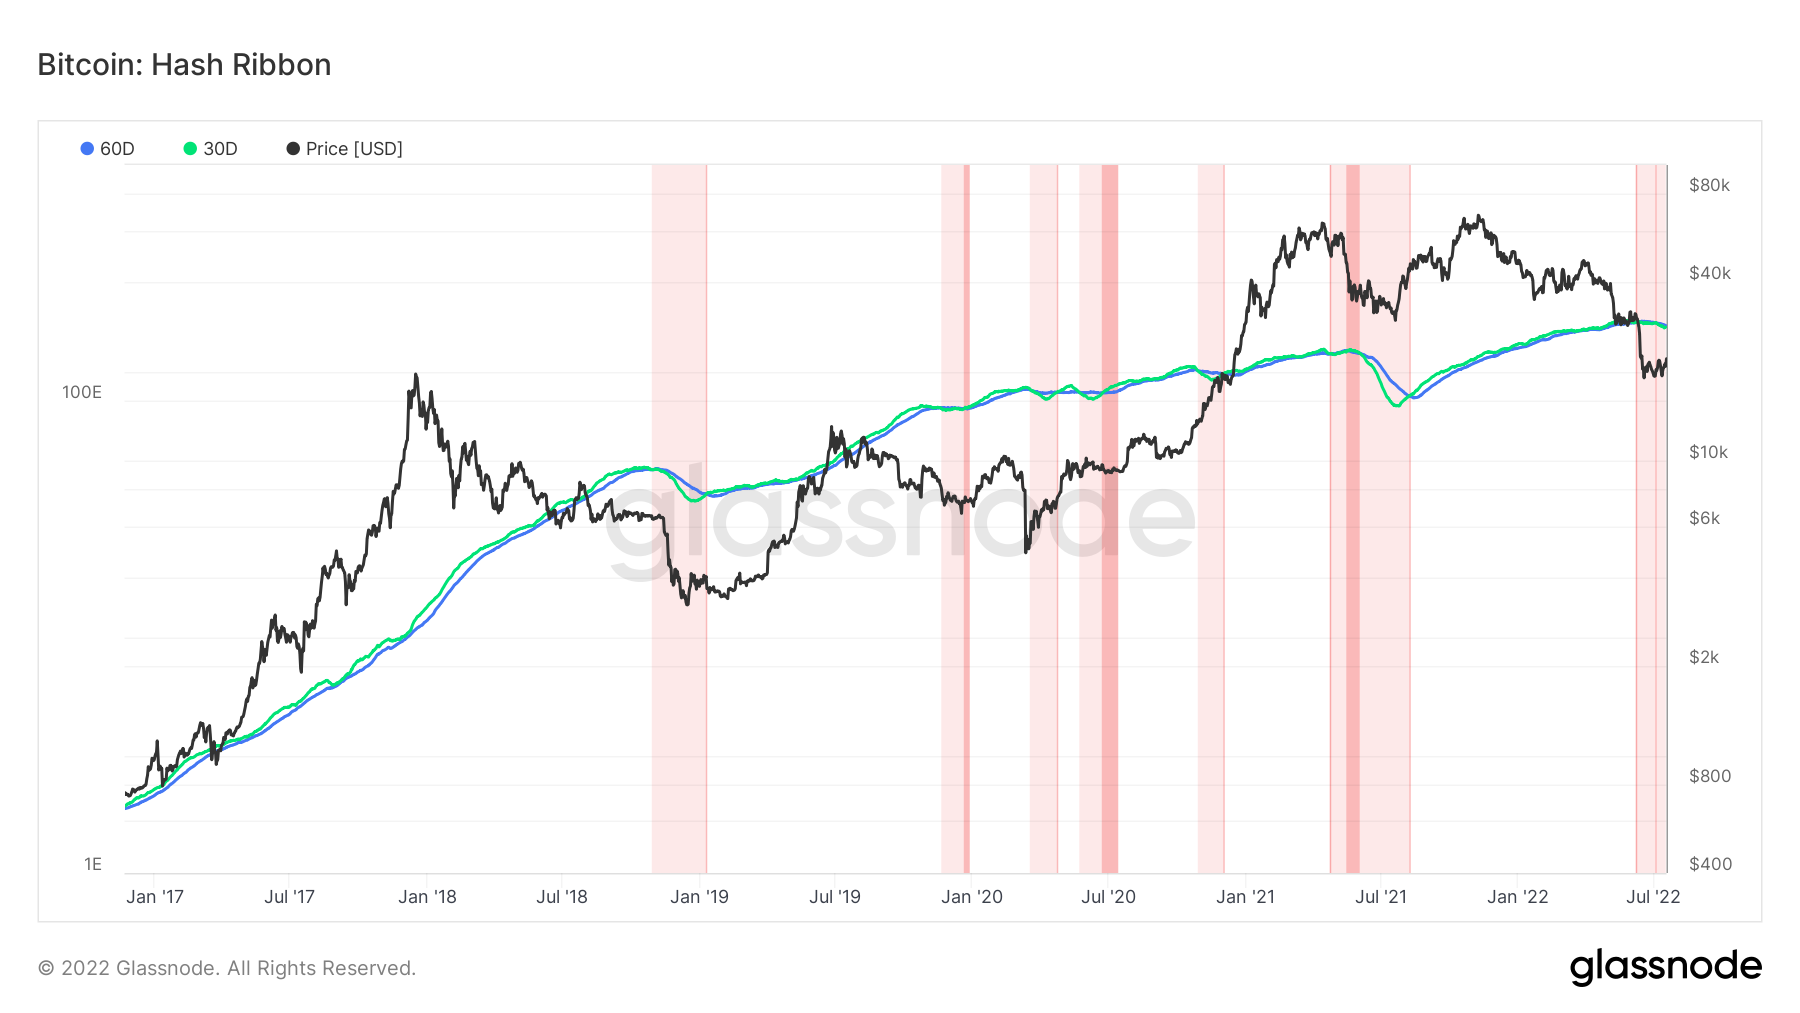
The last metric we will look at is the Hash Ribbon. The Hash Ribbon is a market indicator that assumes that Bitcoin tends to reach a bottom when miners capitulate, i.e. when Bitcoin becomes too expensive relative to the cost of mining it. We are beginning to see the 30d MA and the 60d MA turn down. If we look back to late 2018, the same happened here, so it may be worth watching out for when these MA’s go lower and then 30d MA crosses above the 60d MA (green crosses above blue) after having formed a bottom. This is one of the key metrics that would suggest to us that miner capitulation is over, and miner capitulation is one of the last key stages of a Bitcoin bear market.
Bitcoin – Hash Ribbon
Ether - Technical & On-Chain Analysis
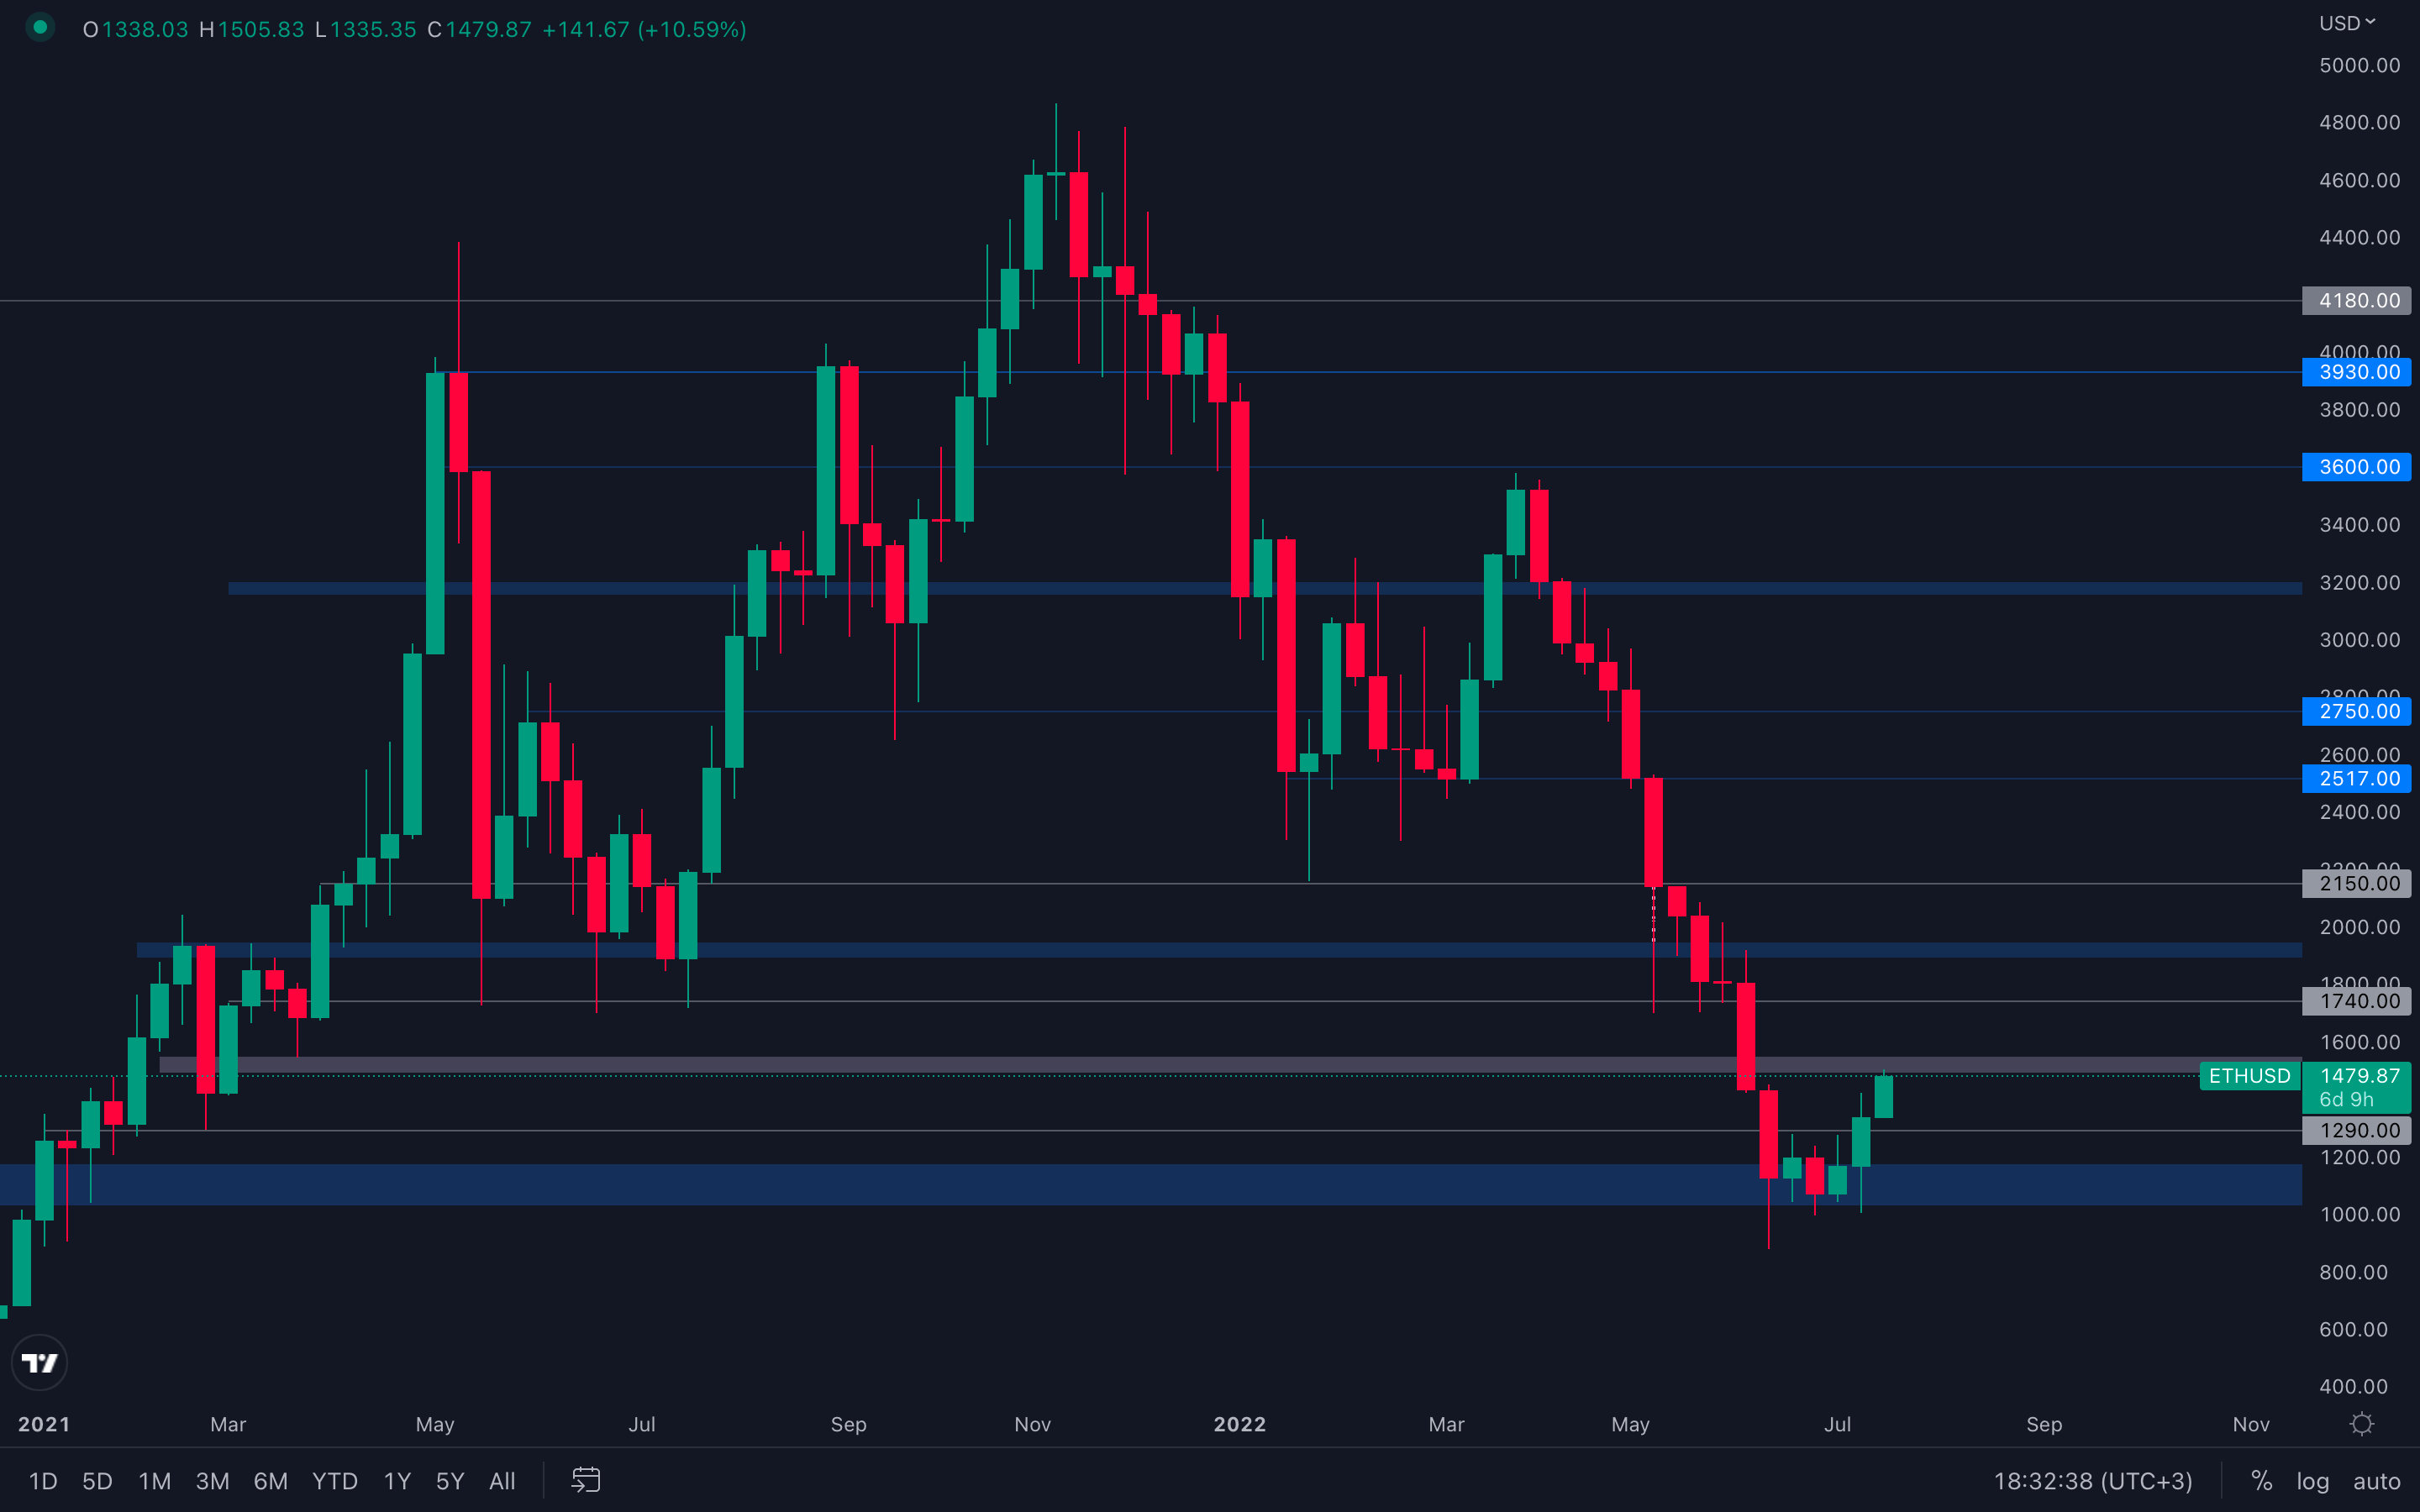 Ether has experienced a far more intense price action in the last three weeks, going from $1000 to $1500, a 50% increase. Even though it seemed like this wasn't possible last Monday, buyers managed to step in and gain control over the price, giving the entire altcoins market a decent increase in volume, while also increasing Ether's dominance by more than 16%.
With ETH reaching its $1500 psychological resistance level, we might see Ether slow down, maybe even by retesting its $1300 support level as it has been flipped from resistance to support on the weekly timeframe. Until $1500 is reclaimed via a weekly candle closure above it, then further upside is off the table.
Metric 1 – Addresses
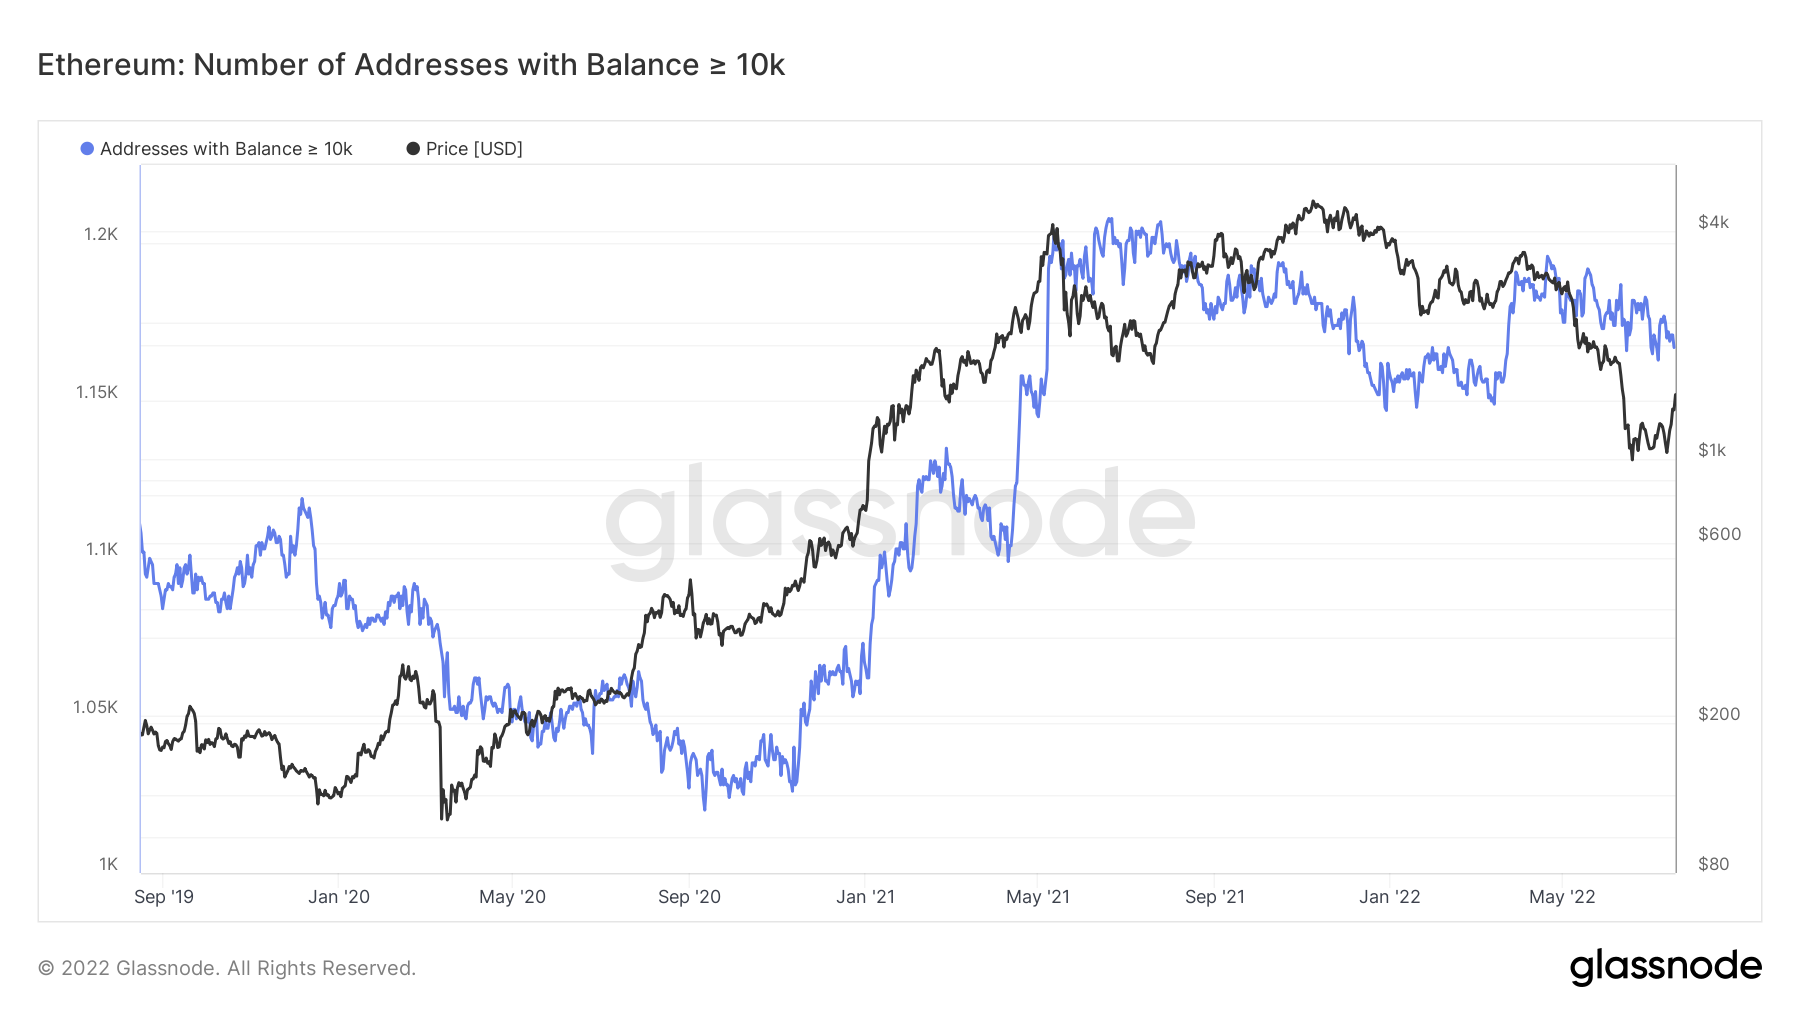
We'll try and keep it straight to the point, as we're already familiar with most of the addresses metrics that we explained for Bitcoin's analysis above - with regards to Ether, all of the metrics are showing that the number of addresses in each cohort of wallet is increasing… except one, the ‘Addresses with Balance > 10,000 Ether’. This means there's a higher wish of selling from higher players rather than your standard retail participants, which is actually in contradiction with the other addresses and that leaves us in an indecisive situation that needs a conclusion rather than assumptions.
Ether – Wallet Addresses with Balance > 10,000 Ether
DOT
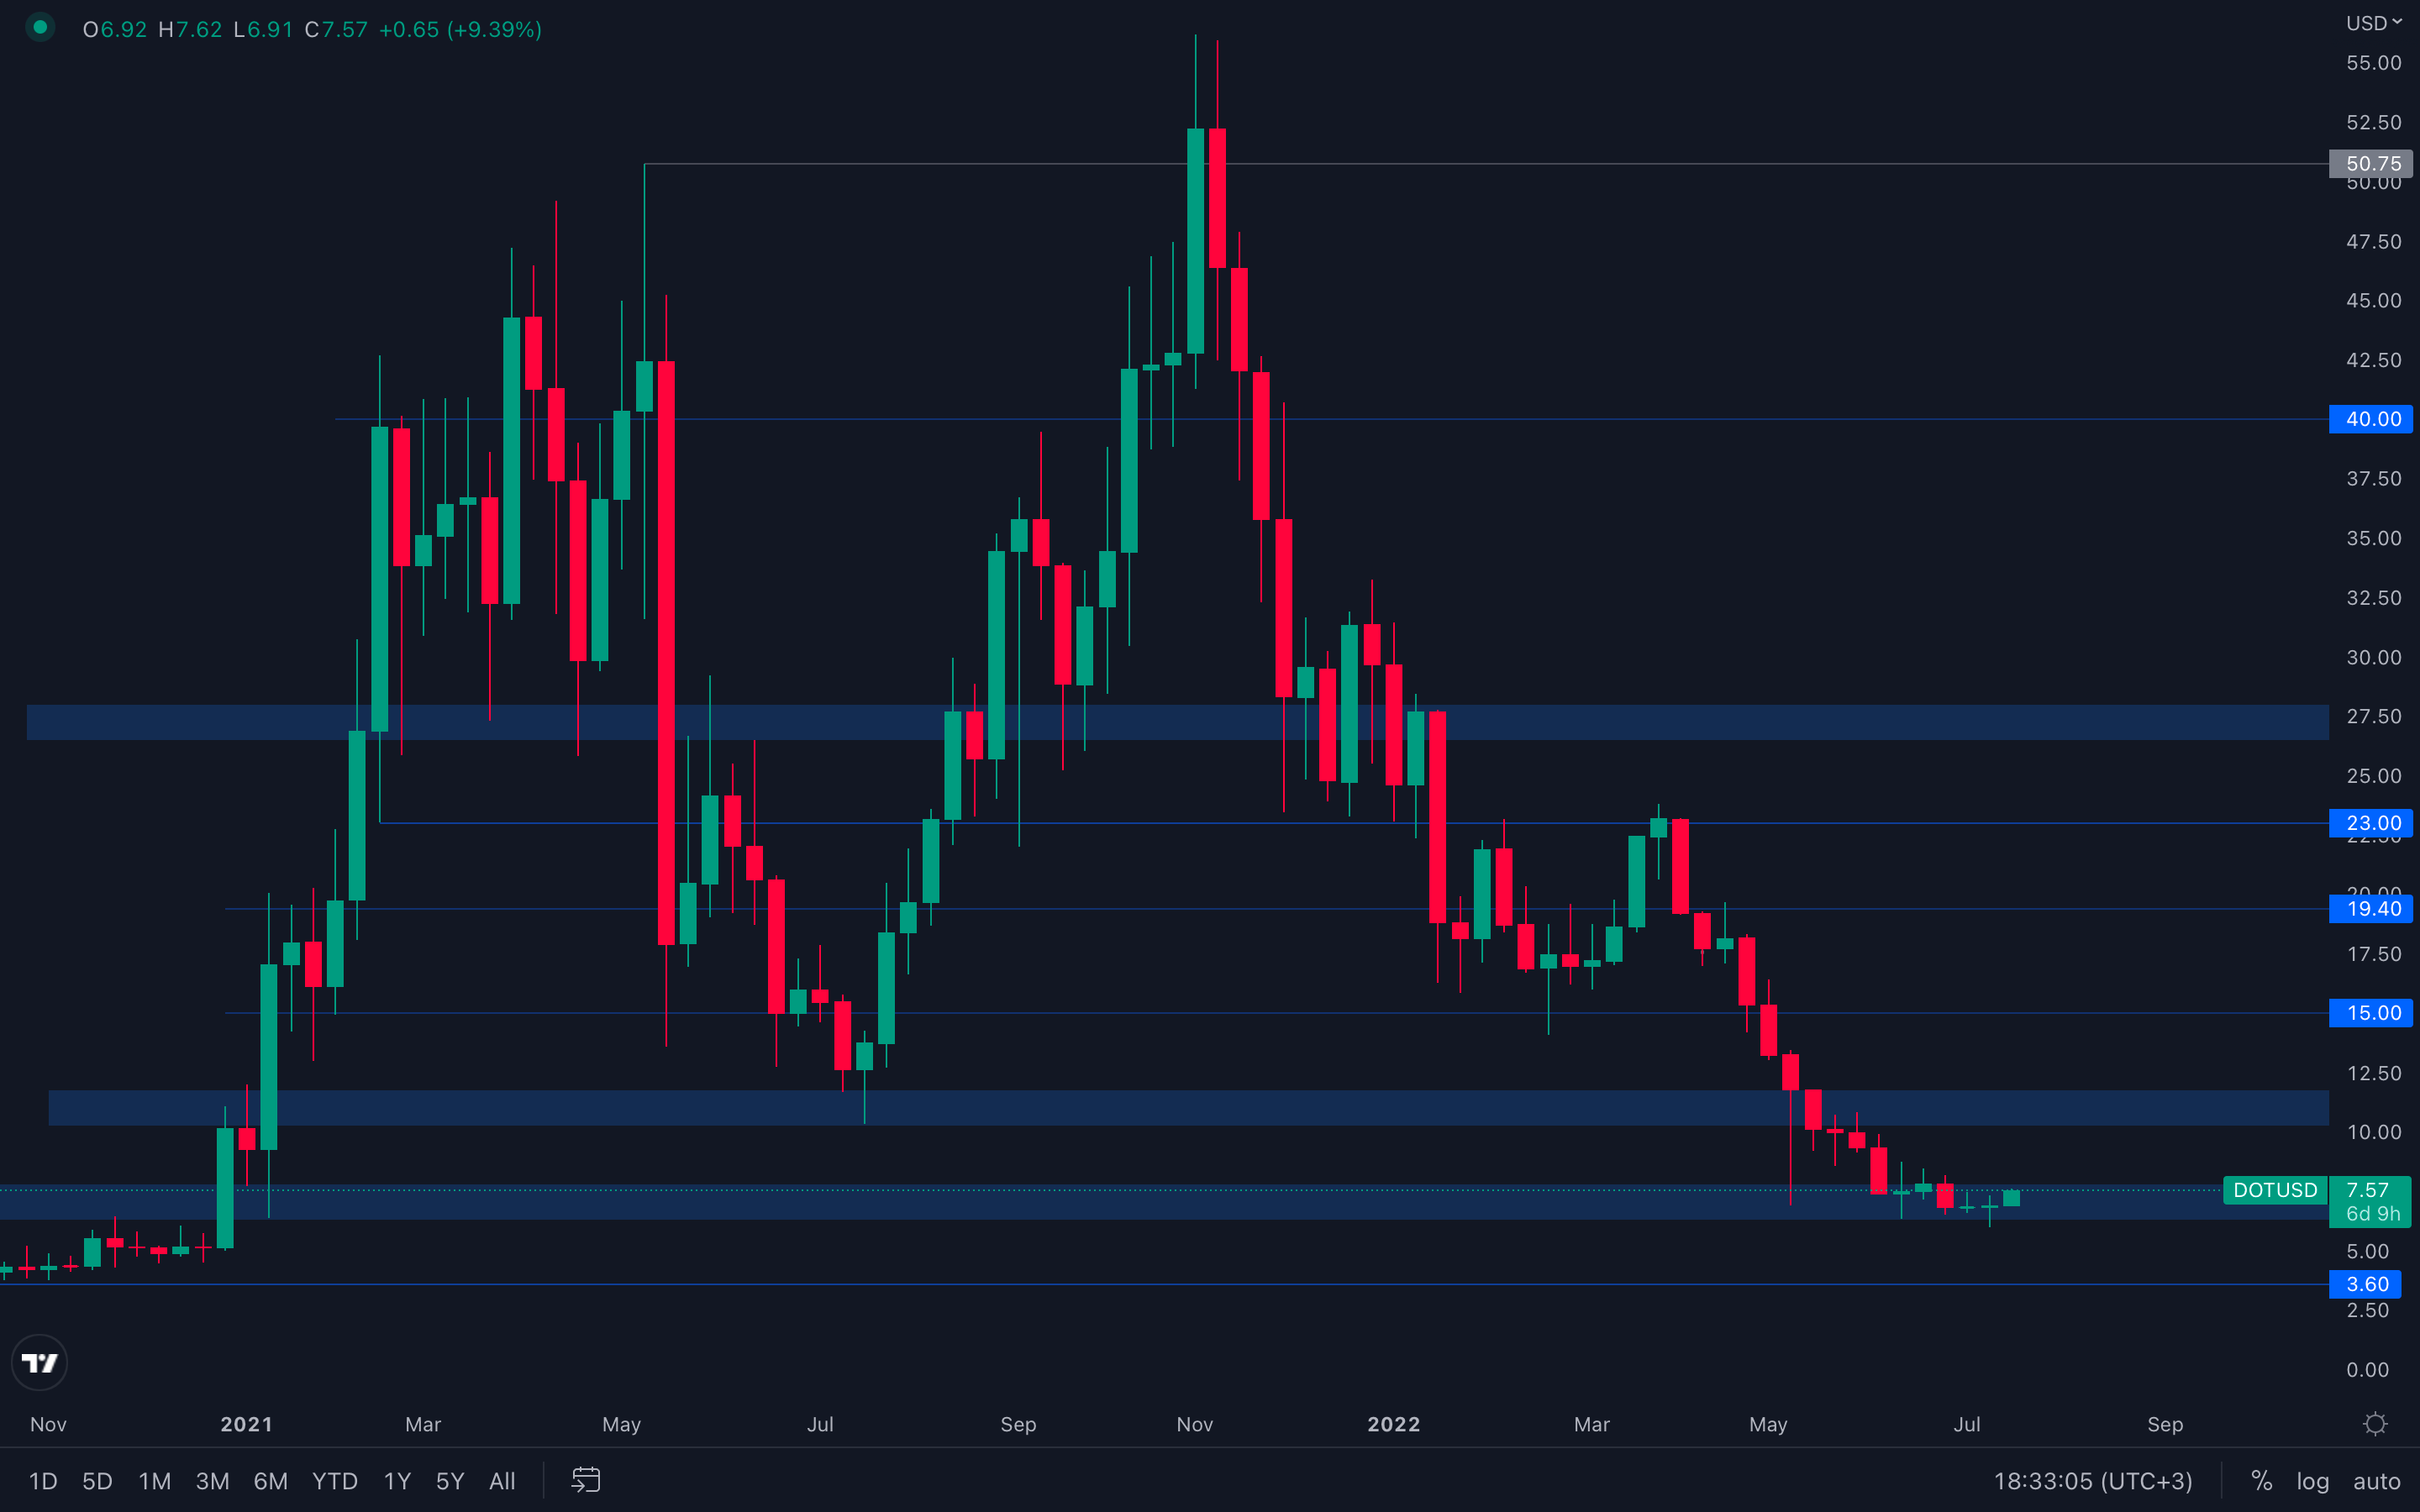 Due to the fact that the current rise in price is happening today, the first day of the week, we cannot assume DOT will continue to ascend, as we'll need a weekly closure above $7.5 to at least confirm the possibility. However, as we also mentioned last week, DOT is perfectly forming a bottom and can easily test $10, but that also doesn't make it a guarantee. For traders, always follow your risk management strategies and if you were to trade this move, don't overleverage - DOT's price can easily test $6.30 before continuing to rise towards $10.
SNX
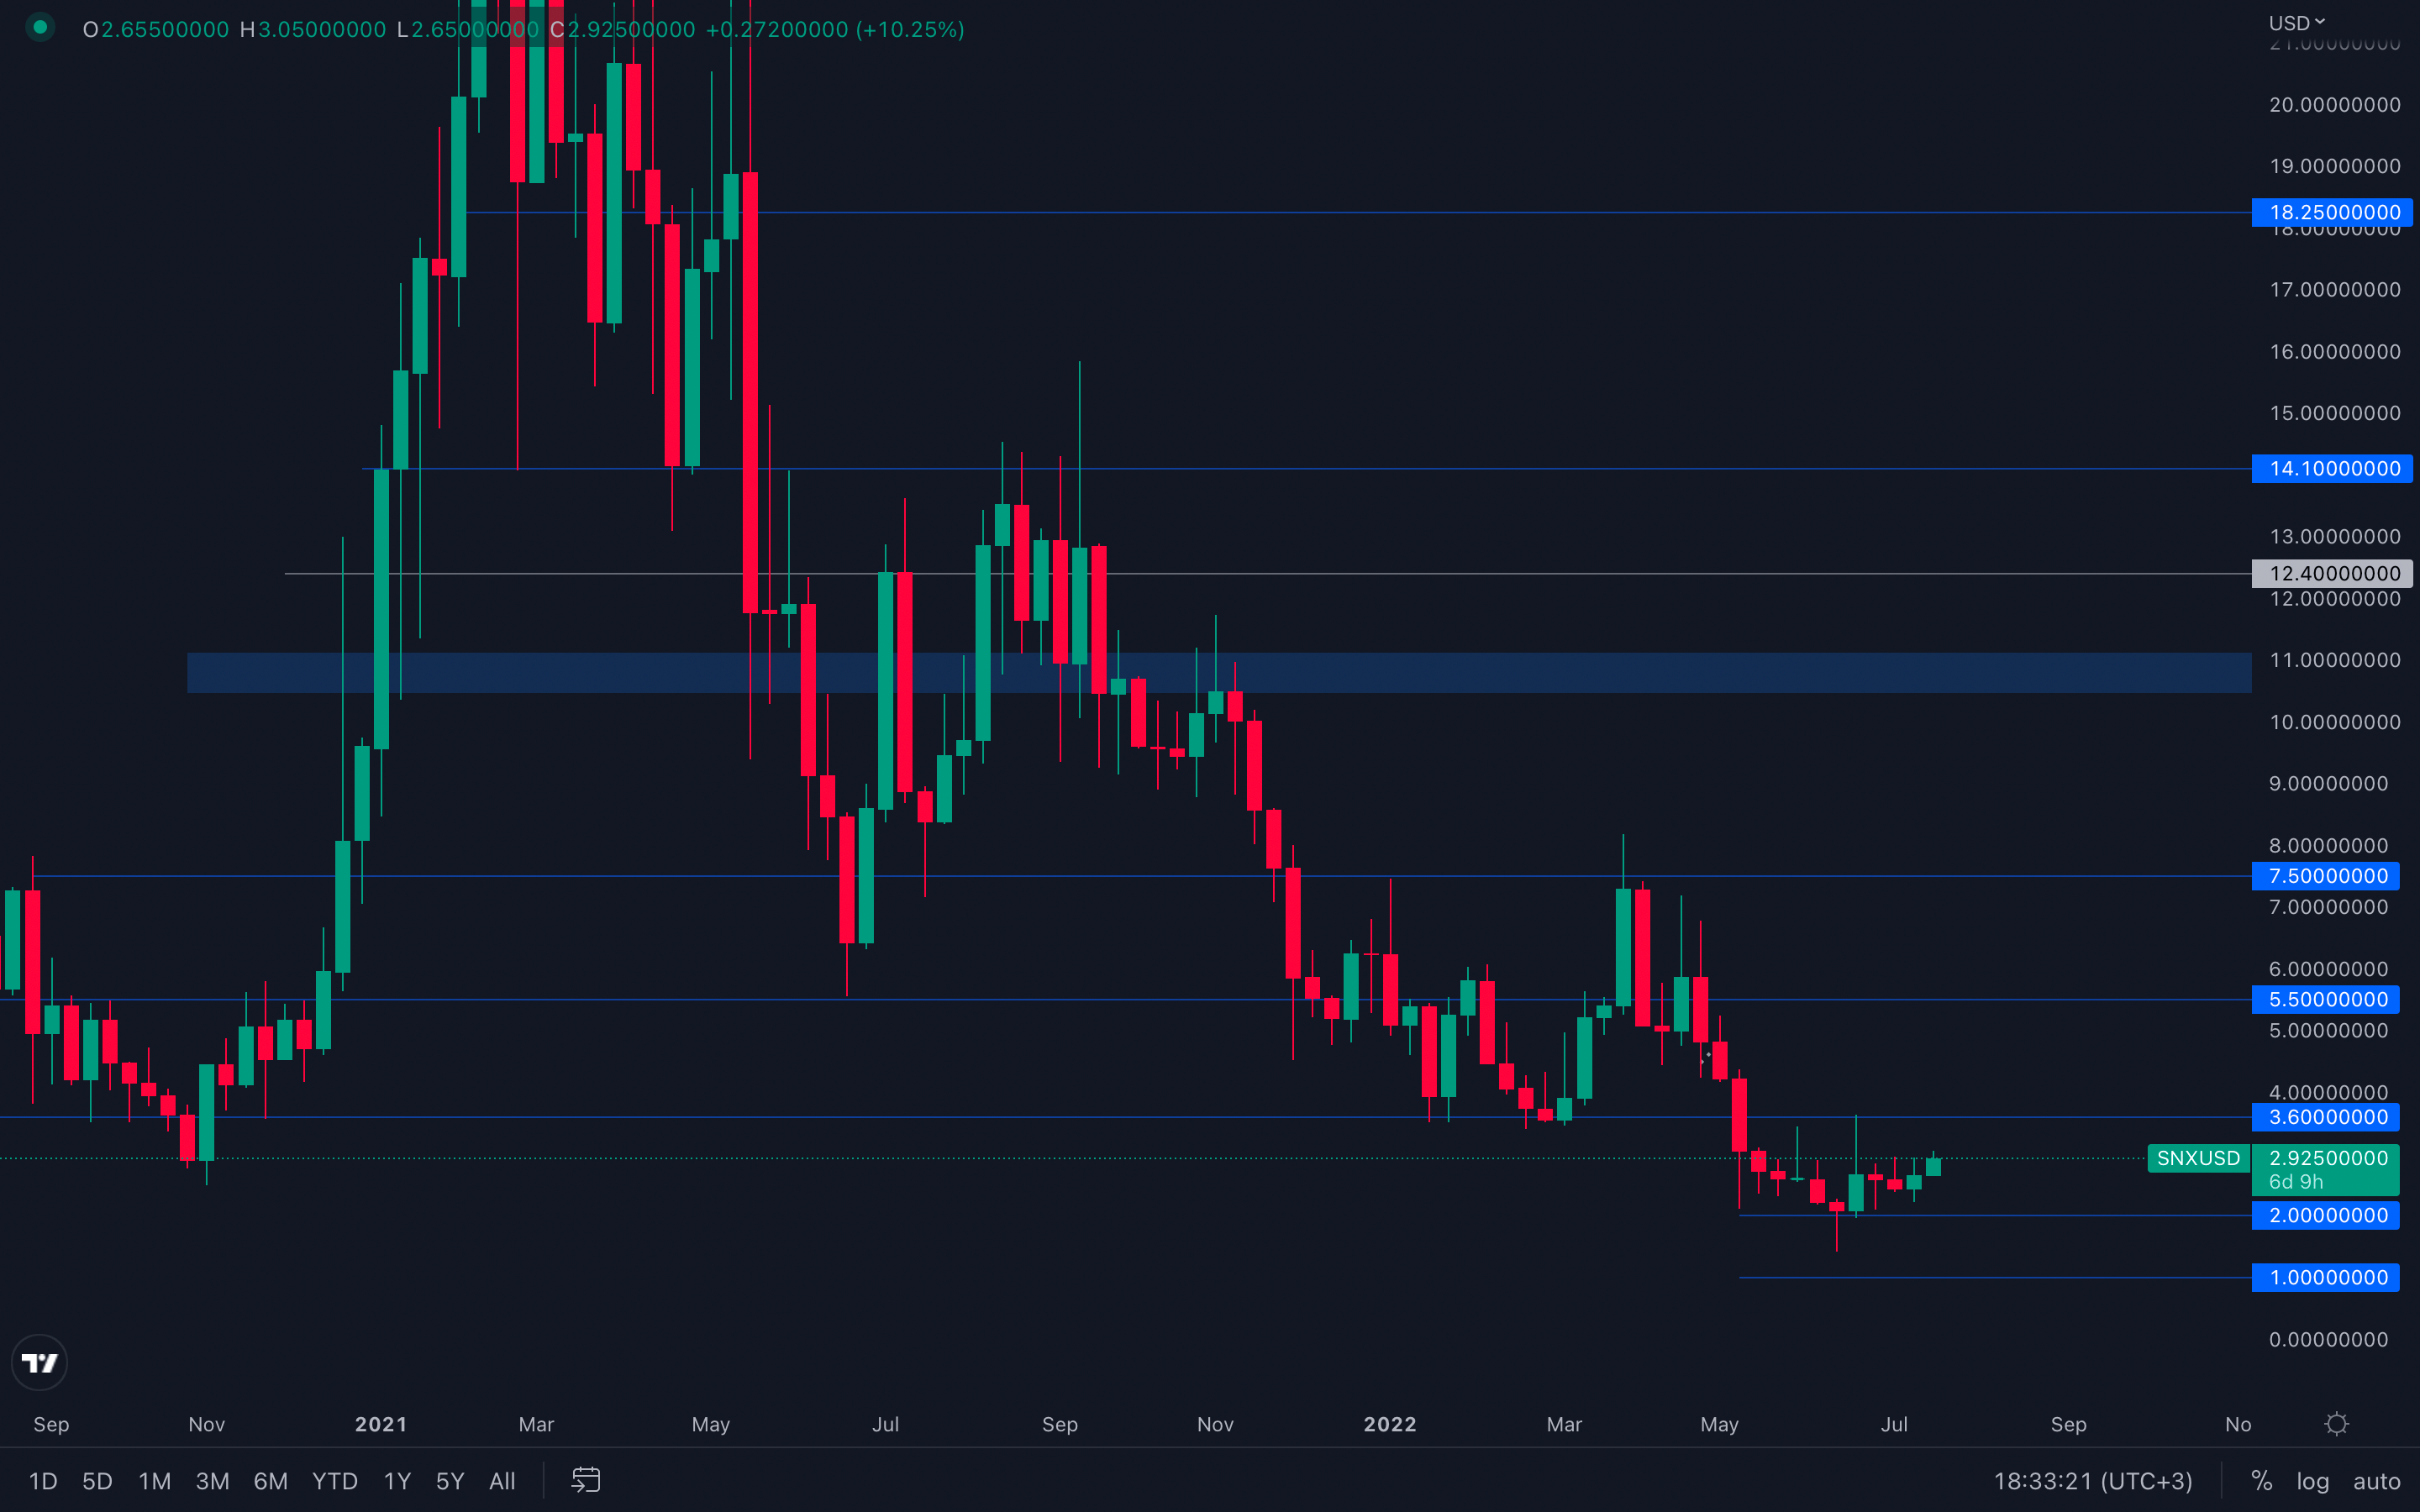 Quite a simple situation for SNX - due to last week's bullish engulfing candle, SNX is now on a path to its $3.6 resistance level. Whether this level is fully achieved is up to the majors, Bitcoin and Ether. Unless these two play along, SNX should have no issues reaching its target, especially with its current volume and volatility.
RUNE
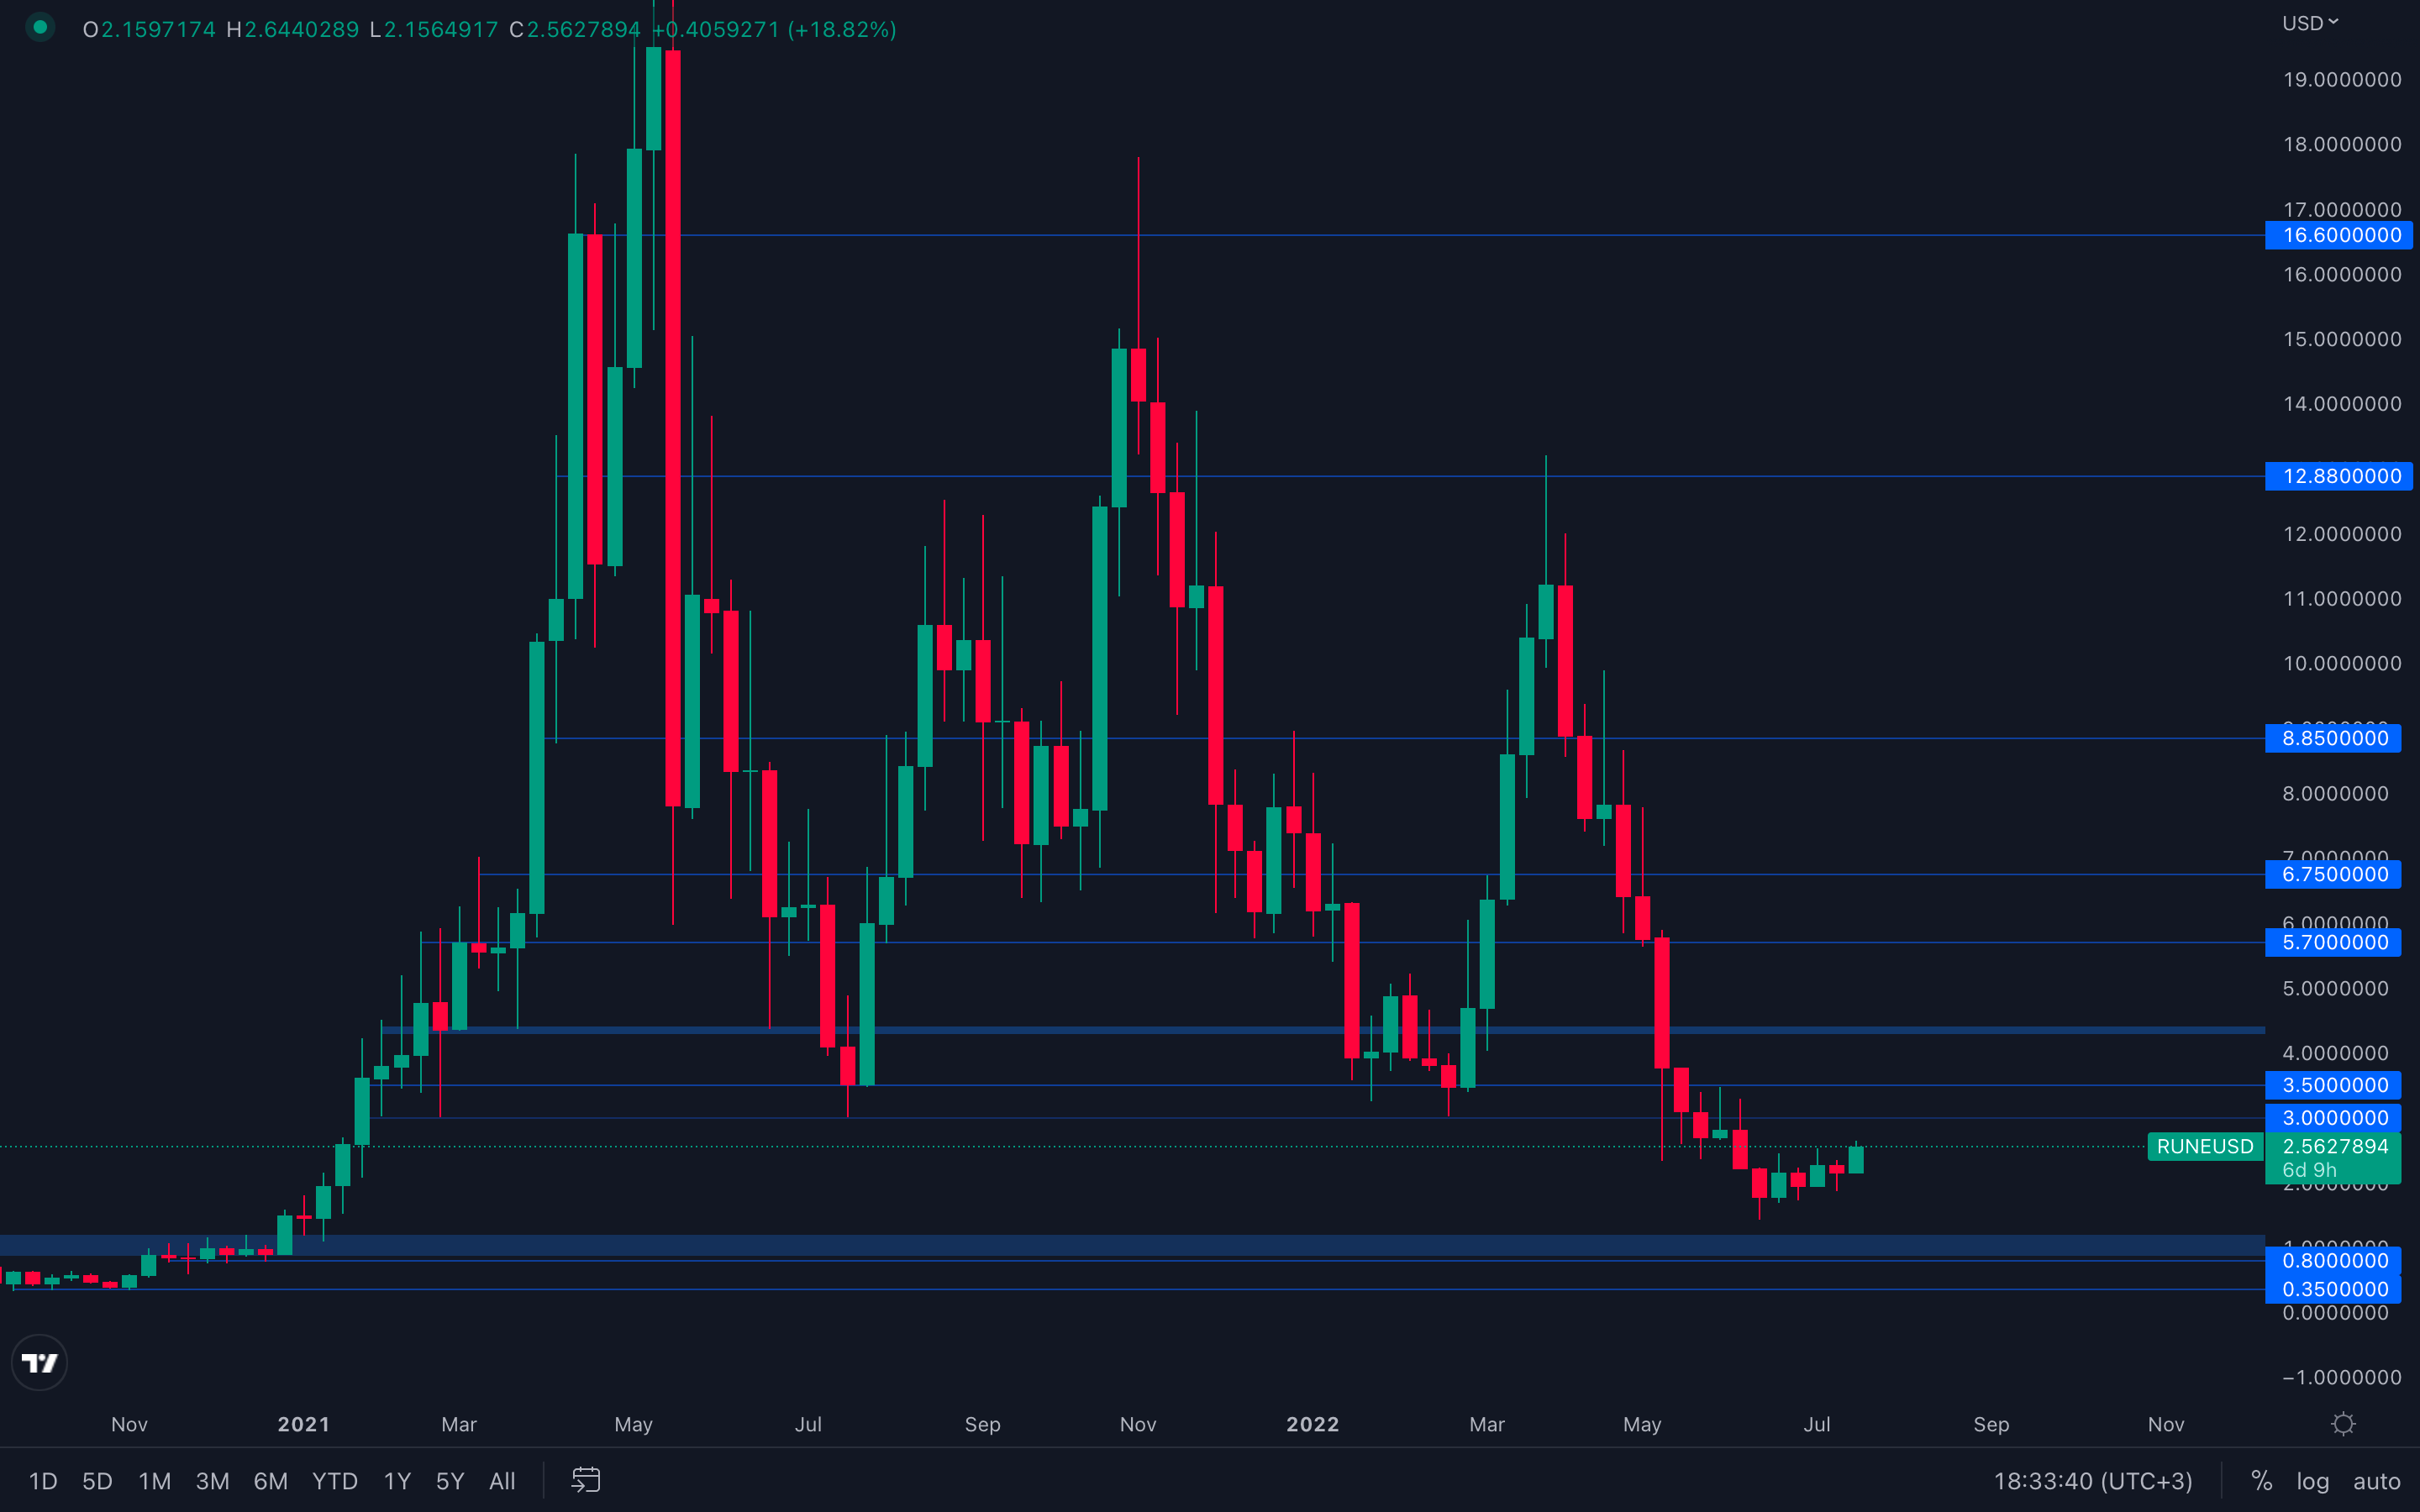 There has been a constant trend in RUNE's price for the last 5 weeks, which suggests a $3 resistance test might be on the cards. However, this can easily be invalidated by the majors being unable to break their specific resistance levels. This will lead to altcoins dropping and invalidating upside movement until proven otherwise.
SOL
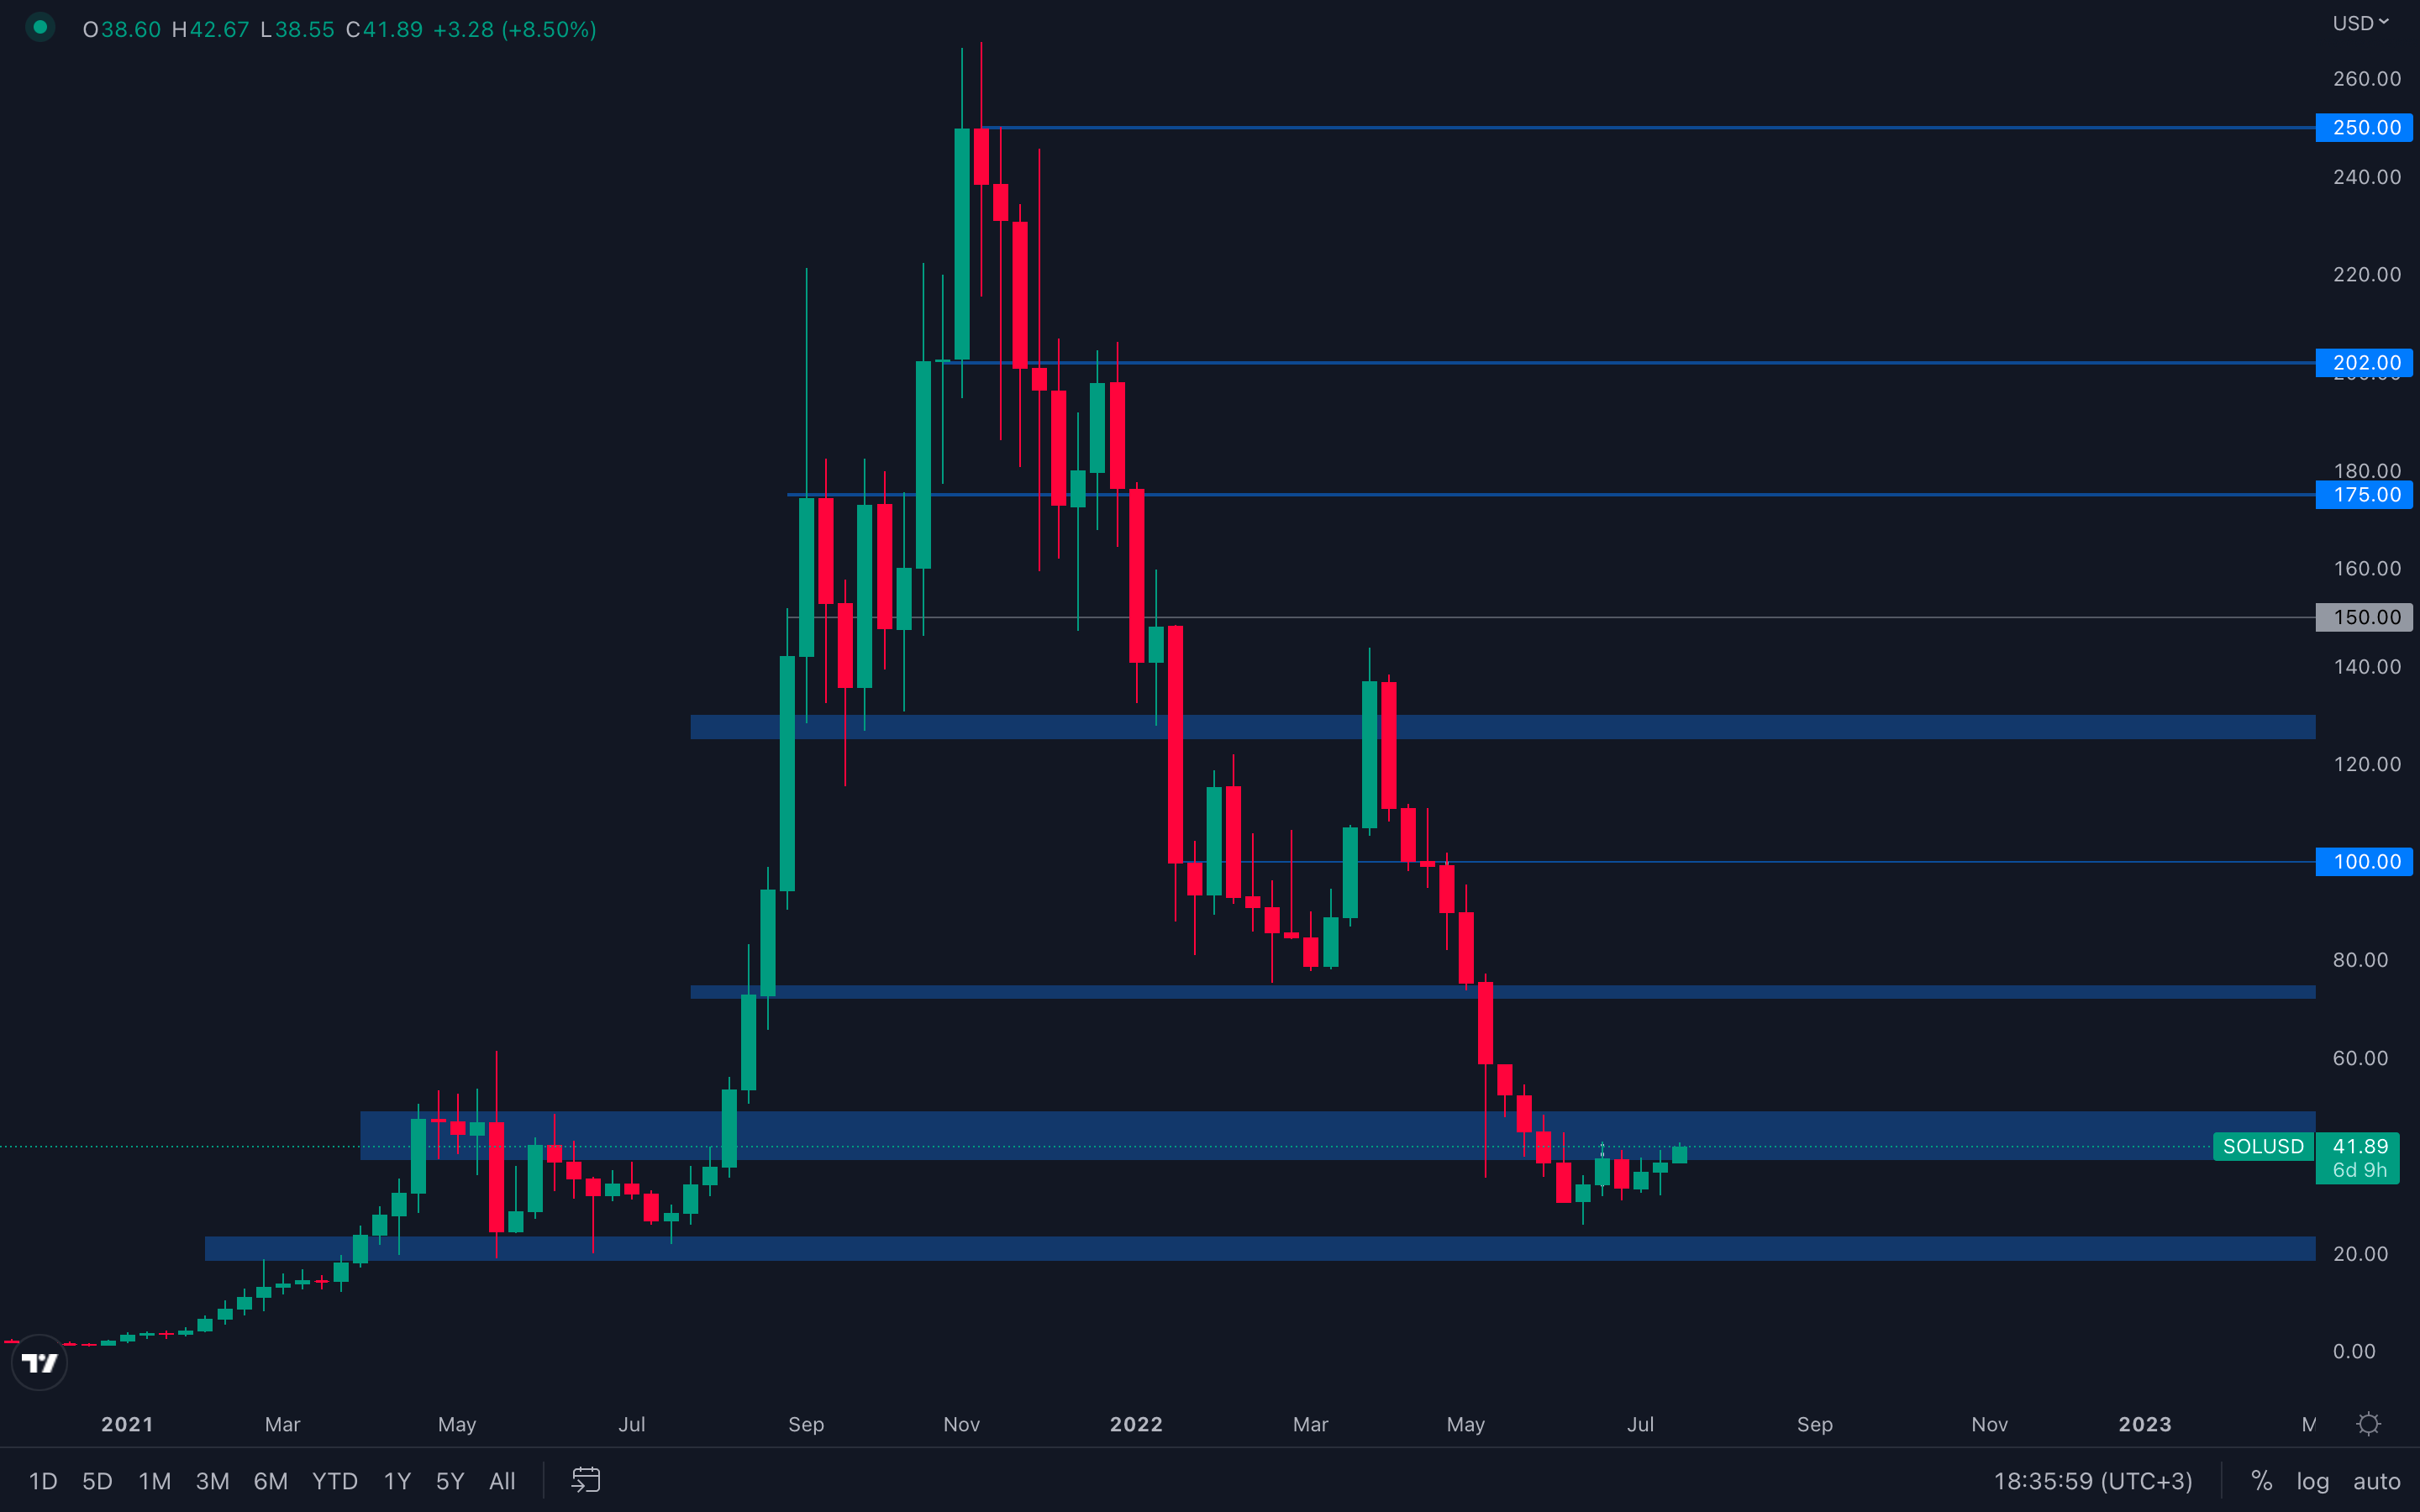 Purely based on candlesticks, SOL looks ready to test the top part of the $40 - $50 range, which is the psychological and technical level of $50. A weekly closure above $40 will also confirm a market structure change, with a higher high being formed at $40 or above. This change shouldn't be taken as a guarantee for further upside, however. We've seen these types of flips be invalidated in a matter of weeks - anything is possible, always trade and invest with caution.
SRM
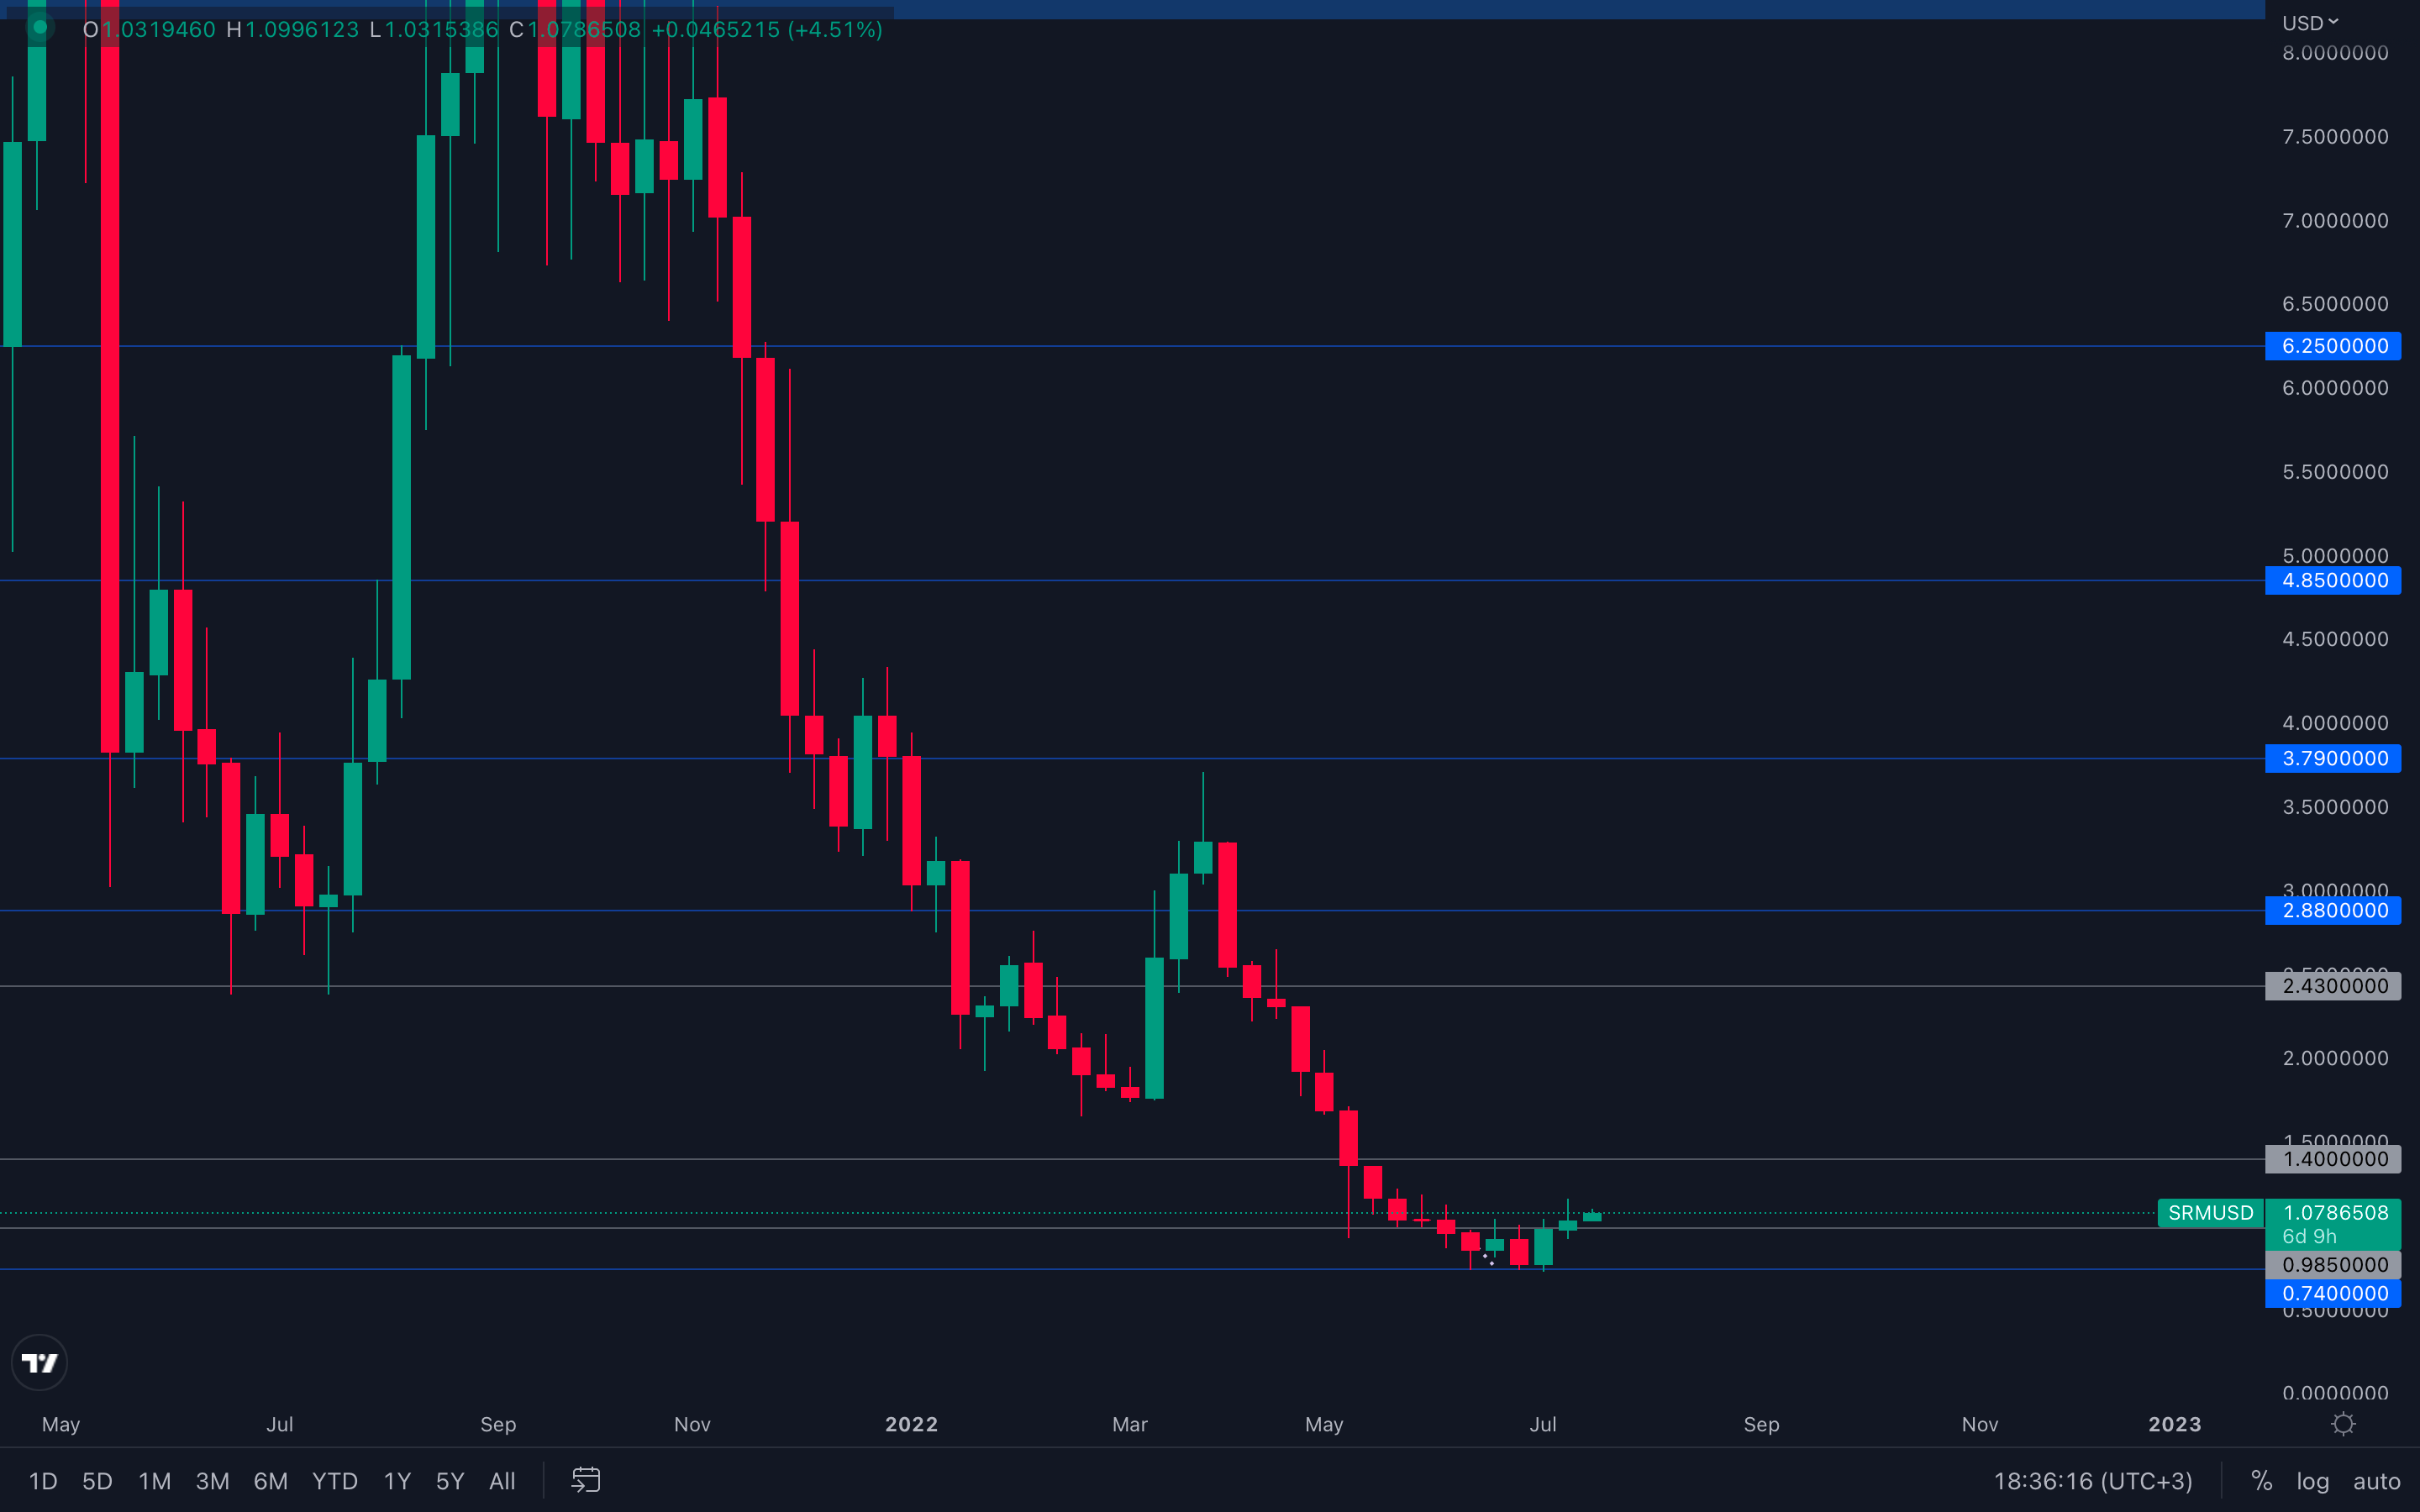 SRM managed to reclaim its psychological level of $1 on the weekly timeframe, which suggests $1.40 is next, unless SRM losses the $1 support level by closing a weekly candle under it. If that happens, then the possibility of a $1.40 resistance test is taken off the table, setting $0.74 as SRM's next target
FTT
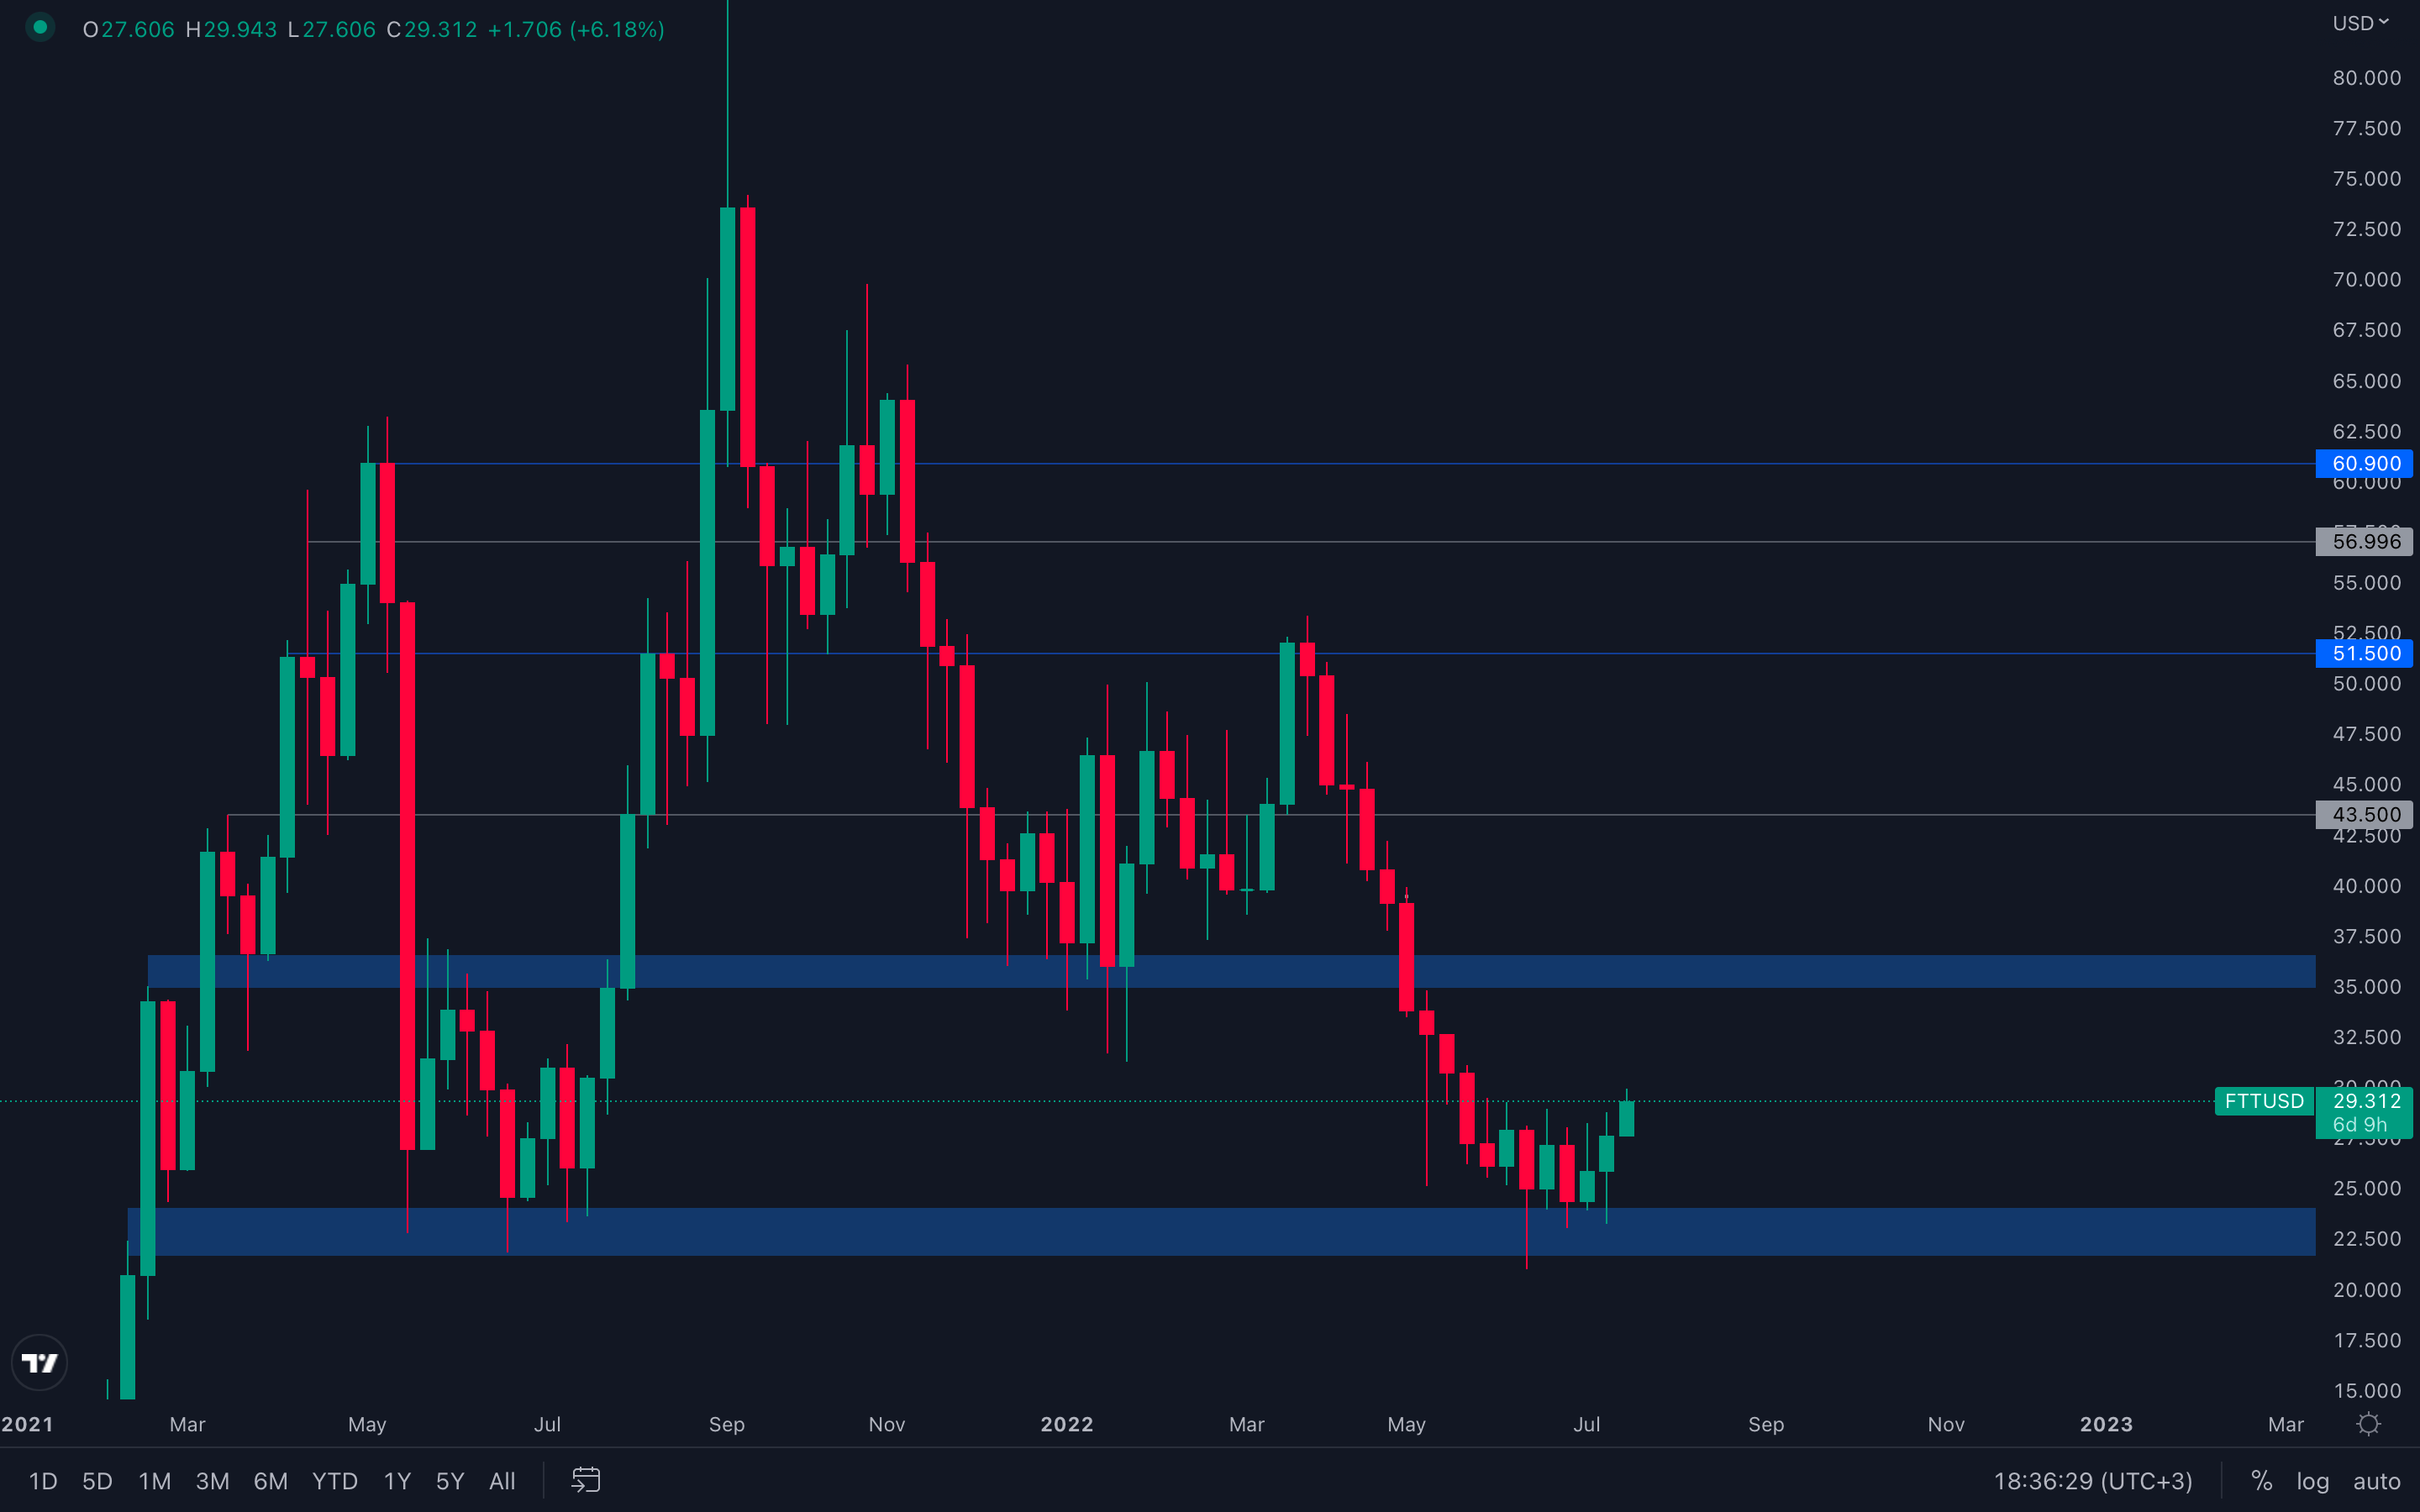 Quite a spicy performance from FTT, we've always enjoyed and loved its volatility, such a dream for fellow traders. FTT's price action can be simplified as followed: a local resistance level around $30 has been formed. In order to confirm further upside, specifically to FTT's next resistance area sitting between $35 and $36, it needs to close a weekly candle above $30. Until then, expect further ranging inside the famous $35 - $21.5 range.
MINA
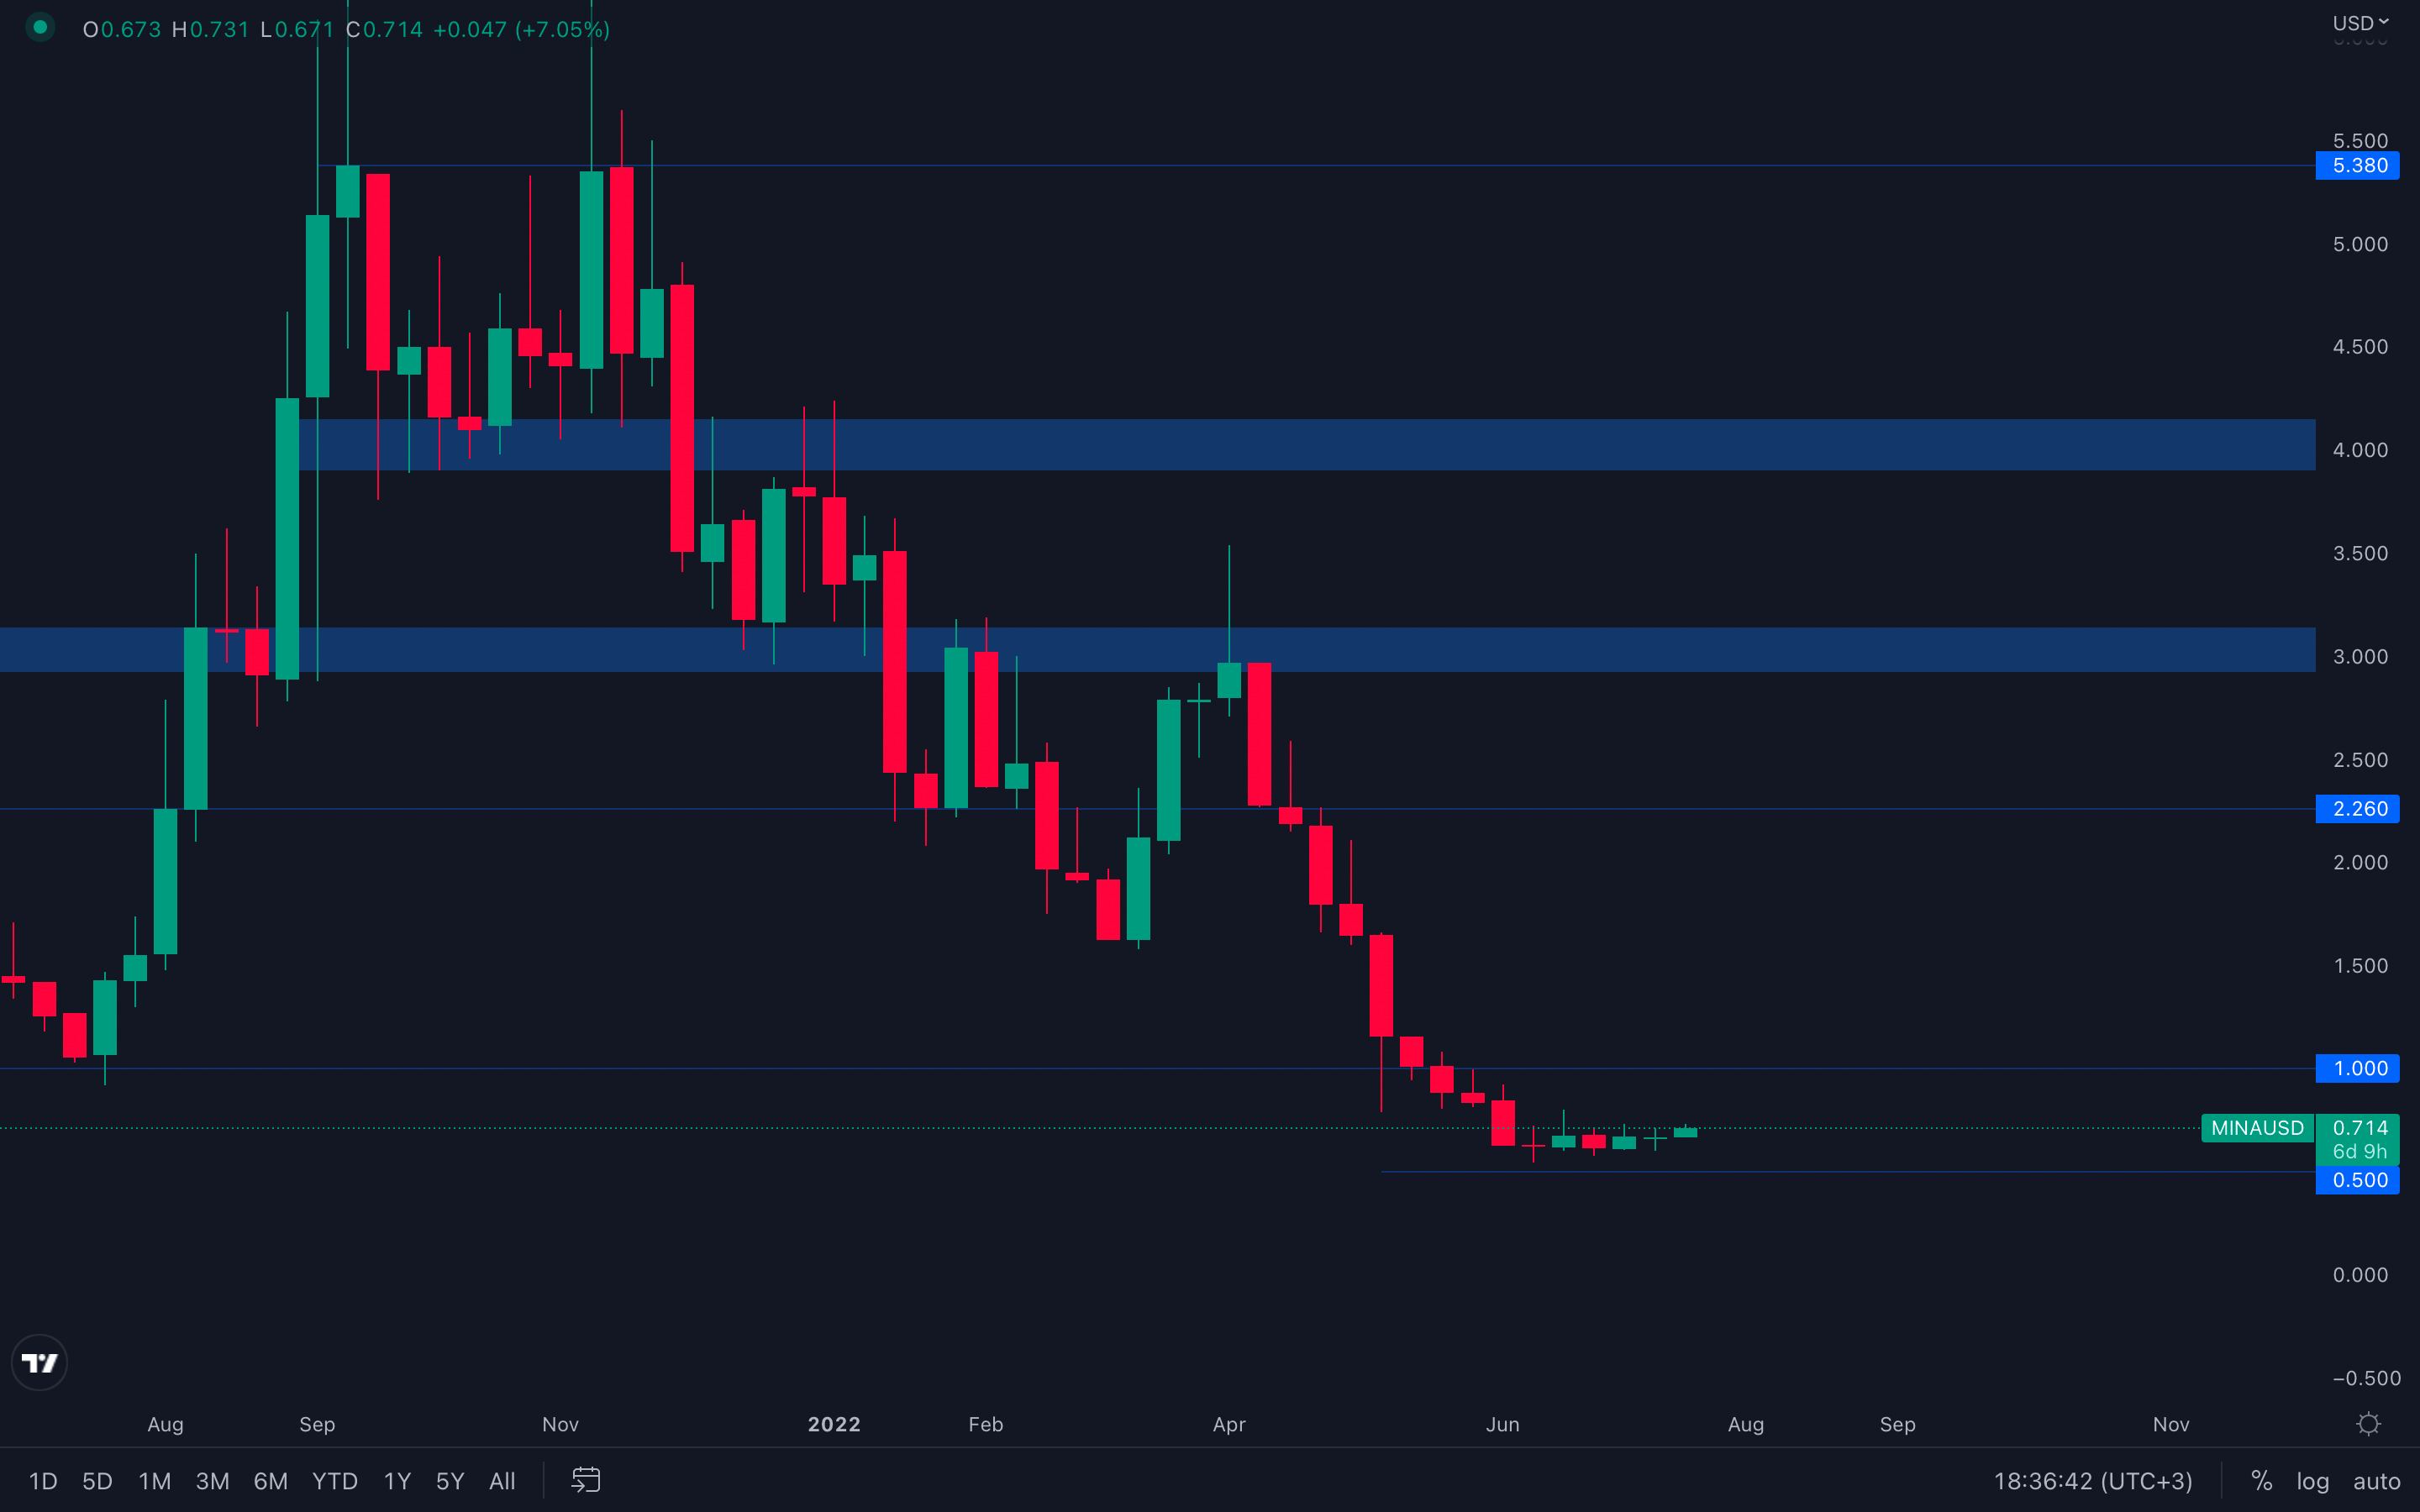 Indecisiveness continues, with constant doji candles being formed week after week. This only suggests one thing - MINA doesn't have enough volume to sustain higher moves, but has the required volatility to provide trading opportunities, as there have been +15% weekly candles for a while now. Of course, where the majors decide to go, MINA will follow, which with what data we've gathered so far, suggests that MINA will continue to range between $1 and $0.5 for a lot more time.
dYdX
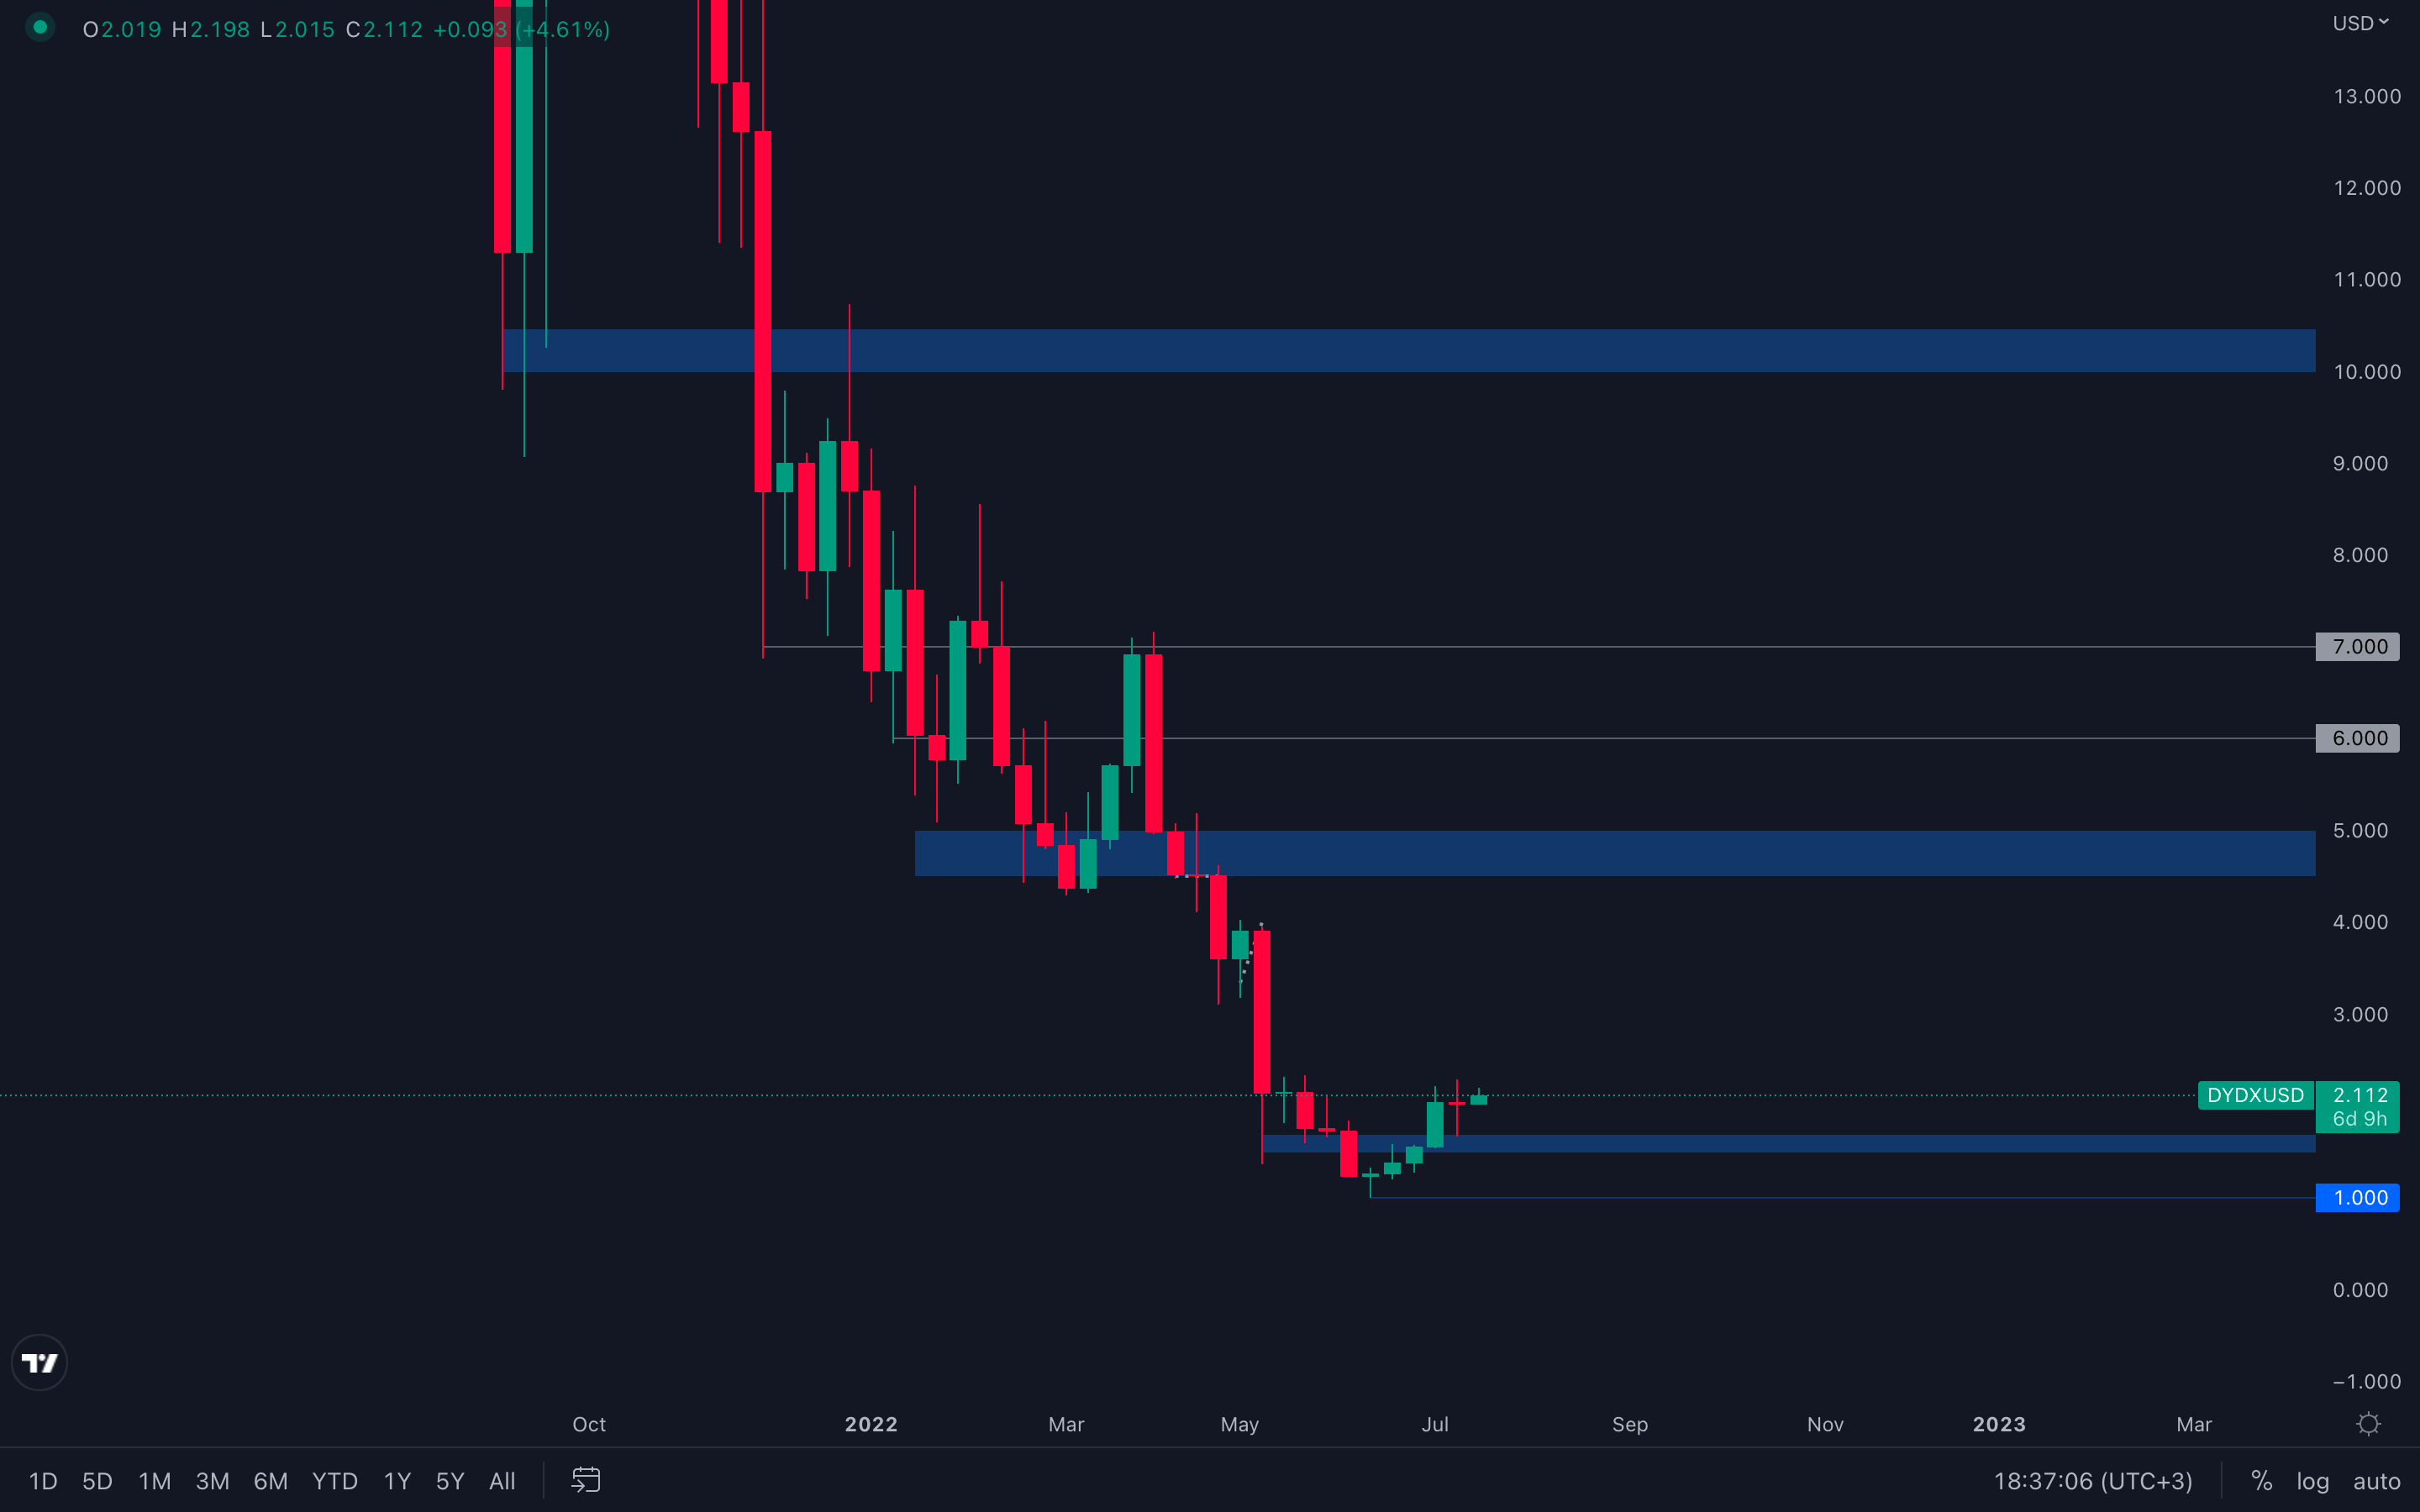 After an impressive rise, dYdX retested its break out area and registered a doji candle, also known as an indecisive candle that doesn't really indicate who is and who isn't in control. However, a bearish engulfing candle has been formed on the daily timeframe, which implies that dYdX is now on a path back to $1.6 - $1.5, with sellers regaining control once again.
Summary
The Hash Ribbon metric shows that we may be at or approaching a bear market bottom. However, we are still continuing to see all wallet cohorts effectively continue their buying other than the one cohort we care about. The ‘Addresses with Balance > 1,000 Bitcoin’ still is decreasing in total wallets suggesting that this cohort is still risking-off. Once this cohort begins to increase in total wallets, that may be a sign to us that we should possibly re-consider buying back in. However, current price levels and metrics suggest that DCA-ing may be worthwhile. As for what to expect from the current pump, we suggest to not see it as anything more than it is - a trap. Prices will most likely return to previous lows due to uncertain market conditions, but that doesn't mean given opportunities cannot be taken advantage of, which is why we're here to guide you in any way we can, so you can learn how to profit from said opportunities.Recommended from Cryptonary


