
Disclaimer: Not financial nor investment advice. You are responsible for any capital-related decisions you make, and only you are accountable for the results.
Macro
In the upcoming week, we have some key macro events. Wednesday is clearly going to be the standout day with the FED Interest Rate decision to be announced and then followed by the FED Press Conference.It is widely expected that the Interest Rate will be raised by 75 basis points (0.75%), however, the key news that’ll likely move the markets will be the FED Press Conference. Markets will be listening intently to FED Chair, J Powell’s forward guidance for what he expects the FED will do going into the September meeting and how the FED currently sees inflation and economic data. The FED’s current priority is to get inflation down, however, with worsening economic data, they ideally need to raise rates to a neutral level more quickly. J Powell’s forward guidance will be extremely key for market movements over the coming weeks and months as they will likely highlight how much more they feel they need to go with regards to increasing interest rates. This week we also have Earnings announcements from Big Tech companies. This will likely be highly correlated to crypto, bad earnings = crypto prices may fall.
TLDR
- This next week has some significant macro data and events from Big Tech Earnings to the FED Interest Rate decision and the FED Press Conference where Powell will give forward guidance to the market that should be watched closely.
- The Realised Price By Address metric shows that the $24,000 level may be a significant resistance level for Bitcoin to pass.
- The Futures Estimated Leverage Ratio is currently high, indicating that there may be some volatility on the horizon.
- Coin Days Destroyed metric shows that a lot of the selling has been older coins, i.e., it is likely the retail cohort have mostly left the space and therefore the selling has been dominated by the ‘hodler’ class.
- The aSOPR and SOPR metrics indicate that investor sentiment is low as investors are looking to sell into price rebounds in the hope that they will break-even on their investment rather than having the confidence to wait for higher prices and sell into that.
Total Market Cap
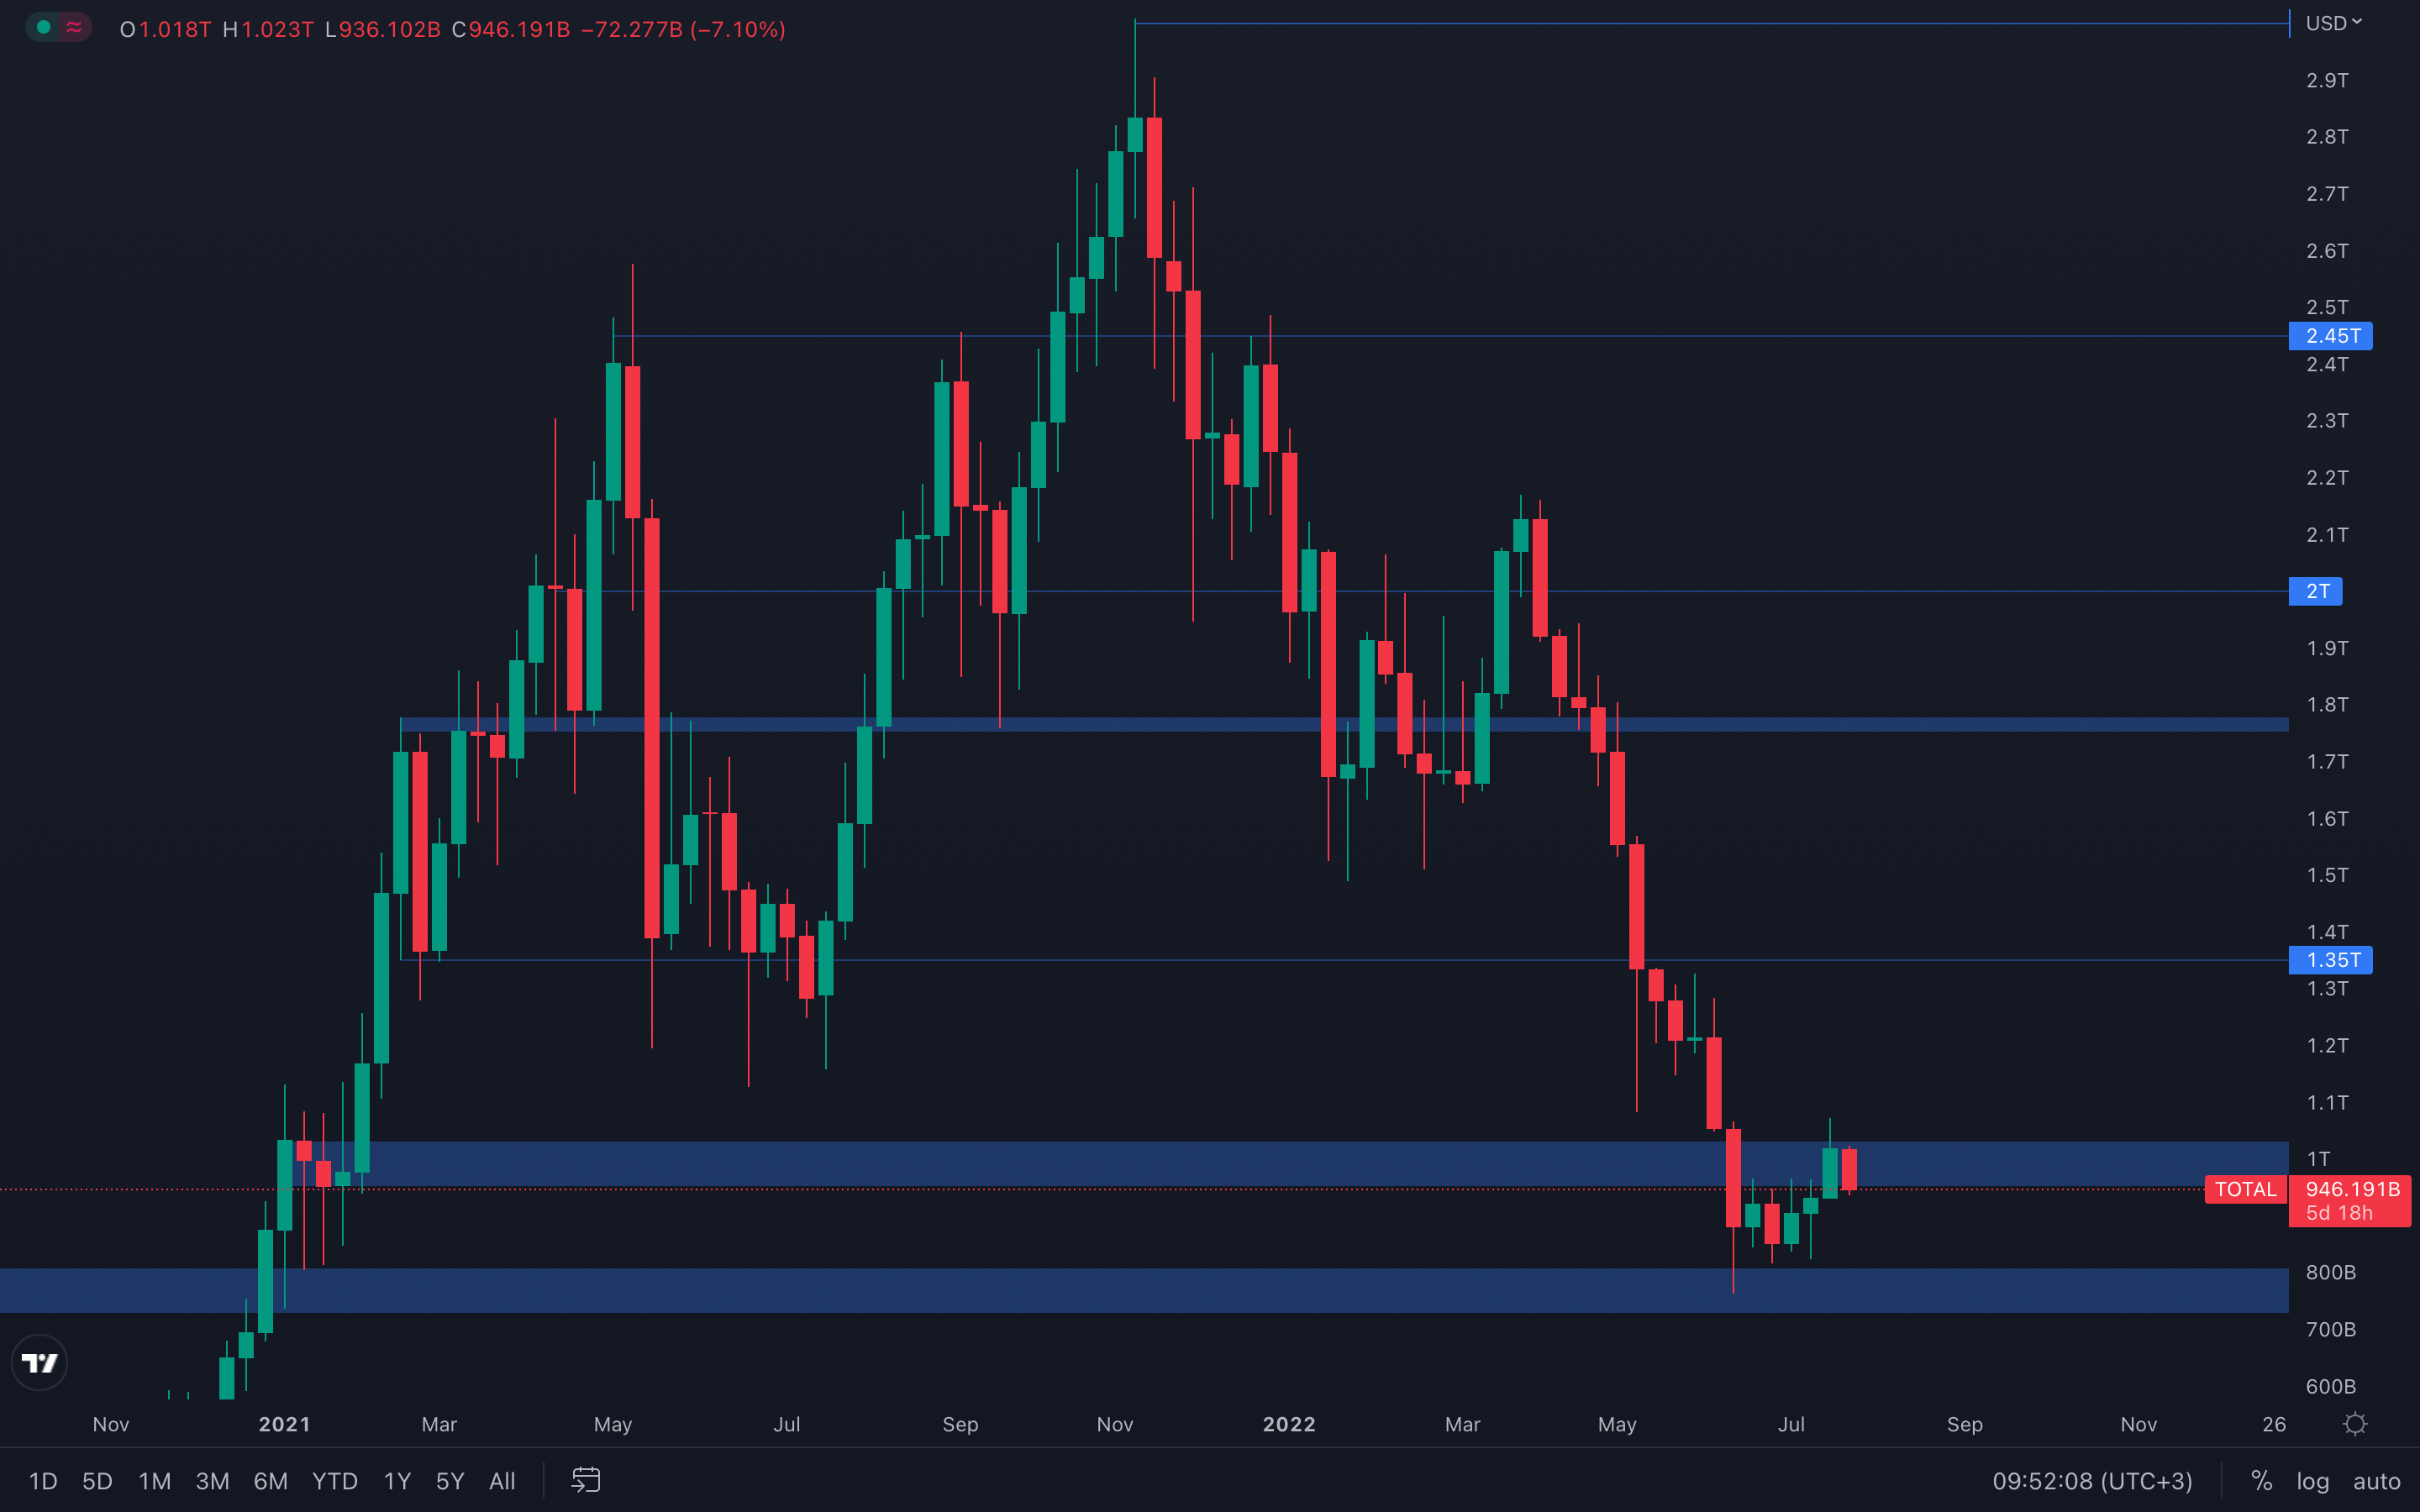 Because the Total Market Cap was unable to close a weekly candle above its $1T psychological and technical level, the market is now experiencing difficulties, with sellers regaining control once more. As we also mentioned in last week's report, unless the Total Market Cap reclaims its $1T level on the weekly timeframe, no further upside can actually be confirmed. We're now seeing the market getting rejected from that level, which suggests that we could return to the previous lows of $800B unless the index reclaims the $1T level.
Altcoins Market Cap
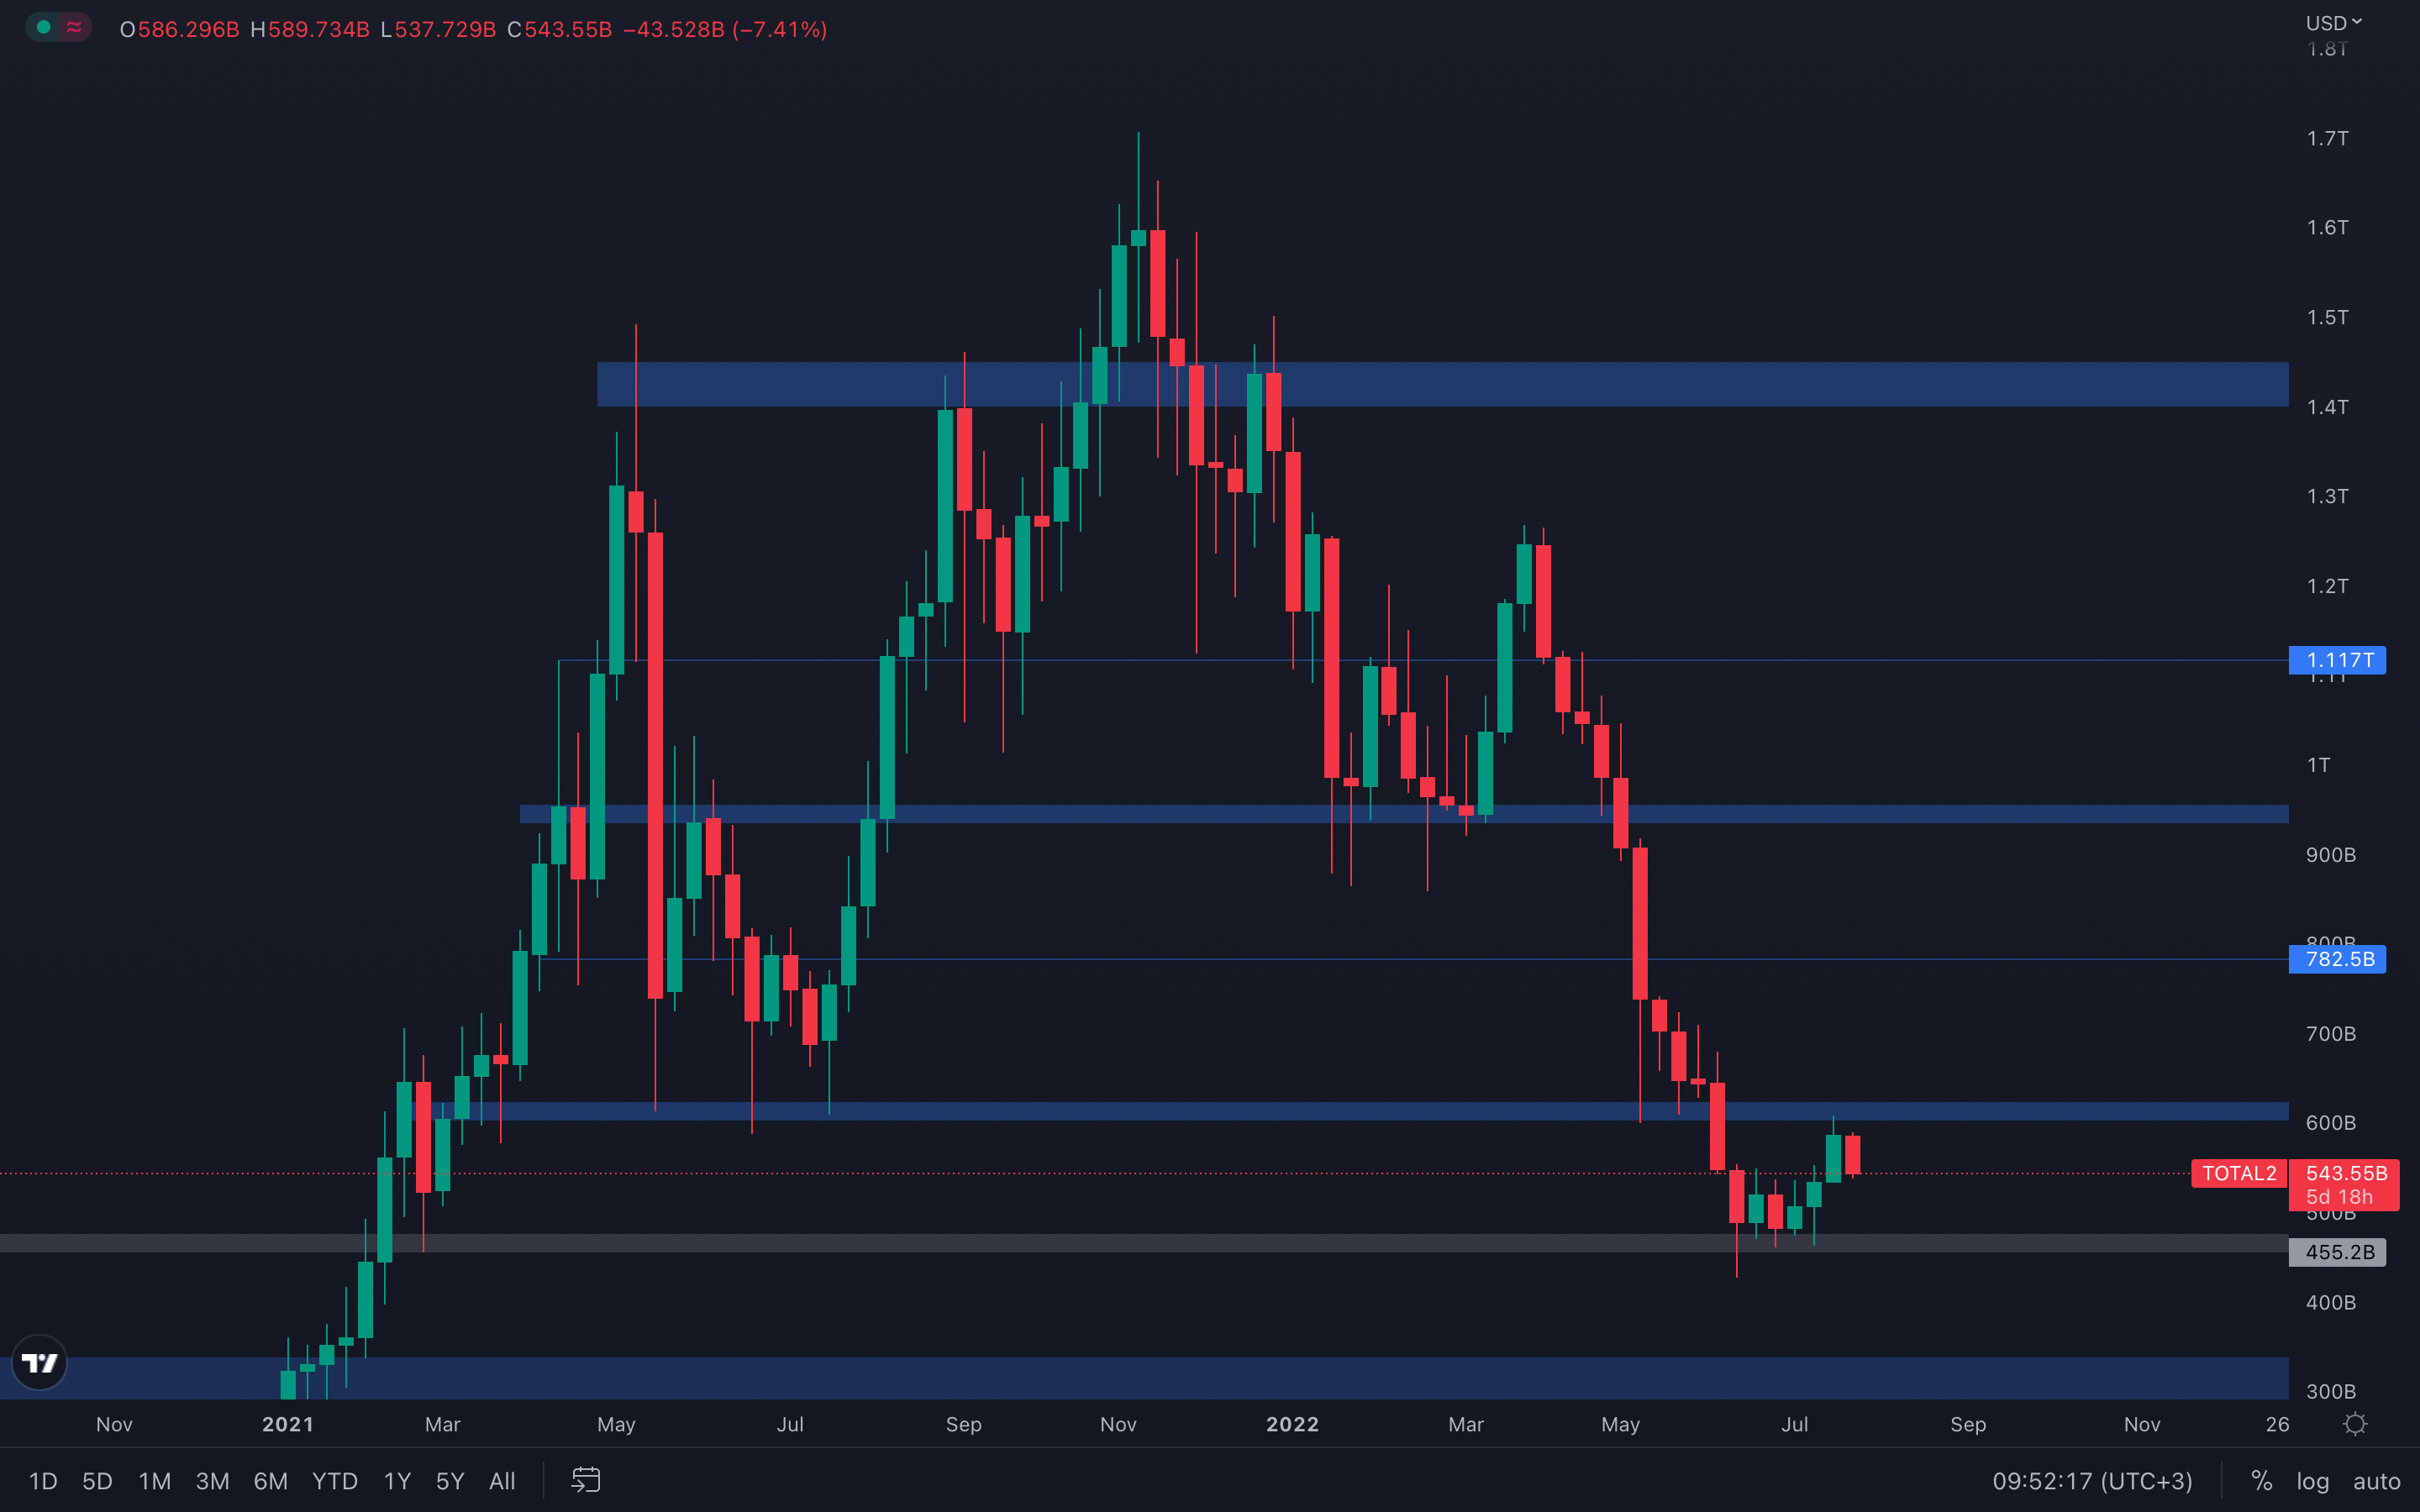 The Altcoins Market Cap has found itself in a similar situation with the other major index - after successfully testing the $600B resistance level, something we were expecting and mentioned in last week's report, it is now experiencing a loss in value, as sellers are keeping the buyers at bay. The outcome here is quite simple to understand - either the Altcoins Market Cap reclaims its $600B level on the weekly timeframe, aiming for $782,5B as its next target, or buyers are unable to maintain control over the price, which will lead to sellers pushing the index back to the $450B level. With what's currently happening in the macro environment, it's safe to assume the 2nd scenario has an increased chance of occuring.
Bitcoin - Technical & On-Chain Analysis
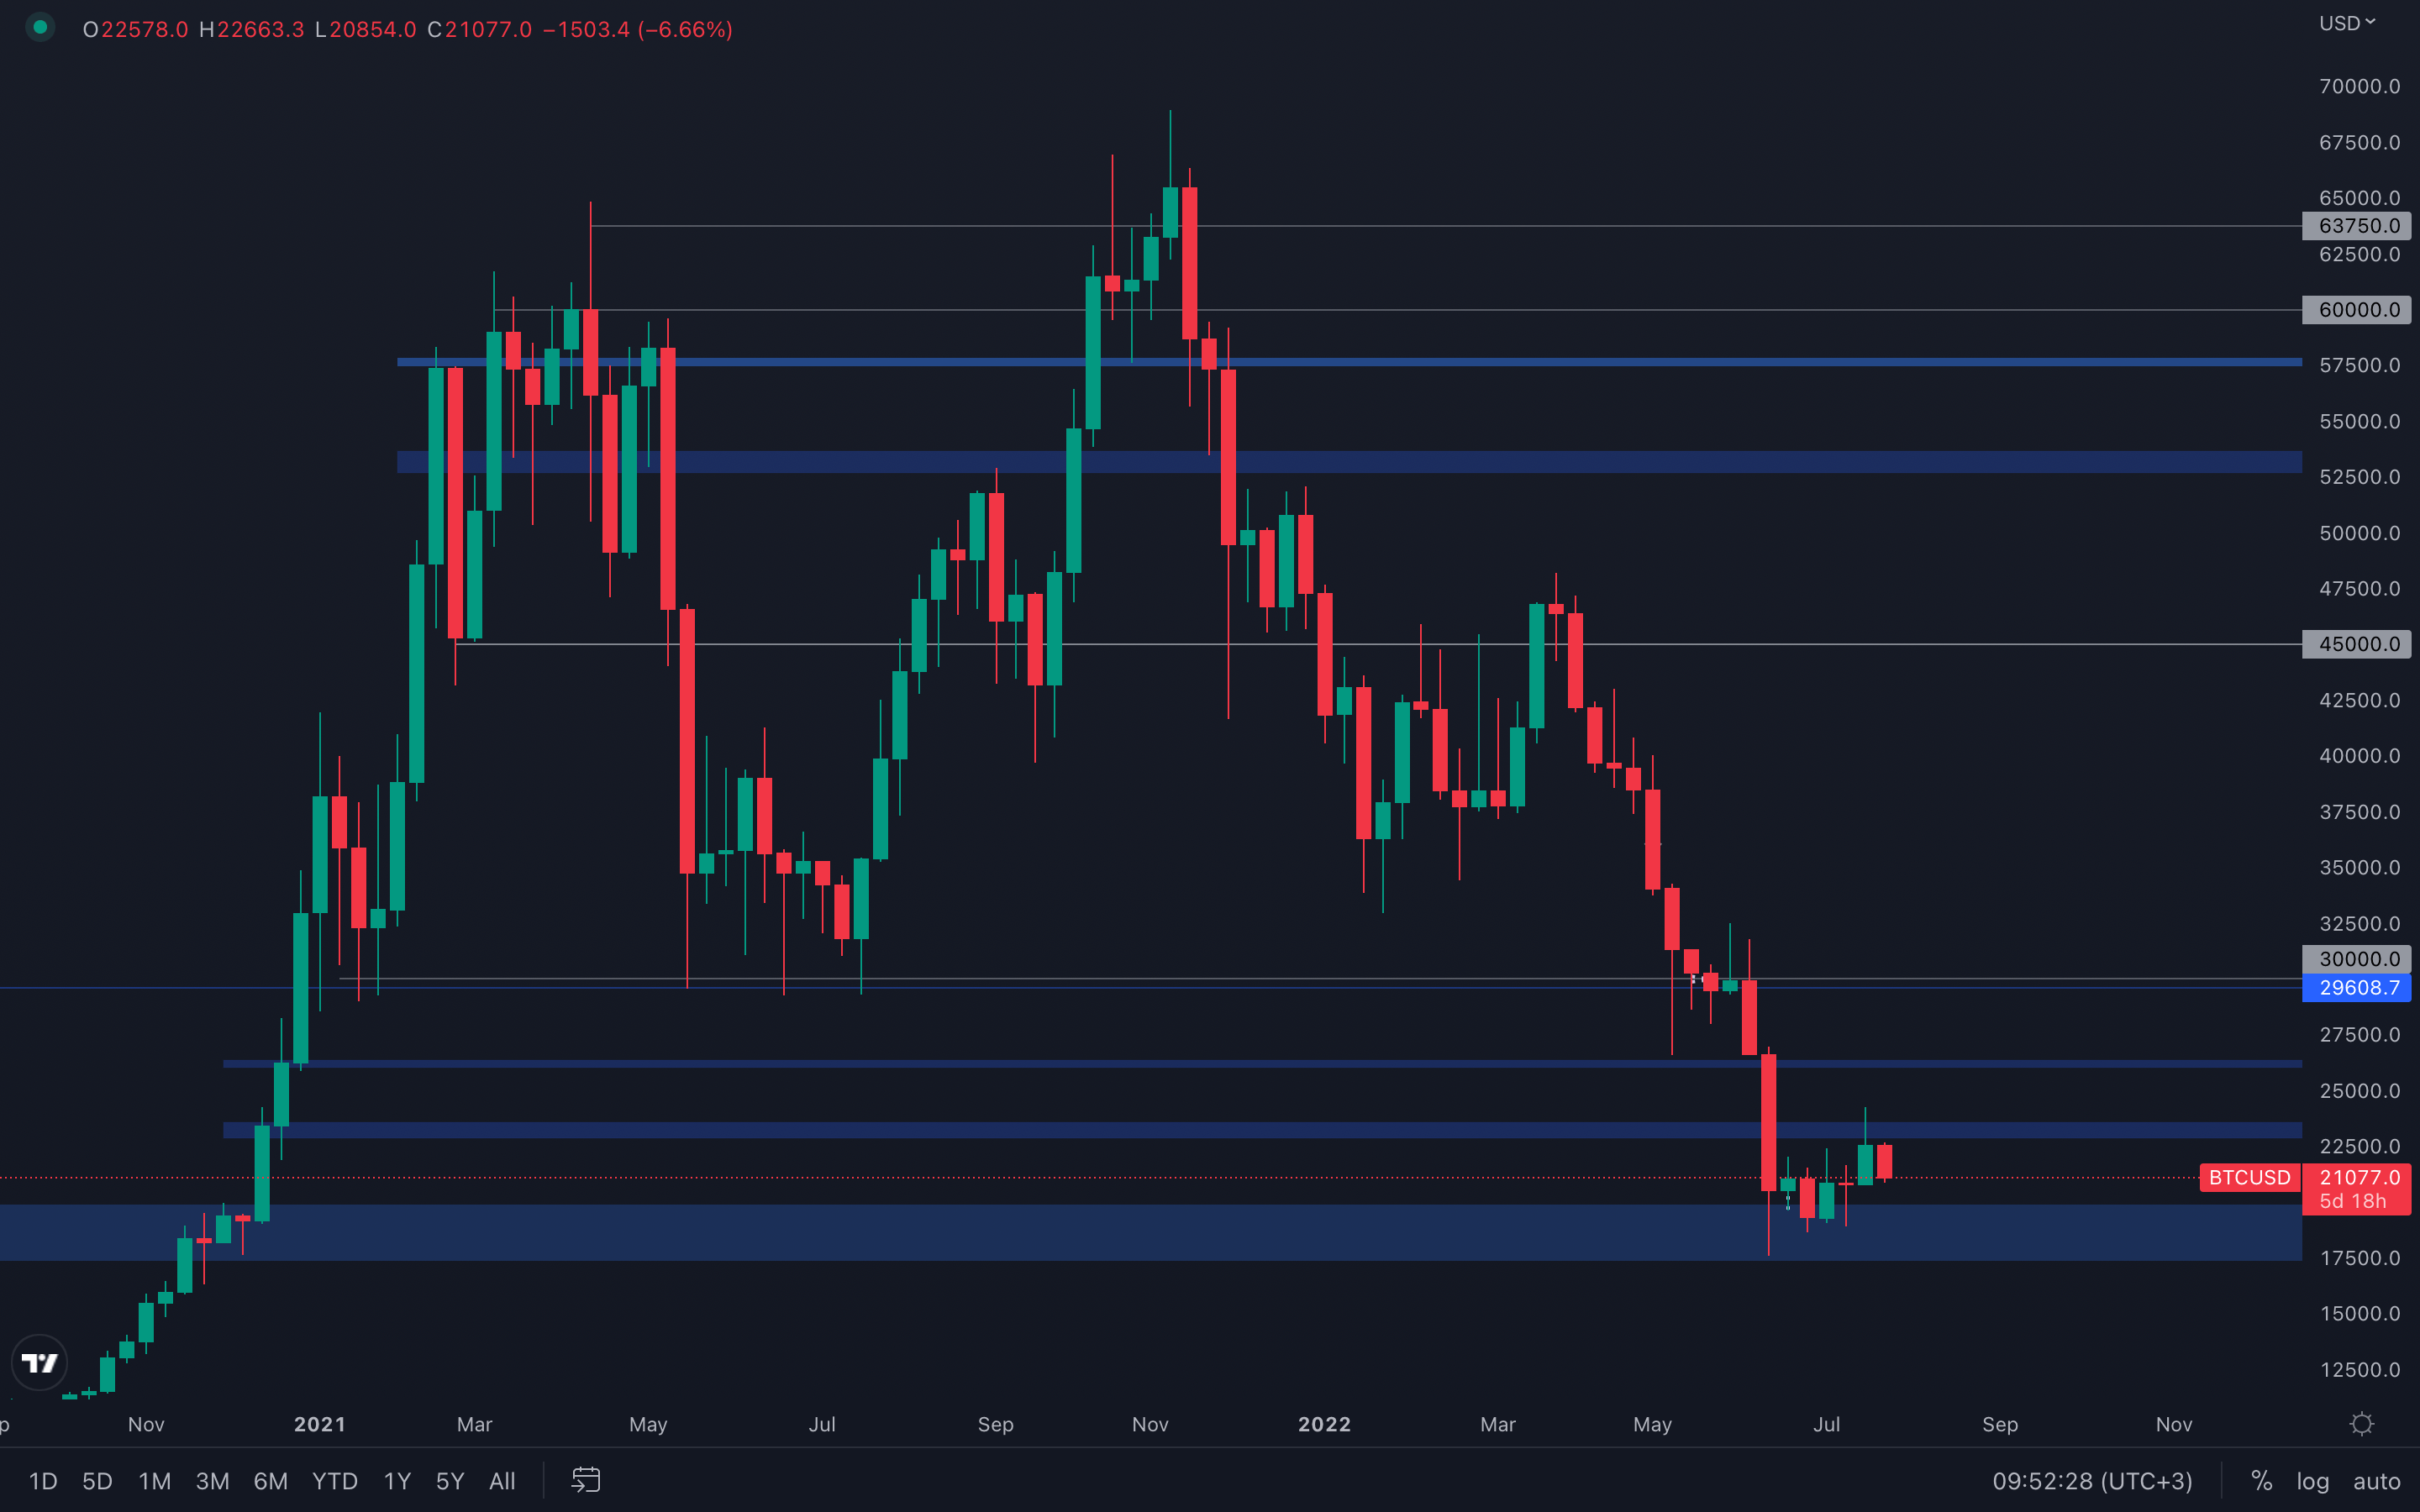 "Nothing more than a bear market pump" - this is what we will continue mentioning until the macro environment itself shows signs of strength, in favour of the crypto market. Obviously, these price movements provide opportunities and where there's opportunity, there's money to be made.
Bitcoin was unable to break above its $23k - $24k resistance area, resulting in sellers outperforming buyers with the intent of leading the price towards the $20k level once again. However, as long as no weekly candle closes under $19,300 (lowest local weekly candle closure), no actual further downside can occur, only sideways movement between $23k and $17,5k, until either of these levels are broken. We will continue to keep you updated with day-to-day changes, but for now - expect a $20k test this week.
Metric 1 – Realised Price By Address
The Realised Price By Address visualises the average price at which current unspent Bitcoins belonging to each category of addresses were purchased for. In previous bear markets, these average costs of the wallet cohorts have acted as strong support until prices can no longer continue getting buying momentum from these price levels. Once this happens, the price eventually breaks lower as investors capitulate and realise losses. In the below chart, we can see that price has now done this in mid-June. However, just like these average price bands act as support when the price is above these levels, they now act as resistance when the price is below these levels. We can see that a number of the wallet cohorts average prices range between $23,500 and $24,800. As prices re-approaches these levels, investors who have been in unrealised losses may see their investment re-approach a break-even level. As this happens, low investor sentiment sees investors sell their coins as they re-approach these levels - the $23,000 - $24,000 area acts as a resistance.
Bitcoin – Realised Price By Address

Metric 2 – Futures Estimated Leverage Ratio
The second metric we will cover today is the Futures Estimated Leverage Ratio. This metric measures the amount of leverage in the market in relation to the value in the corresponding Spot markets. A usual/more common leverage ratio is 0.2. However, we can see that from mid-June, this has increased from 0.23 to now 0.275 (with a high of 0.284). This is a very high ratio and suggests we could have a significant move ahead of us.
Bitcoin – Futures Estimated Leverage Ratio

Metric 3 – Coin Days Destroyed
The Coin Days Destroyed metrics show us which age of coins are being spent, the older the coins spent, the more days destroyed.
Following the mid-June low, many of the coins that were sold were older coins (aged between 2 years and 7 years). Younger coins were not heavily spent. When prices fall, we usually see young coins being spent more than older coins, however this time round, this was not the case. This suggests to us that there is no longer many retail (short-term holders – young coins) investors left and that the market is dominated by ‘hodlers’. However, in the mid-June drop in prices from roughly $30,000 to $20,000, the majority of the selling (in Coin Days Destroyed) was from older coins. This may be a sign that even some of the ‘hodlers’ are being flushed out – another sign of a late phase of a bear market.
Bitcoin – Coin Days Destroyed

Note: The most recent spikes in this metric were not as big as the deleveraging events we saw in 2021 when the market was rife with retail investors.
If we look at the same metric for Ether, we see even more prominent CDD spikes. Again, this shows that older coins were being spent, showing a possible capitulation from the ‘hodler’ class.
Metric 4 – aSOPR
The aSOPR metric emphasises our point that investor sentiment is low. Currently, on the aSOPR, we can see that the orange line struggles to get above the black horizontal line. This shows that the majority of investors are in unrealised losses and as prices approach a break-even level for these investors, they don’t have the confidence to continue holding their coins in the hope of selling them at a higher price. Therefore, they sell these coins at the break-even point.
Bitcoin – aSOPR

Ether - Technical & On-Chain Analysis
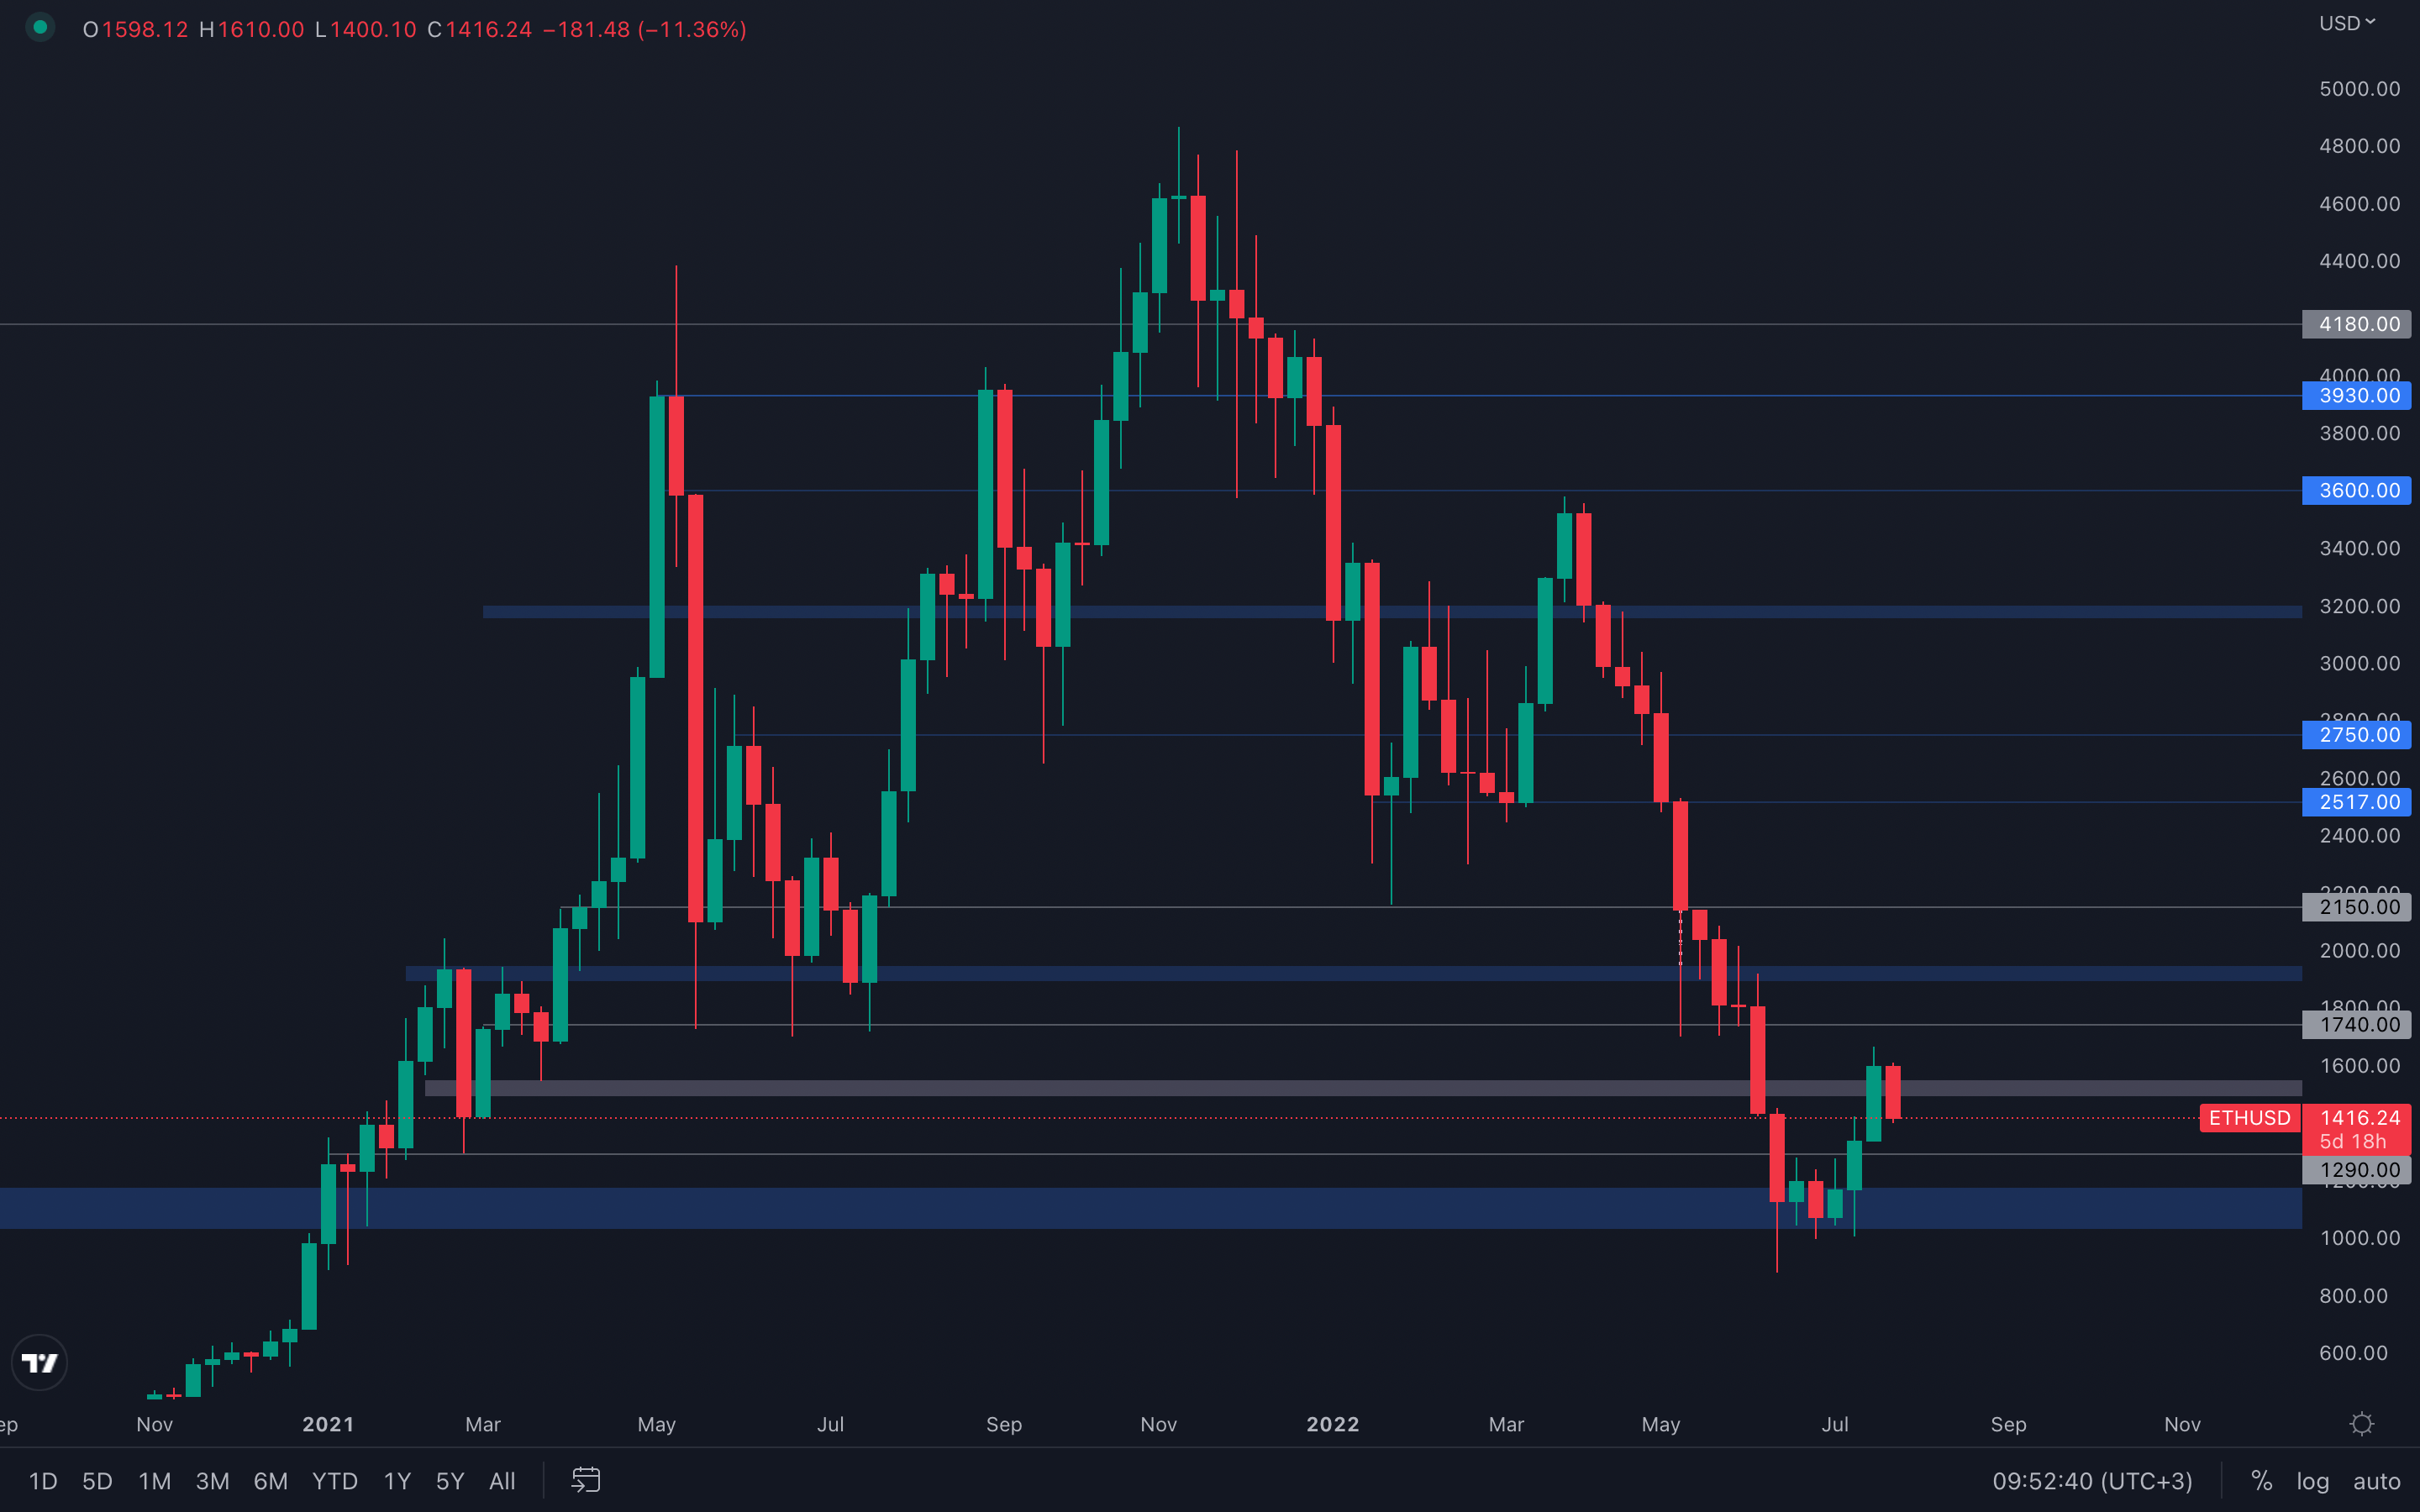 Last week, we mentioned the possibility of ETH aiming for a $1300 test after experiencing a strong +50% rise in a matter of three weeks. With how the current weekly candle looks like, a $1300 test might be on the cards sooner than expected. If ETH successfully manages to hold its $1300 level, while also bouncing towards $1500 and above once again, a weekly higher low will form which represents the start of a potential change in market structure. Of course, this is only one of the many scenarios that can happen and should be taken with a grain of salt, not as a guarantee. A loss of $1300 will suggest ETH will head towards its $1000 psychological and technical level.
Metric 1 – Futures Estimated Leverage Ratio
If we look at the same metric but for Ether, we can see that it is at much more reasonable levels – roughly around the 0.2 level.
Ether – Futures Estimated Leverage Ratio

Metric 2 – Coin Days Destroyed
If we look at the same metric for Ether, we see even more prominent CDD spikes. Again, this shows that older coins were being spent, showing a possible capitulation from the ‘hodler’ class.
Ether – Coin Days Destroyed

Metric 3 – aSOPR
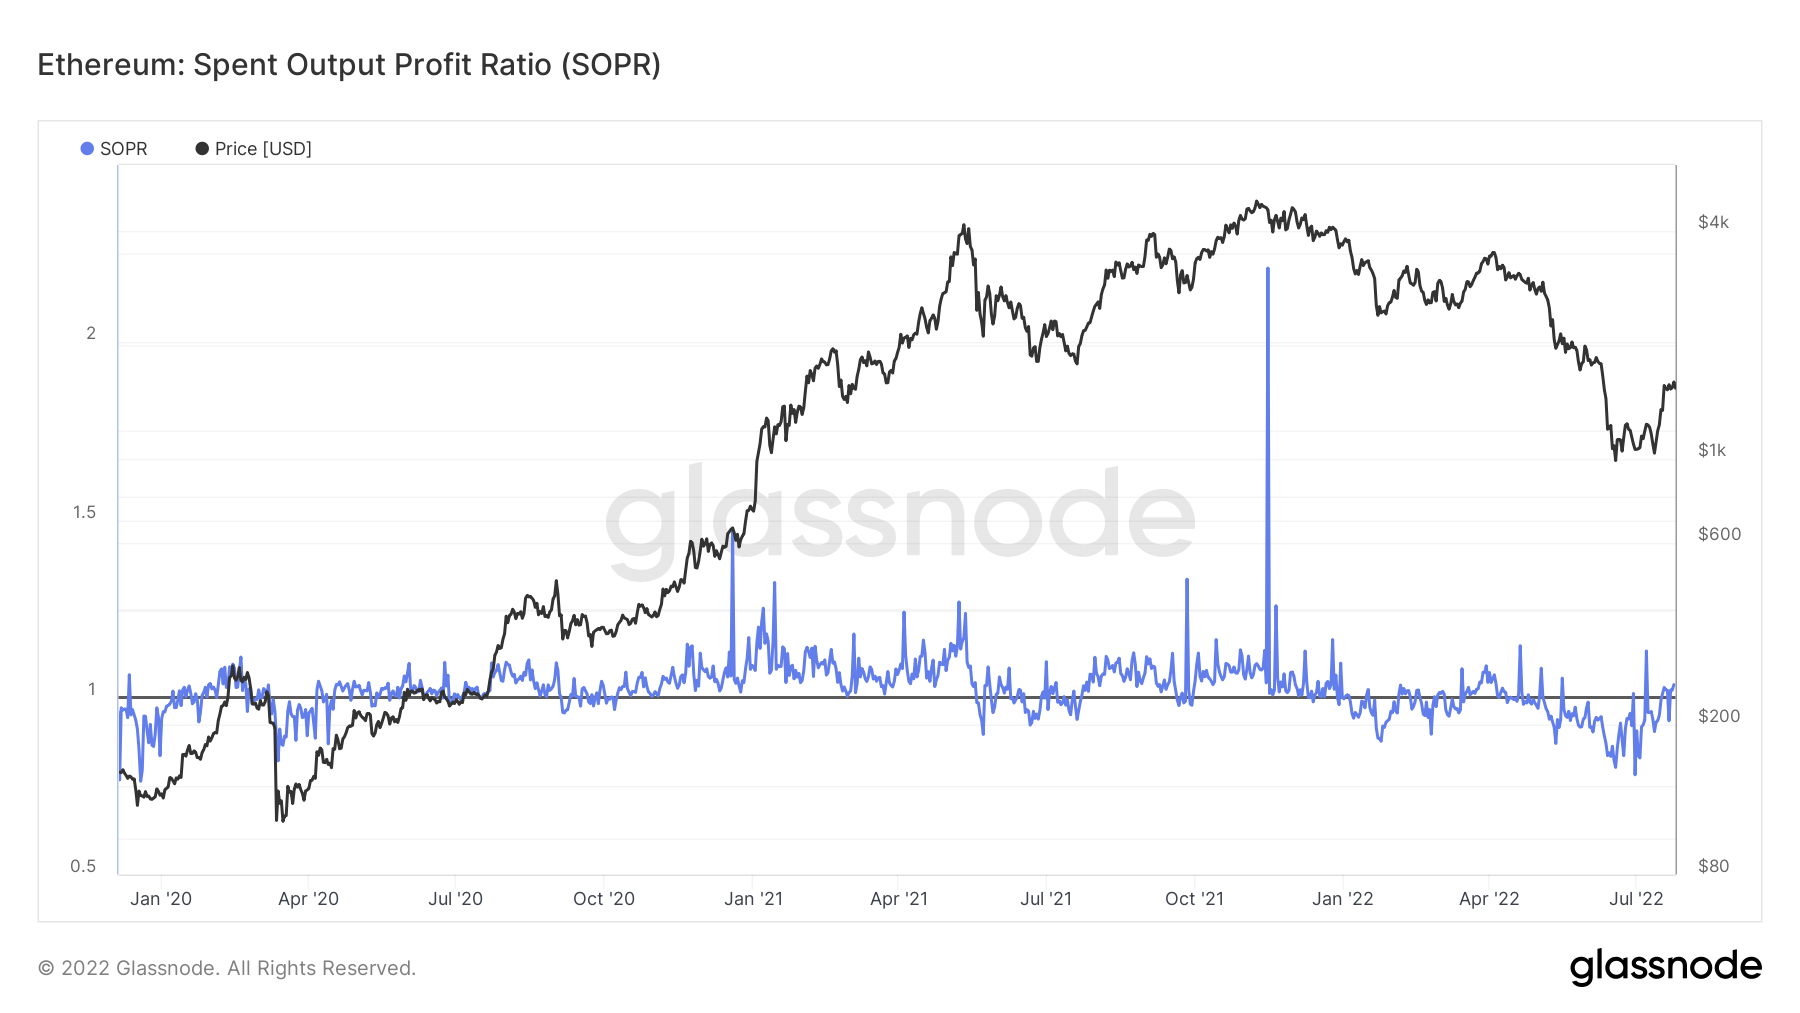
If we look at a similar metric (SOPR) but for Ether, we can see that the sentiment is the same here. We’re still seeing selling into the break-even line (black horizontal line).
Ether – SOPR
DOT
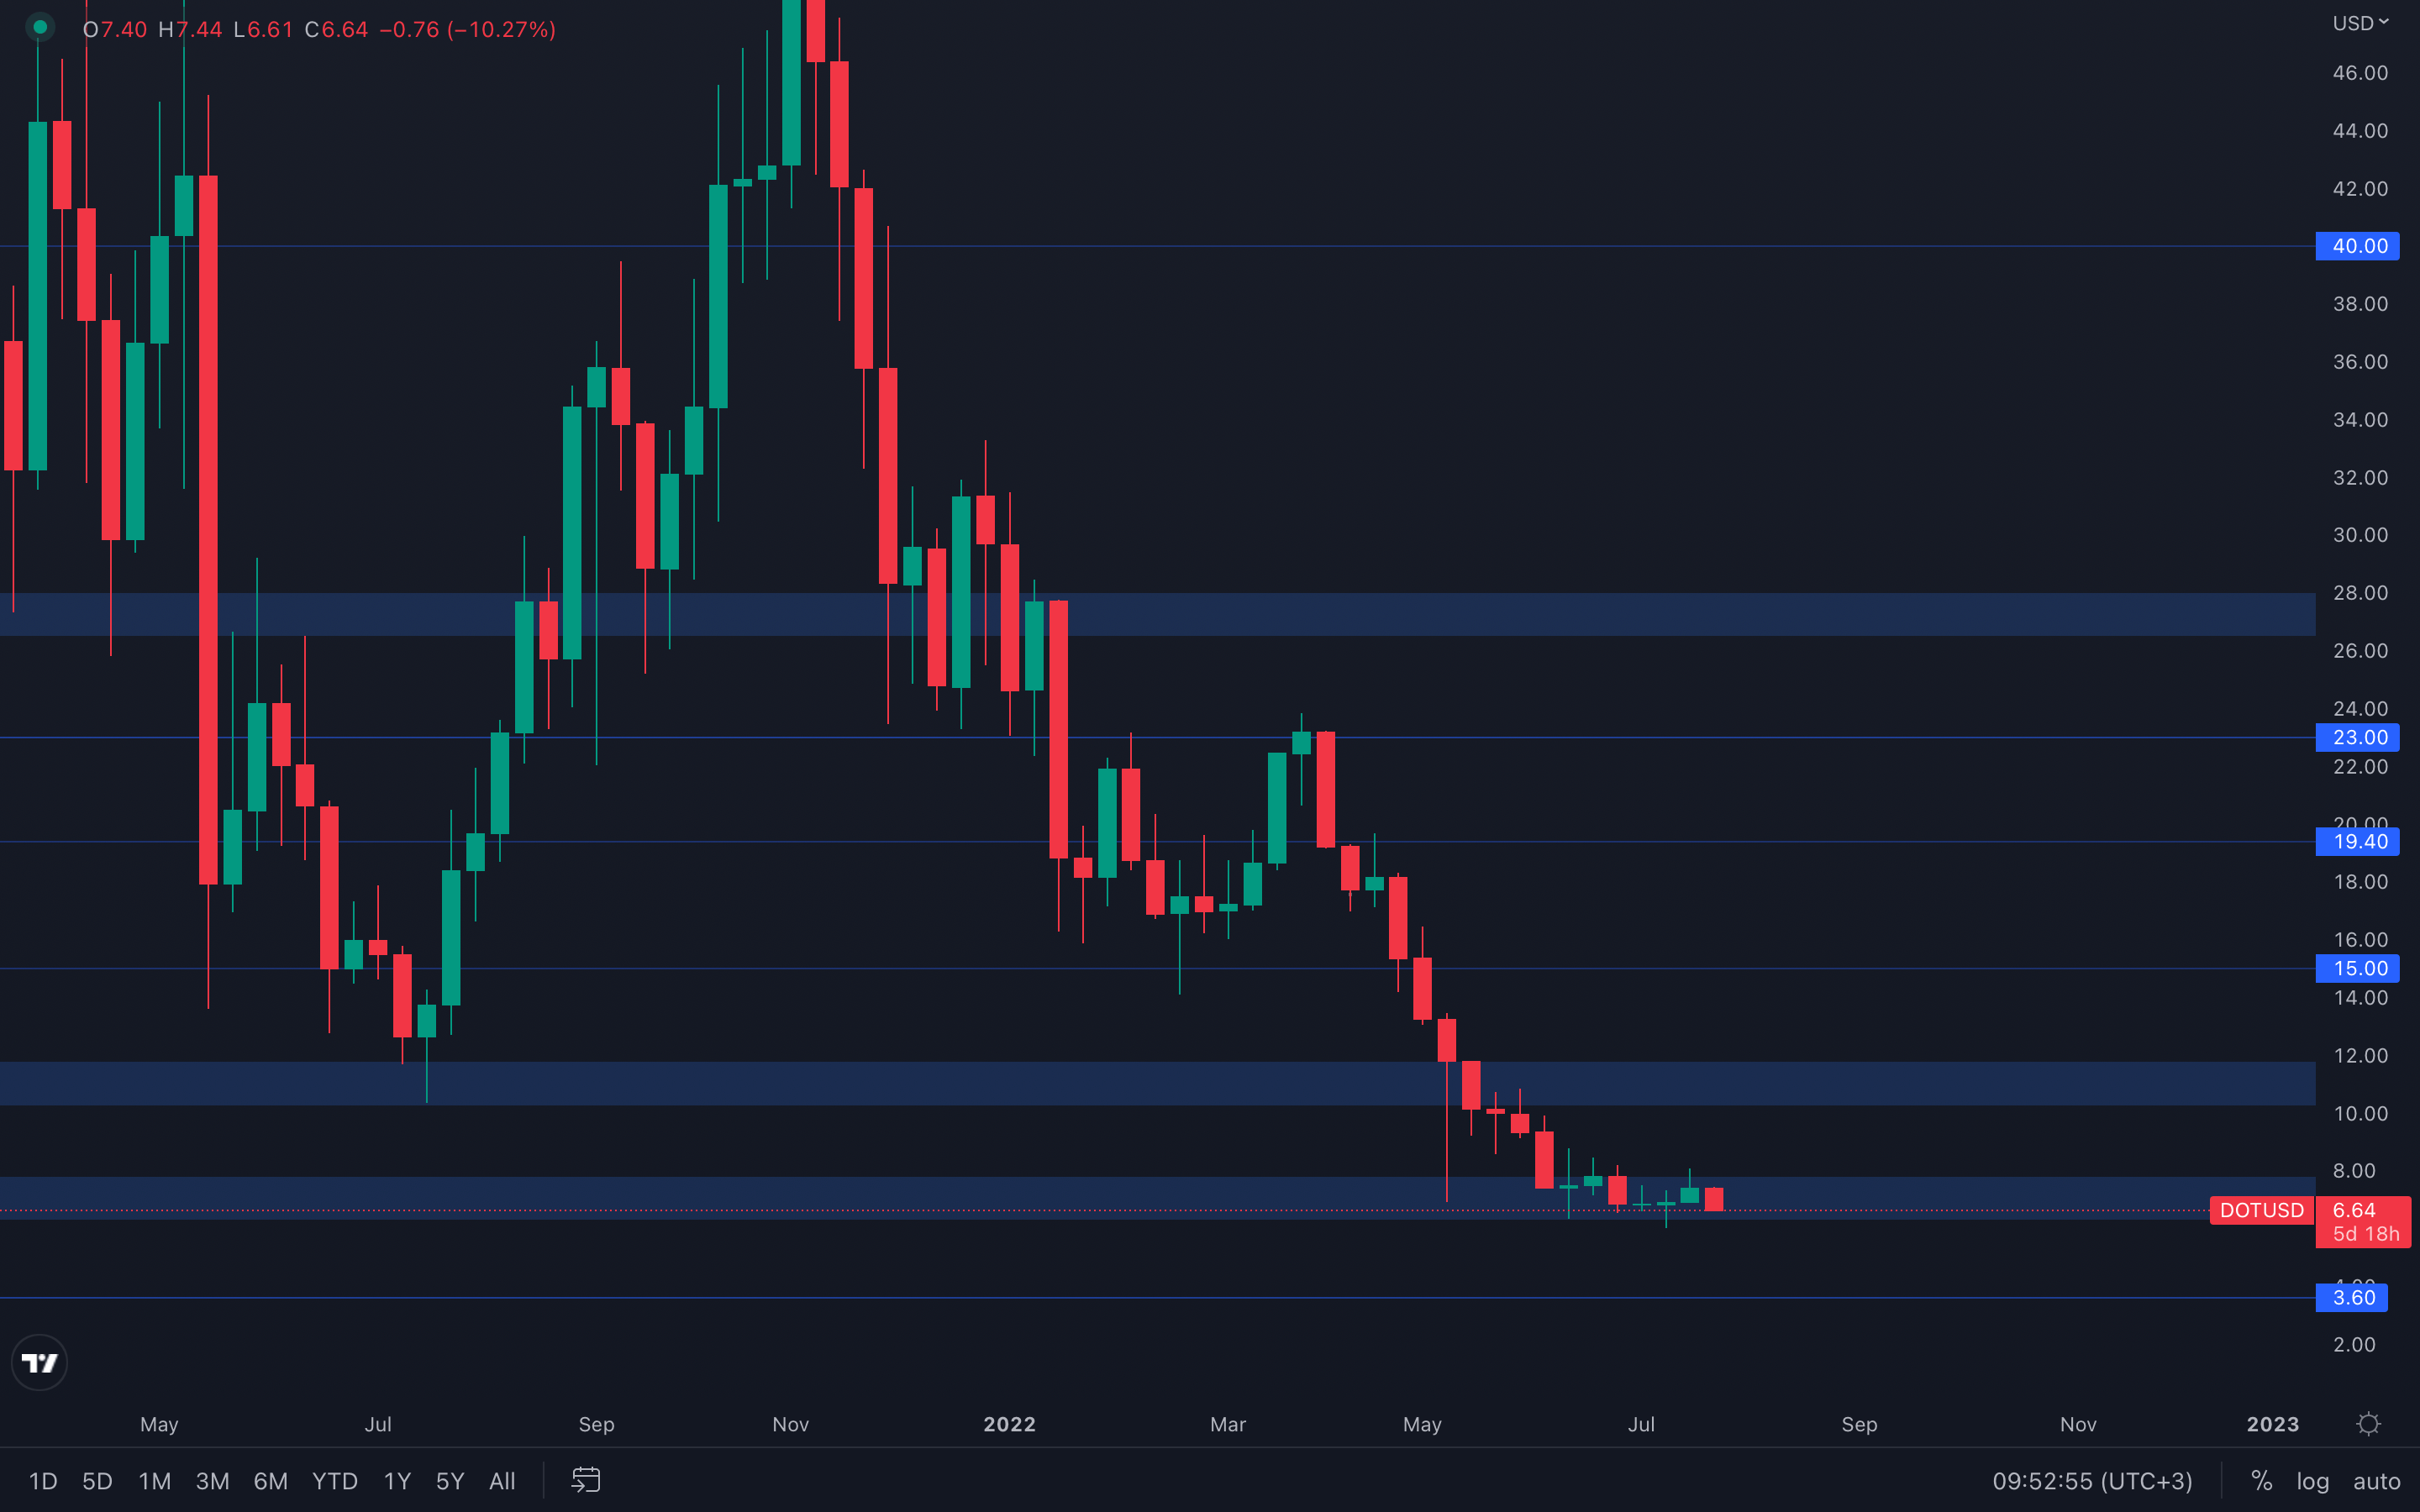 A range between $6,30 and $8 has been formed, inside of which DOT has been trading for more than 40 days. Last week, we saw DOT test the top part of this range, the $8 level, where sellers stepped in and pushed the price to sub $7 once more. It's almost guaranteed that DOT will test the bottom part of the range, $6,30, as the difference in price is minimal.
DOT's situation is simple - trading inside a range, where only a break of either $6,30 or $8 will suggest where DOT is heading next. Until then, expect movement in consistency with both the majors and the indexes.
SNX
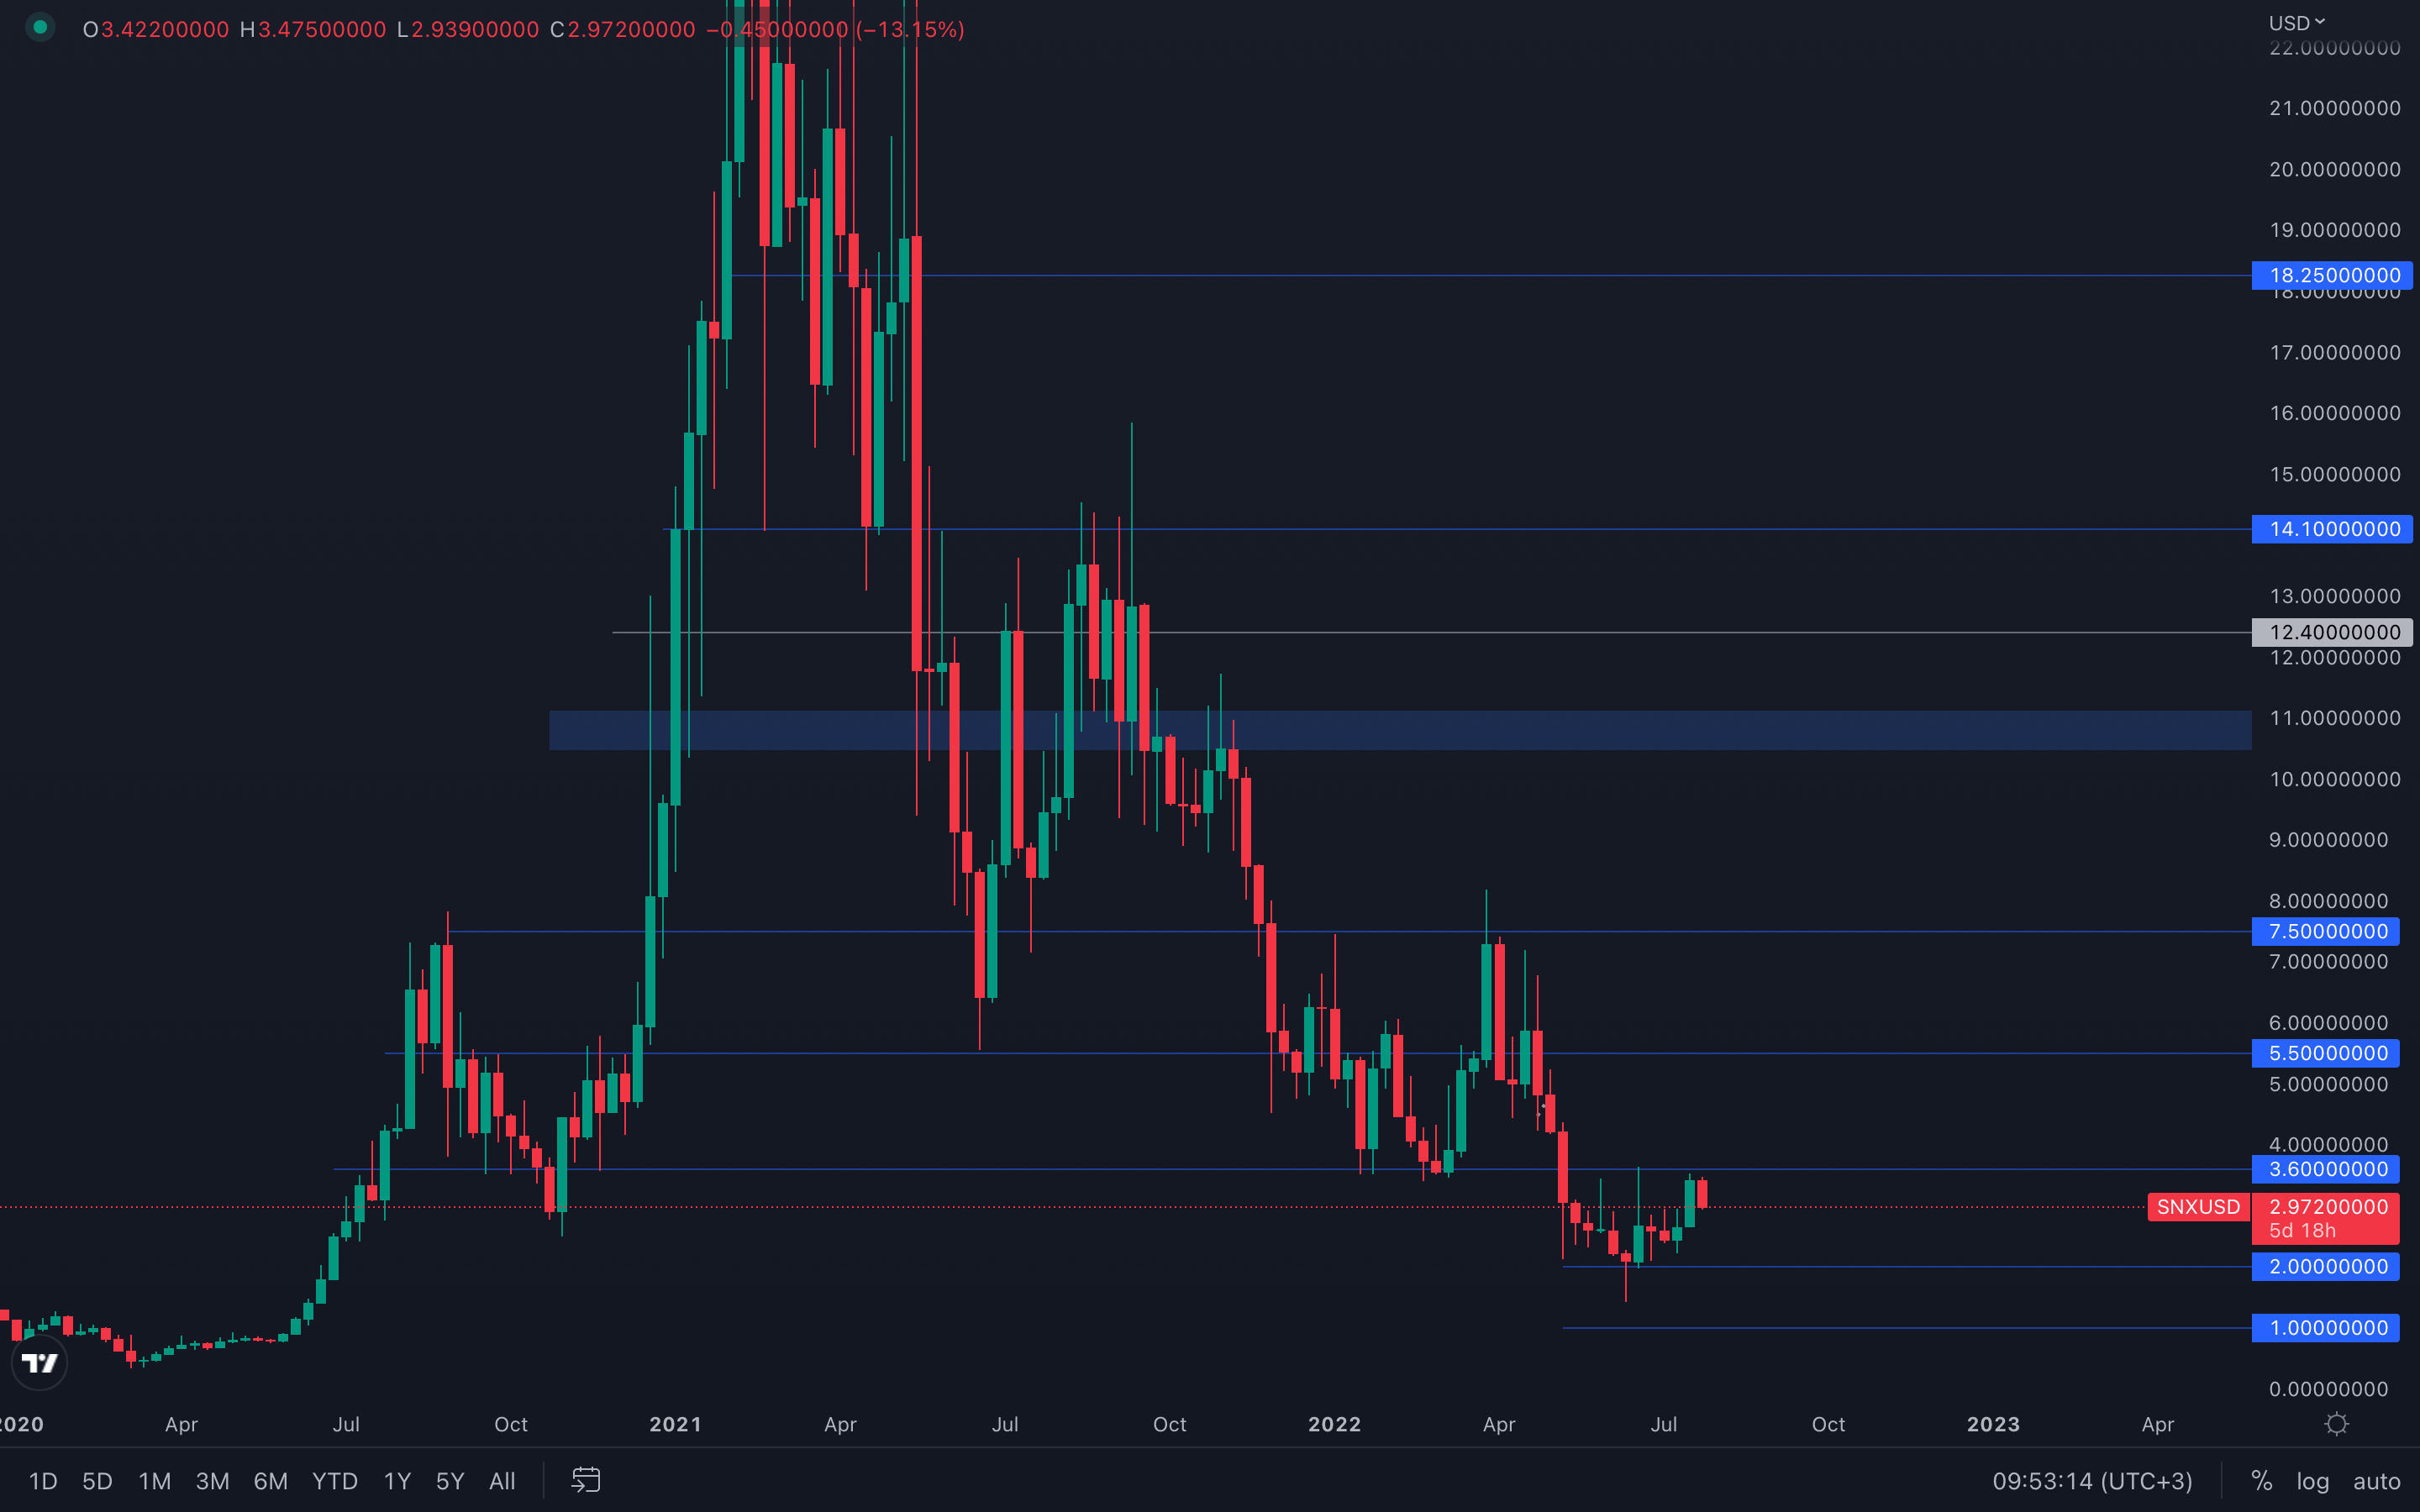 SNX successfully managed to test its $3,6 resistance level, a level which we were expecting since last week. As for what comes next, SNX has registered a bearish engulfing candle on the daily timeframe, a full-bodied candle closure which implies sellers are at an extreme point and can quickly bring price down to the nearest support level, $2.
RUNE
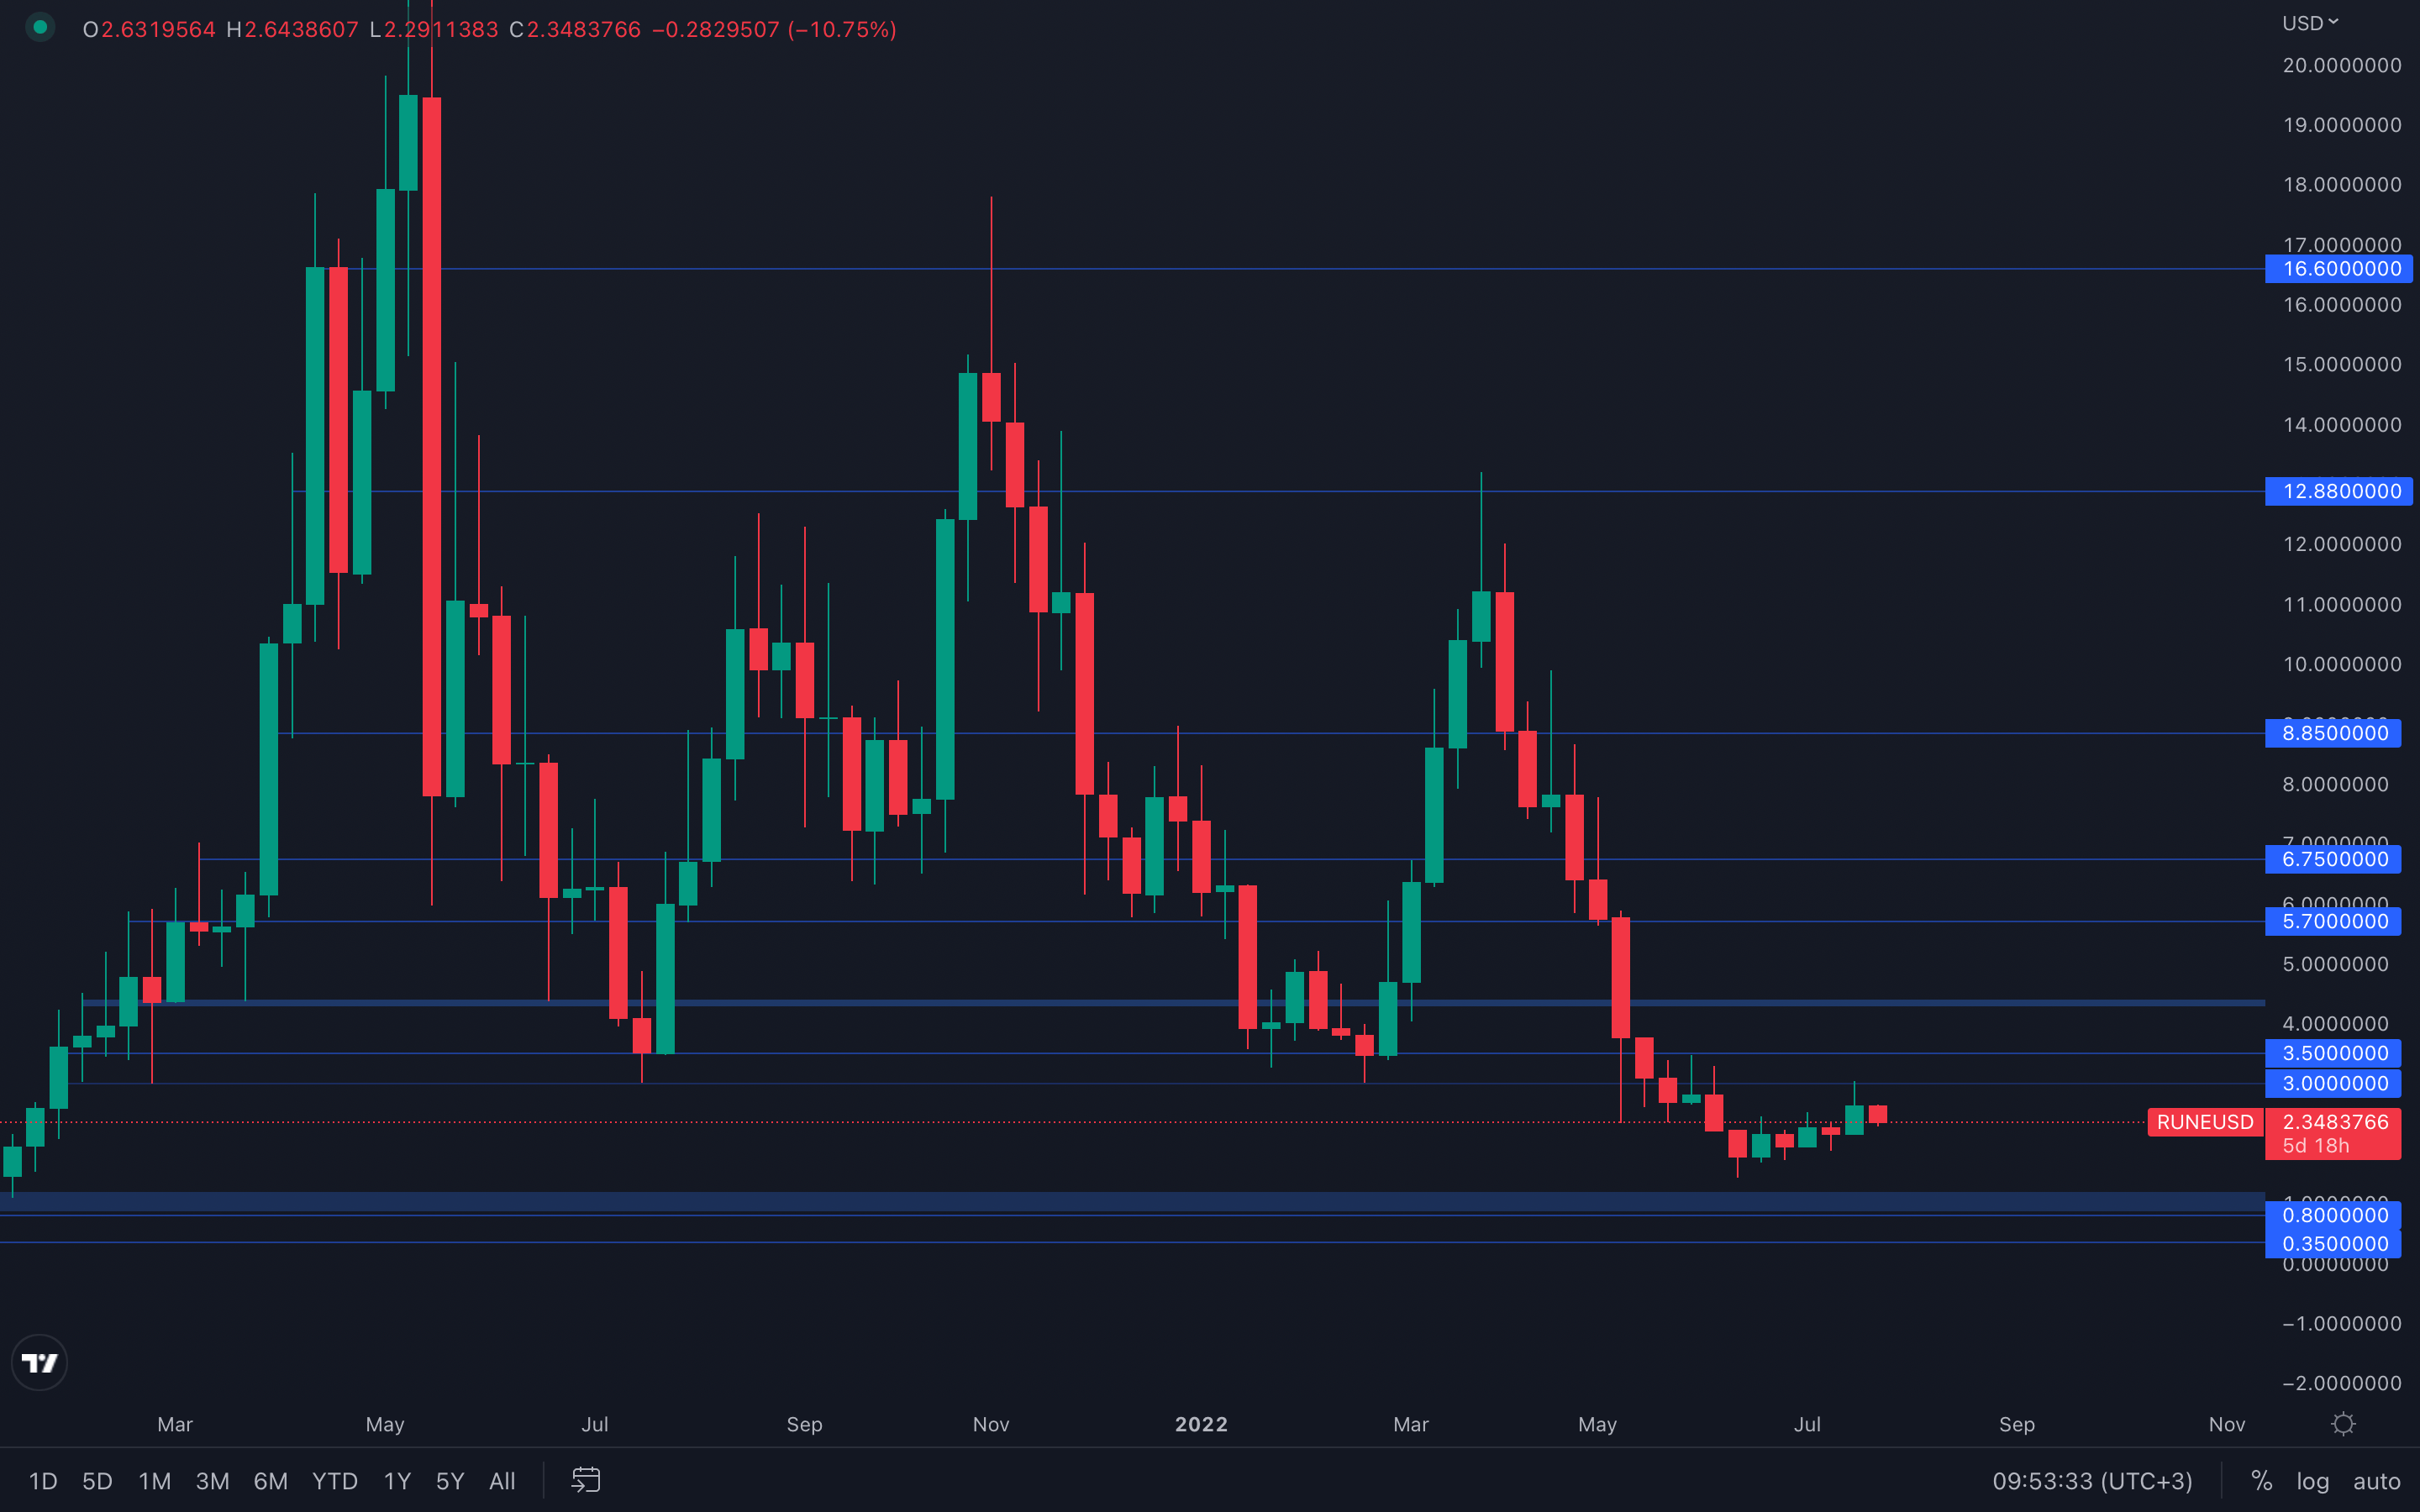 The constant trend in RUNE's price action continues, with RUNE finally testing its $3 level. Unless RUNE closes a weekly candle under $2,15, which is the open of last week's candle, no further downside can occur and RUNE will continue its uptrend towards higher levels.
SOL
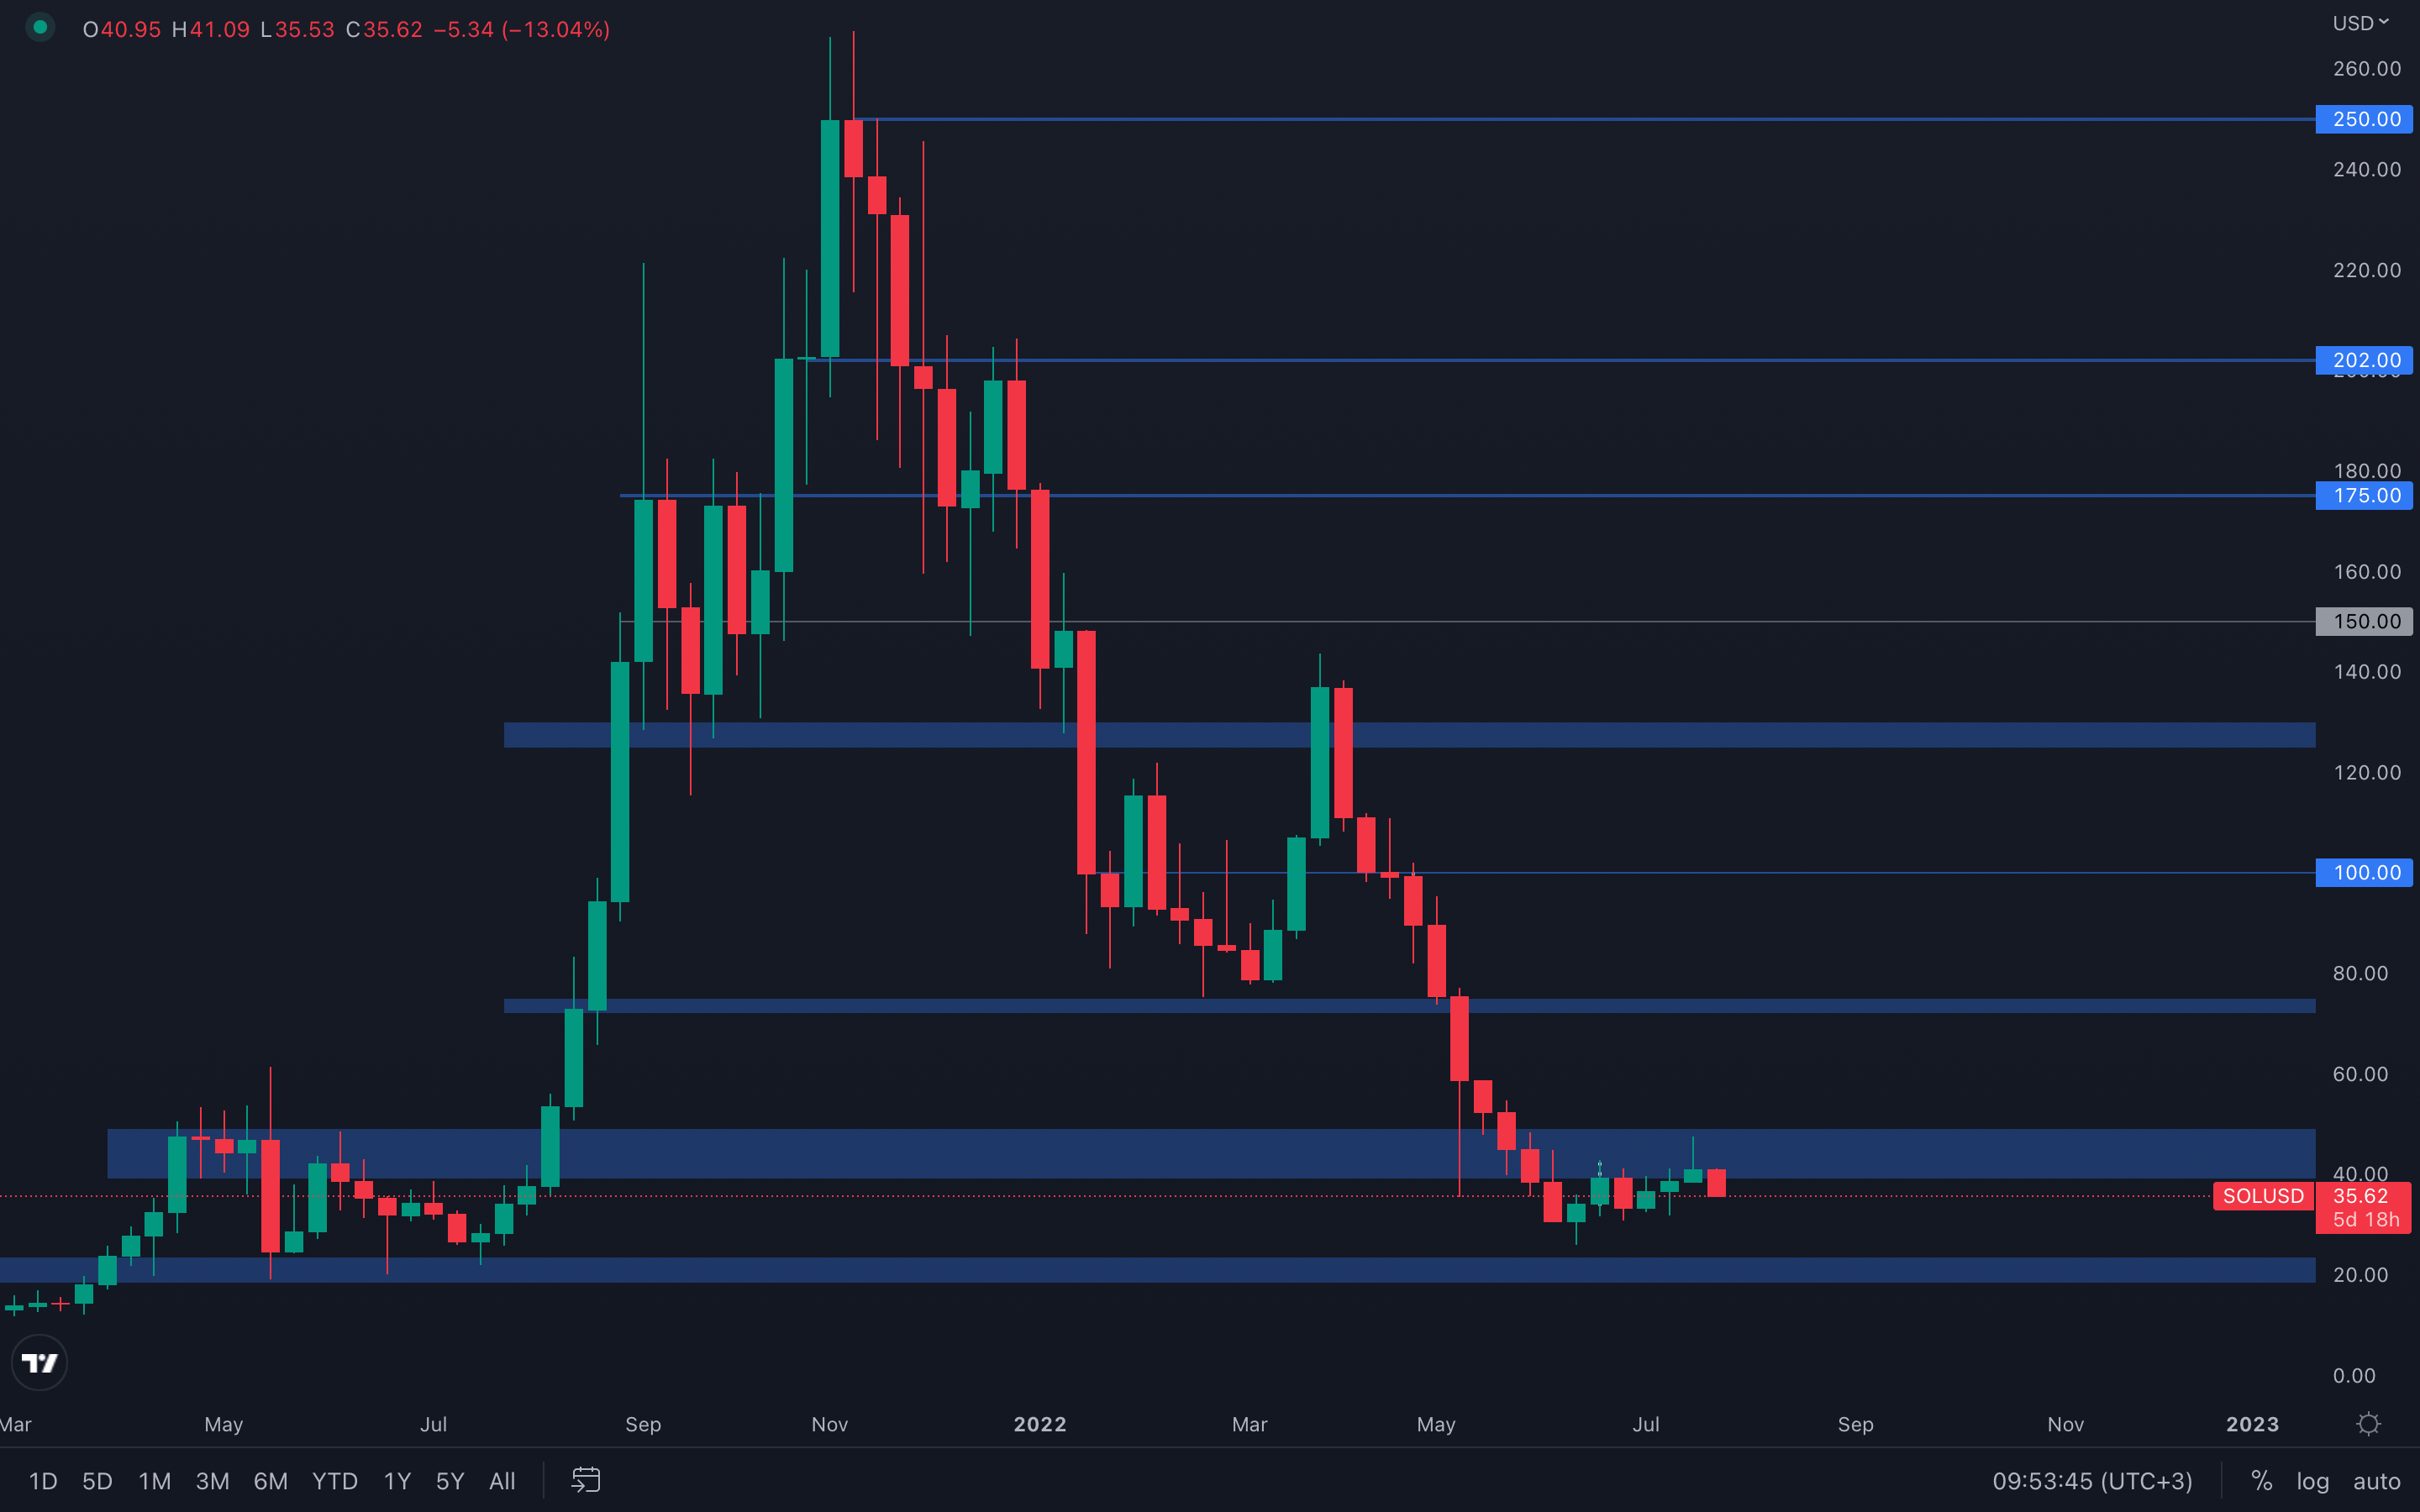 As mentioned last week, if SOL closed a weekly candle above $40, then a slight change in market structure could occur. That happened, and SOL is now trading in a bullish market structure on the daily timeframe. However, due to the lack of volume that SOL has been experiencing for some time, this change in market structure can be invalidated in an instant, as there's still no actual demand for prices to continue rising.
SRM
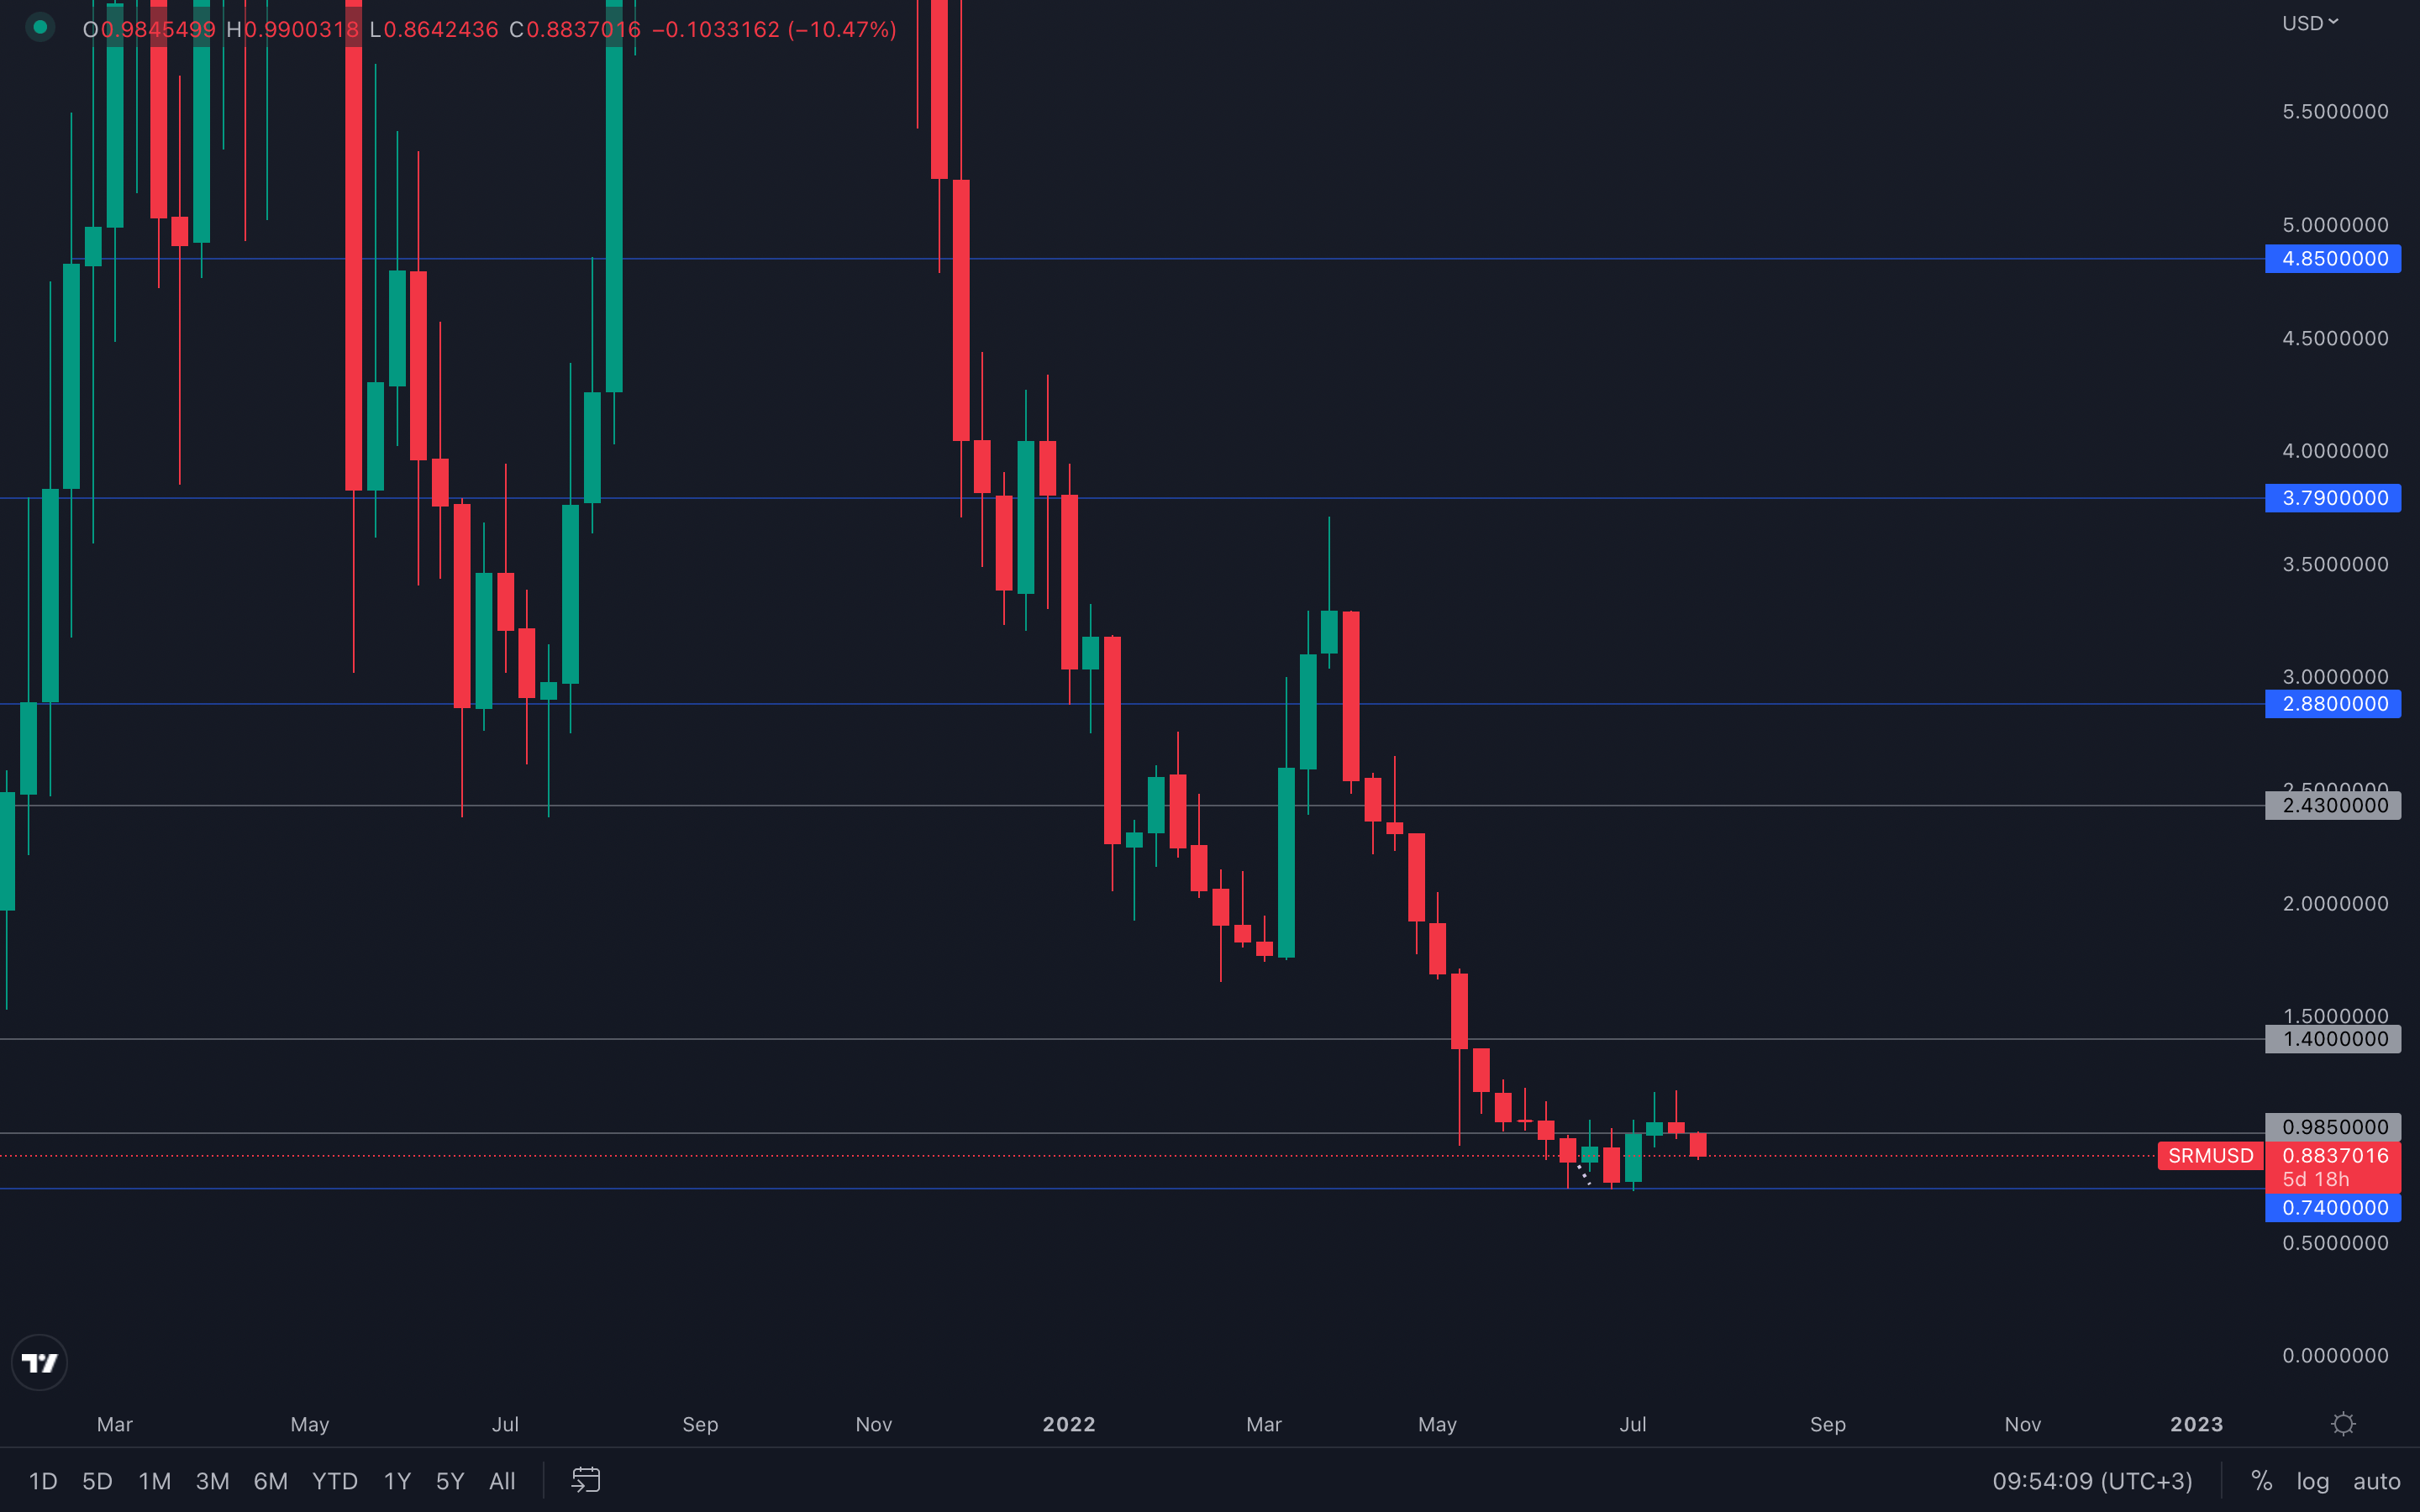 Clear rejection from SRM's psychological level of $1, which suggests its price is now heading for the nearest support level, $0,74.
FTT
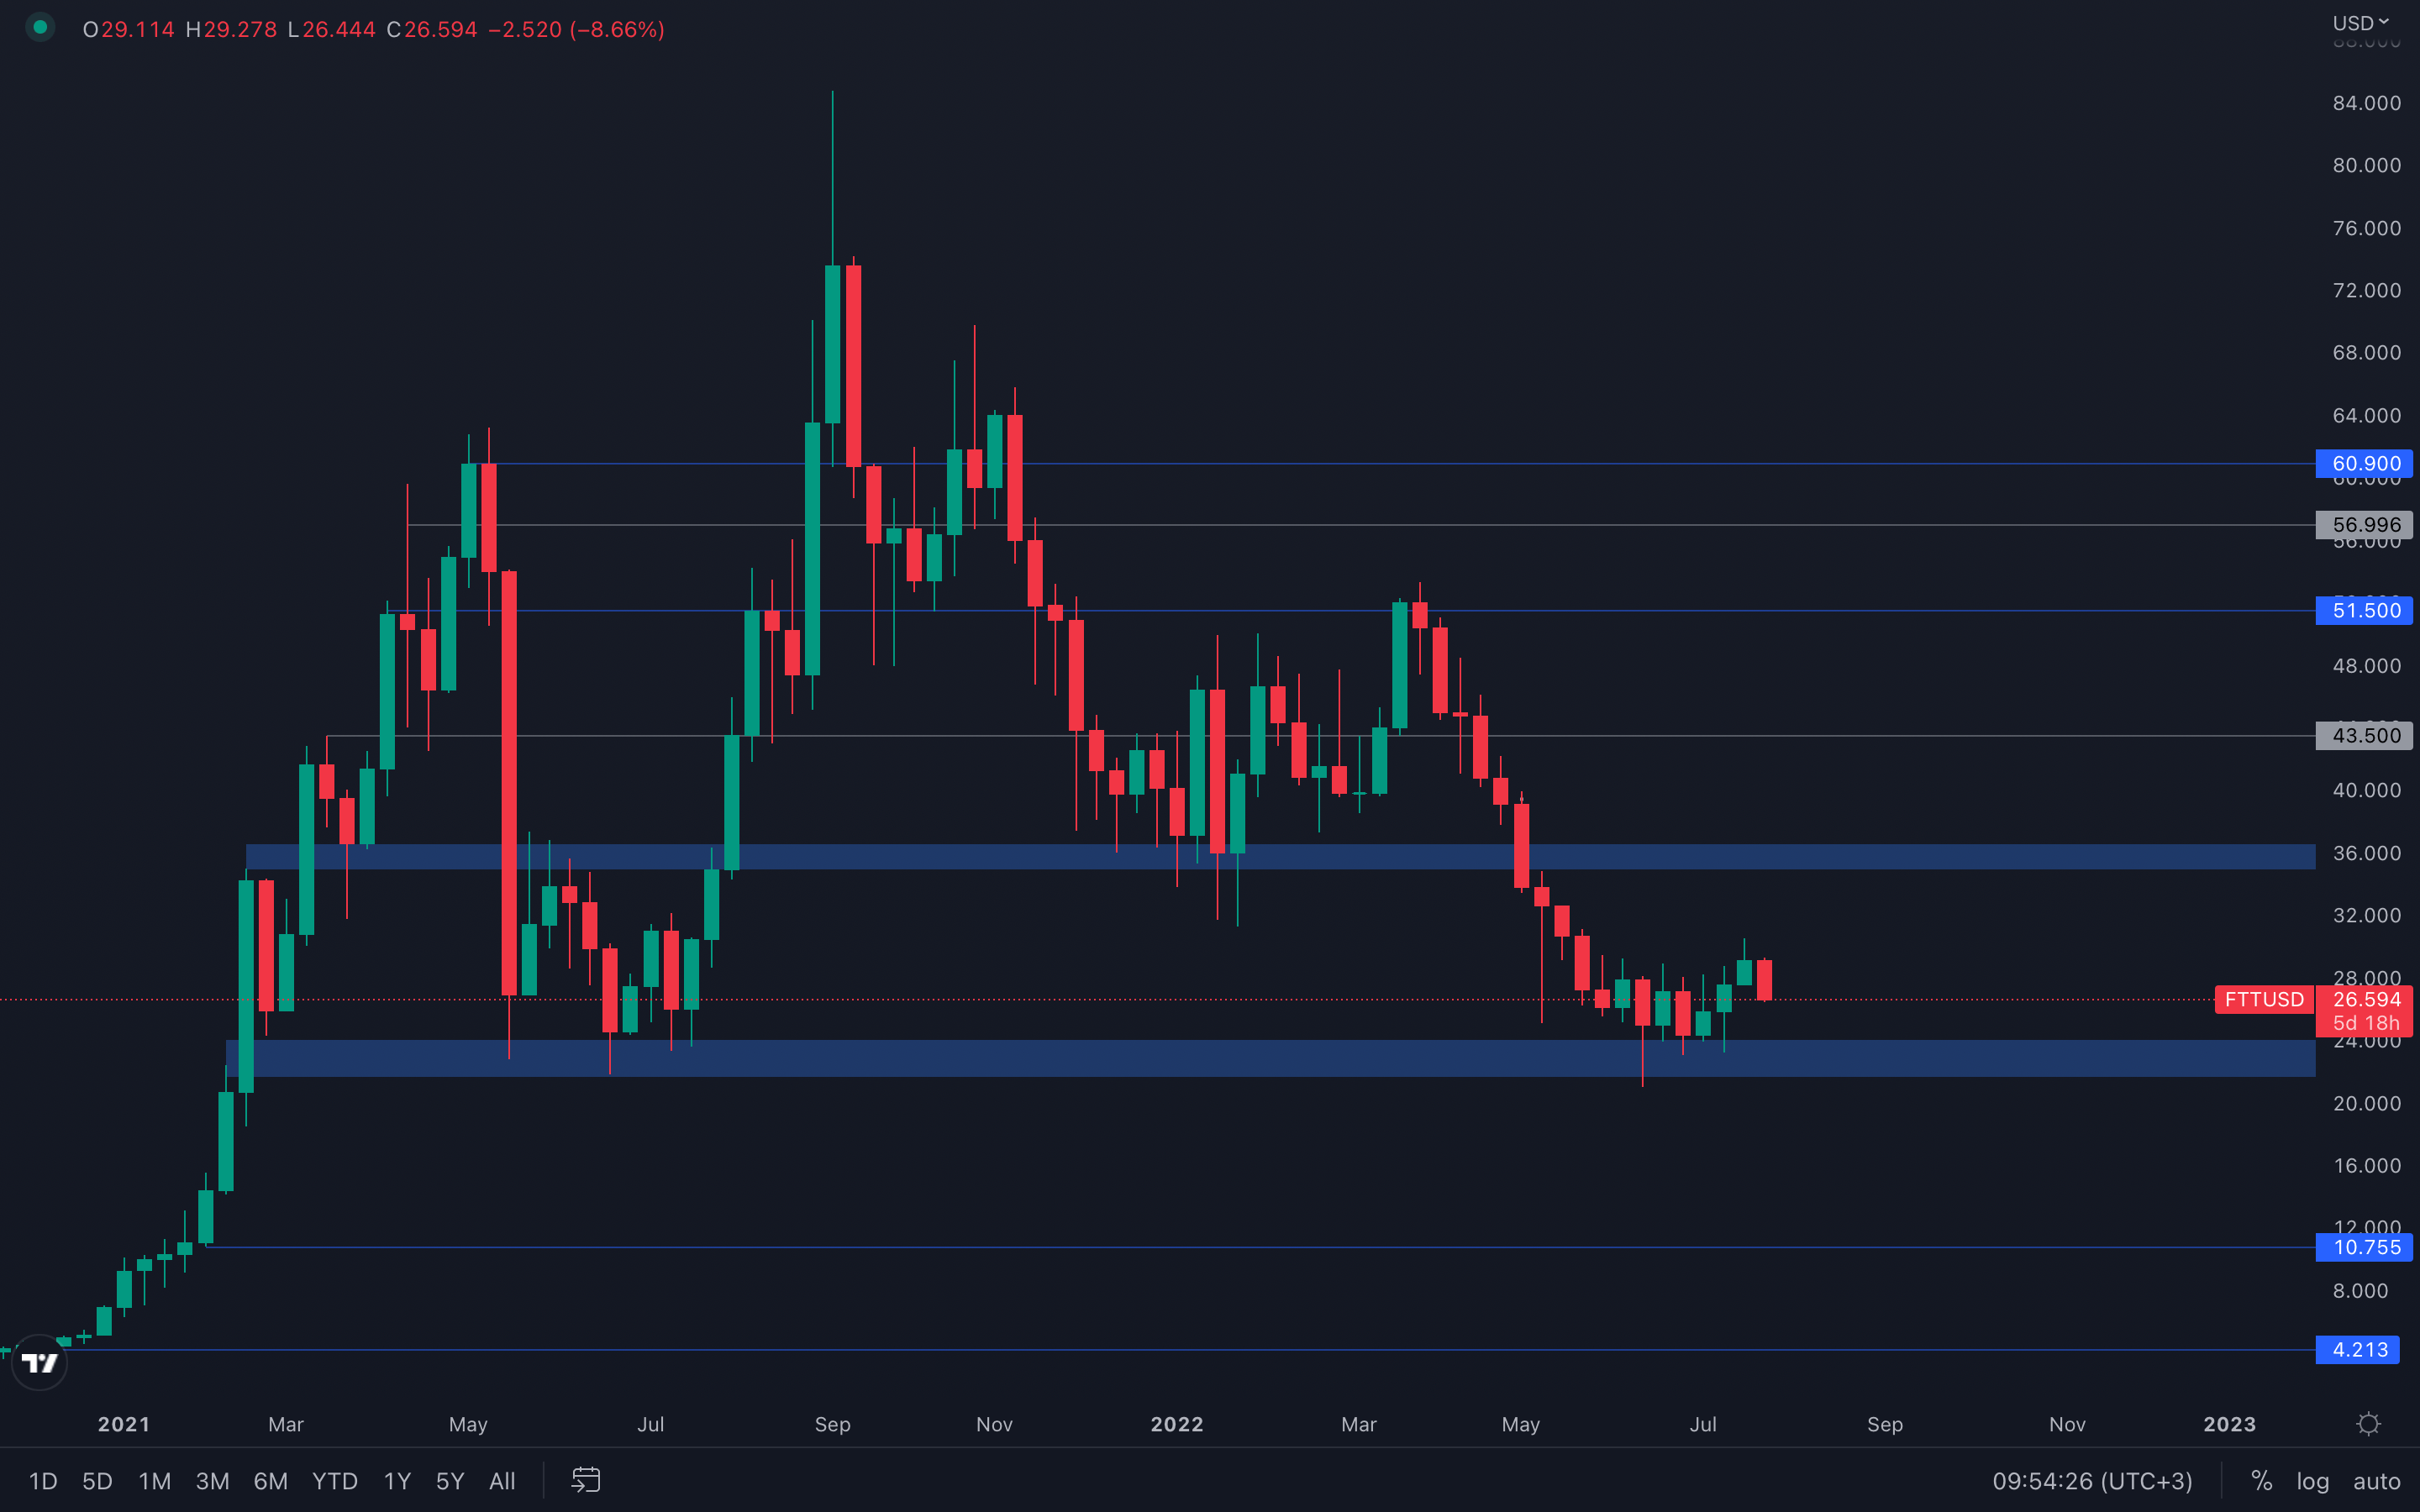 We mentioned a local resistance level around the $30 level, not only because it acts as the middle of the well-known range of $35 - $21,5. but also because it acted as resistance multiple times in the past. With that said, FTT is currently forming a bearish engulfing candle on the weekly timeframe, which if successfully closed as so, can lead to a $24 test faster than expected.
MINA
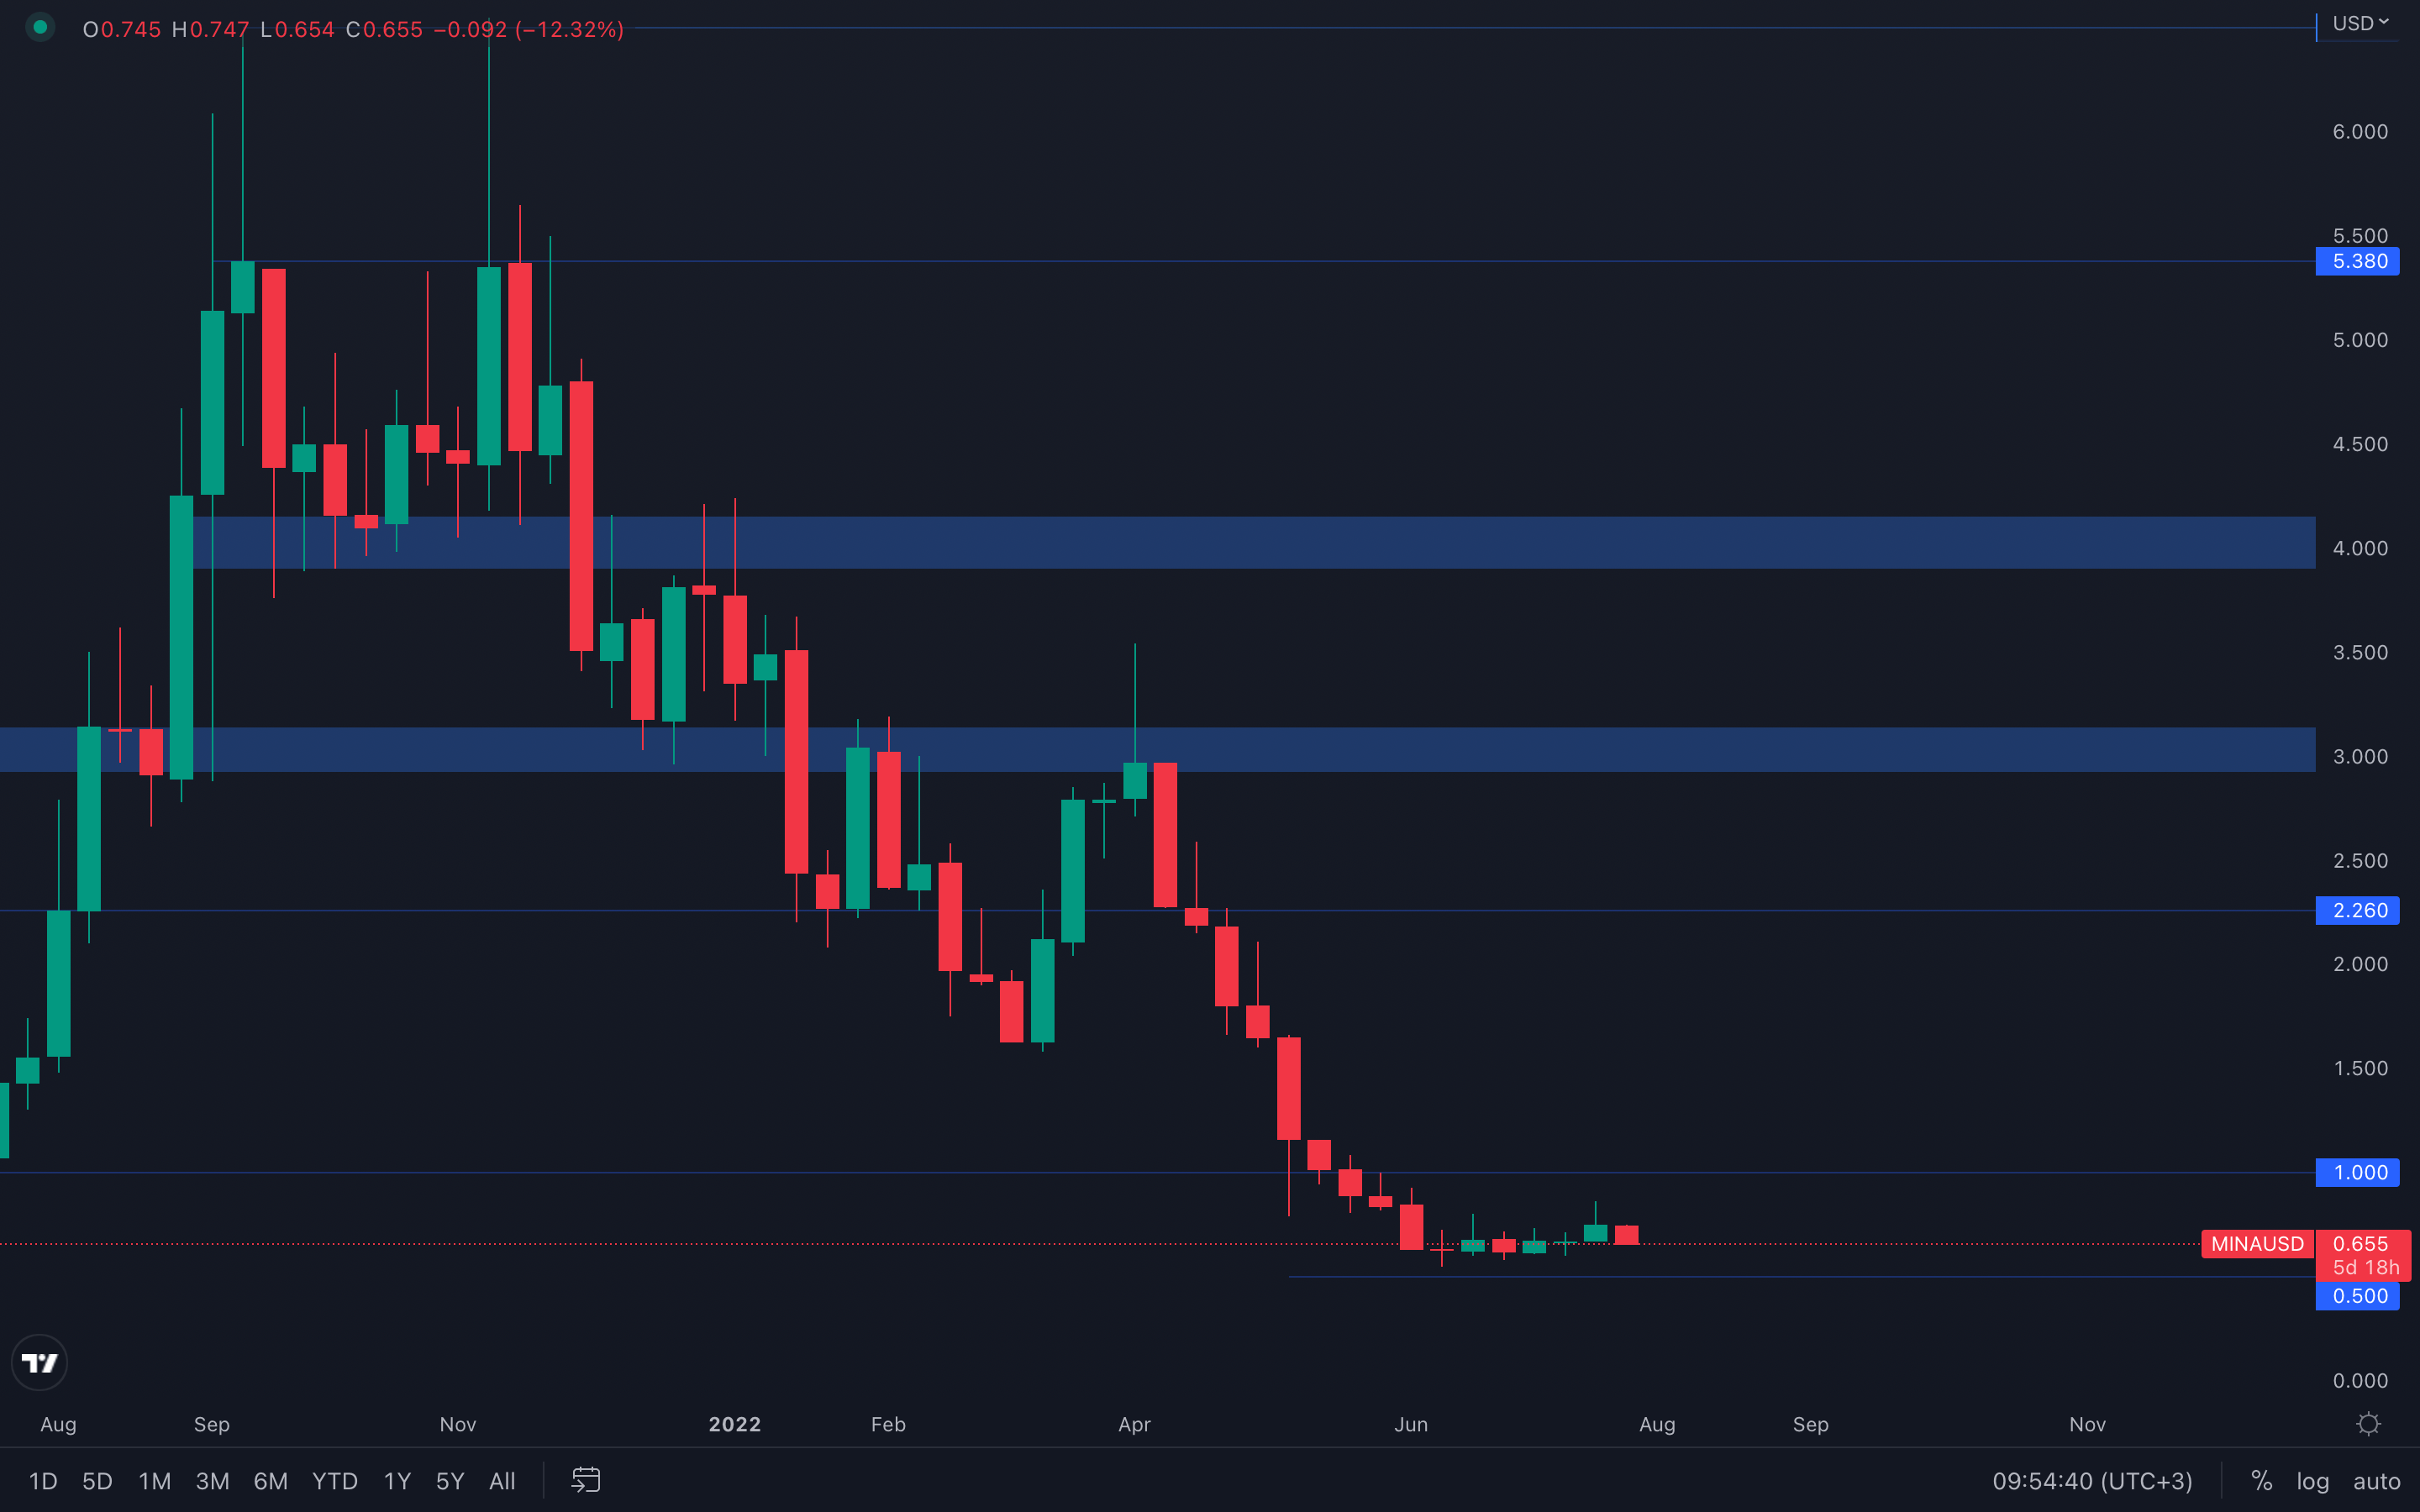 There's no actual direction to be determined for MINA - its indecisiveness continues to rule, with low-volumed candles formed week after week. However, one thing many might appreciate about MINA's price action is its volatility. Even though there's barely any real volume compared to previous times, there still are 15%+ candles, perfect opportunities for fellow traders. Until either $1 or $0,5 are broken, expect further ranging.
dYdX
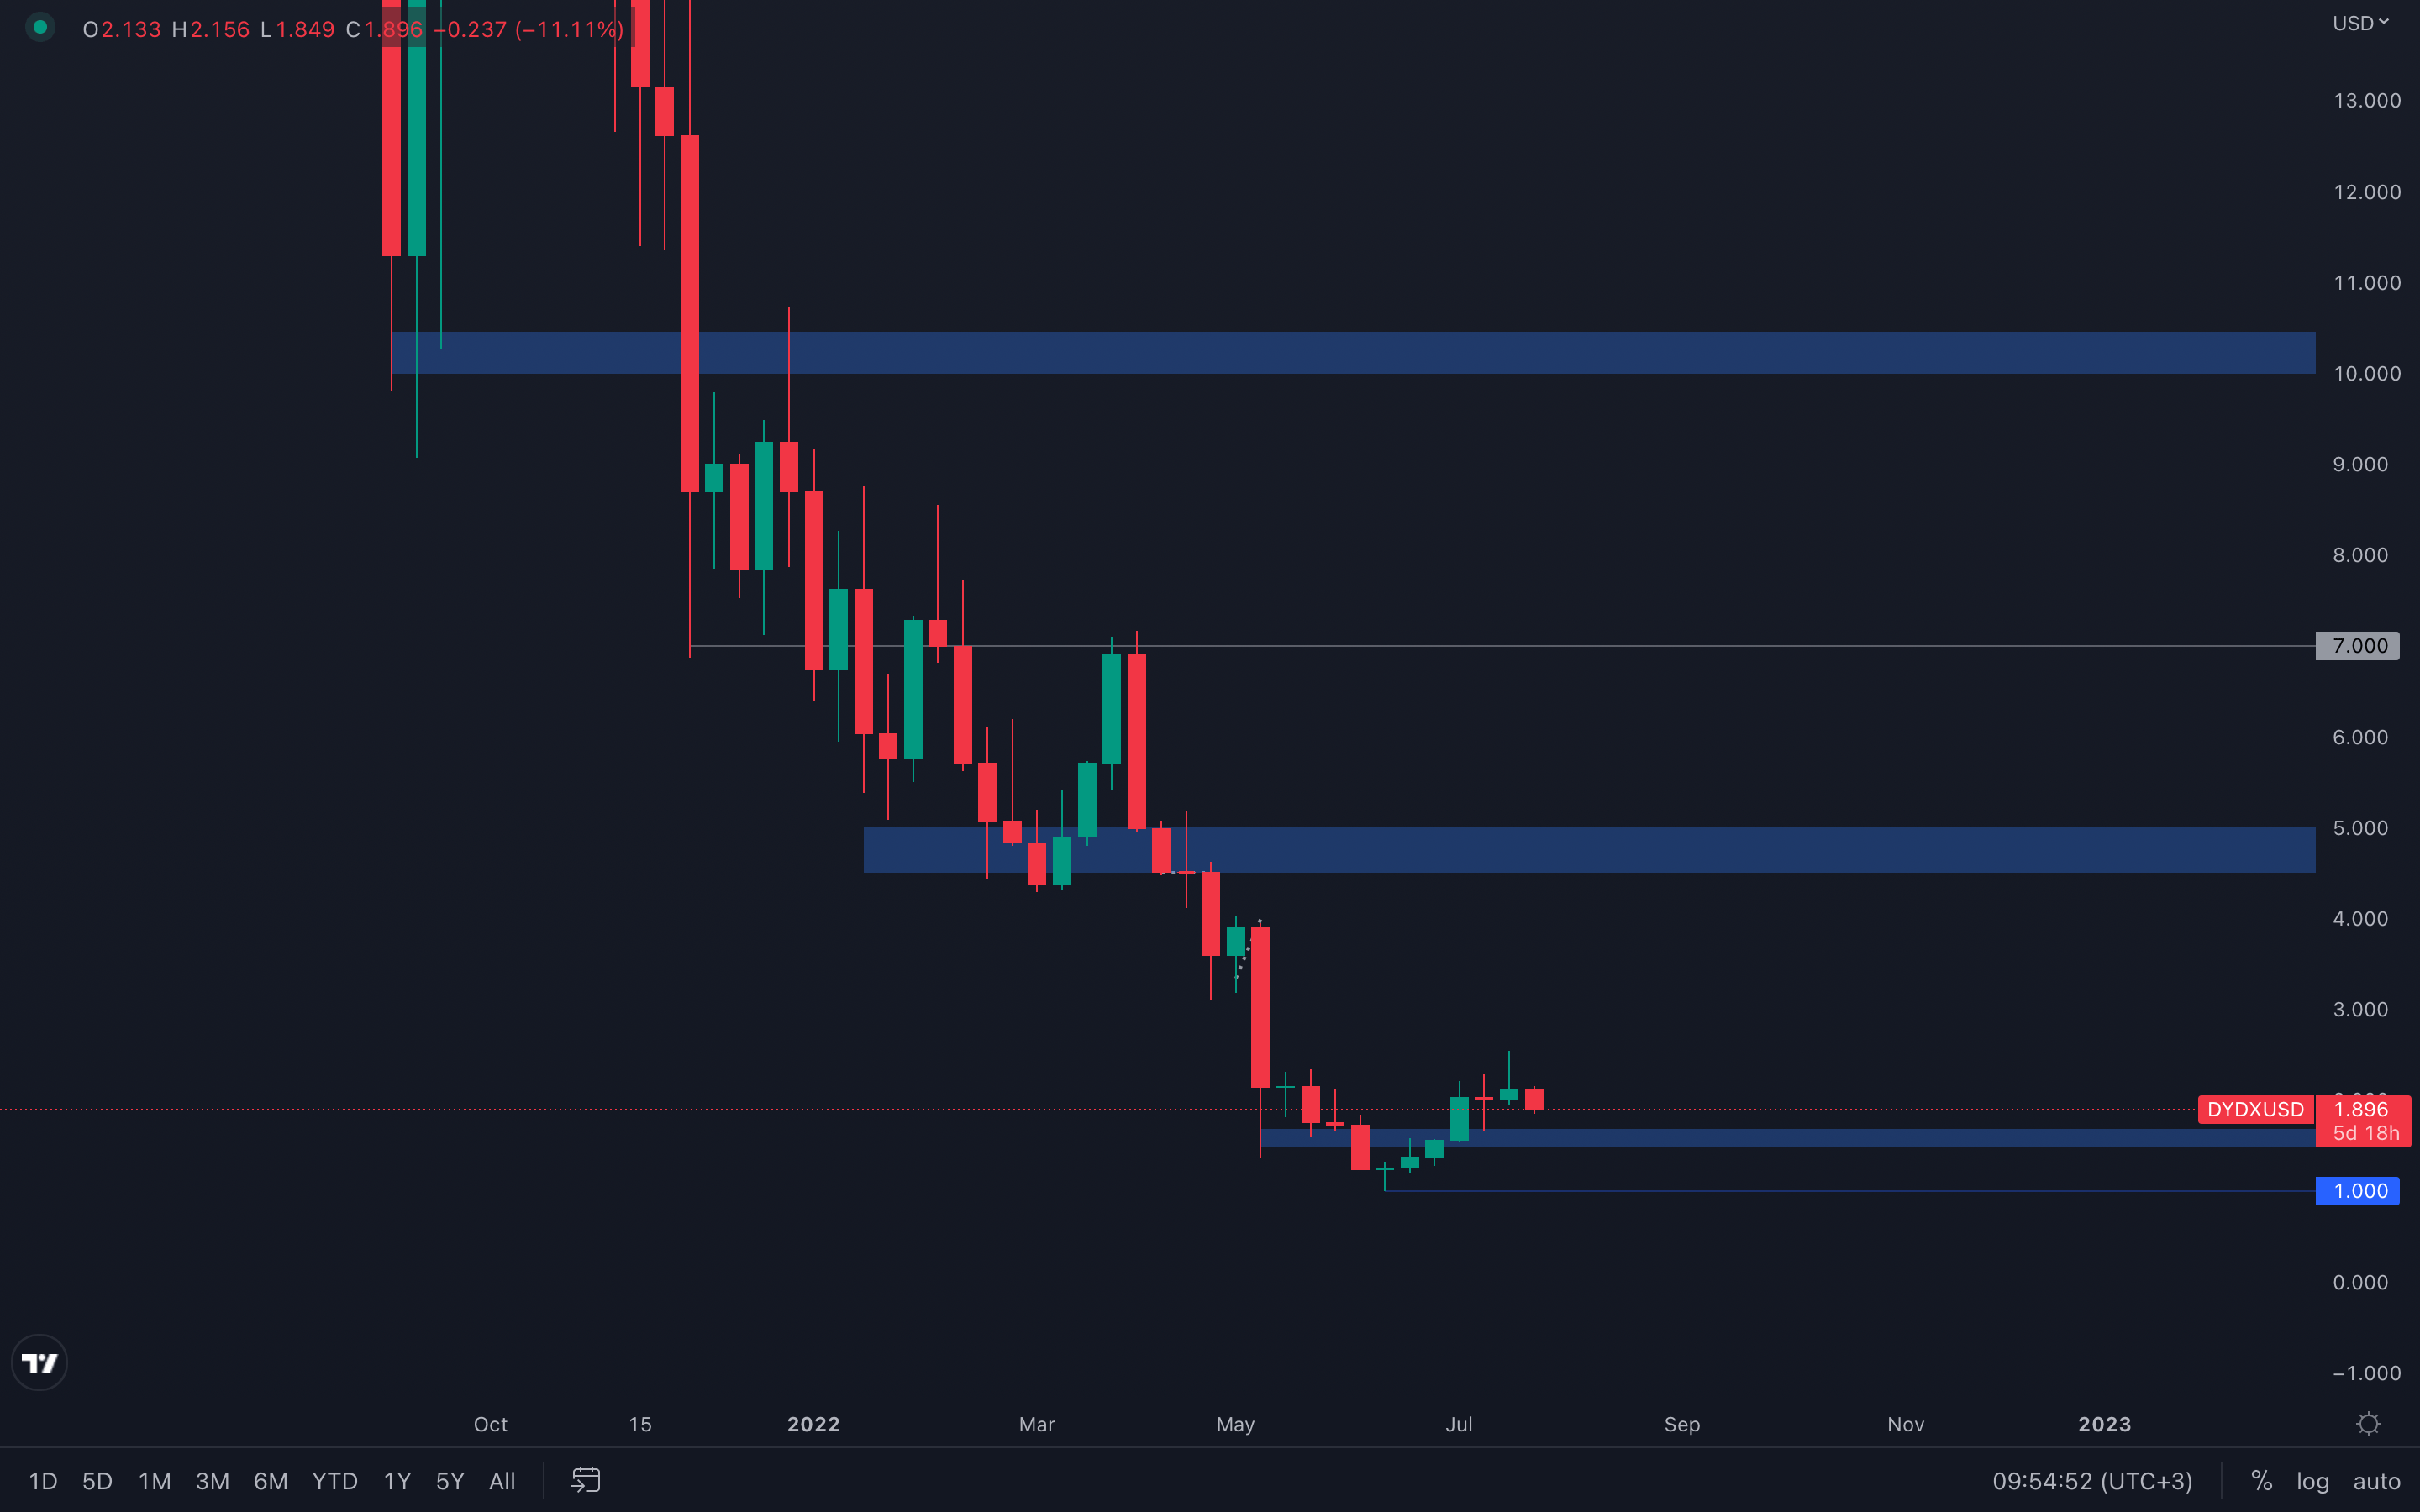 Expected price action, as dYdX has been an outperformer in the last few weeks and is now experiencing a slowdown. After breaking above its $1,5 - $1,6 resistance area a few weeks back, dYdX is now aiming for a retest towards that same area, which if successfully held, can lead to a higher low formed on the weekly timeframe, the start of a potential change in market structure. For this week and probably even the next one, expect dYdX to retest its $1,5 - $1,6 key area, which has been flipped from resistance into support.


