Save 23% ($351) & Get a Free 1-1 Call with our Team ⏰ : 0d 2h 59m 44s

Disclaimer: Not financial nor investment advice. You are responsible for any capital-related decisions you make, and only you are accountable for the results.
Macro
In this past week, some key inflation data was released which surprised me to the downside. Headline inflation came in at 8.5% (8.7% was the consensus and 9.1% was the prior month), and core inflation came in at 5.9% (6.1% was the consensus and 5.9%) prior. This is the first time we have seen inflation data come in and surprise to the downside, with most of the prints in the last 12 months coming in higher than expected.The main driver for this fall in inflation is due to oil and gas prices coming down. However, the charts suggest that inflation is broad-based, meaning some parts such as shelter and wages will be difficult to bring back down. Assuming energy prices stay lower for the next few months, it may be possible to see inflation come down to the 7-8% range.
If inflation does stay low, this may encourage the FED to not be so aggressive in their rate rises, however, they’ll be very careful not to repeat a policy mistake made in the ’70s when they raised rates to combat inflation before cutting them too early and then had to re-raise them again.
Total Market Cap
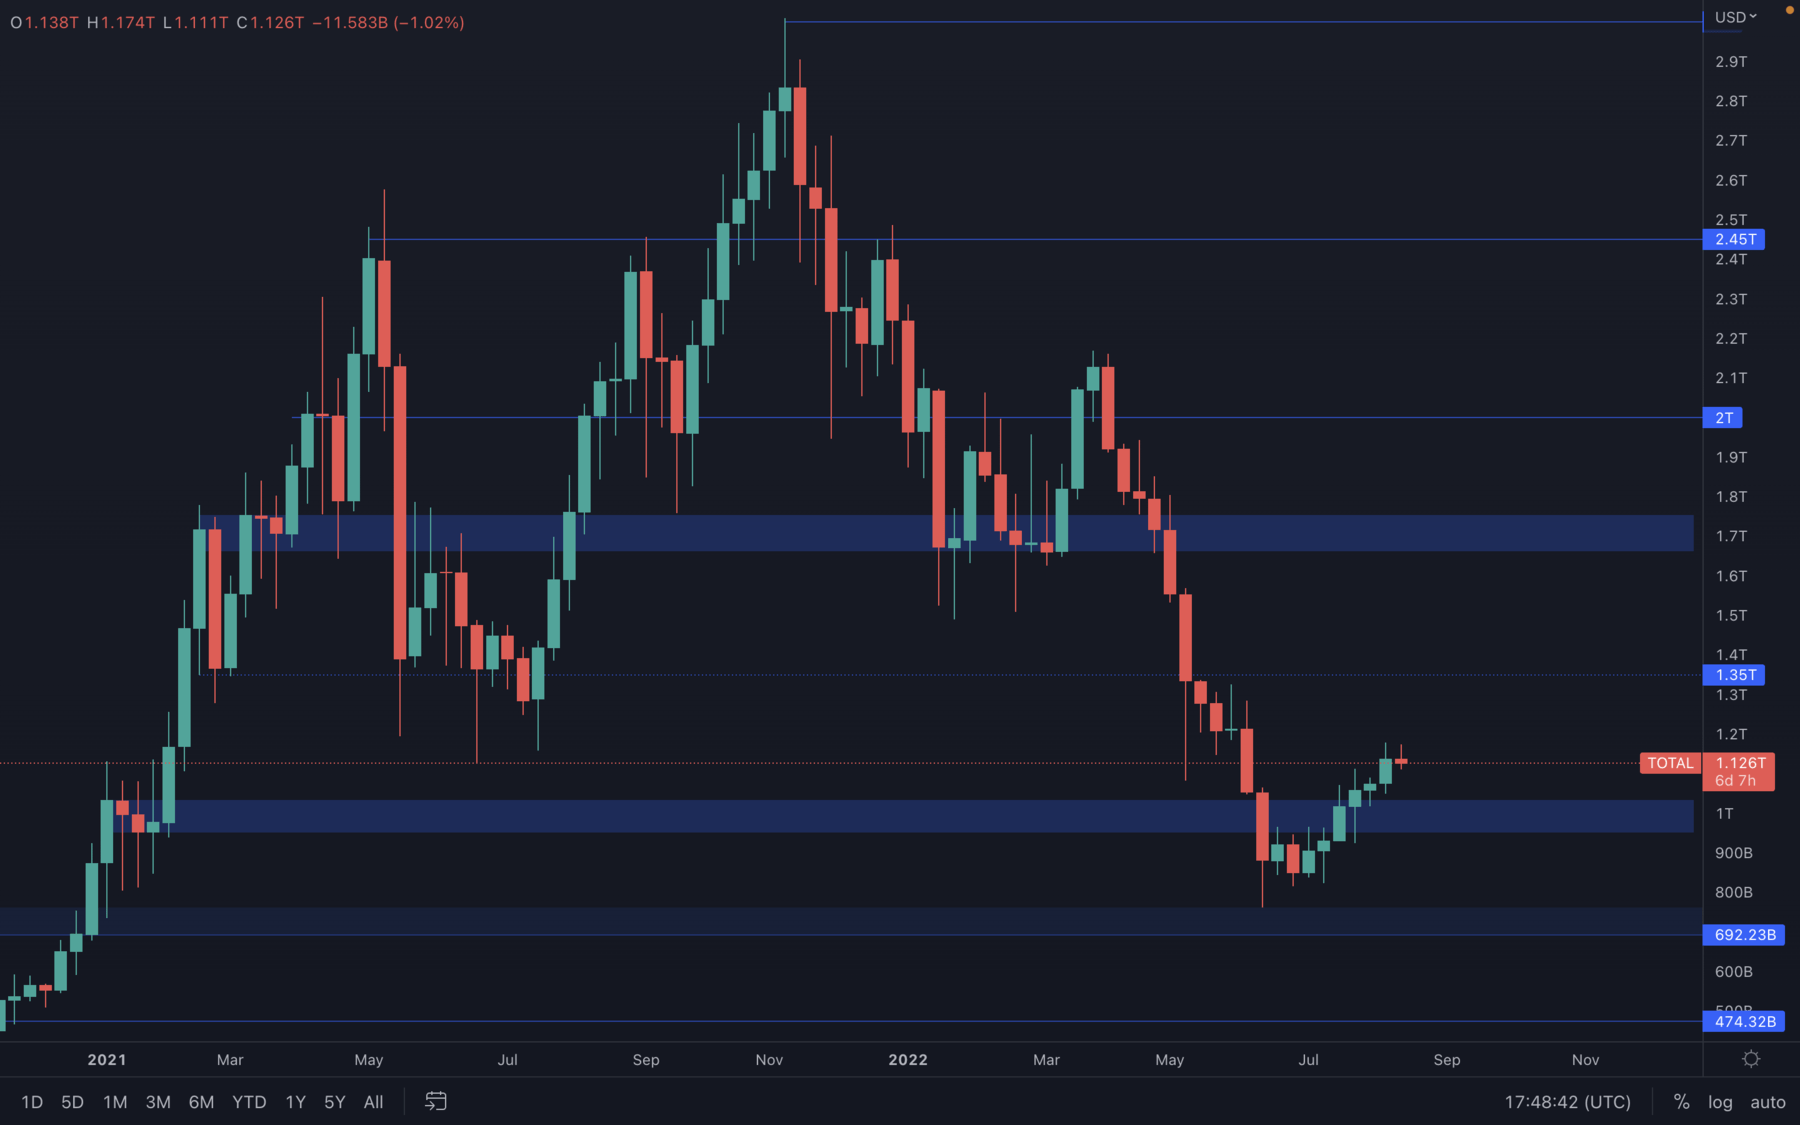 There have been no signs of a potential change of pace for the Total Market Cap Index, but at some point, it's clear that a $1T retest is essential in order to confirm further upside. Unless the $1T level is lost, then $1.35T remains on the cards.
Altcoins Market Cap
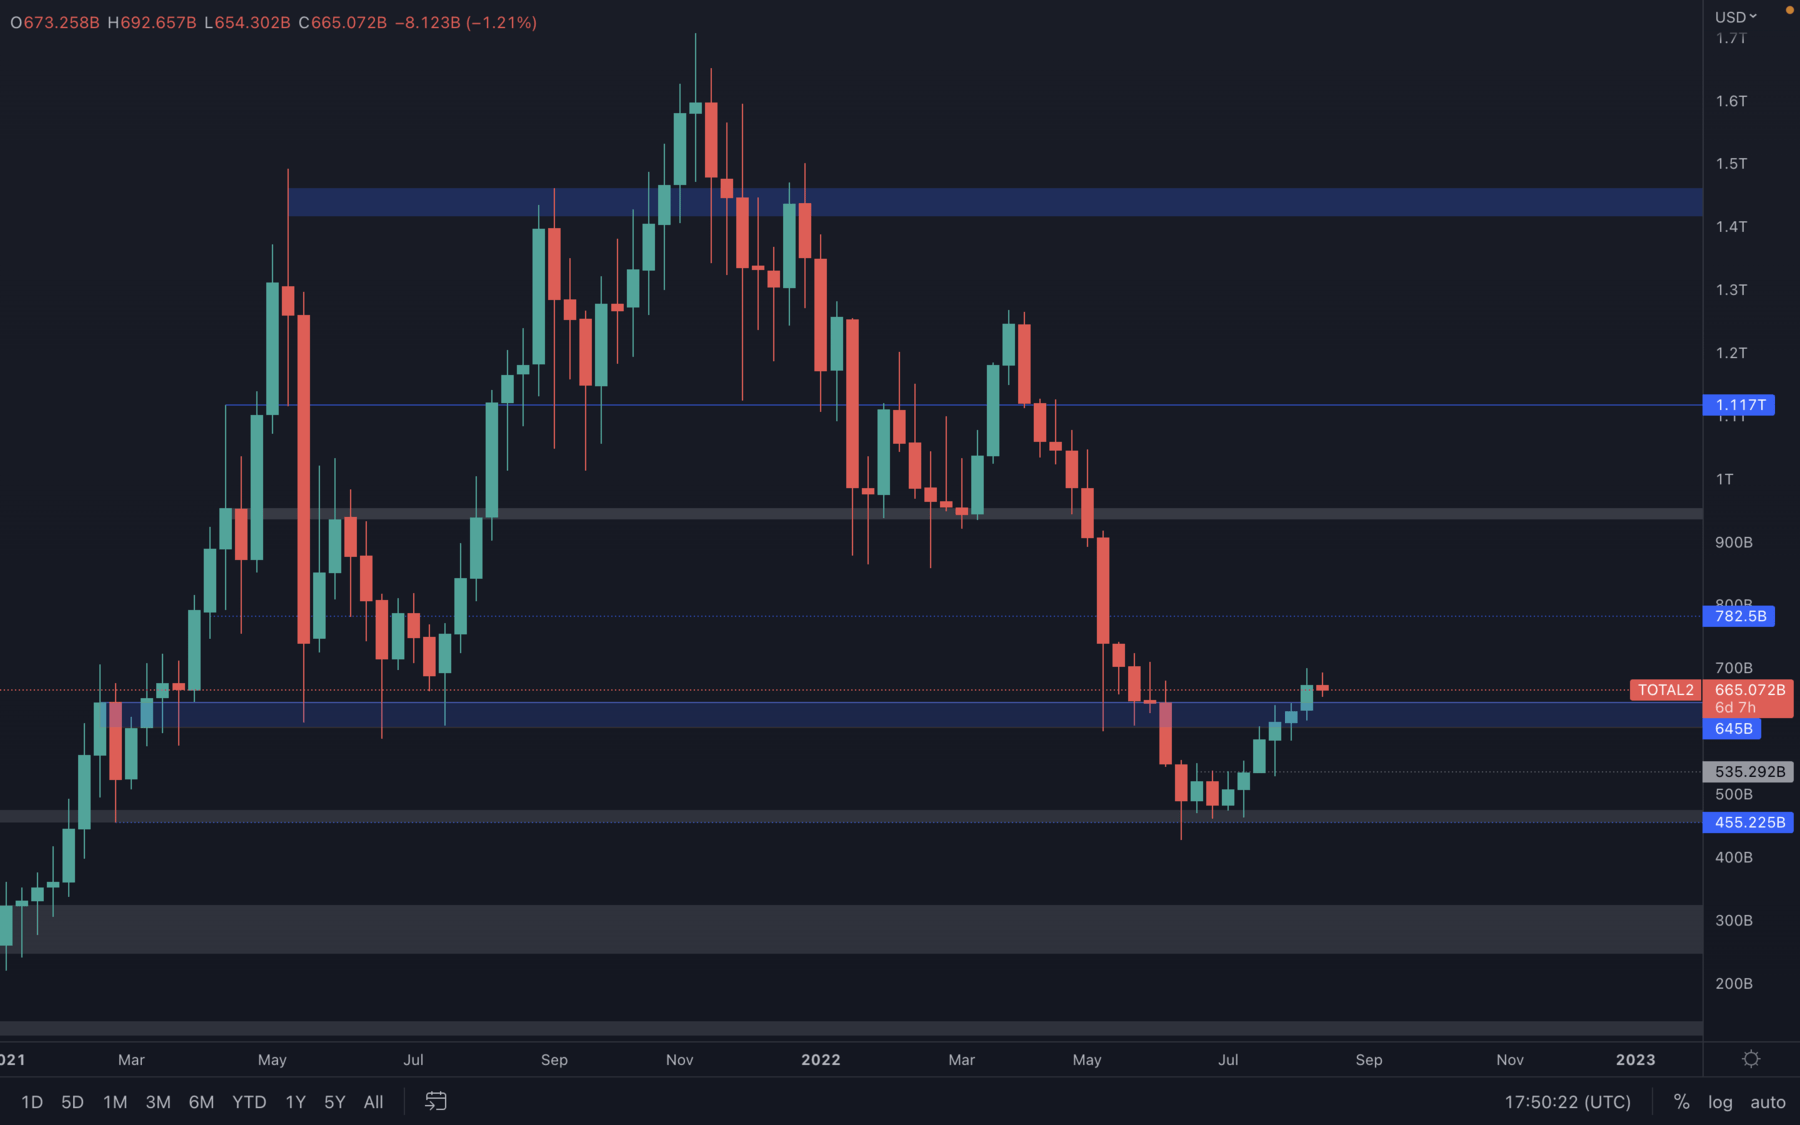 The Altcoins Market Cap experienced a strong push from its $645B - $600B support area and is currently aiming for $782.5B - however, this move might get short-lived due to Bitcoin approaching resistance and the S&P 500 Index (which we know is in a strong correlation with the crypto market) is already at resistance. Unless $600B is lost, then $782.5B still remains on the cards.
Bitcoin - Technical & On-Chain Analysis
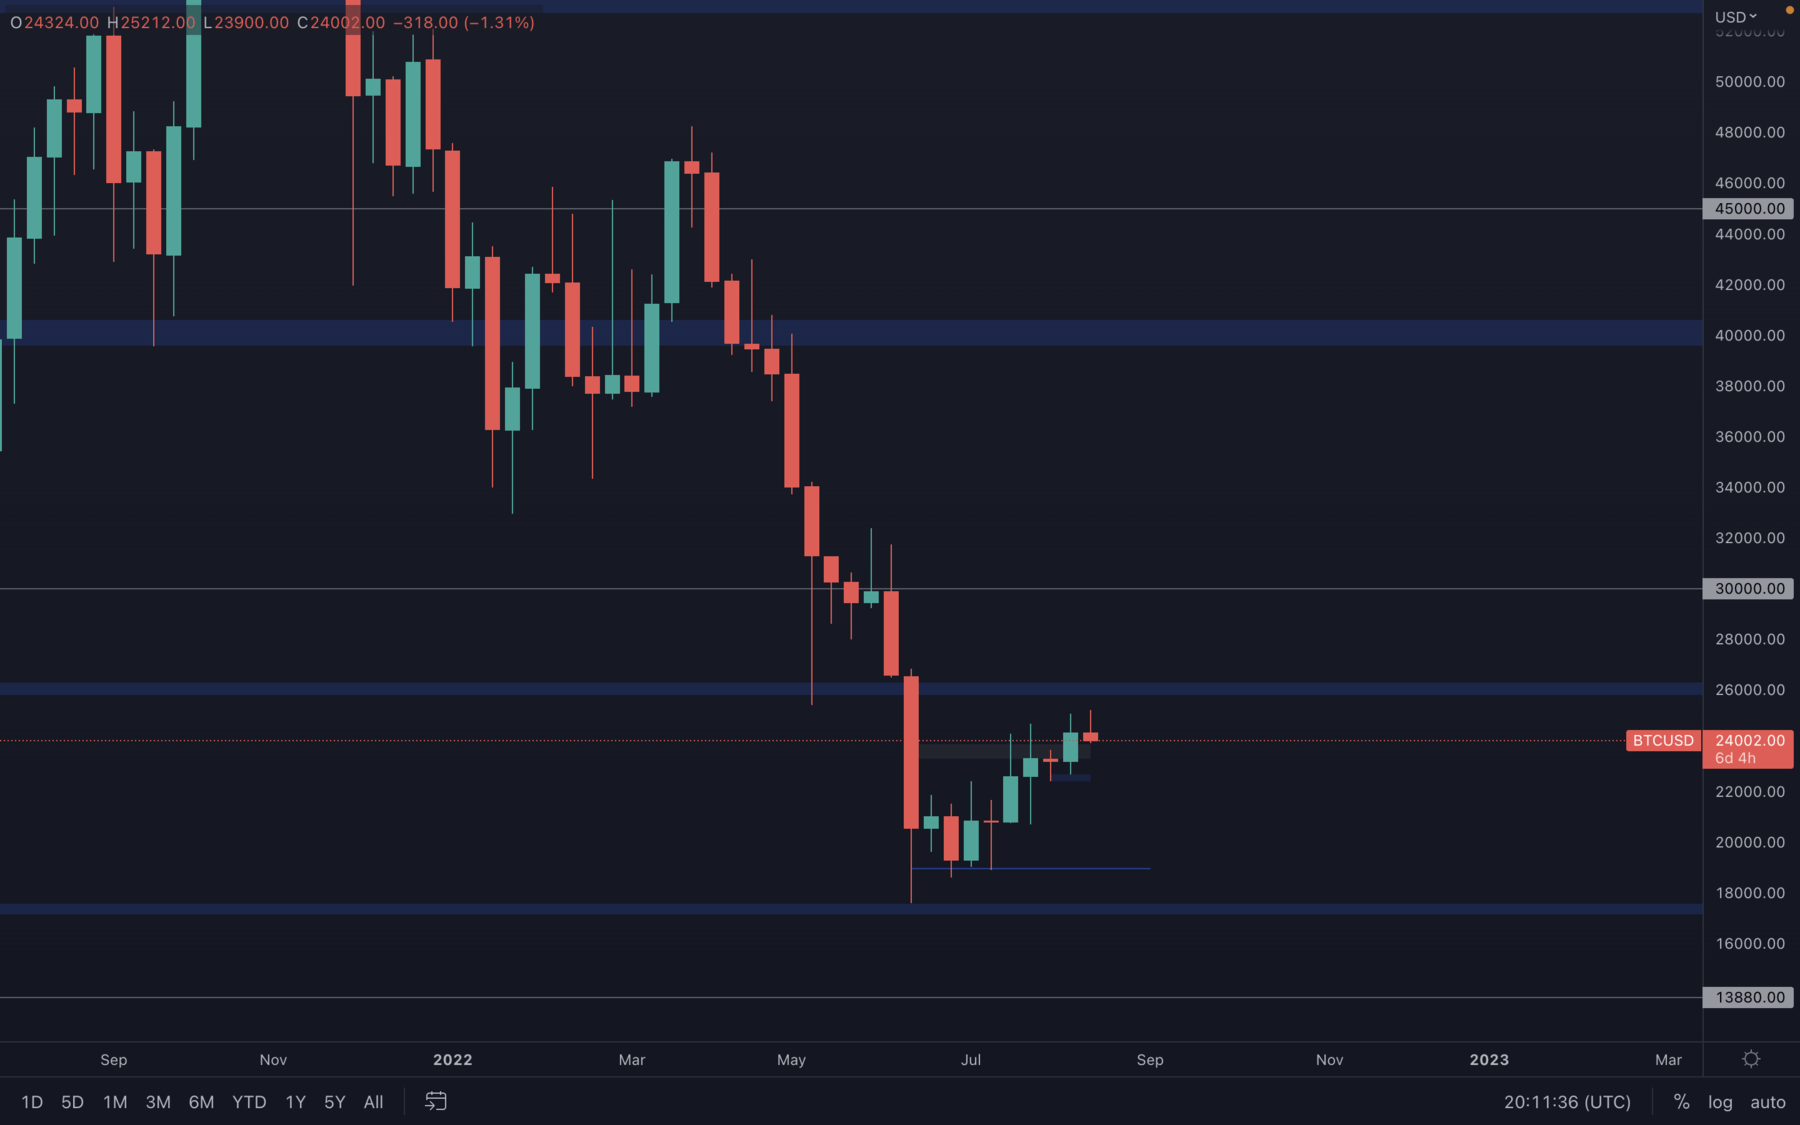 Last week, Bitcoin has closed an even higher candle than before, which might suggest that buyers are still in control. With that said, a $26,000 test remains on the cards until proven otherwise. With the data we collected from the S&P 500 Index, the move towards $26,000 might be short-lived and will most likely mark a lower high on the weekly timeframe.
As always, caution must be advised. Even though a move towards $26,000 is still possible, it can be invalidated by a bad-performing S&P 500 Index.
Metric 1 – Realised Price By Address
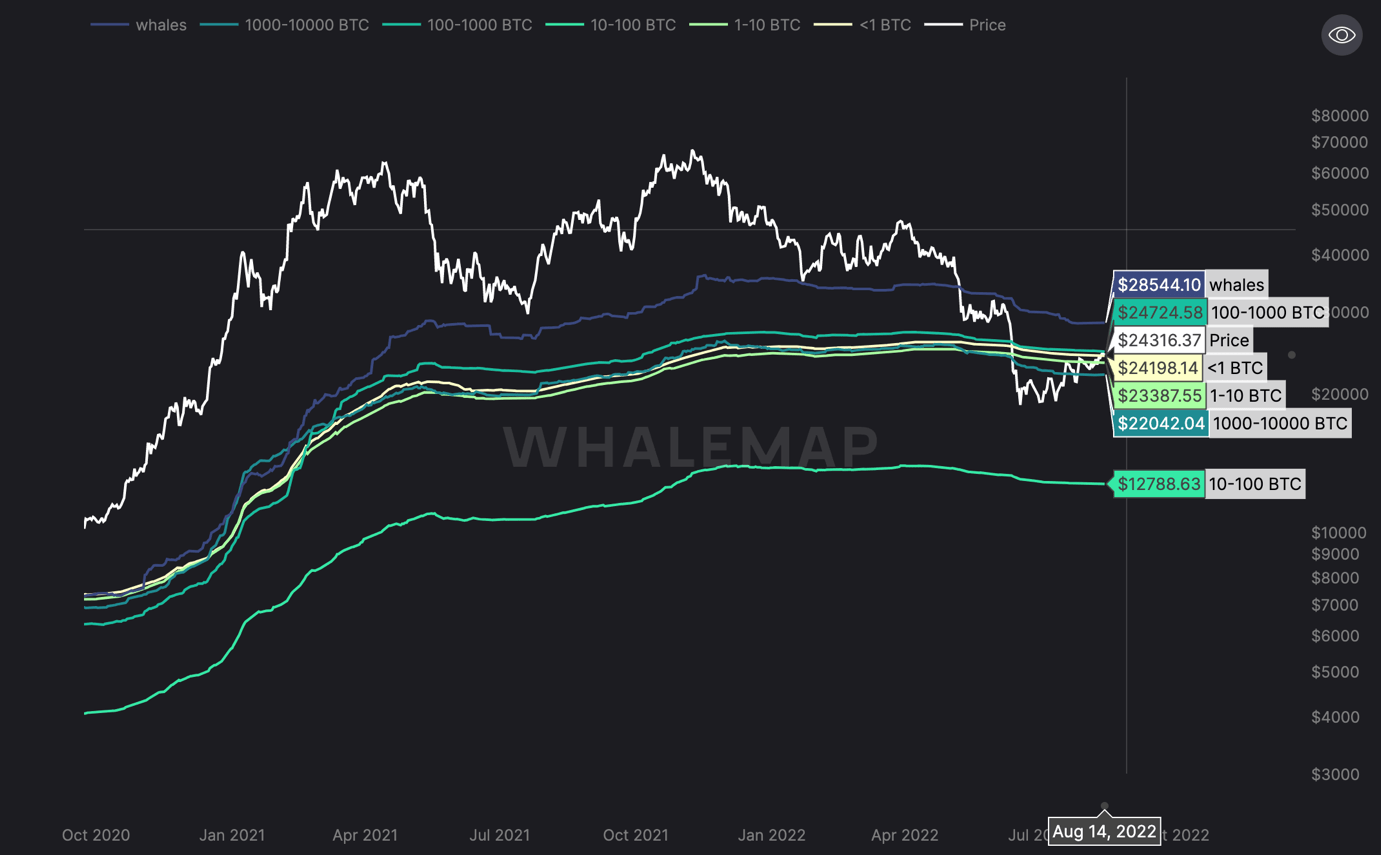
The Realised Price by Address visualises the average price at which current unspent Bitcoins belonging to each category of addresses were purchased for. We can see below that the realised price for a number of the cohorts of addresses is between $23,400 and $24,700. Because of this, this area will act as a heavy resistance zone, which we have seen over the past few weeks. The reason for this is that due to market confidence being low, investors are less willing to wait for higher prices and sell their coins into that. So, if the Bitcoin price is below that investor's realised price (we can see the average range for realised price is $23,400 to $24,700), the investor may sell their coins into this range when the price is there in order to break even – as they lack conviction that they’ll see higher prices.
Bitcoin – Realised Price by Address
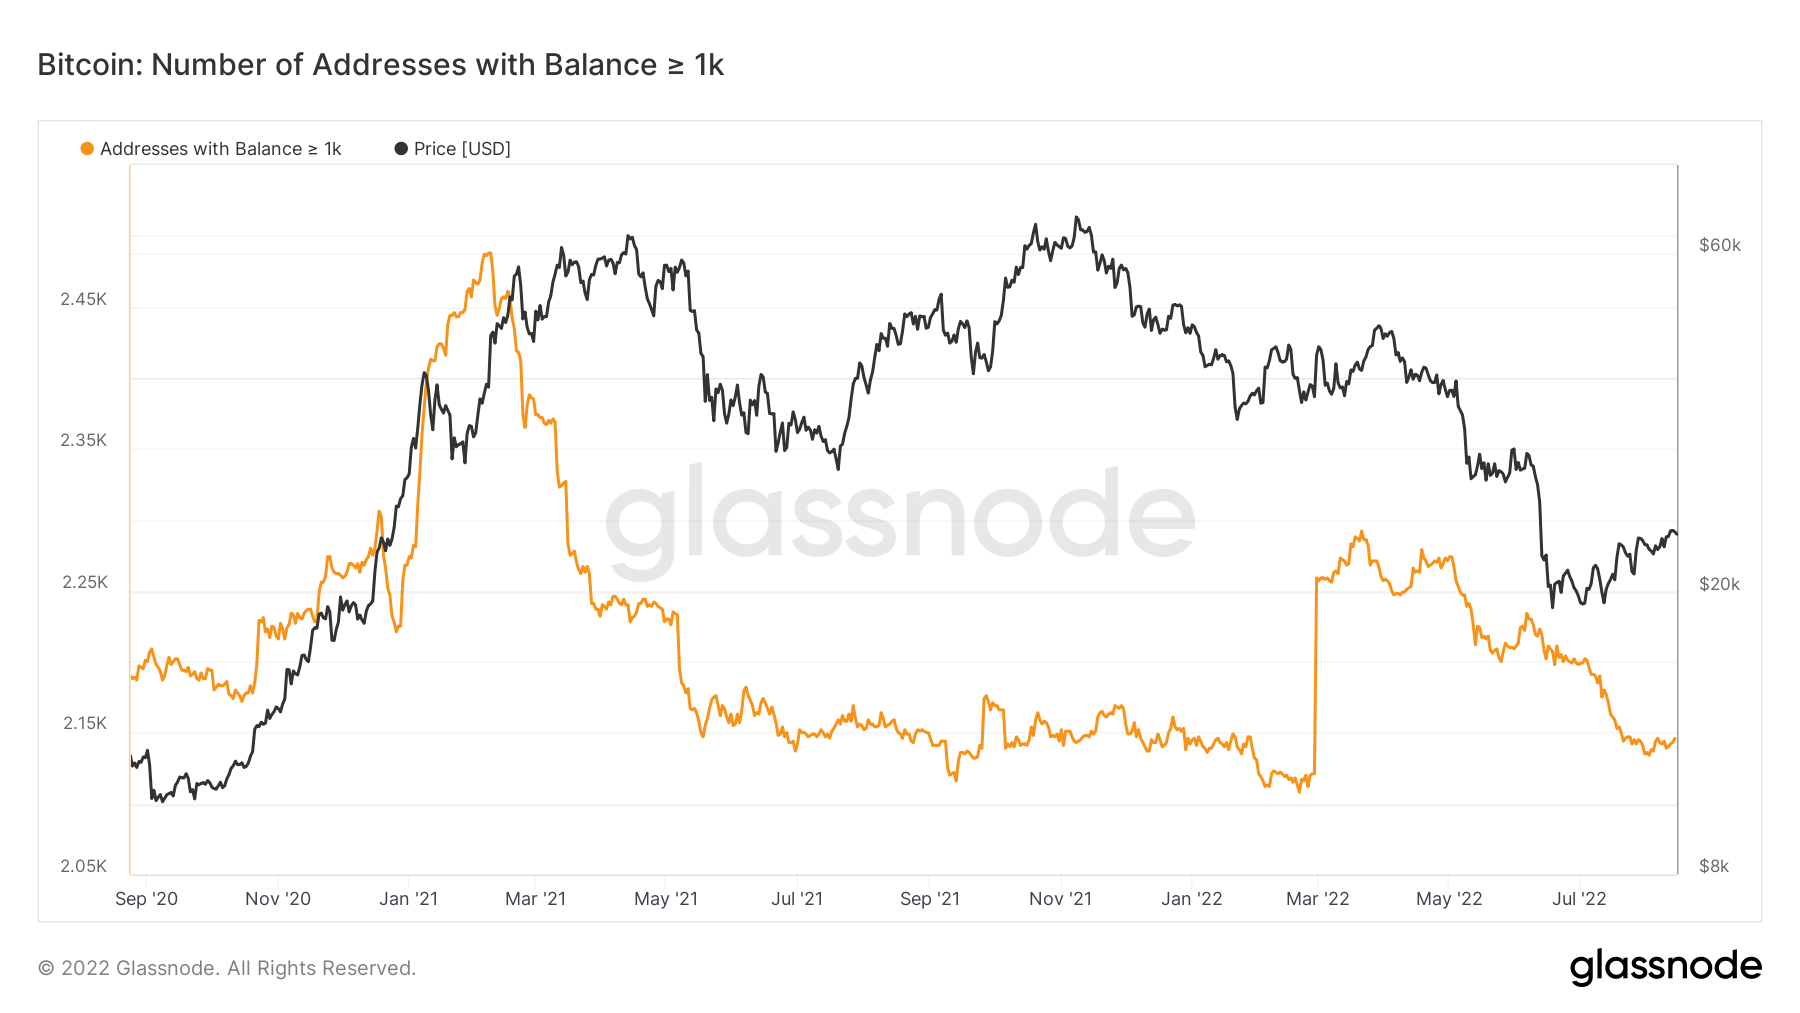
Metric 2 – Number of Addresses with Balance > 1,000 Bitcoin
Many of our readers will know that the ‘Number of Addresses with Balance > 1,000 Bitcoin’ is a key metric we assess. The reason for this is that this cohort have been historically very good at knowing when to risk-on (buy more Bitcoin) or risk-off (sell more Bitcoin). We can see in the below that this metric seems to have found a low for now and created a higher low on a local timeframe. Is this the absolute low and we should be encouraged to risk back on? It’s difficult to say at this moment in time, however it’s important to watch this metric over the next few weeks with an even more keen eye.
Bitcoin – Number of Addresses with Balance > 1,000 Bitcoin
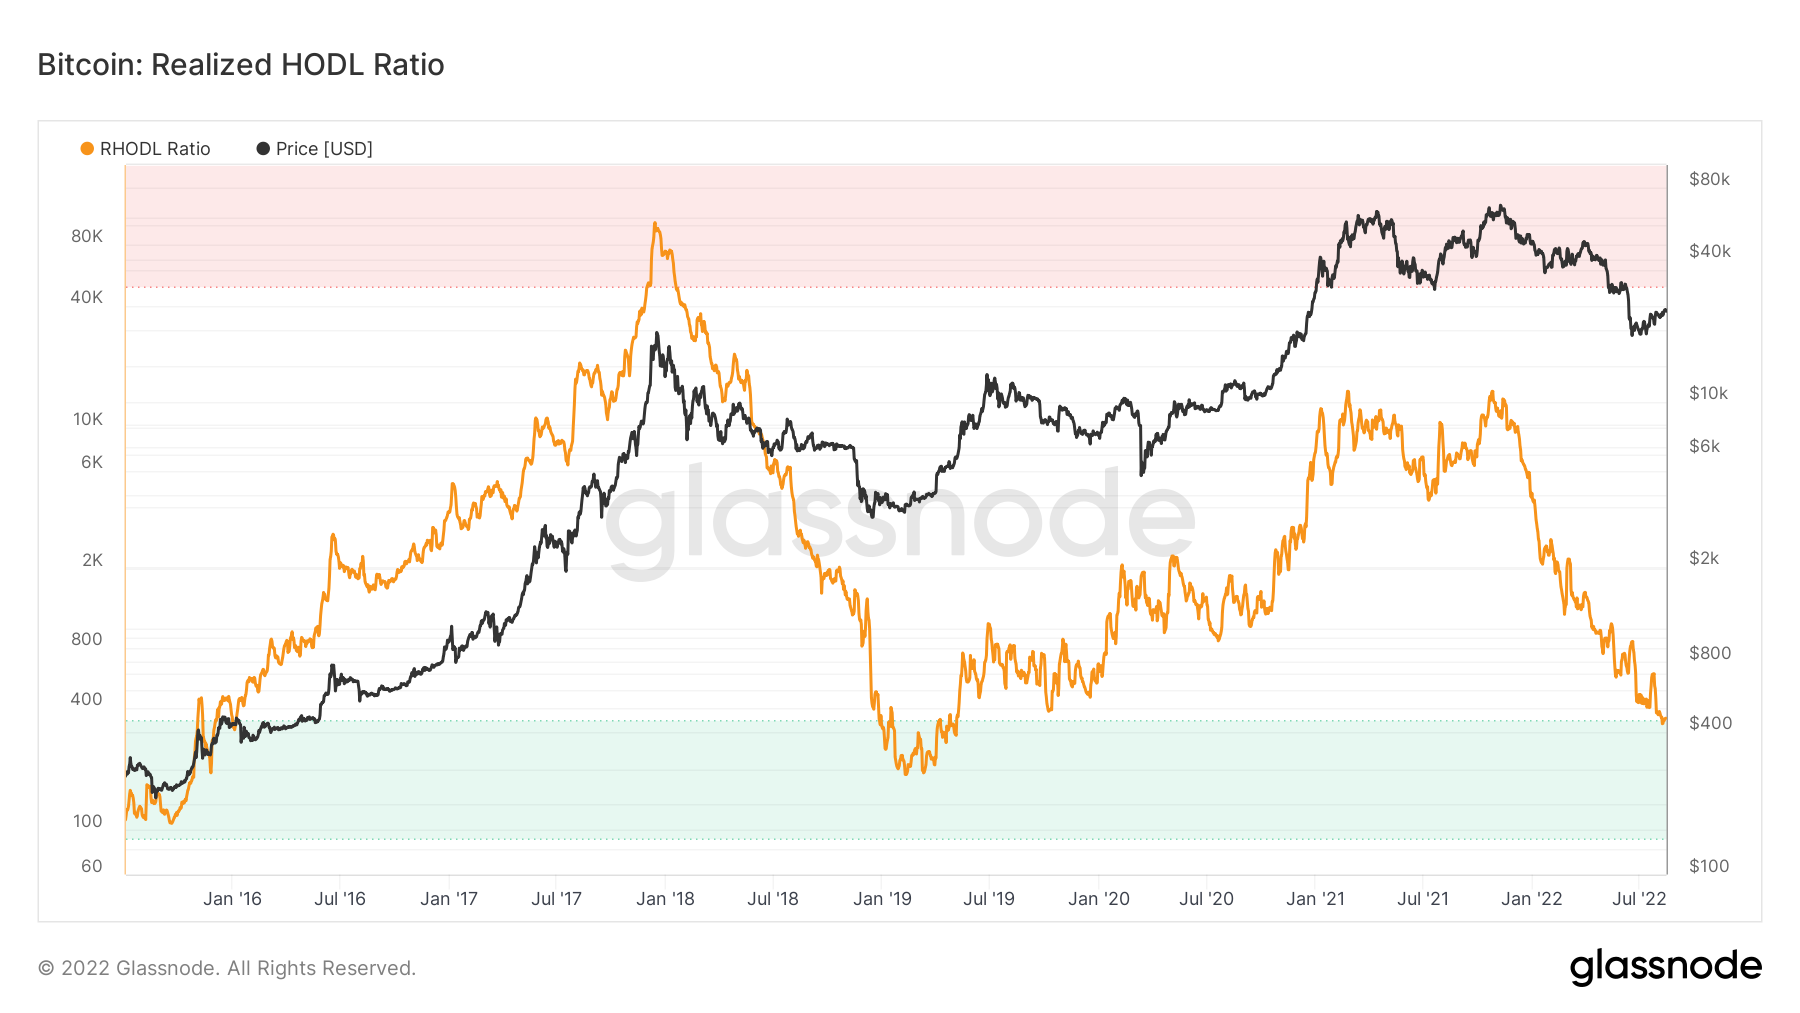
 Metric 3 – RHODL Ratio
The Realised HODL ratio takes the ratio between the 1 week and the 1-2 years RCap HODL bands. A high ratio is an indication of an overheated market and a low ratio (in the green zone) has previously been a good buying opportunity. We can see in the graph below, that this is the first time in this bear market that this metric has reached its green zone.
Bitcoin – RHODL Ratio
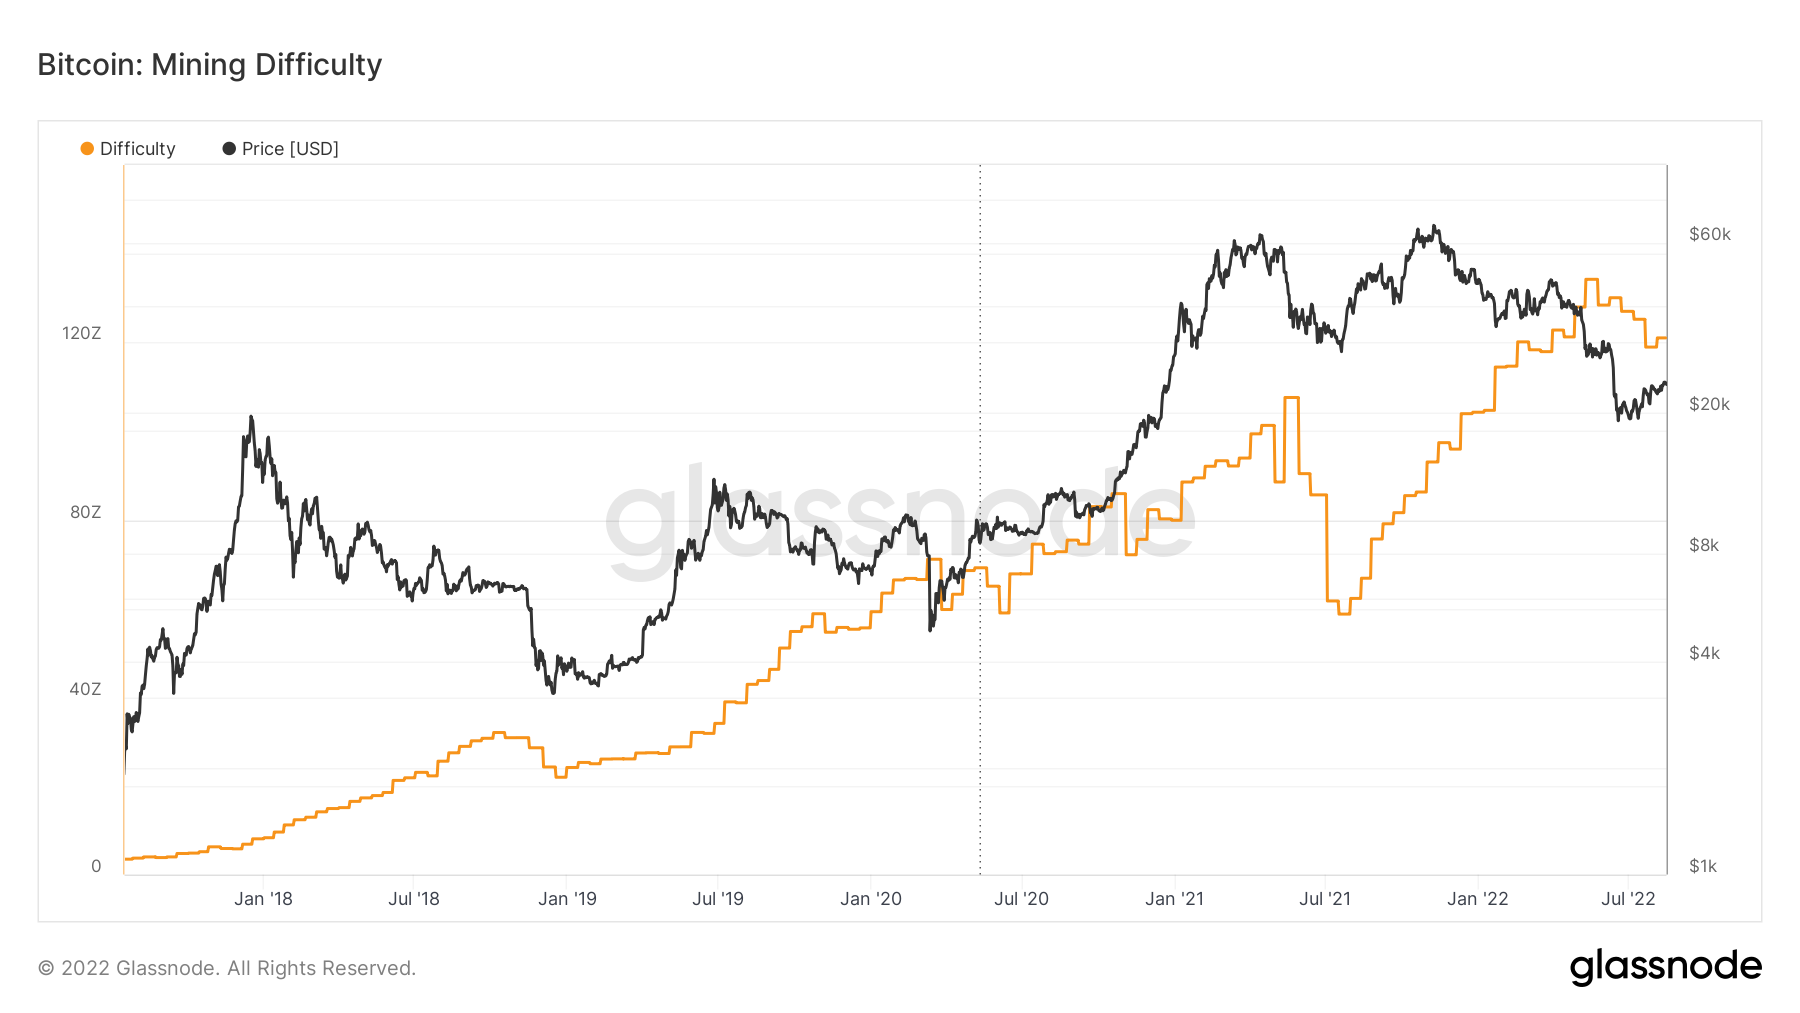
 Metric 4 – Mining & Hash Ribbon
One of the last stages of a bear market is when miner capitulation has ended. This is usually represented by ‘Mining Difficulty’ and then ‘Hash Rate’ trending lower which sees the 30D MA cross below the 60D MA on the ‘Hash Ribbon’ metric. If we look at the ‘Mining Difficulty’ metric we can see that it has turned lower and now looks to have formed a bottom. However, this can trend lower again if the Bitcoin price were to come down. This is something we will have to watch in the coming weeks.
Bitcoin – Mining Difficulty
 If we now turn to the Hash Ribbon metric, we can see that the 30D MA has turned beneath the 60D MA and has now leveled off again and is beginning to turn up and touch the 60D MA.
Bitcoin – Hash Ribbon
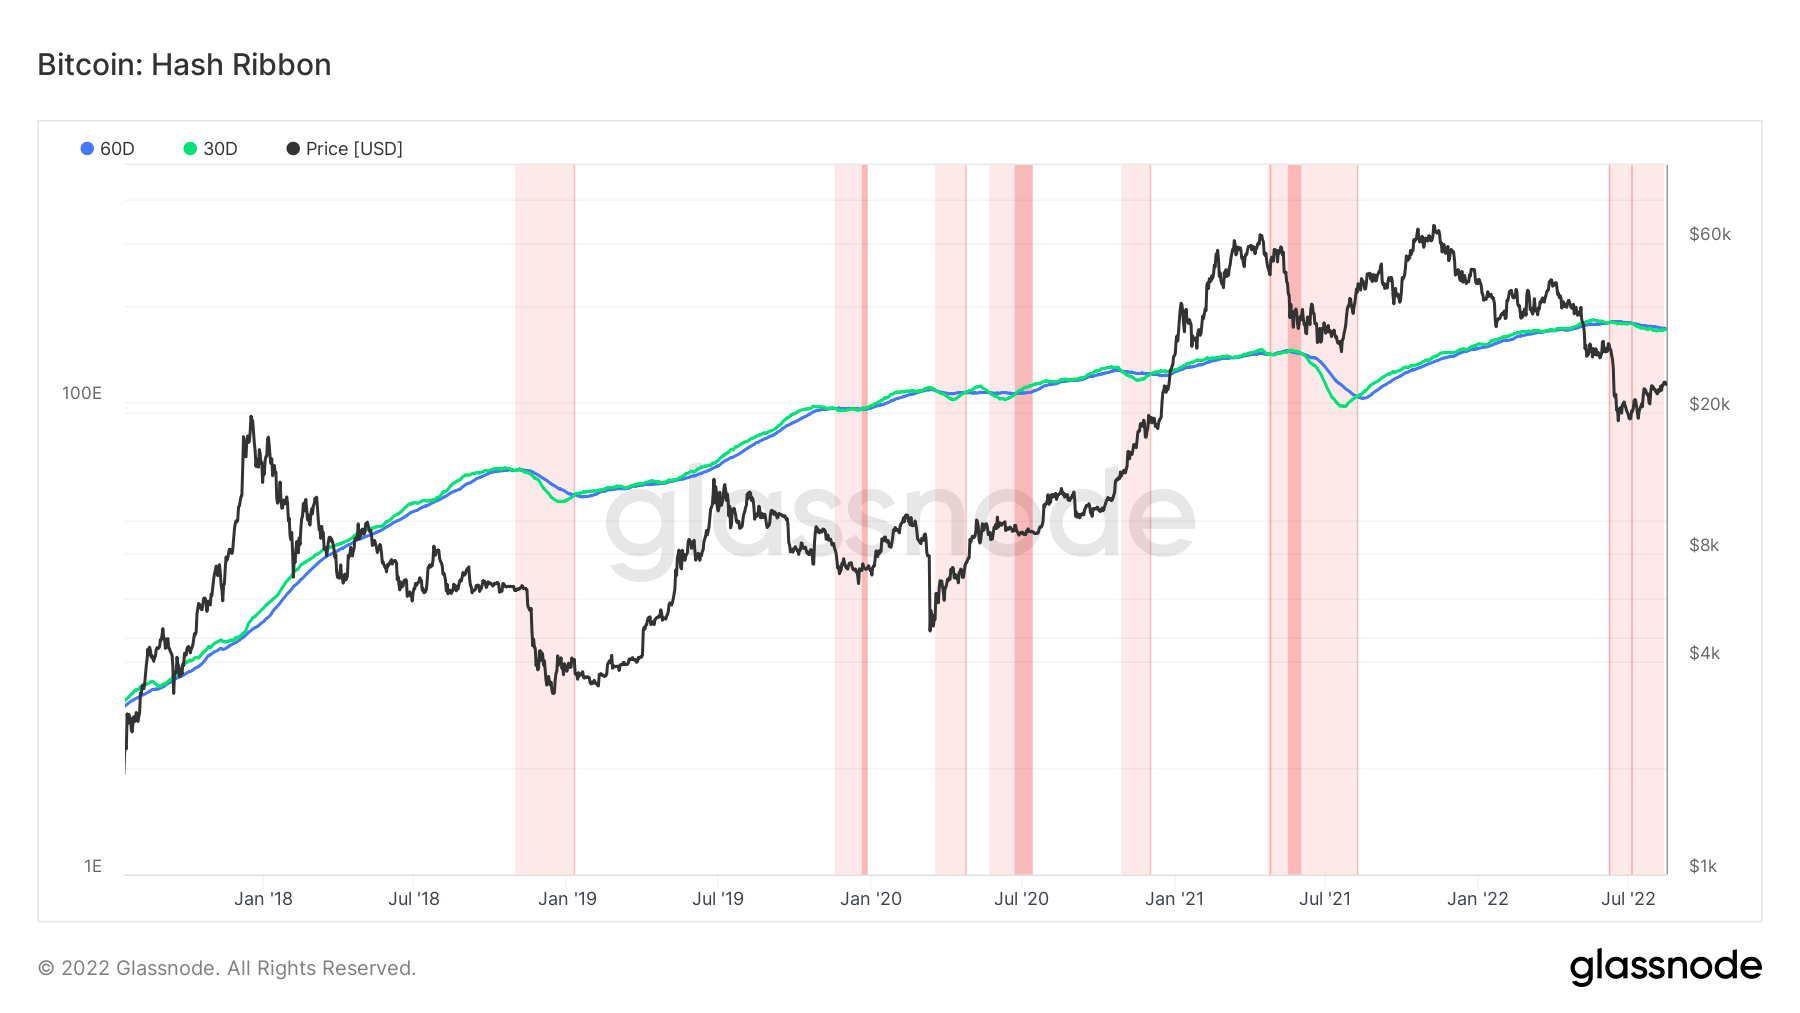 We can see in the above graph that in prior Hash Ribbon bottoms, we have seen a far greater disparity between the 30D MA and the 60D MA. So, it is potentially not the bottom yet but again, this is another key metric we have to watch over the coming weeks. If the Bitcoin price were to go lower, we may see the 30D MA turn lower once again and put in a new low.
S&P 500 Index
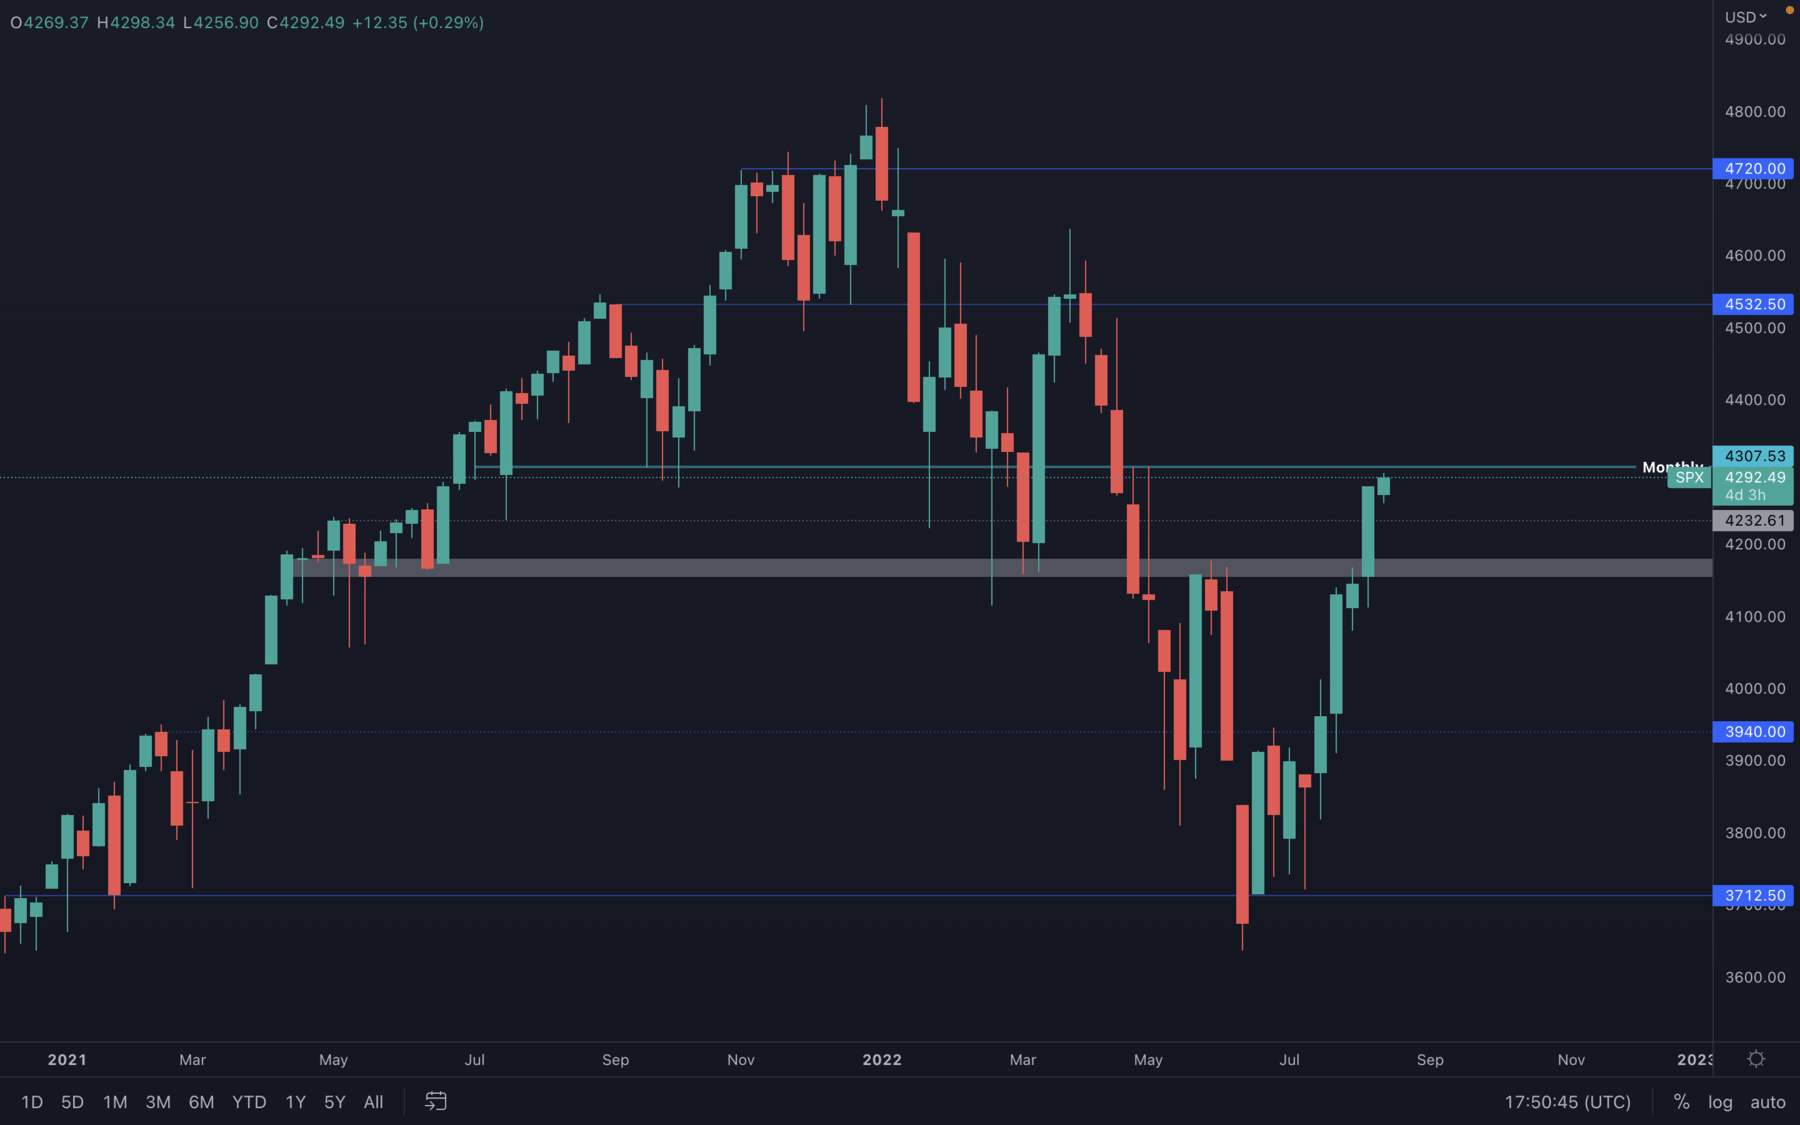 As we know, there has been a strong correlation between the crypto market and the stock market, and it's necessary to monitor all major indexes in order to provide the ultimate confluence. In the above chart, we can see that the S&P 500 Index has reached a major resistance level, which might slow down the crypto market leading Bitcoin towards lower prices. As of now, the index is approaching resistance at $4300, with the closest support area between $4230 - $4200. If the index is unable to break its resistance, we might see the crypto market experience a slow down in rising further.
Ether - Technical Analysis
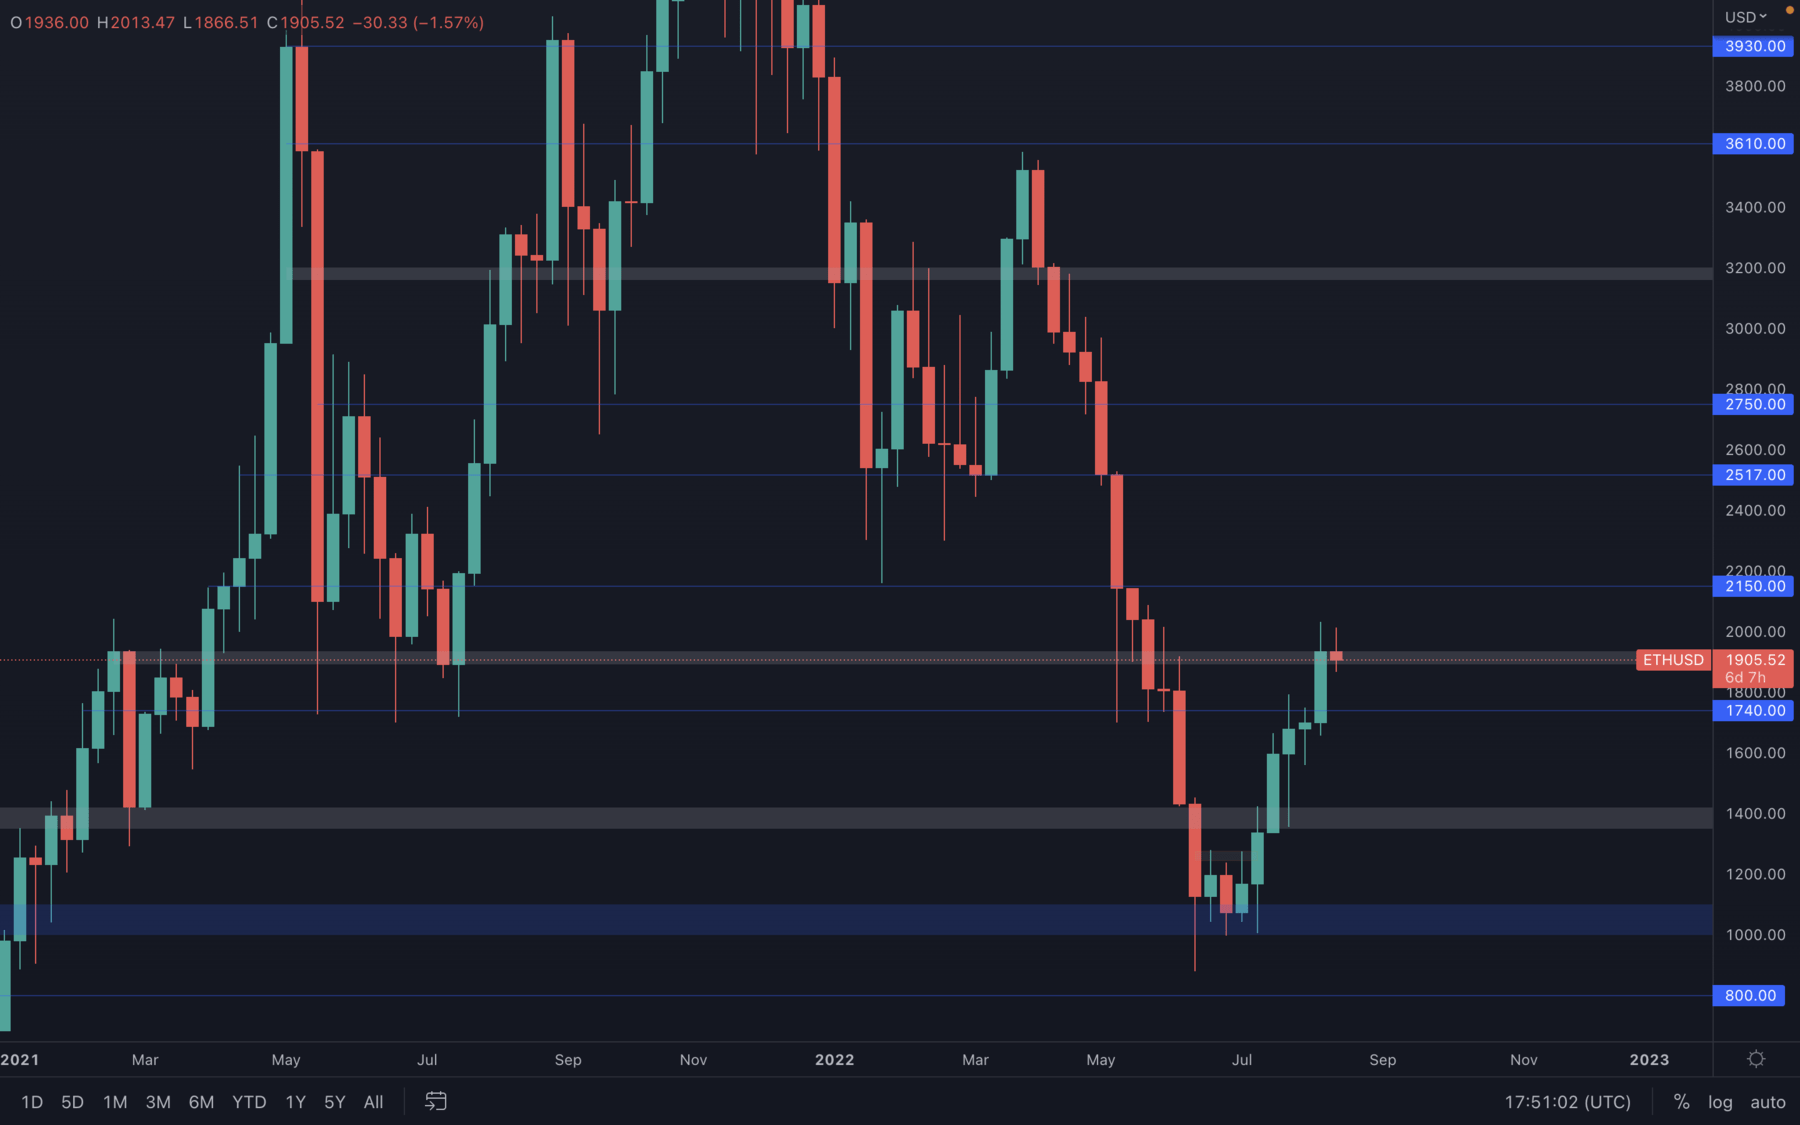 Ethereum continues to amaze the crypto market participants - after the successful testnet merge four days ago, Ethereum has experienced an increase in both volume & price, breaking above its $1900 resistance level and actually closing a weekly candle above it. For now, maintaining its value above $1900 is essential for further upside towards $2150. A weekly loss of $1900 can lead Ether towards a $1740 retest, as this level has been broken last week, but remains yet to be retested and flipped into support.
DOT
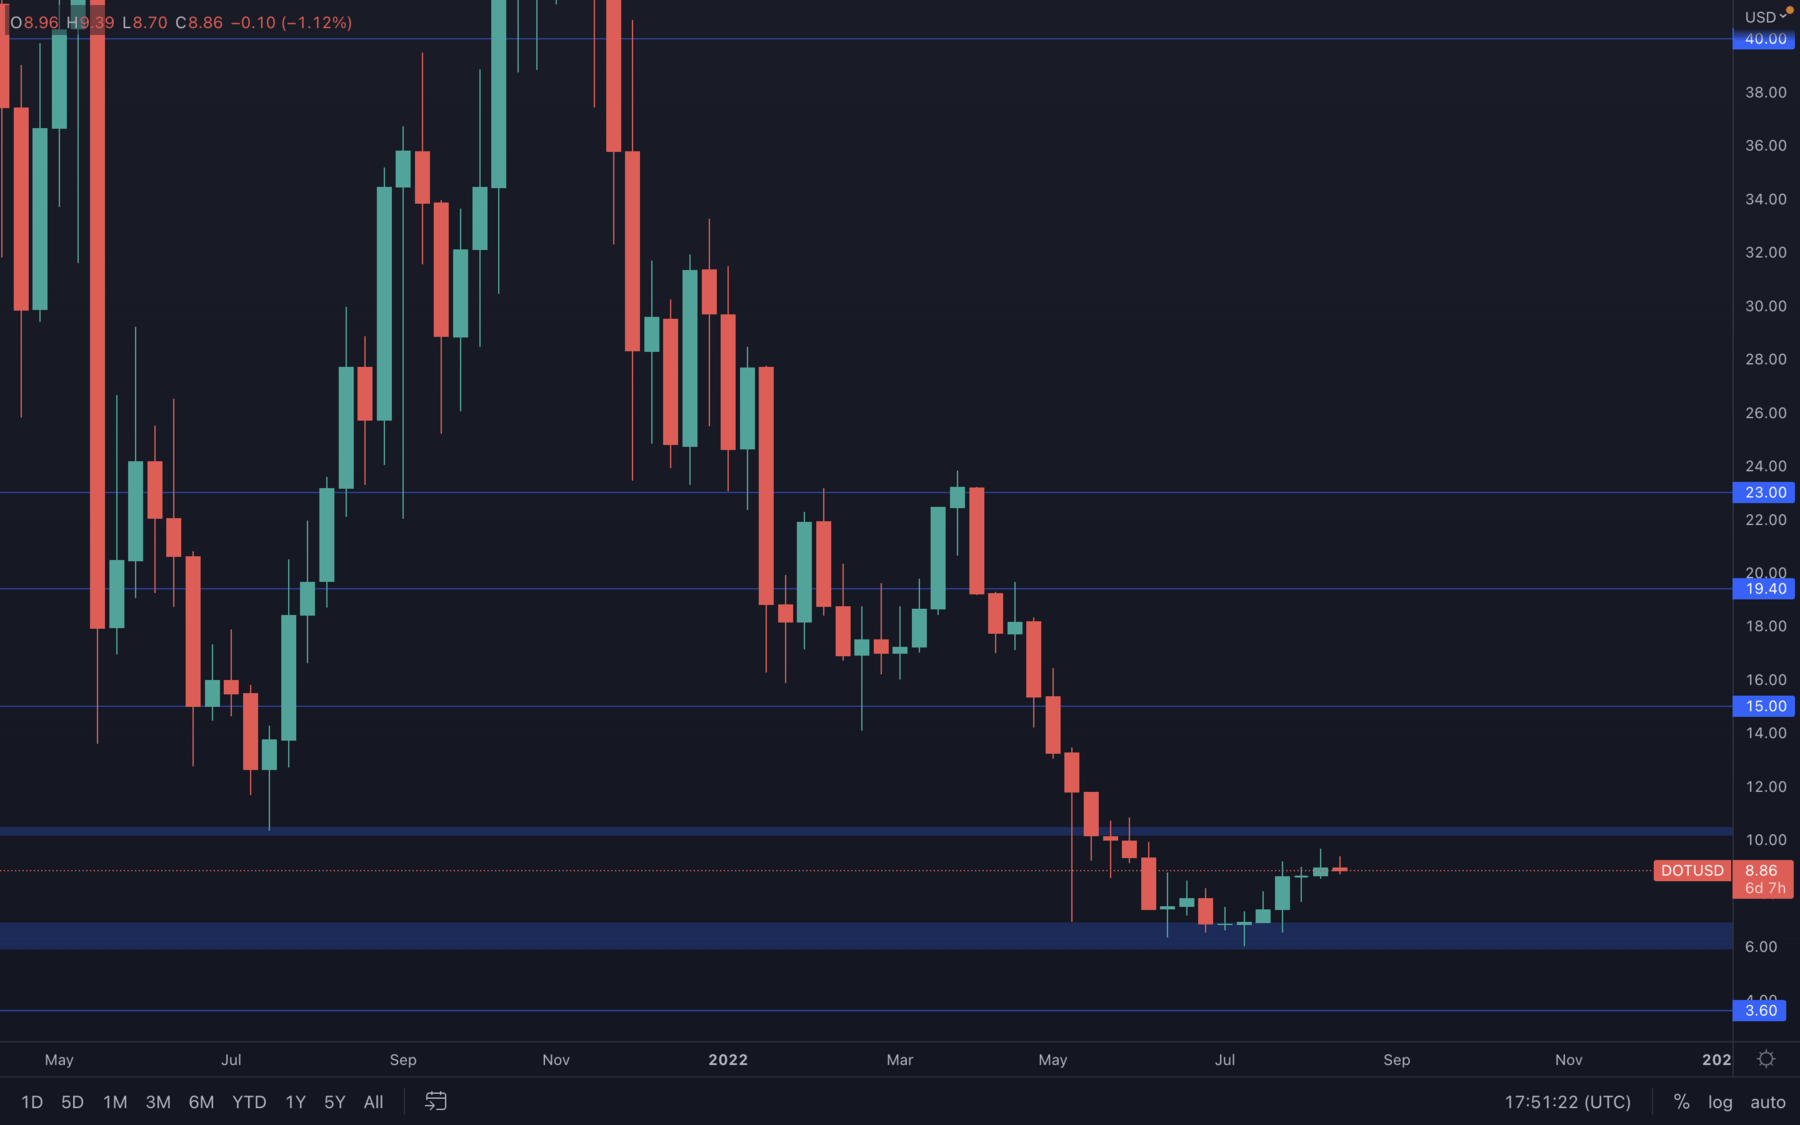 No changes as of yet, DOT still remains on a path towards $10 unless the majors and the indexes are unable to test their closest resistance levels. A higher high has been printed on the daily timeframe, which suggests a higher low now has to be formed in the coming days. A daily closure under $8.60 will put DOT at risk, as the previous higher high will be invalidated.
SNX
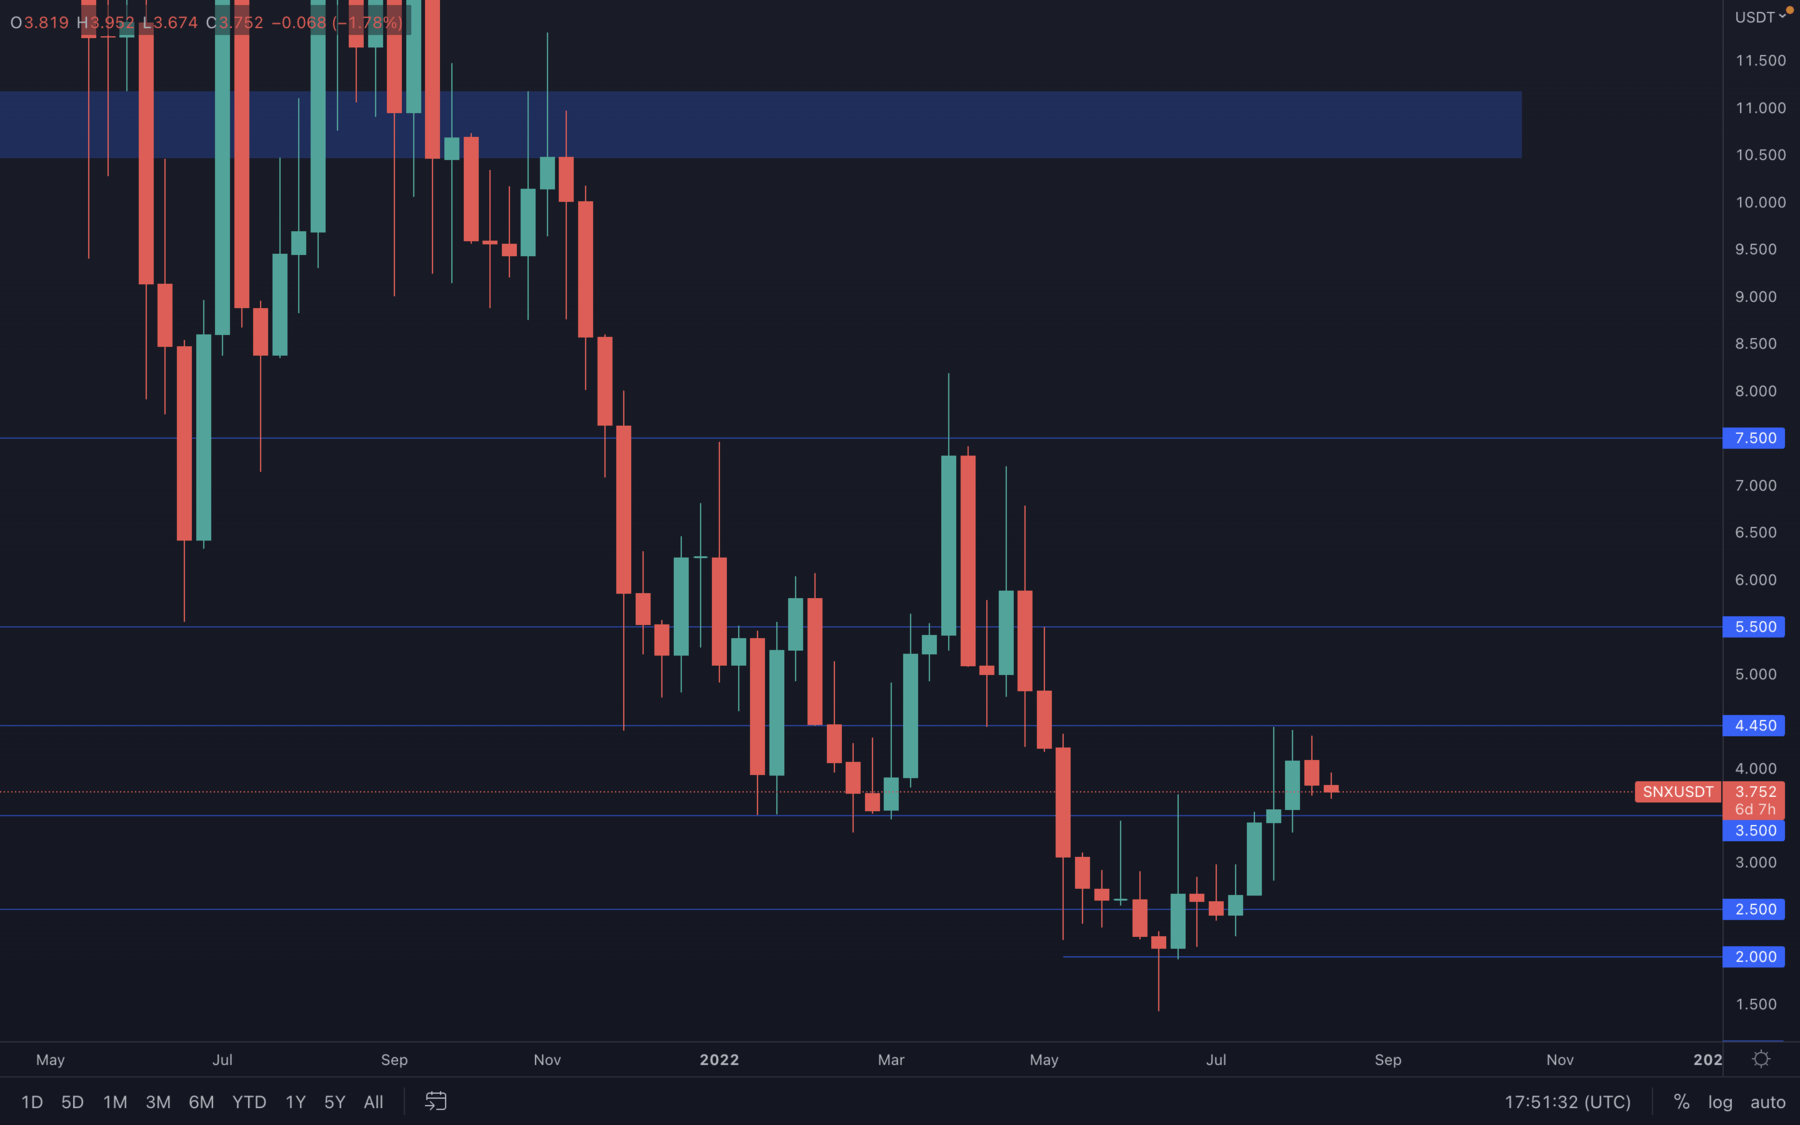 After multiple $4.45 resistance tests, SNX was unable to break above this level and with last week's candle closing bearish, it's safe to assume SNX will visit the $3.5 support level this week. In any case, a weekly lower high has been formed which means SNX will now aim towards forming a higher low on the weekly timeframe - this will potentially mark the start of a change in its weekly market structure, from bearish to bullish.
RUNE
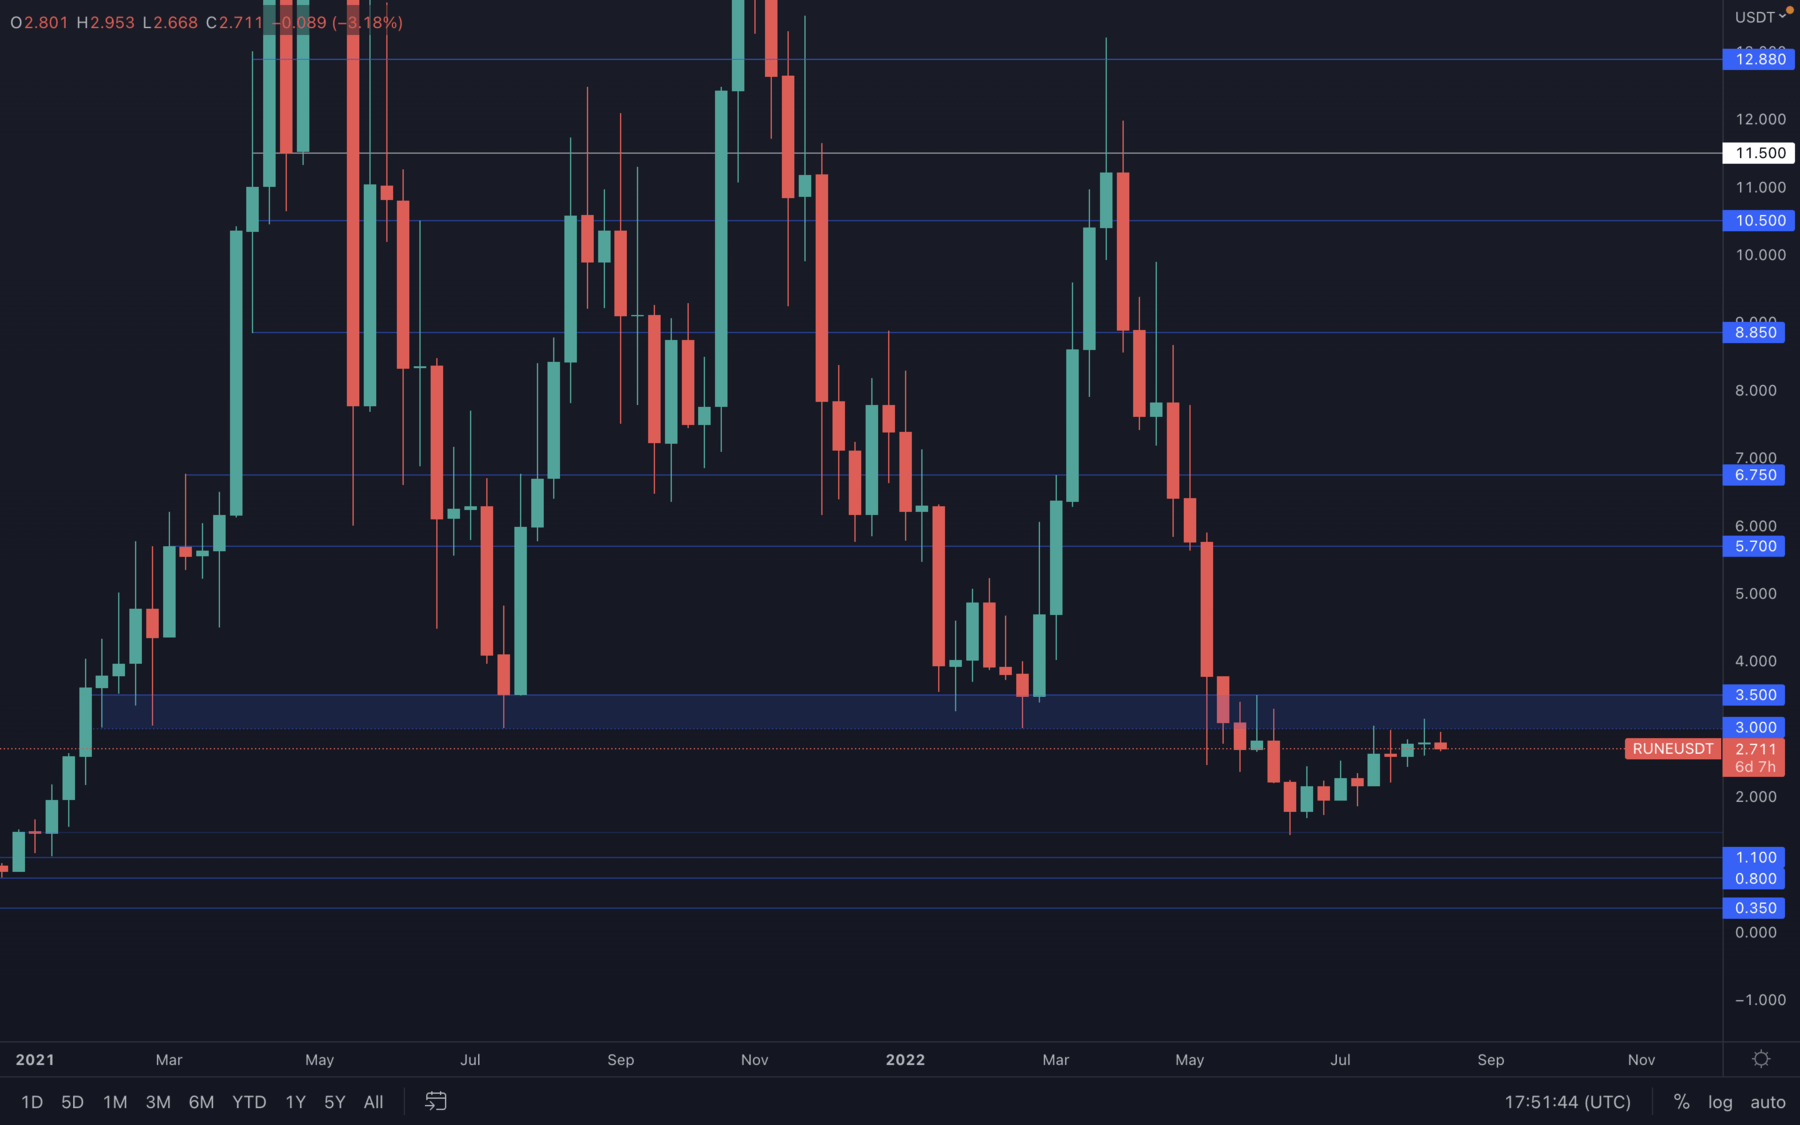 RUNE has found itself just under the $3 - $3.5 resistance area and for now, hasn't been able to break above it after testing it multiple times. A rejection from this level will force RUNE to form a higher low on the weekly timeframe, with $3 as a lower high.
SOL
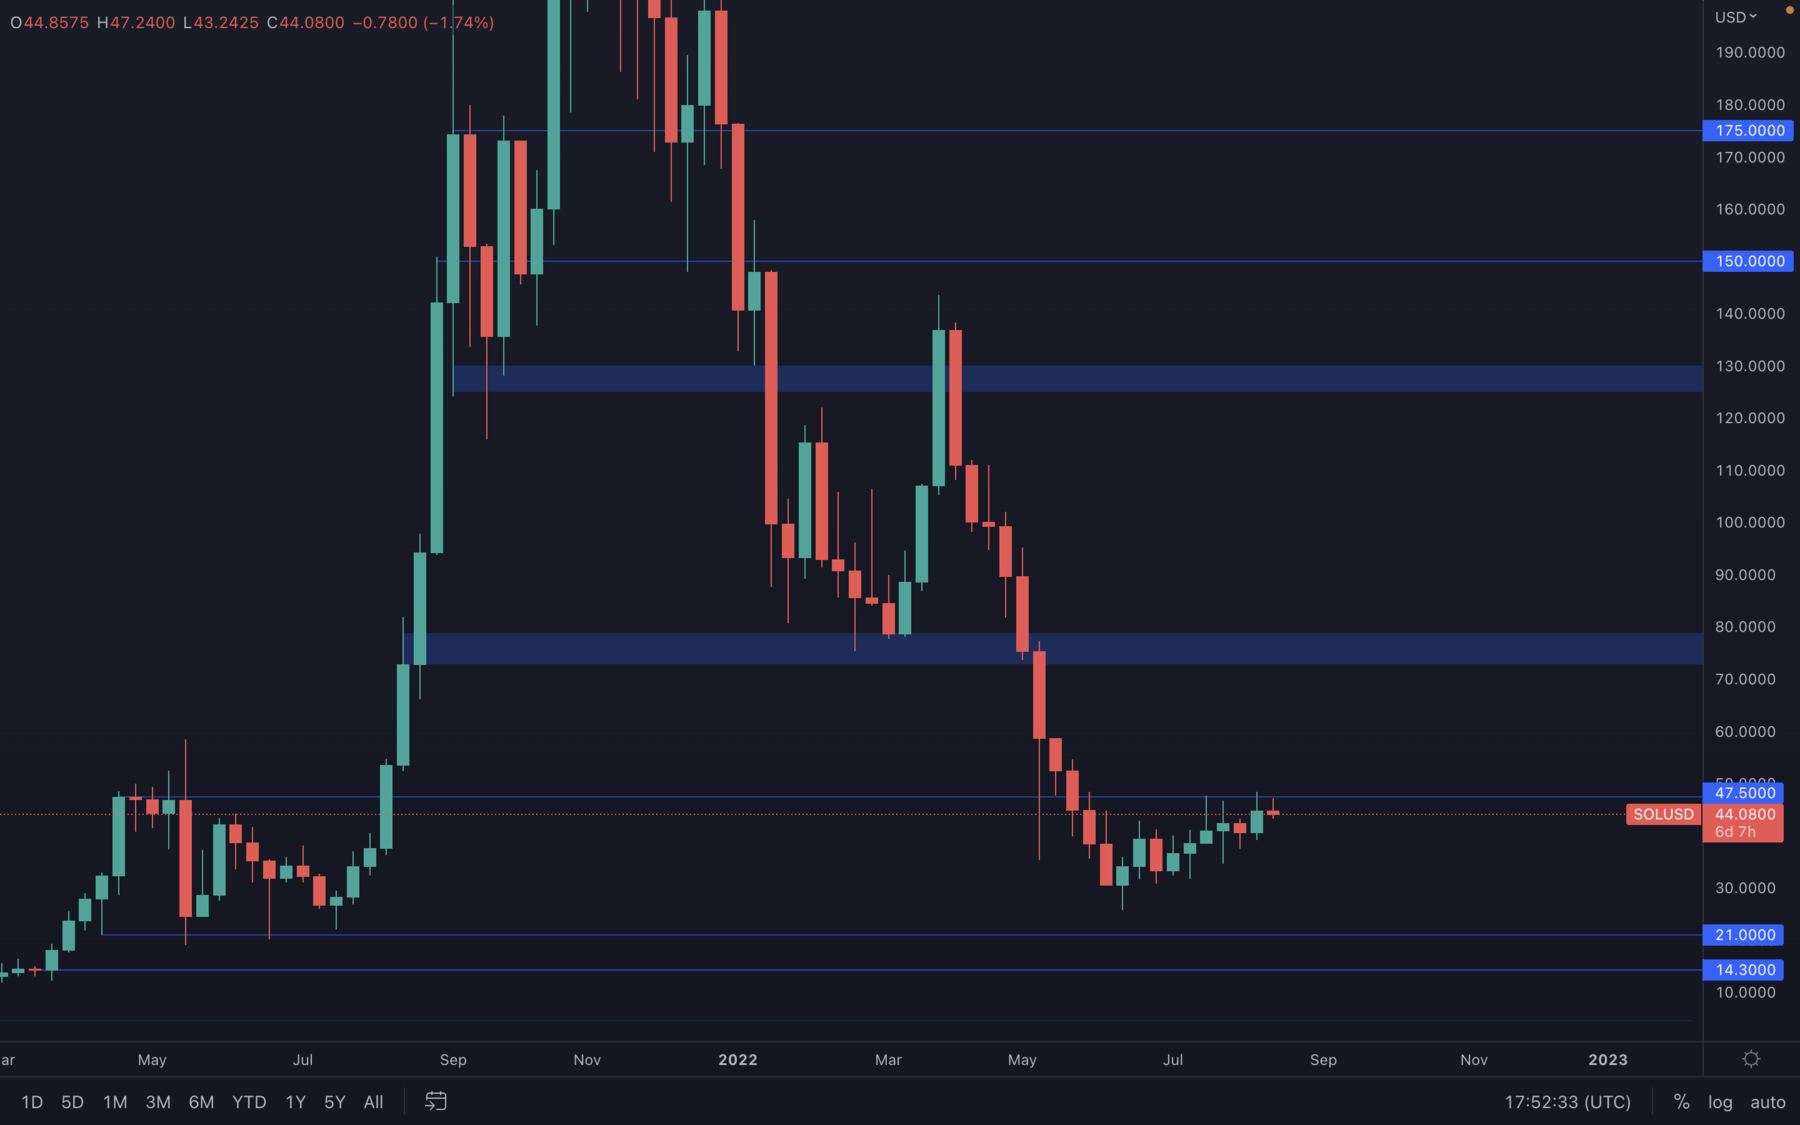 SOL managed to push as high as $48 last week, but still closed under its $47.50 resistance level. This puts SOL at risk, as a rejection from this level, similar to RUNE, will also force SOL to form a lower high on the weekly timeframe which will suggest a higher low will be on the cards next.
SRM
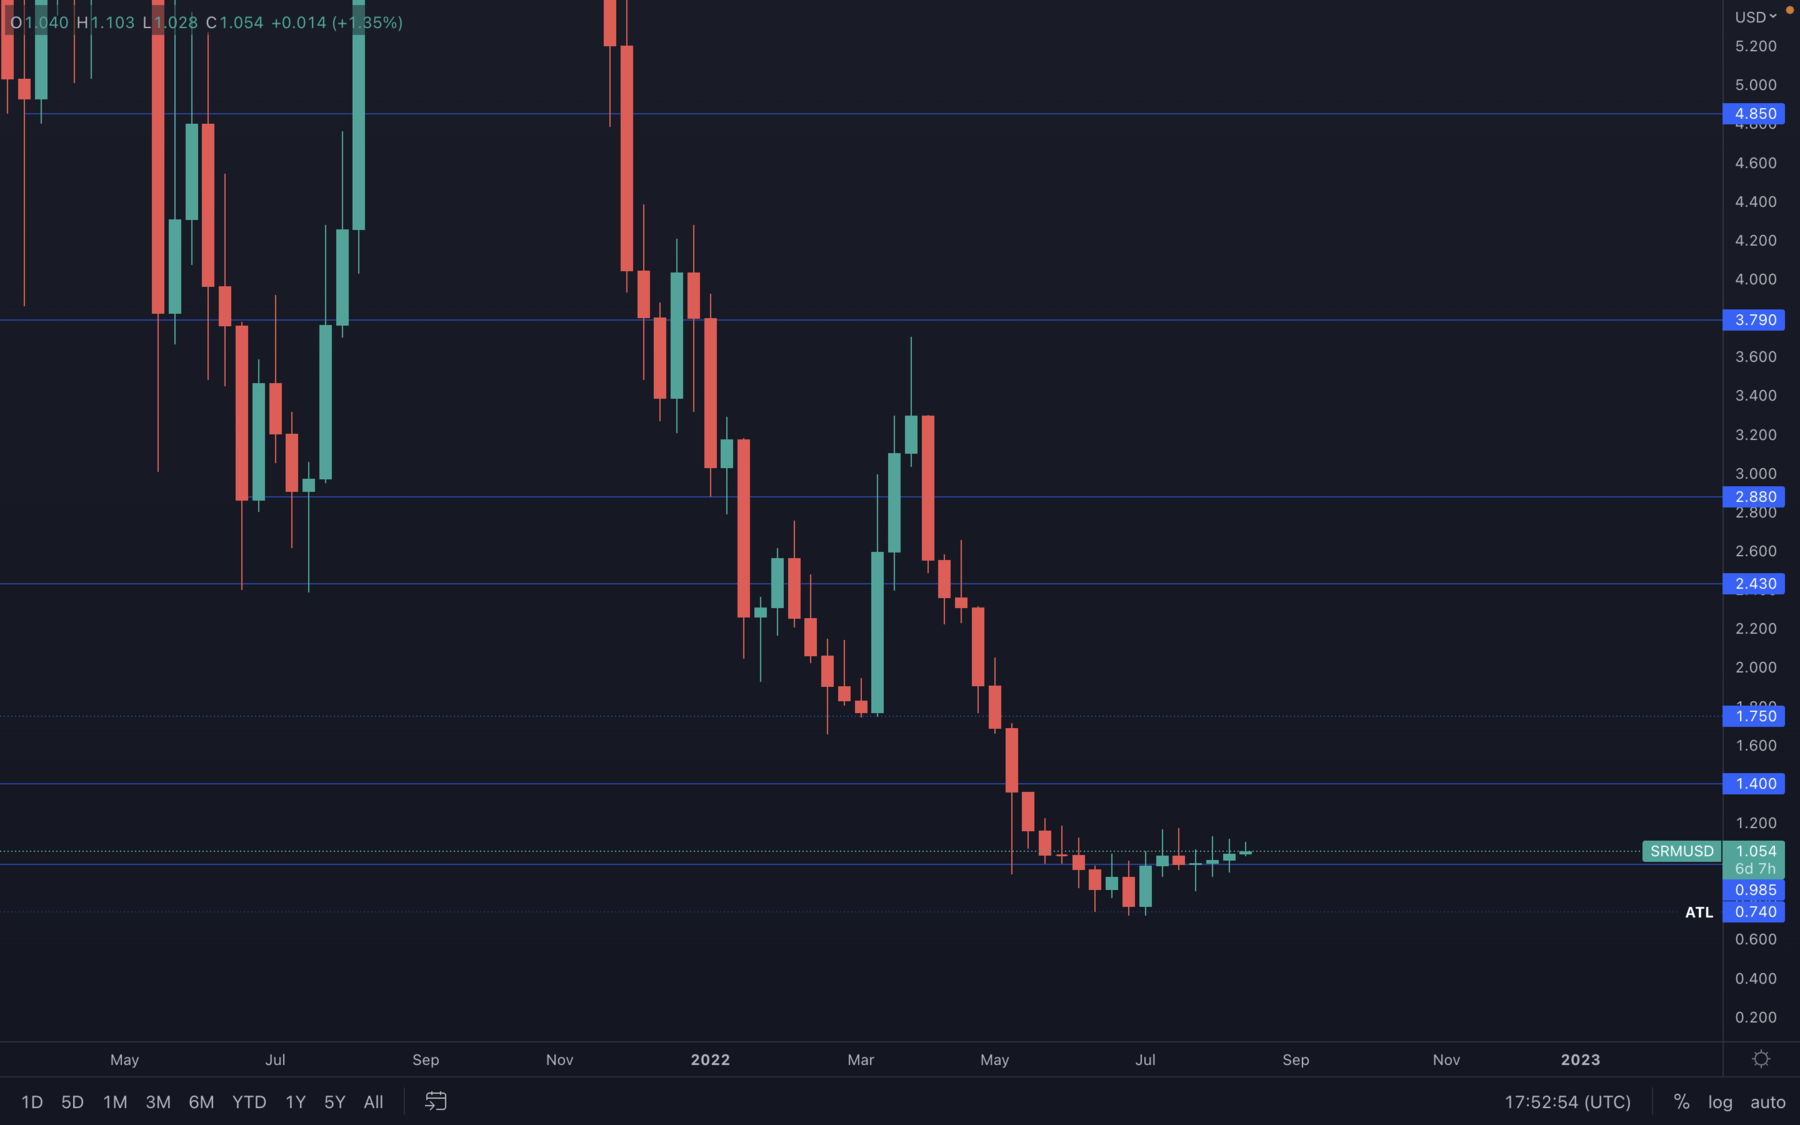 This is the height of choppy price action - SNX has been printing indecisive candles for weeks, but we still need to point out the obvious. We're now in the fourth week above the $1 psychological & technical level, which suggests $1.40 still remains on the cards. Until this level is lost, we stick with the same bias.
FTT
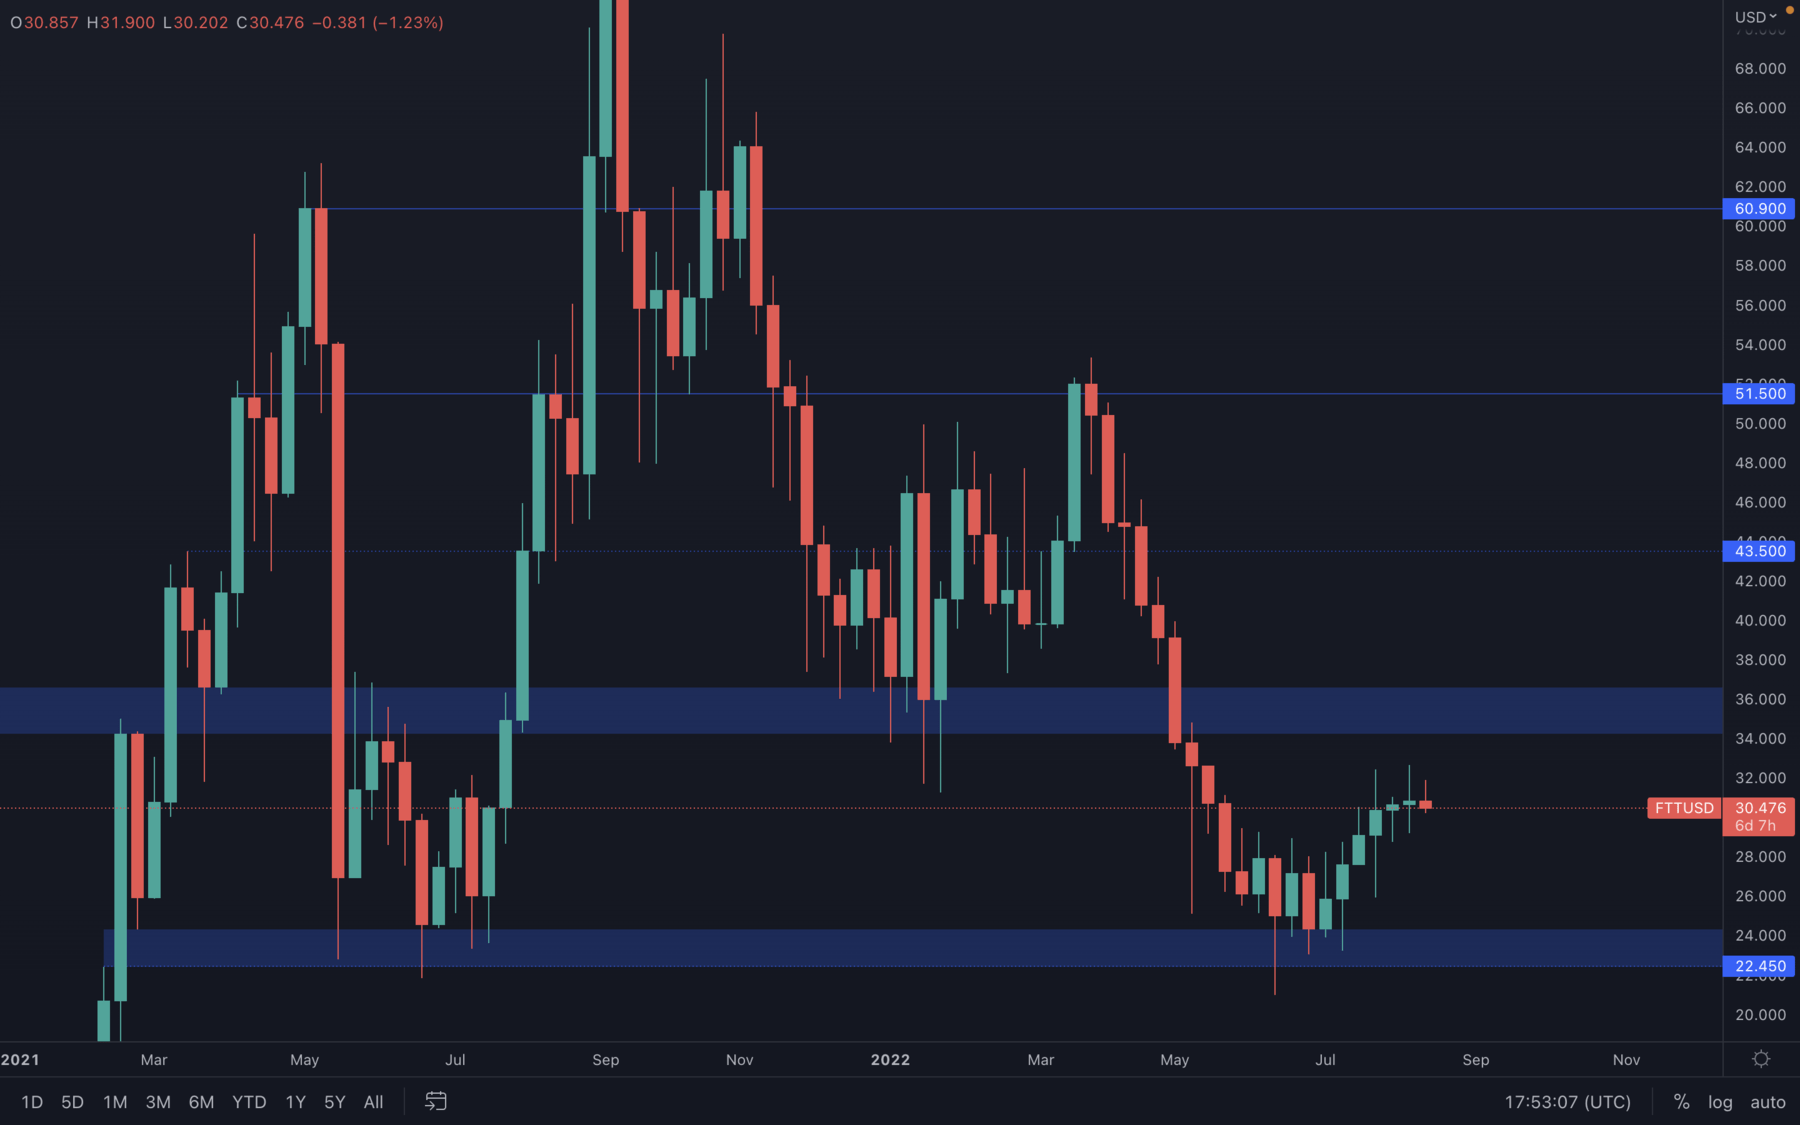 FTT seems to be struggling rising further, printing not one, but two weekly Doji candles in a row. Unless the majors perform well for as long as FTT needs to test the bottom part of its $34 - $36 resistance area, then there's a risk of a weekly lower high currently being formed here.
MINA
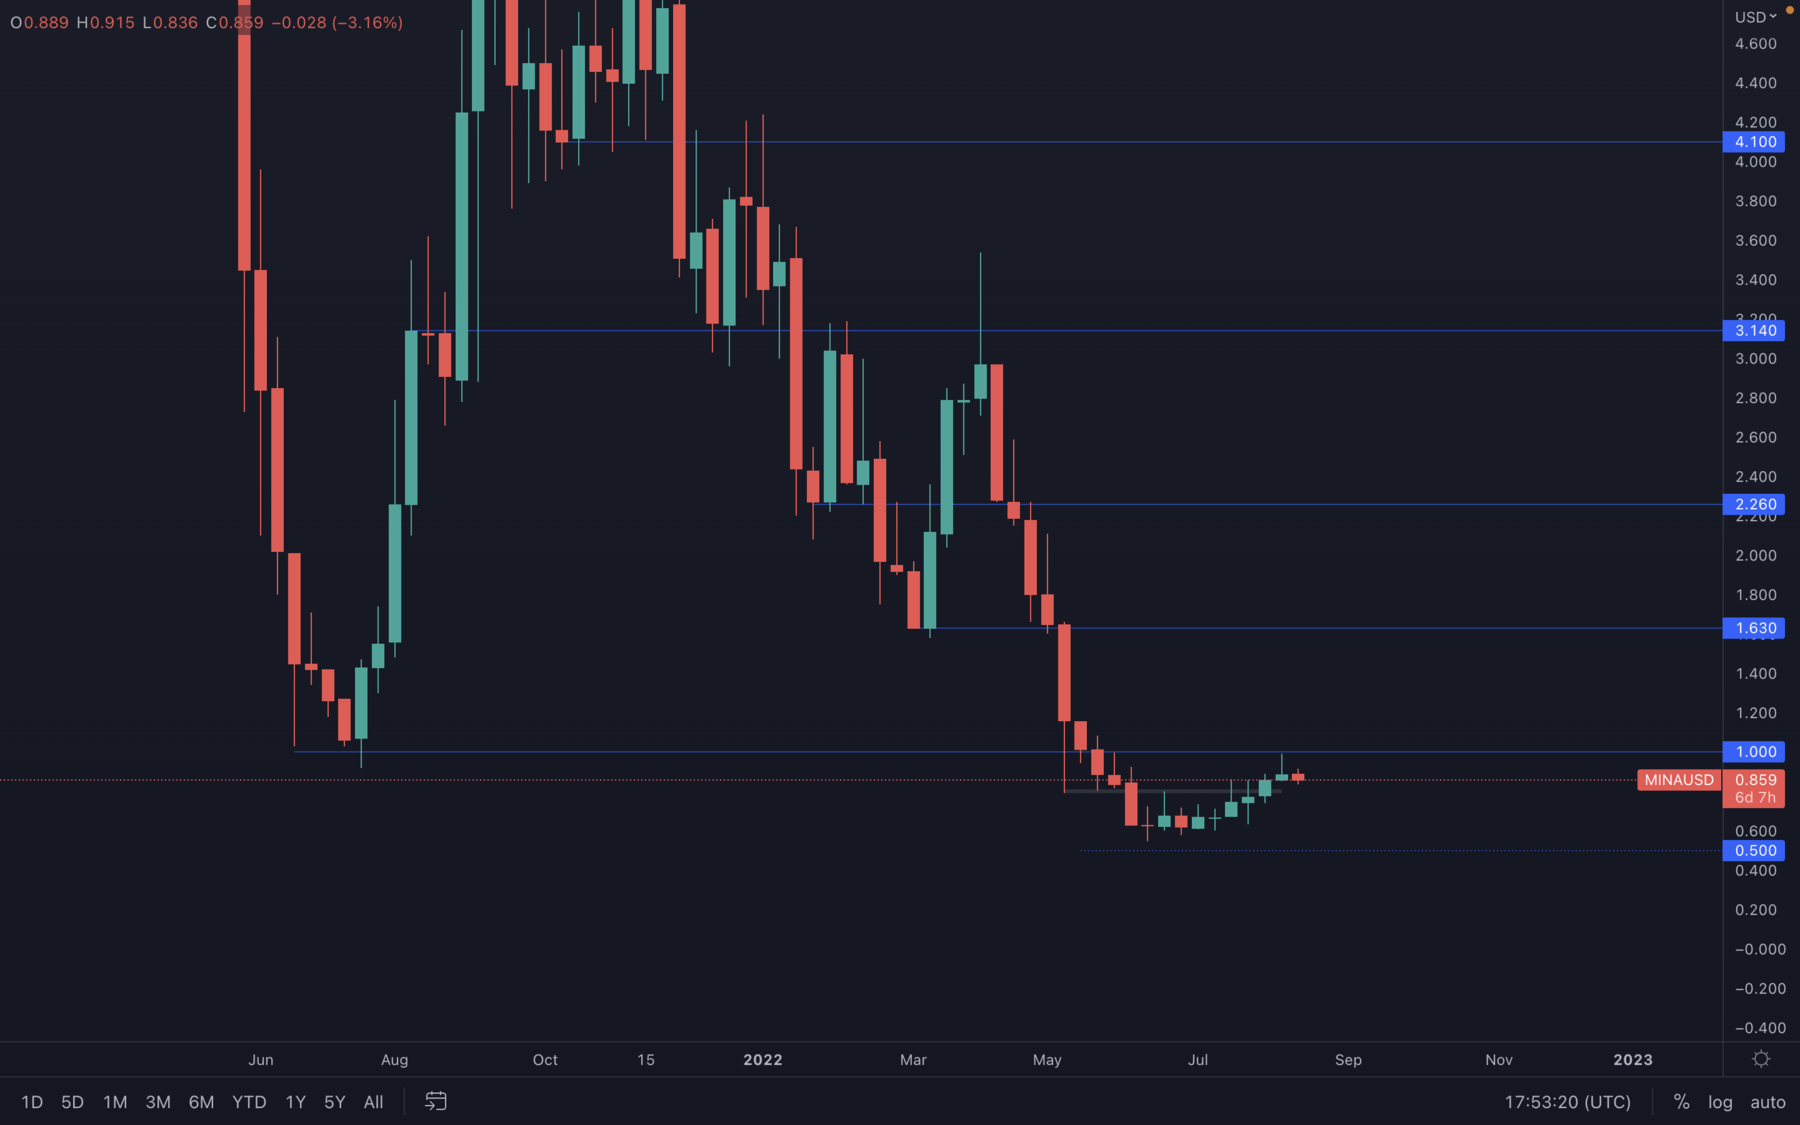 If you're checking our TA on a daily basis, then you already knew MINA was headed for $1. This level was perfectly tested last week, but there wasn't enough buying pressure to close the week above it, something we also mentioned in our daily TA 😈. With this level also being a psychological one, we can only assume selling pressure is increased even further, making it hard to impossible for MINA to break above it unless the majors experience a strong push to the upside.
For now, we should expect MINA to slow down a bit after printing a potential lower high on the weekly timeframe, sitting at $1.
dYdX
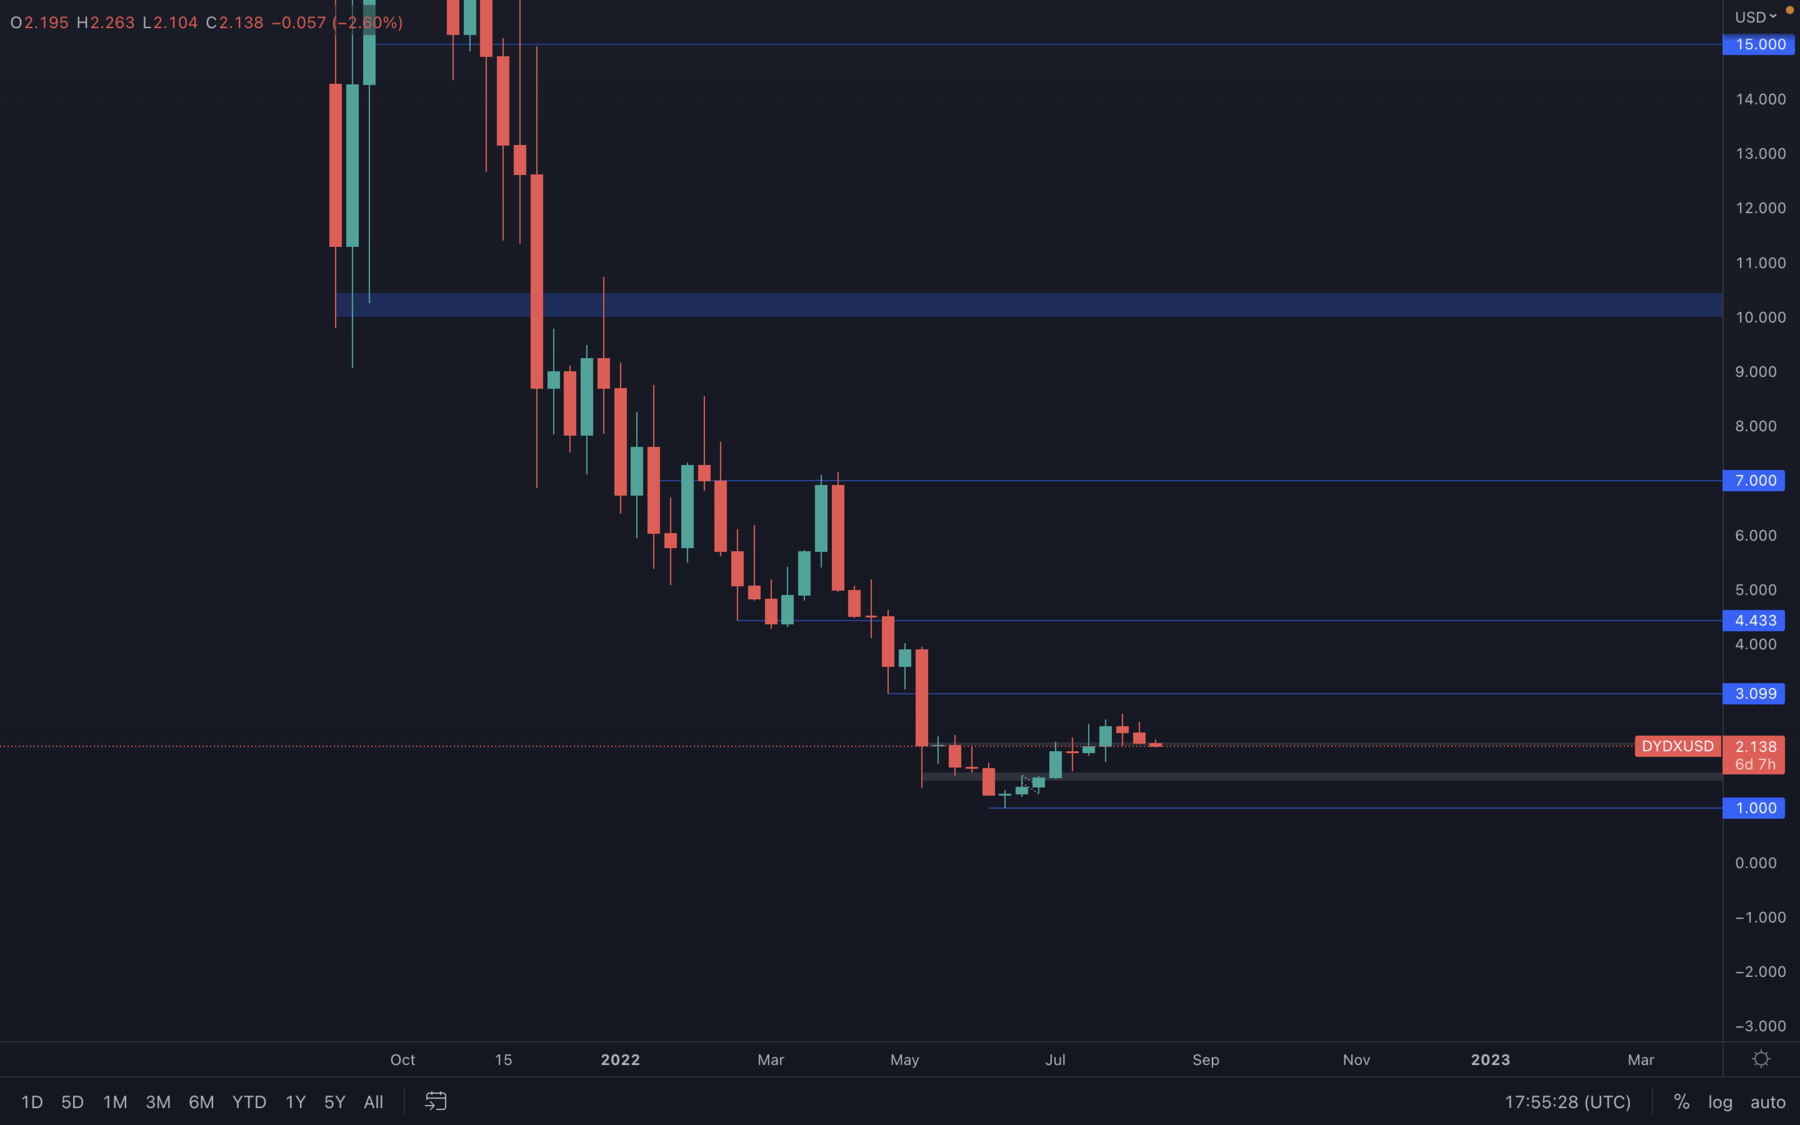 Clear reversal candlestick formation - dYdX printed a lower high on the weekly timeframe and is now aiming for a higher low around the $1.5 - $1.6 support area.
Summary
A lot of the above charts suggest that a bottom may have been put in, however, with Bitcoin seeming to struggle at the late $24,000’s resistance area, if we do get a sell-off, we may see a significant sell-off due to market confidence being low still. It could be said that we’re currently in a key inflection point where the market may have bottomed, although the market still remains very fragile and therefore we may see retests of the lows if we do get a capitulatory like sell-off (possibly caused by low market sentiment).Recommended from Cryptonary


