Save 23% ($351) & Get a Free 1-1 Call with our Team ⏰ : 0d 2h 59m 43s

Disclaimer: Not financial nor investment advice. You are responsible for any capital-related decisions you make, and only you are accountable for the results.
Macro
This week, we have some key upcoming macro events. Most of this kicks off on Thursday when we have jobs data being released and the beginning of Jackson Hole. Jackson Hole is an annual event where the FED Chair speaks on the economy – very important for assessing the FED’s moves with regard to potential future market movements. The main part of this comes on Friday when FED Chair J Powell will speak. It is expected that he will have a more hawkish tone and look to re-align the markets back to the inflation narrative and indicate to the markets that inflation is absolutely the FED’s number one concern.On Friday, we also have consumer spending and income data along with PCE and Core PCE data. This is important in the assessment of consumer prices and if they have peaked. Expectations are that they have and that we’re not going to see PCE head higher.
TLDR
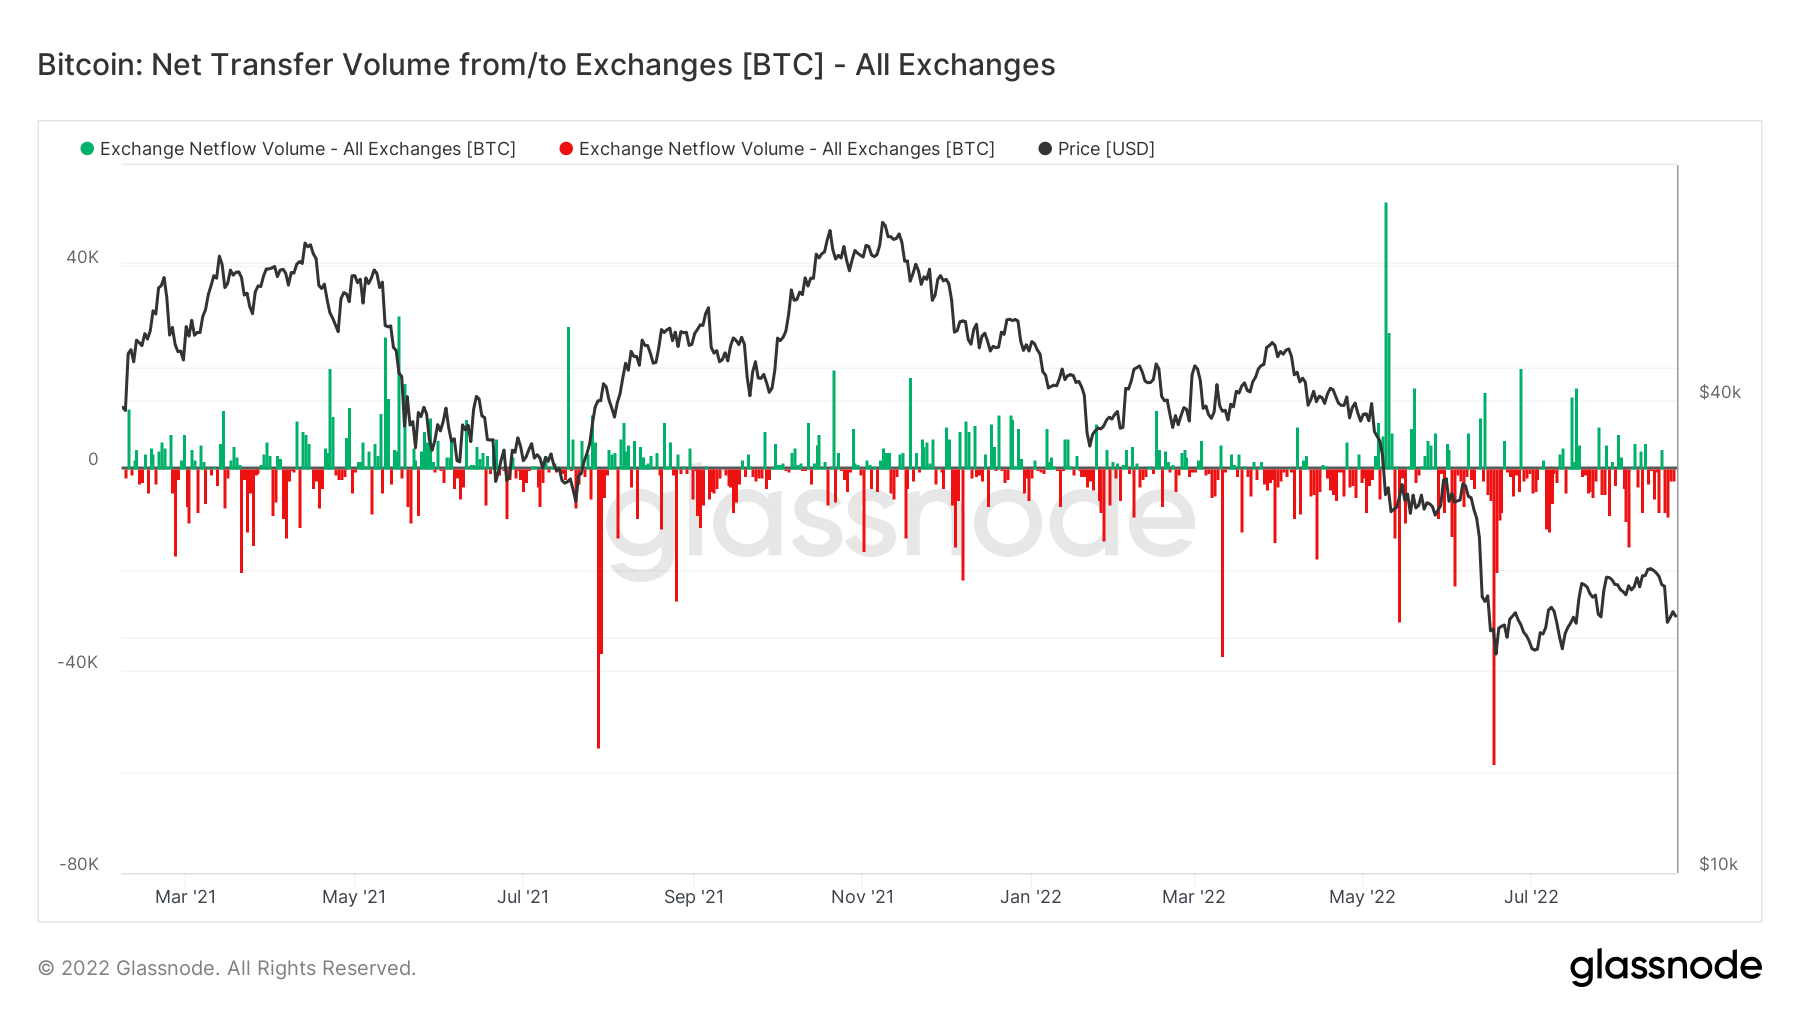
- The Exchange Netflow Volume still shows some outflows of Bitcoin from Exchanges, for Ether though, the outflows are far less and there have been stronger inflows of Ether to Exchanges (to be sold) recently.
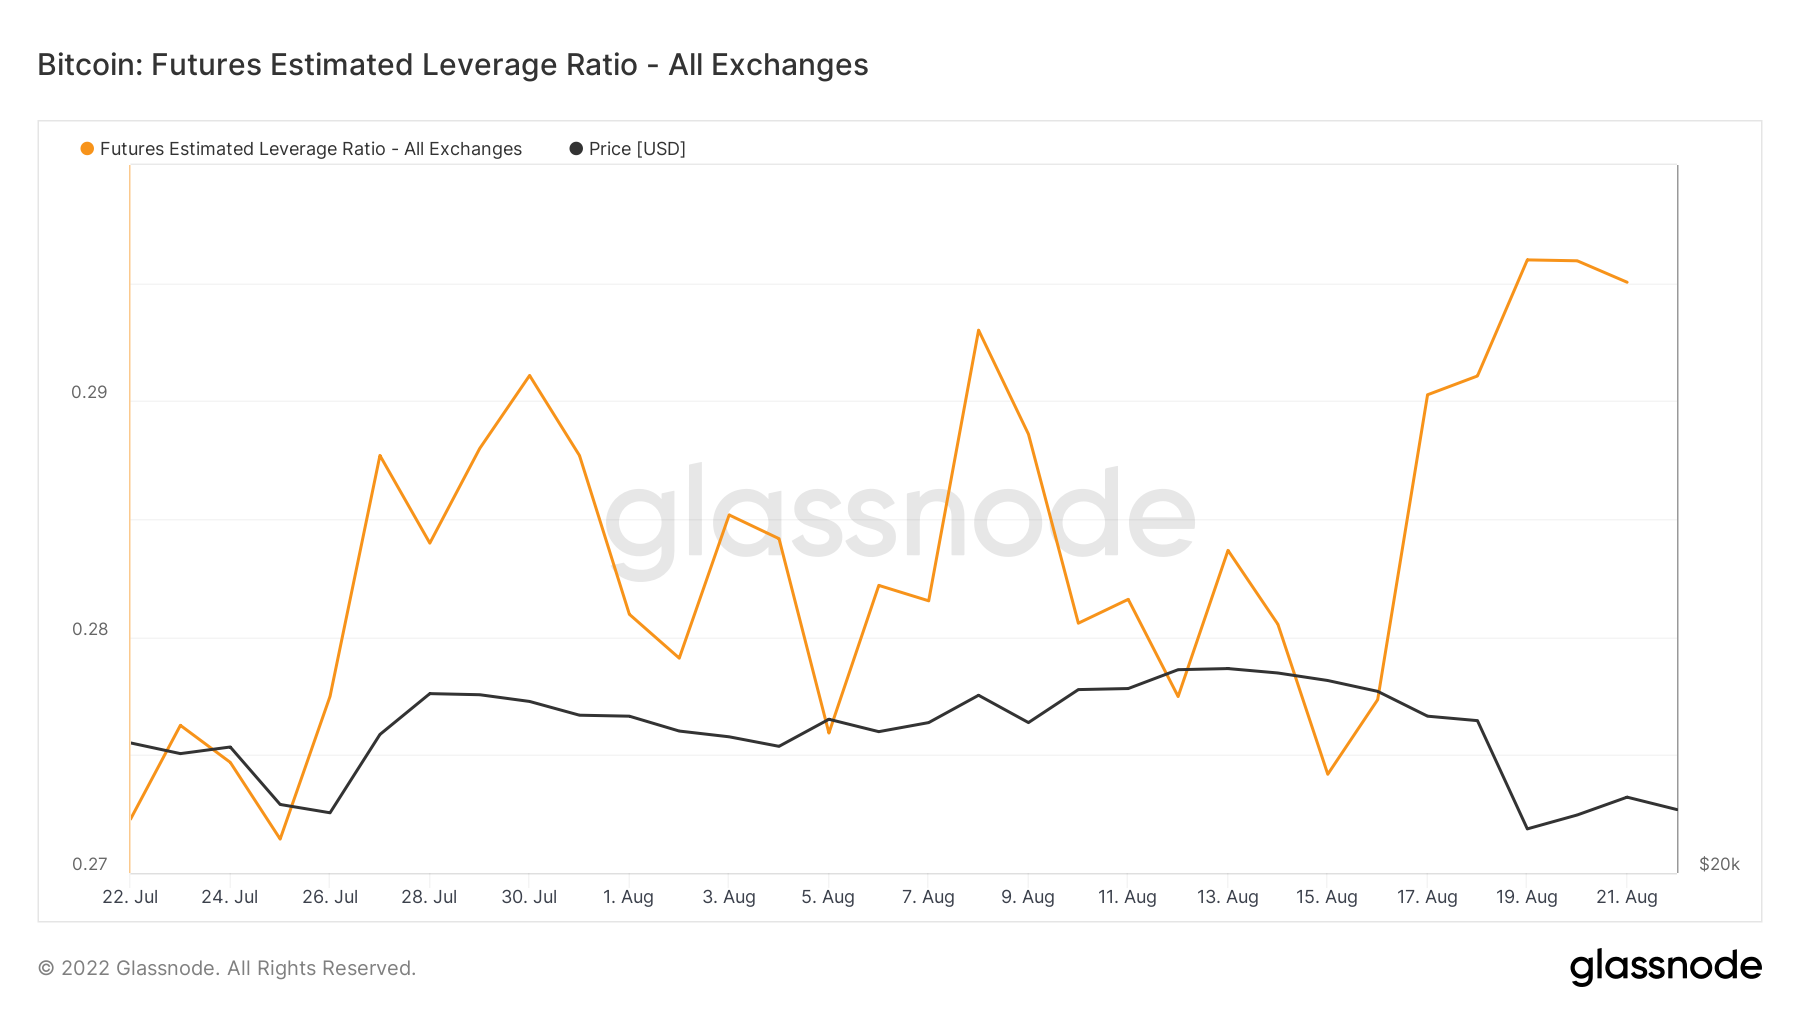
- The Futures Estimated Leverage Ratio currently sits at 0.295 (a healthy level is between 0.18 and 0.22), this therefore indicates a highly levered market and suggests that there may be some volatility on the horizon.
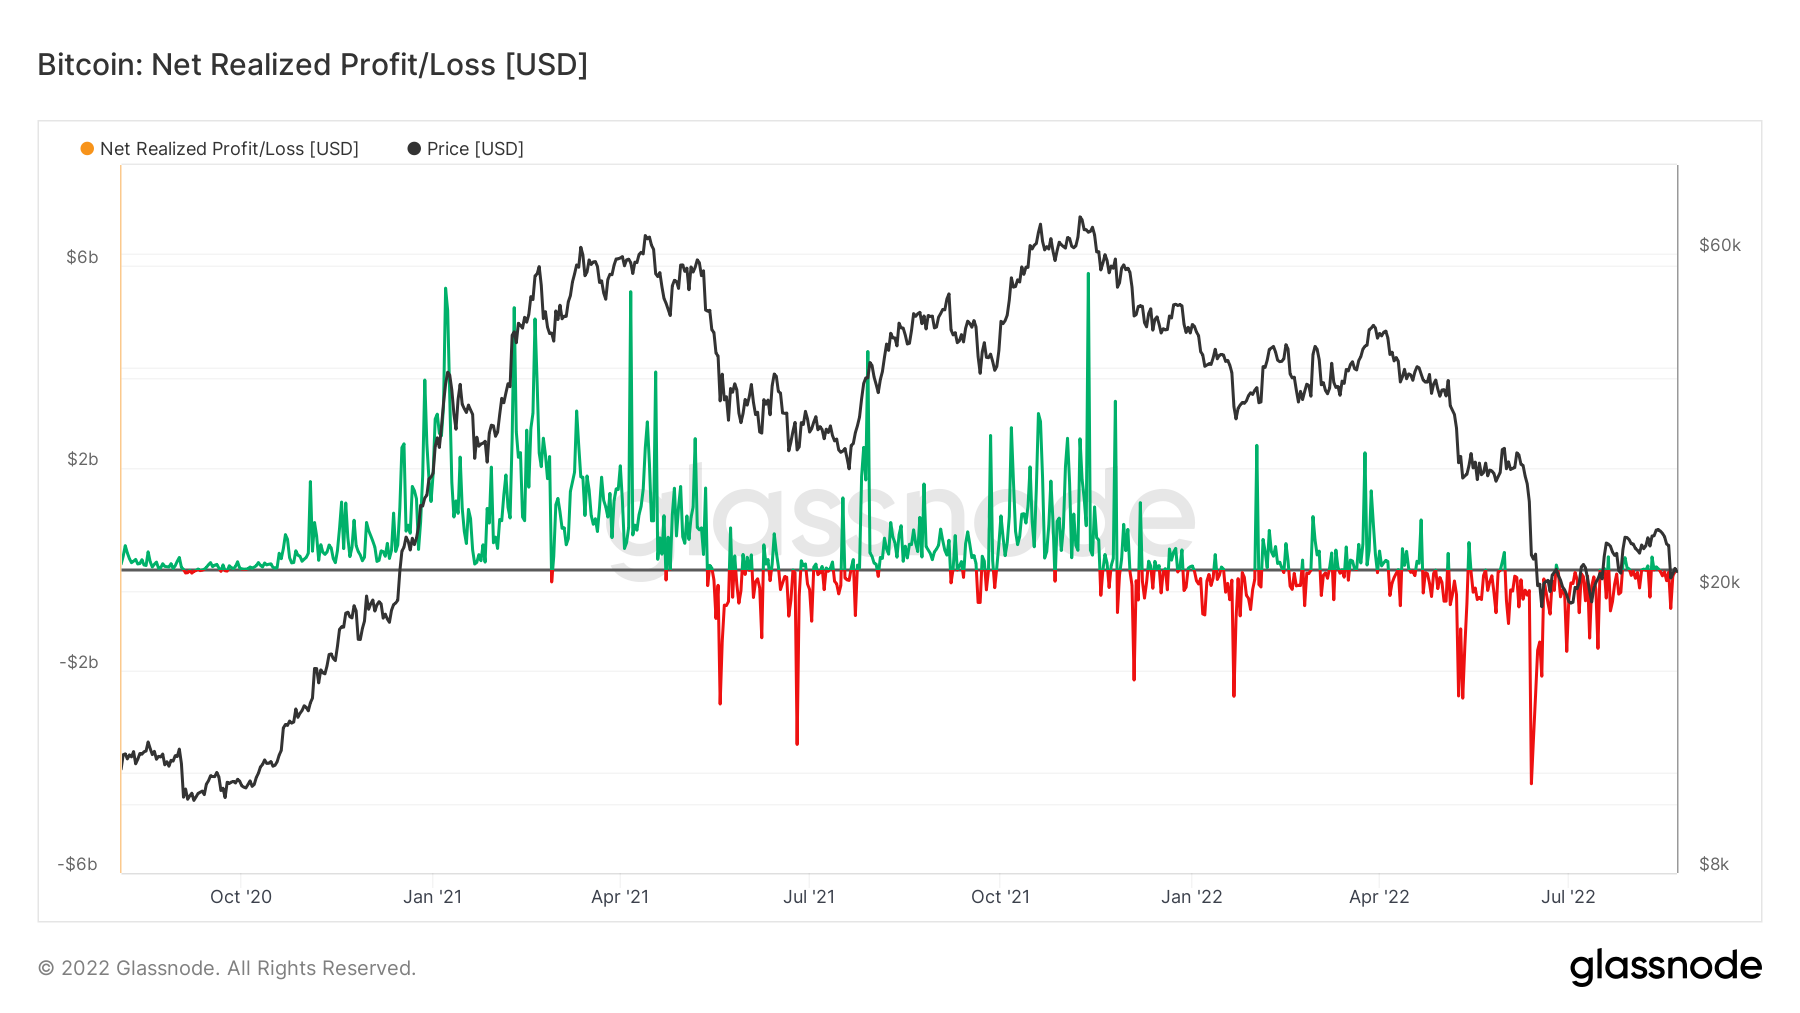
- The Net Realised Profit/Loss shows that investors are still lacking conviction to see higher prices and are selling coins into break-even levels – rather than waiting for higher prices to sell their coins in a profit.
- The mining metrics suggest that a miner capitulation is possibly over. This has previously happened and indicated macro bottoms being in – perhaps $18,000 was the bottom for BTC. However, these metrics could show suggest further downside.
Total Market Cap
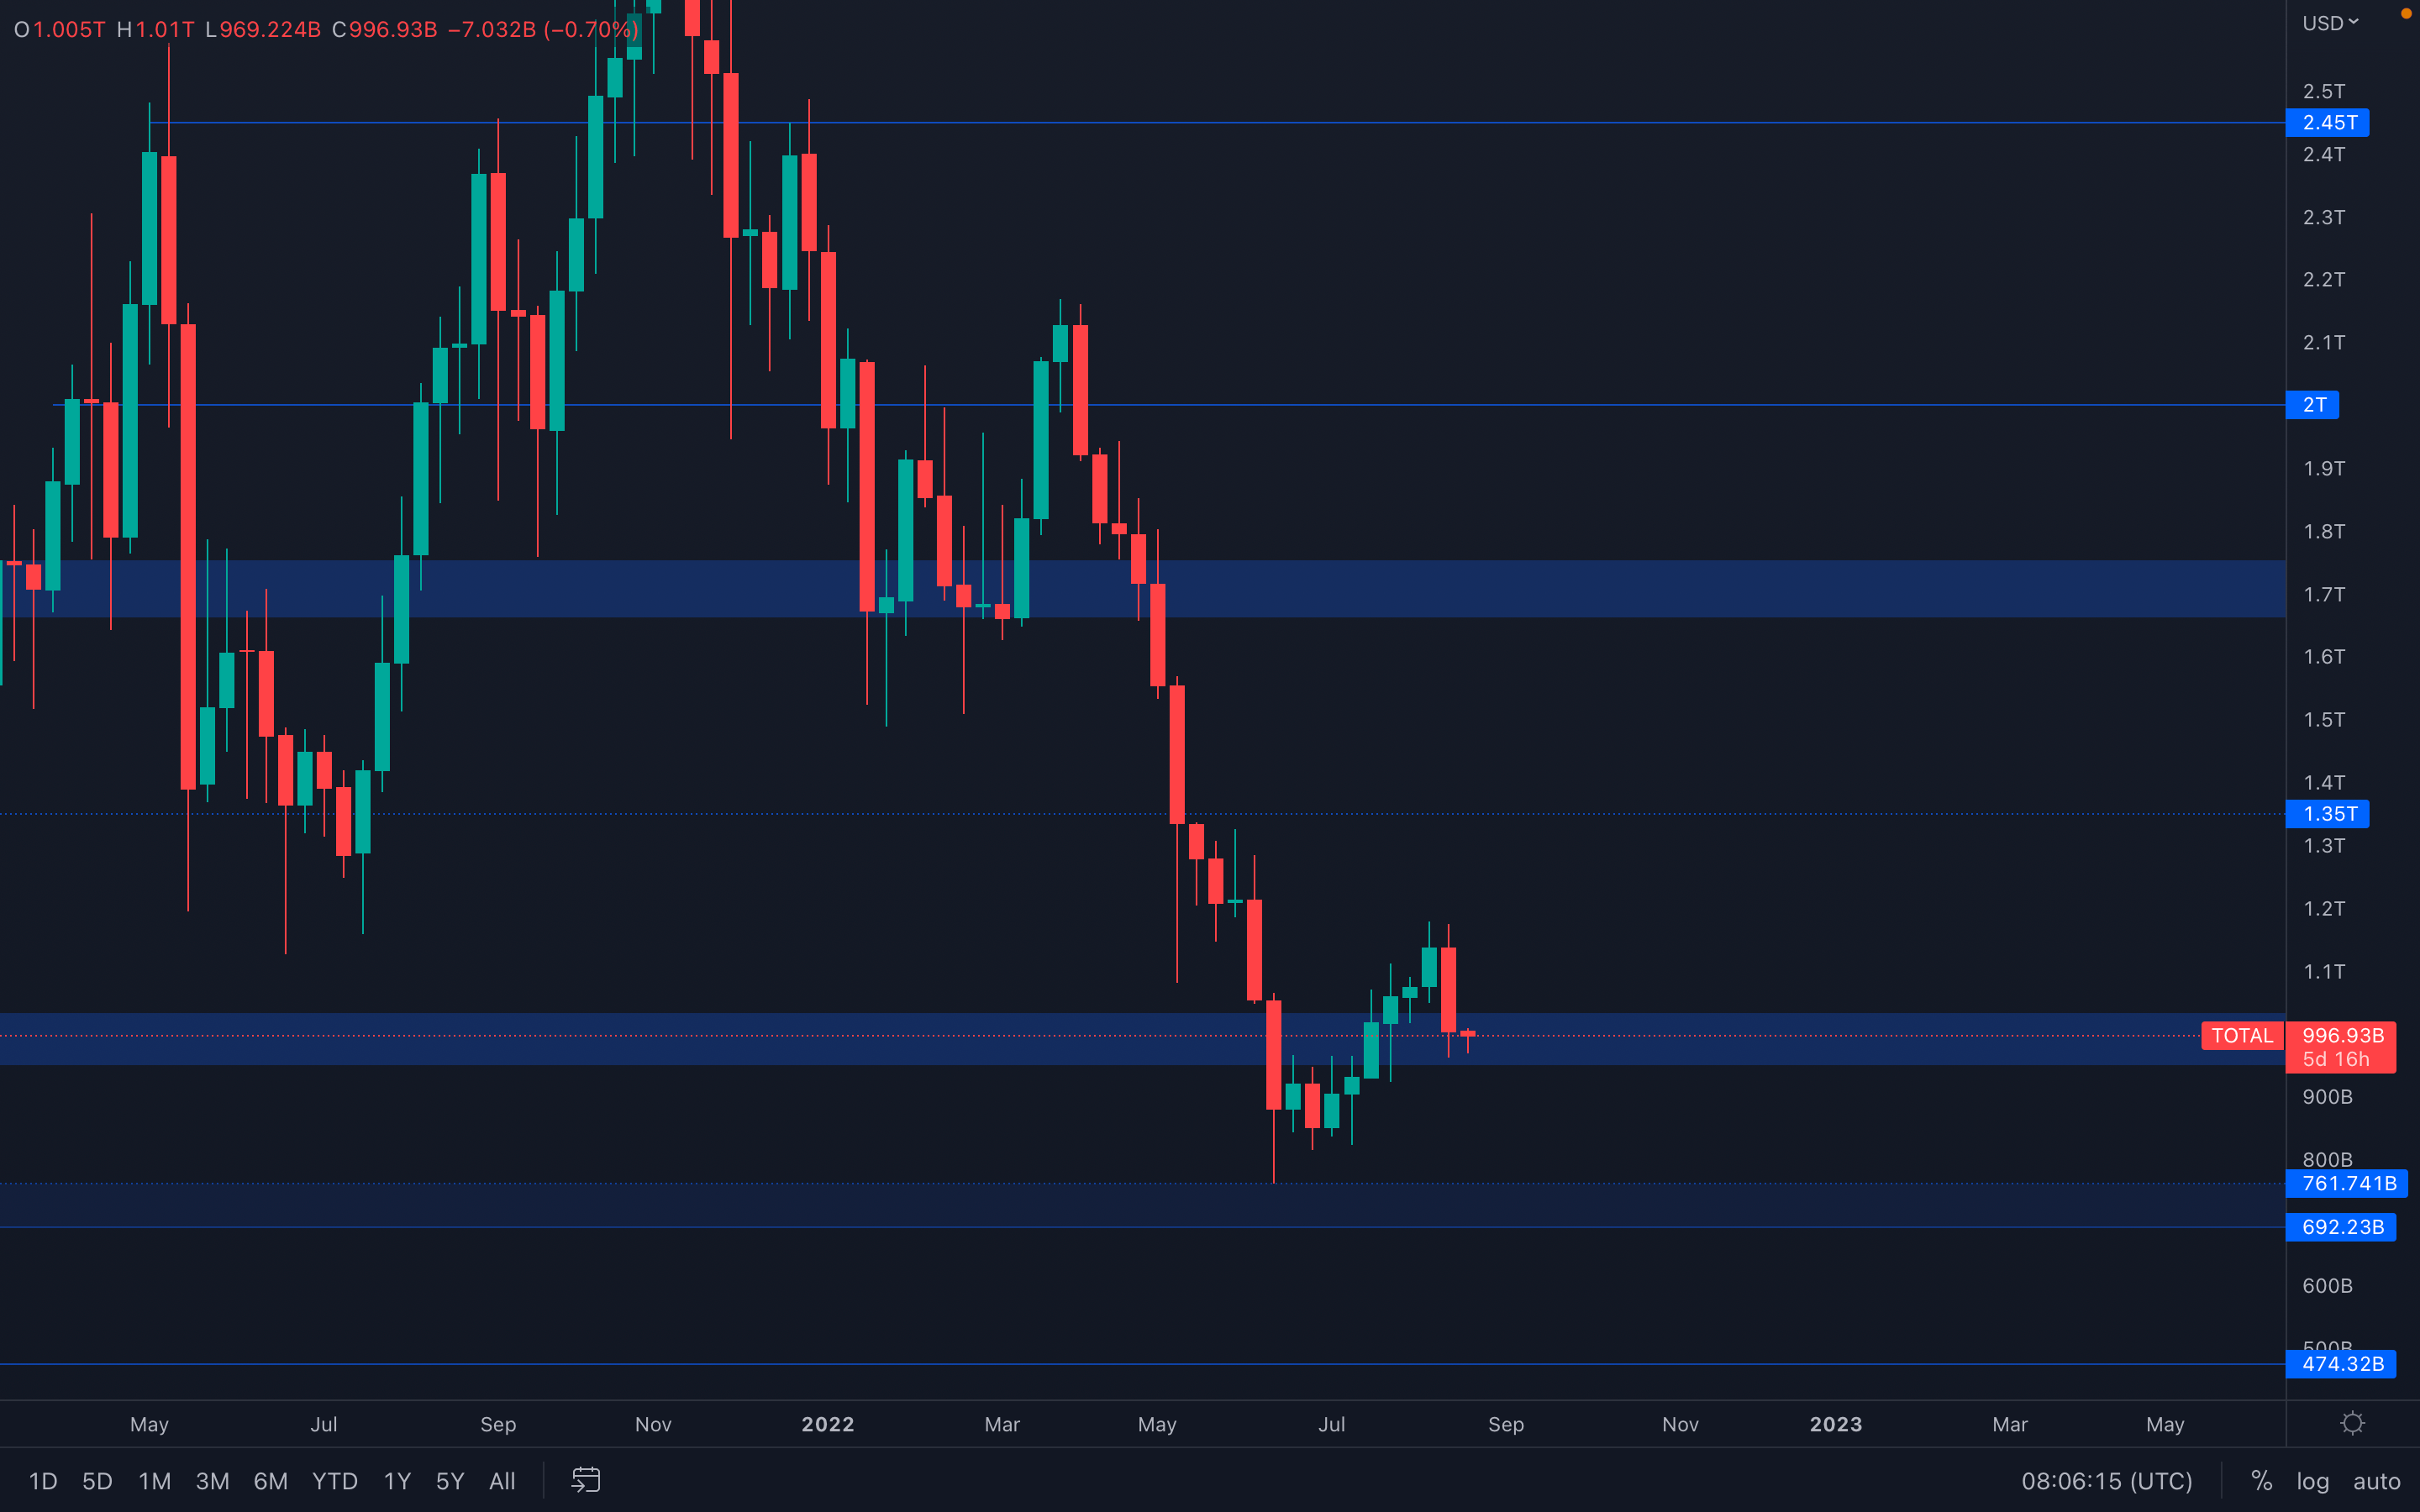 Last week, we mentioned the possibility of the Total Market Cap retesting its $1T level - and it happened. We now have a confirmed lower high on the weekly timeframe, which suggests a higher low can form, flipping the weekly market structure from bearish to bullish. In order for this to happen, it's best that the Total Market Cap successfully holds its $1T psychological and technical support area, as a loss of this area (sub $950B) will potentially lead towards a lower low on the weekly timeframe, somewhere around $700B.
For an easily understandable picture, holding $1T is necessary for further upside - losing $1T will lead to further downside.
Altcoins Market Cap
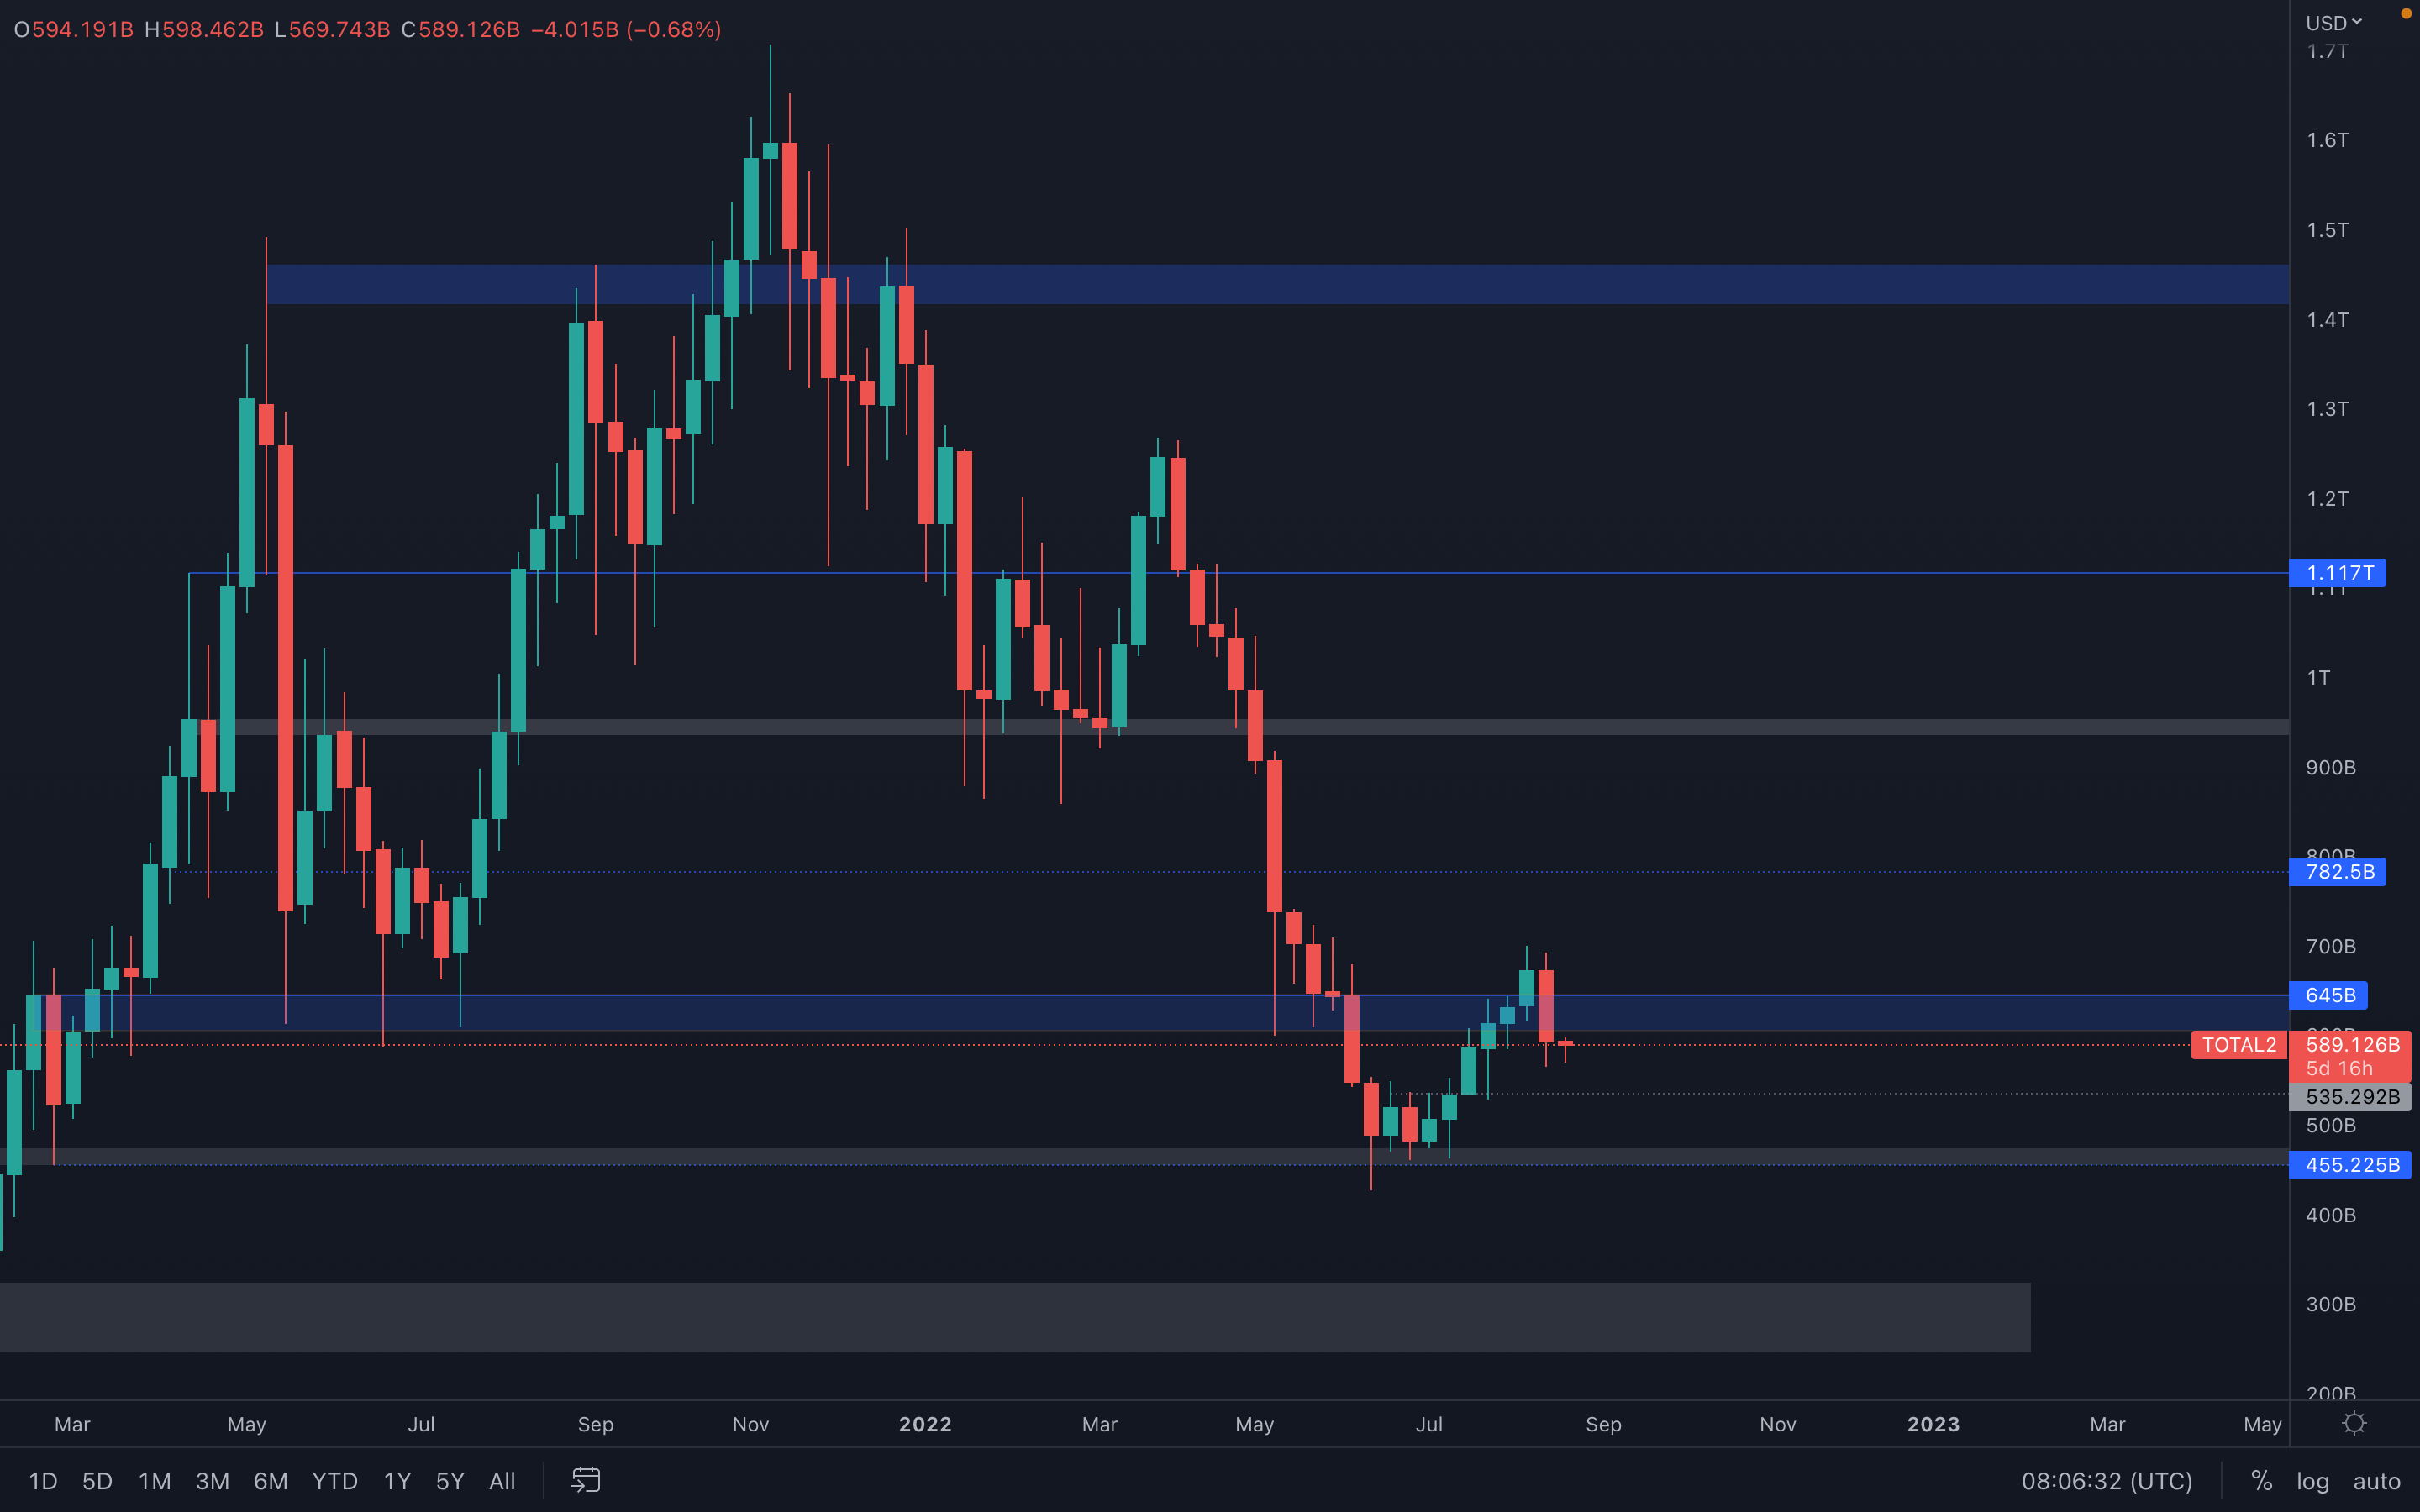 A bearish engulfing candle has been printed on the weekly timeframe, piercing through the $600B support level and closing below it. This index is now in a contradictorial state with the Total Market Cap, with one index at support (Total Market Cap) and one at resistance (Altcoins Market Cap).
From a technical standpoint, after losing the $600B level we now have a confirmation for a $535B test (intermediate support). A weekly reclaim of $600B will invalidate further downside for now.
Bitcoin - Technical & On-Chain Analysis
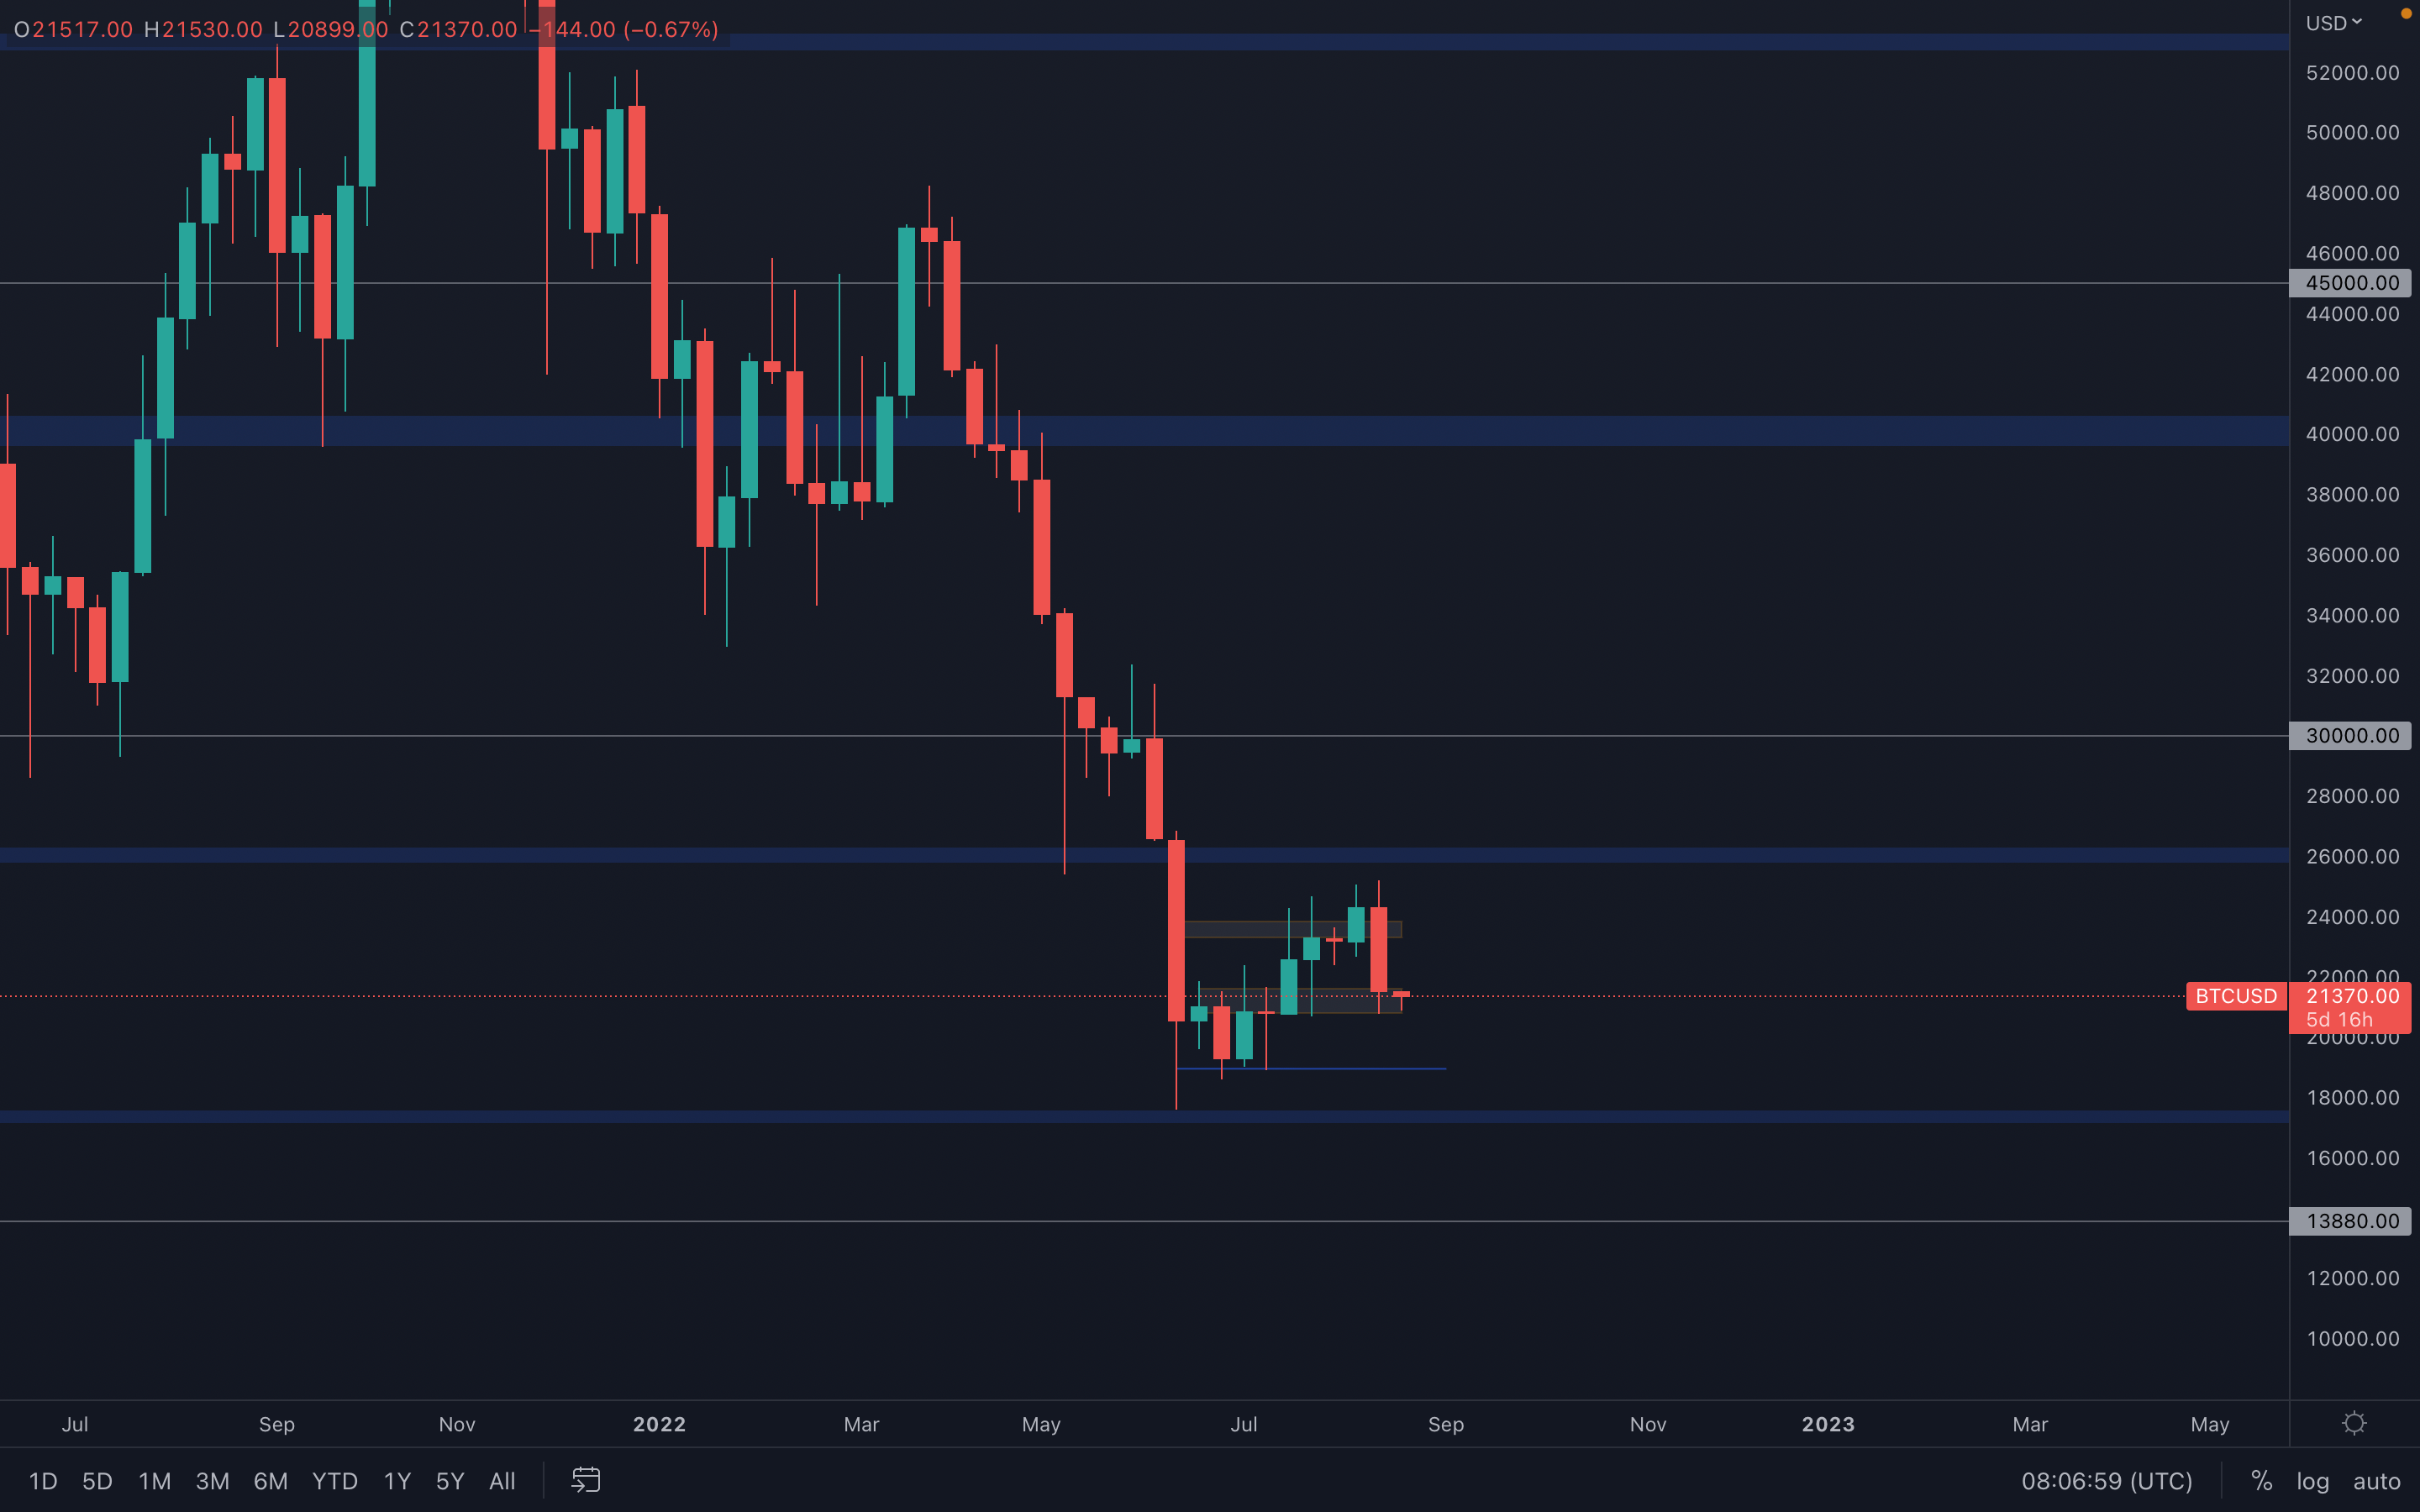 The price of Bitcoin was unable to reach its $26,000 resistance level and as a result of its sudden increased selling pressure, dropped to $21,000 in a matter of days. The ~$21,000 level acts as support on both daily and weekly timeframes and as of now, has been held perfectly. A loss of this level will push Bitcoin towards $19,000, where we ranged for multiple weeks between June and July.
However, if $21,000 is held successfully, then Bitcoin's current price action can hint towards a potential weekly change in market structures, from bearish to bullish. In order for this to be confirmed, Bitcoin needs to hold the $21,000 support level and bounce from it, printing a higher low. Of course, there's also the possibility that we could lose this level and head towards $19,000, but suggesting we will head towards new lows (under $19,000) remains a bit premature, as we don't actually have any data for this scenario yet.
Metric 1 – Exchange Netflow Volume
If we first begin by looking at the Exchange Netflow Volume, we can see that in the past month, the number of days where there have been Net outflows from Exchanges have been slightly greater than the number of days where there have been Net inflows. This still suggests that there is Net buying at these price levels.
Bitcoin – Exchange Netflow Volume
Metric 2 – Futures Estimated Leverage Ratio
When looking at the Futures Estimated Leverage Ratio, we are looking to see if the ratio is high. If the ratio is high, then this may indicate that there is a lot of leverage and that this may be needed to be flushed out, potentially causing a volatile move. Usually, a sign of a healthy leverage ratio is between 0.18 and 0.22. Currently, the leverage ratio is at 0.295. This would indicate that there is a lot of leverage built up and therefore we could be vulnerable to a nasty move.
Bitcoin – Futures Estimated Leverage Ratio
Metric 3 – Net Realised Profit/Loss
One of the best metrics for assessing sentiment in a bear market is the Net Realised Profit/Loss. What this metric does is it visualises when investors are ‘realising’ (taking) profits or losses. In a bear market, it is common to see investors have little conviction that prices will go higher. So, when the price is below that investors ‘realised price’ (break-even level), they often hope that the price will go back to their entry level, so that they can sell their coins and exit the market.
On the below graph, green spikes are points at which investors have realised profits, the bigger the spike, the bigger the profits realised (in USD terms). The opposite can be said for losses with regards the red spikes. In mid and late-stage bear markets, this metric shows that it becomes very apparent when investors' conviction for higher prices is low. For instance, when we see red spikes and then a return to the black horizontal break-even line, this metric can’t get above the black break-even line. This is due to investors selling into break-even and not having the conviction to wait for higher prices as they’re not confident in the current market.
Bitcoin – Net Realised Profit/Loss
Metric 4 – Hash Ribbon and Difficulty Ribbon
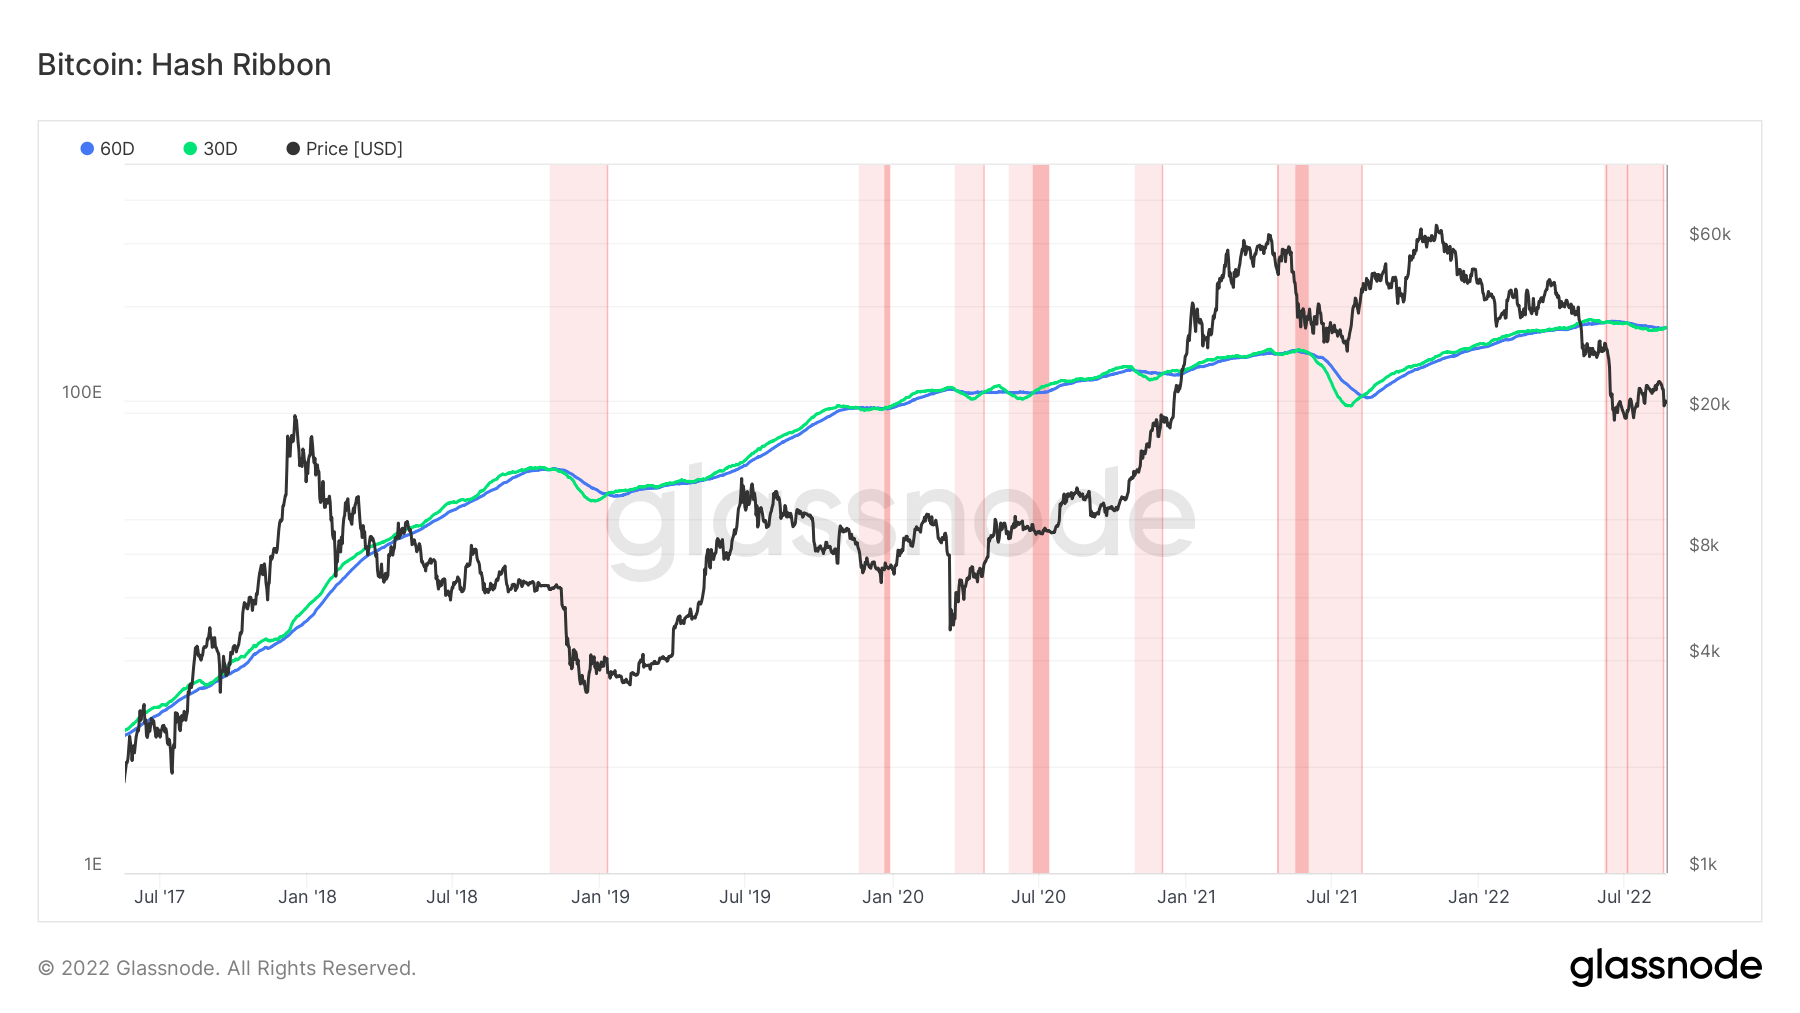
The last set of metrics we will cover today are from the mining cohort. Miner capitulations have often signaled to be late-stage bear market events.
If we first look at the Hash Ribbon, we can see that the 30D MA is beginning to cross back above the 60D MA. This may be signaling to us that the miner capitulation is over, however, if prices do go lower, we may see this turn down again, so it’s important to keep monitoring this metric.
Bitcoin – Hash Ribbon
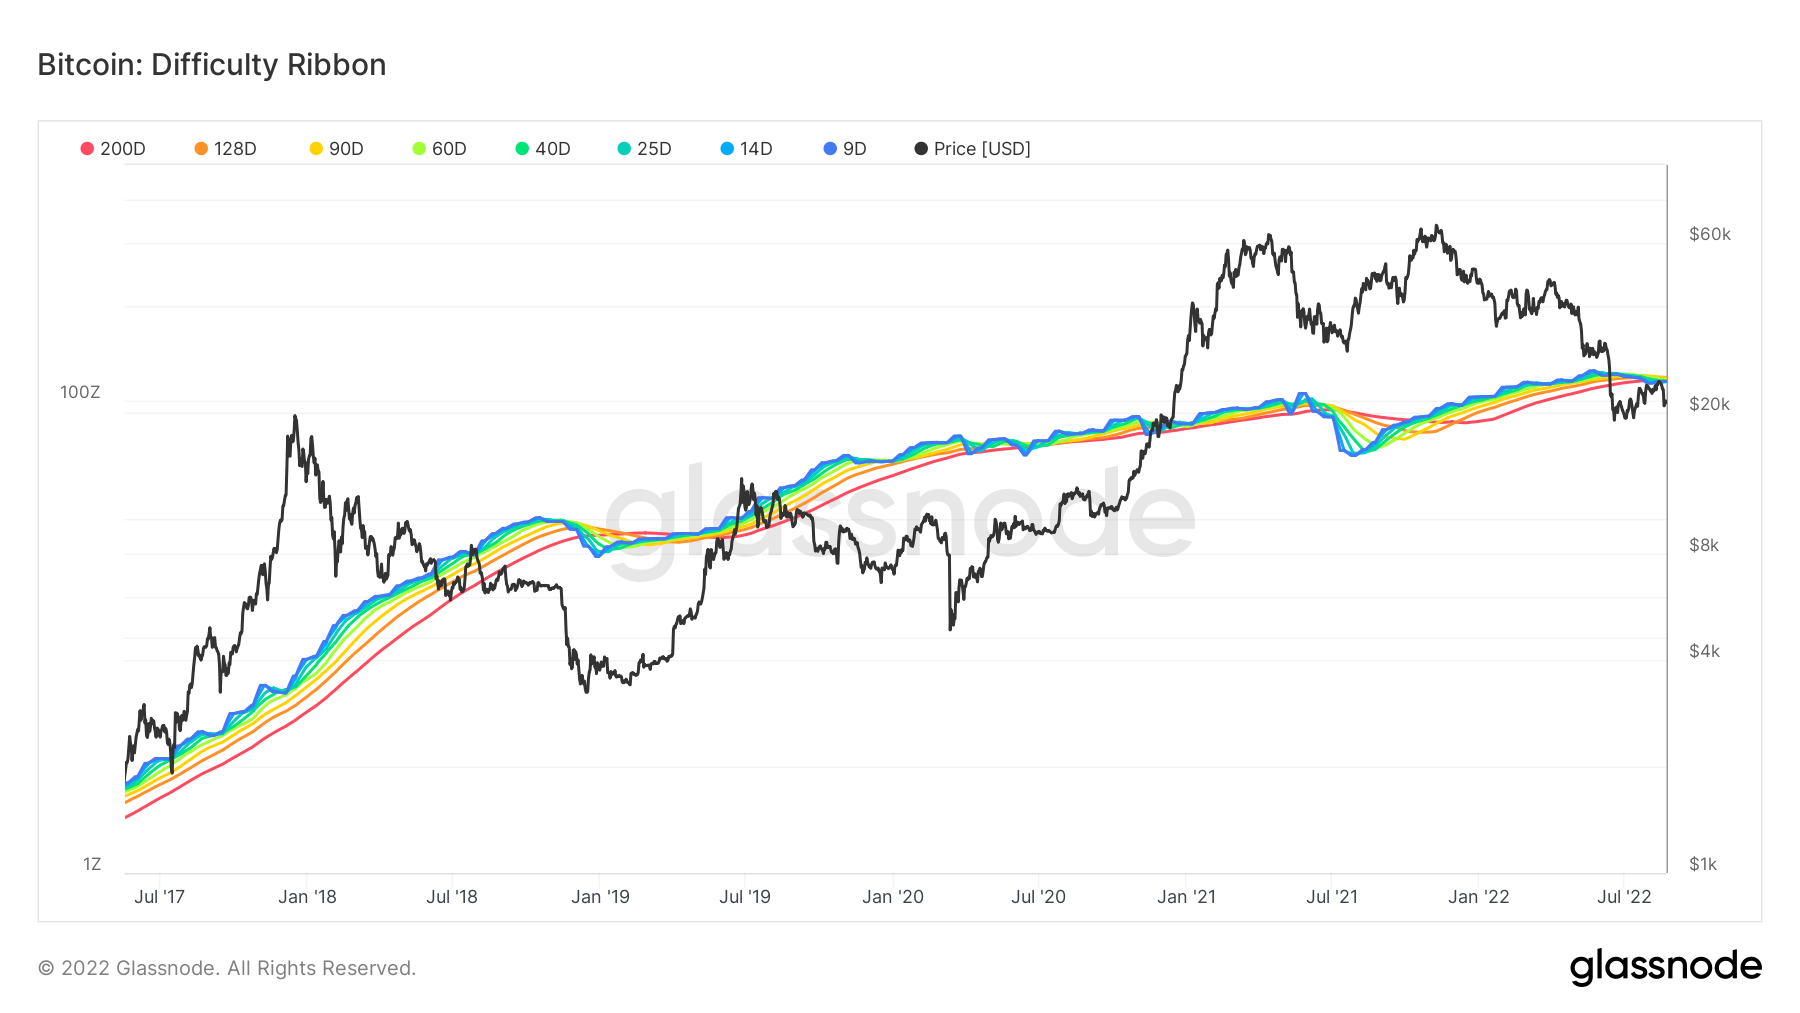
If we now move onto the Difficulty Ribbon, we can see that the 9D MA has begun to turn up again and overlap the other MA’s, similar to what it did in the summer of 2021 and Q4 of 2018 – both were macro bottoms.
Bitcoin – Difficulty Ribbon
 We can see in the above graph that in prior Hash Ribbon bottoms, we have seen a far greater disparity between the 30D MA and the 60D MA. So, it is potentially not the bottom yet but again, this is another key metric we have to watch over the coming weeks. If the Bitcoin price were to go lower, we may see the 30D MA turn lower once again and put in a new low.
S&P 500 Index
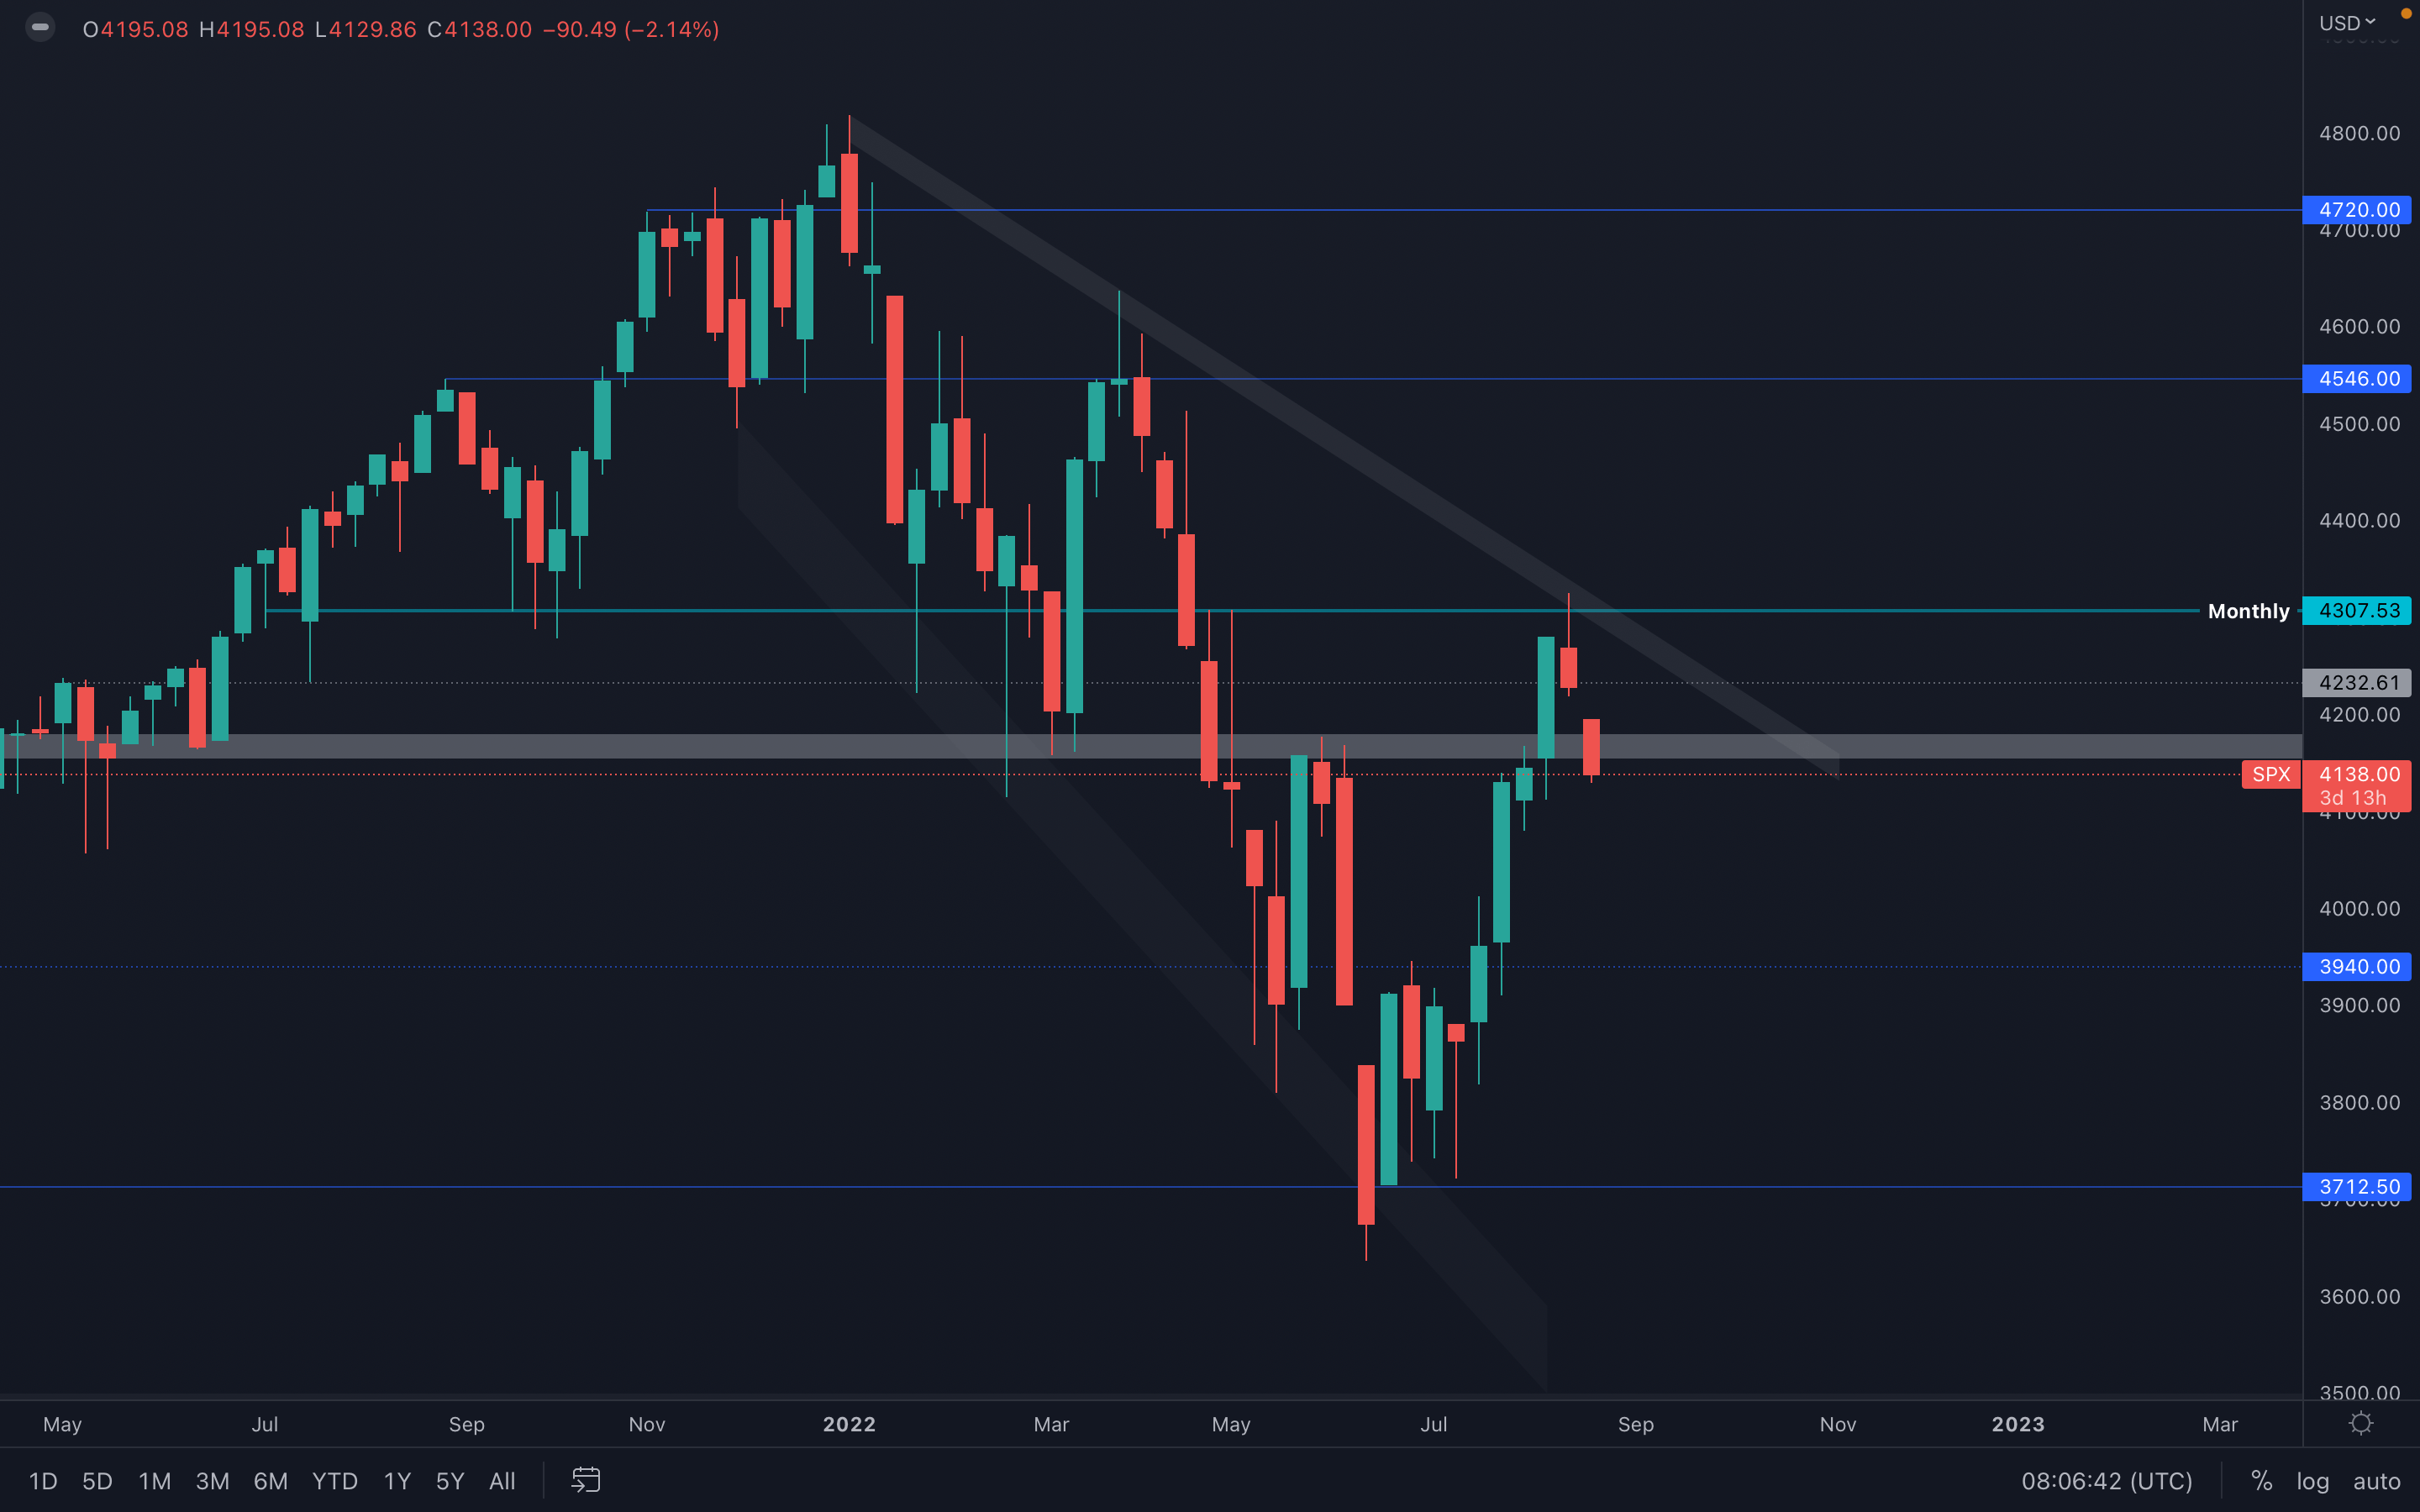 We're going to include the S&P 500 Index as a standard chart in our weekly reports from now on, as the correlation between the index and the crypto market has been strong for a while.
Last week, we mentioned the possibility of a $4300 rejection which has occurred, and the crypto market has reacted negatively. It seems the index has dropped under its $4275 - $4250 support area, but we have no weekly closure to confirm a loss of this level yet. If this week closes under $4250, then $3940 is on the cards which will obviously affect the crypto market in a negative way, pushing it towards $19,000. On the other hand, if this level is held perfectly, then a push towards $4300 and higher is on the cards
One important thing to mention is that the S&P 500 Index is already about to change its market structure after printing a higher high at $4300 last week - the only thing that's needed is a higher low. We'll carefully monitor this potential change over the next few weeks and keep you updated.
Ether - Technical & On-Chain Analysis
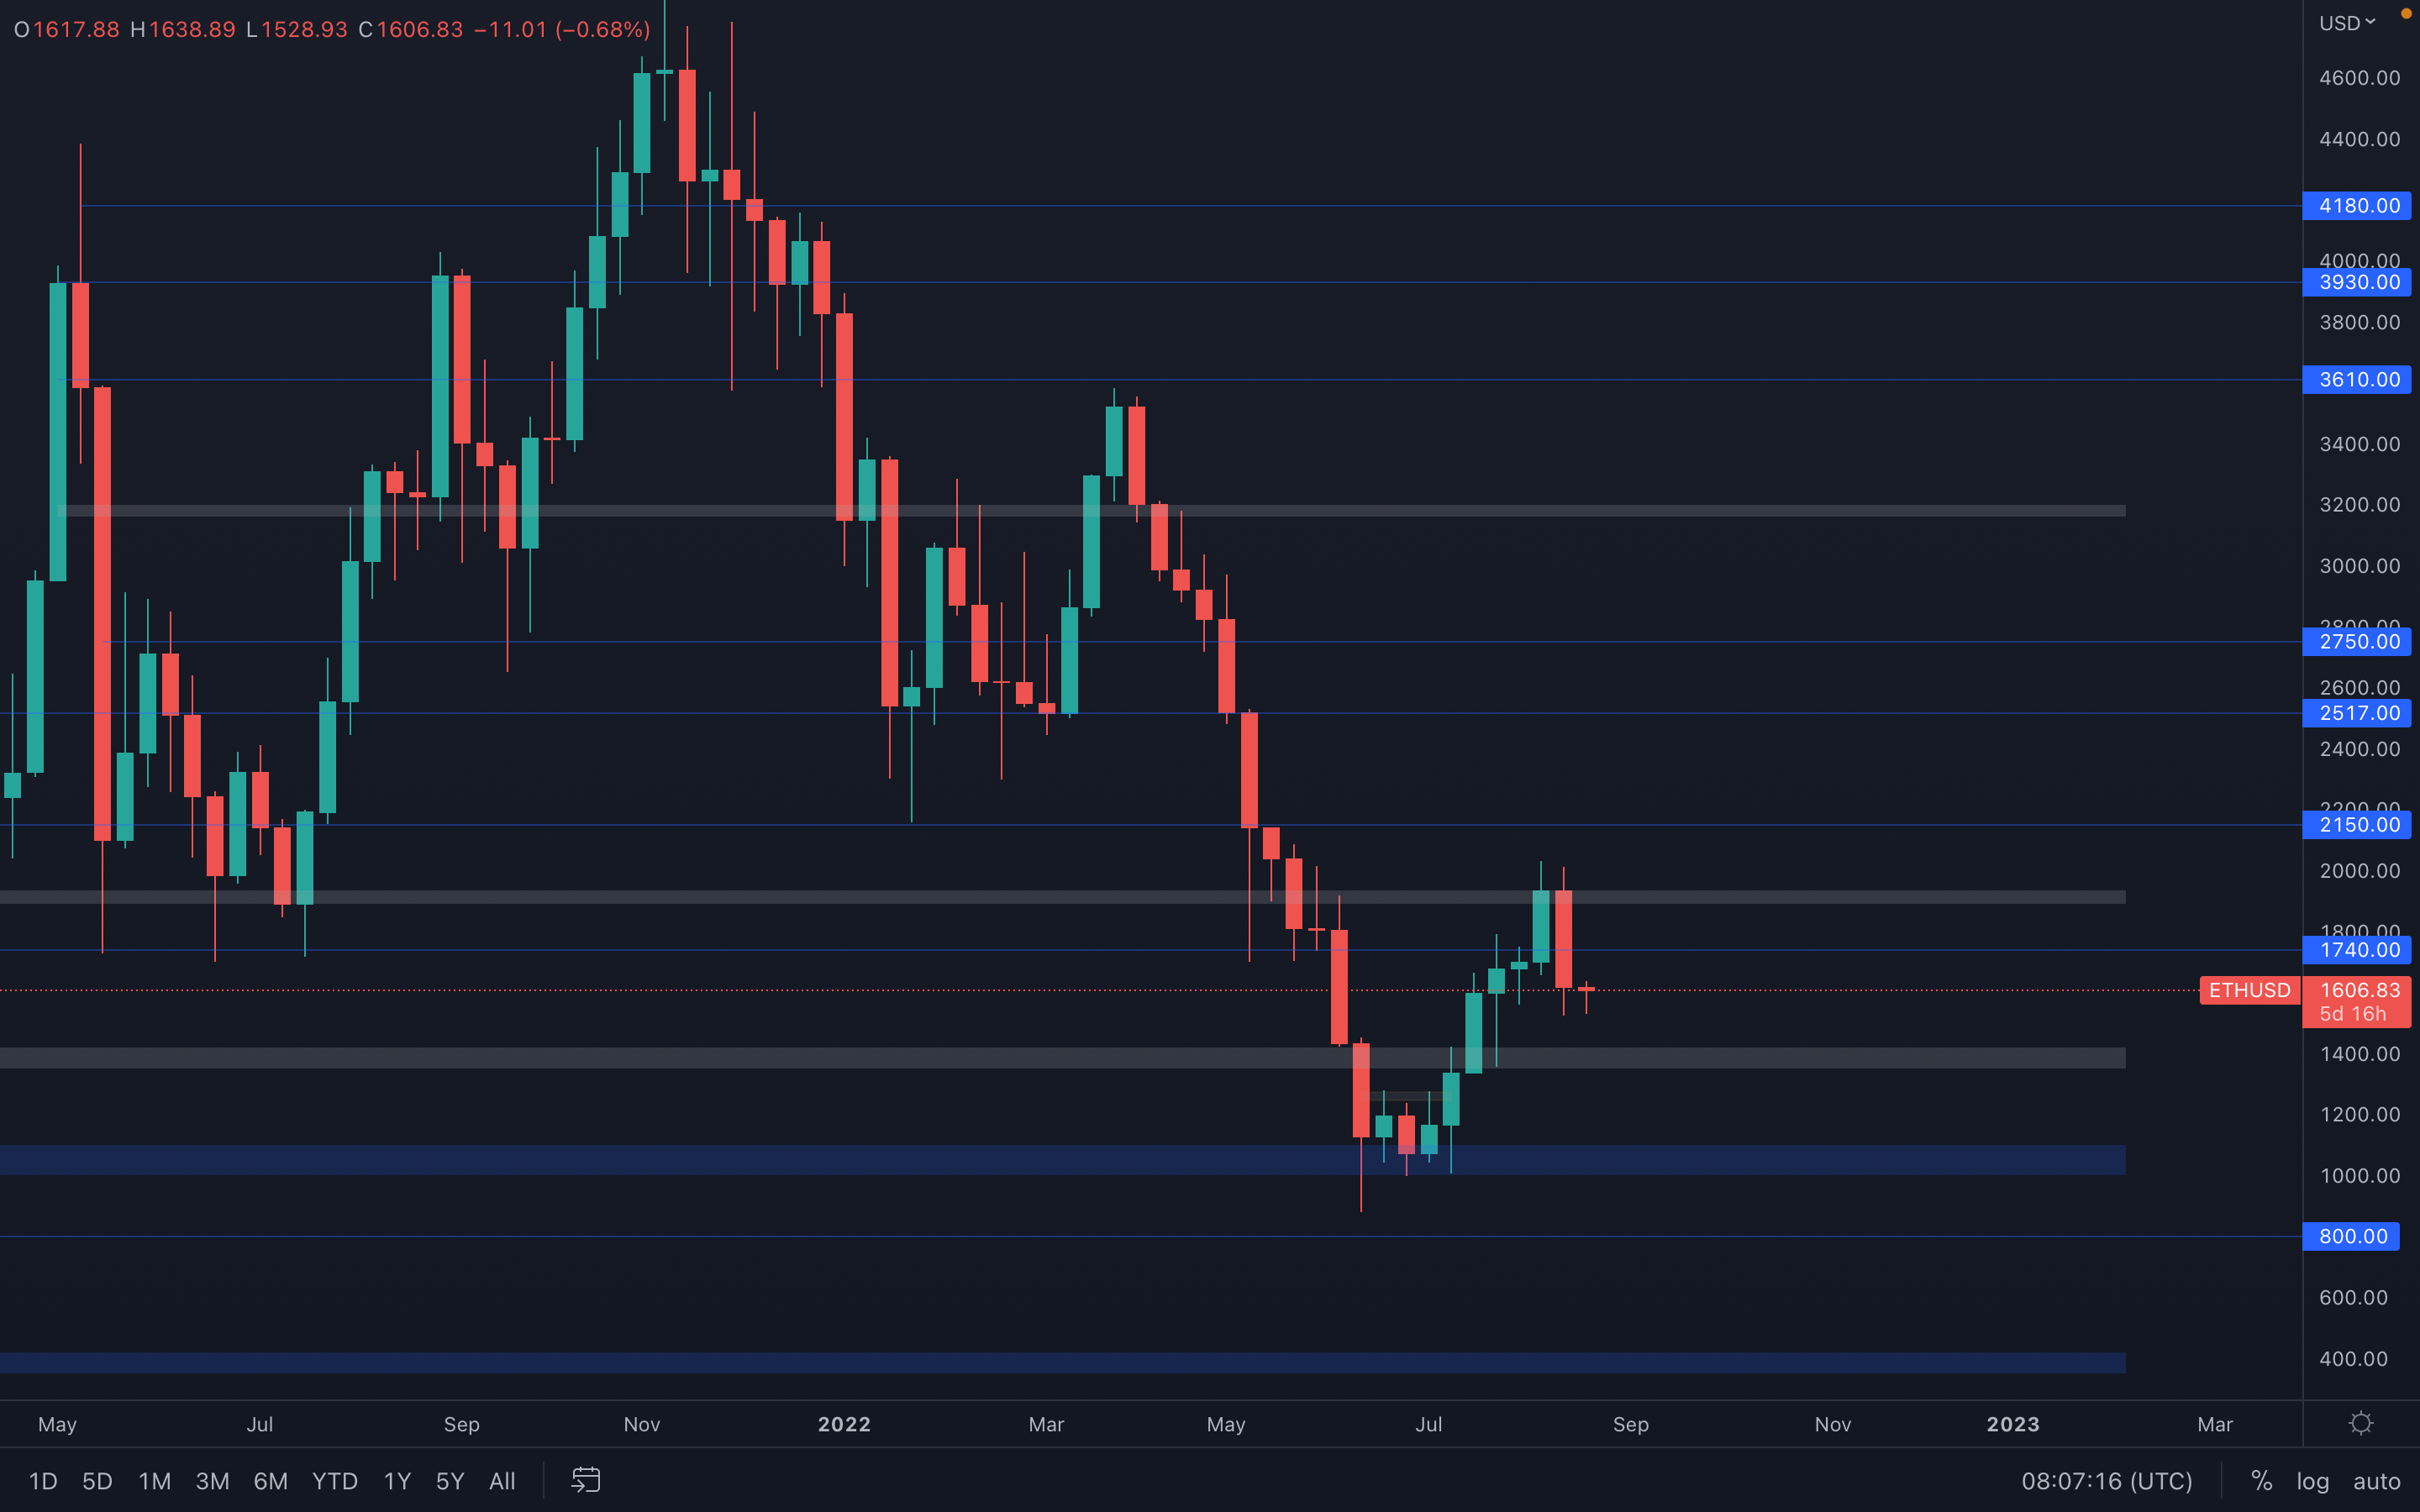 Clear rejection from Ether's $1900 level, confirmed by a bearish engulfing candle on the weekly timeframe. The $1740 level has already been lost, pushing the major towards a local support area around $1600 (check our daily analysis for context). Although this level can't be categorized as a strong area of interest, as long as the price of Ether remains above $1600, then a $1740 test is on the cards.
We also cannot ignore the weekly bearish engulfing candle printed last week, which makes the situation as simple as possible - sellers have regained control, which suggests a $1500 test is also on the cards. We now need to wait for the price to choose a direction and react accordingly.
Metric 1 – Exchange Netflow Volume
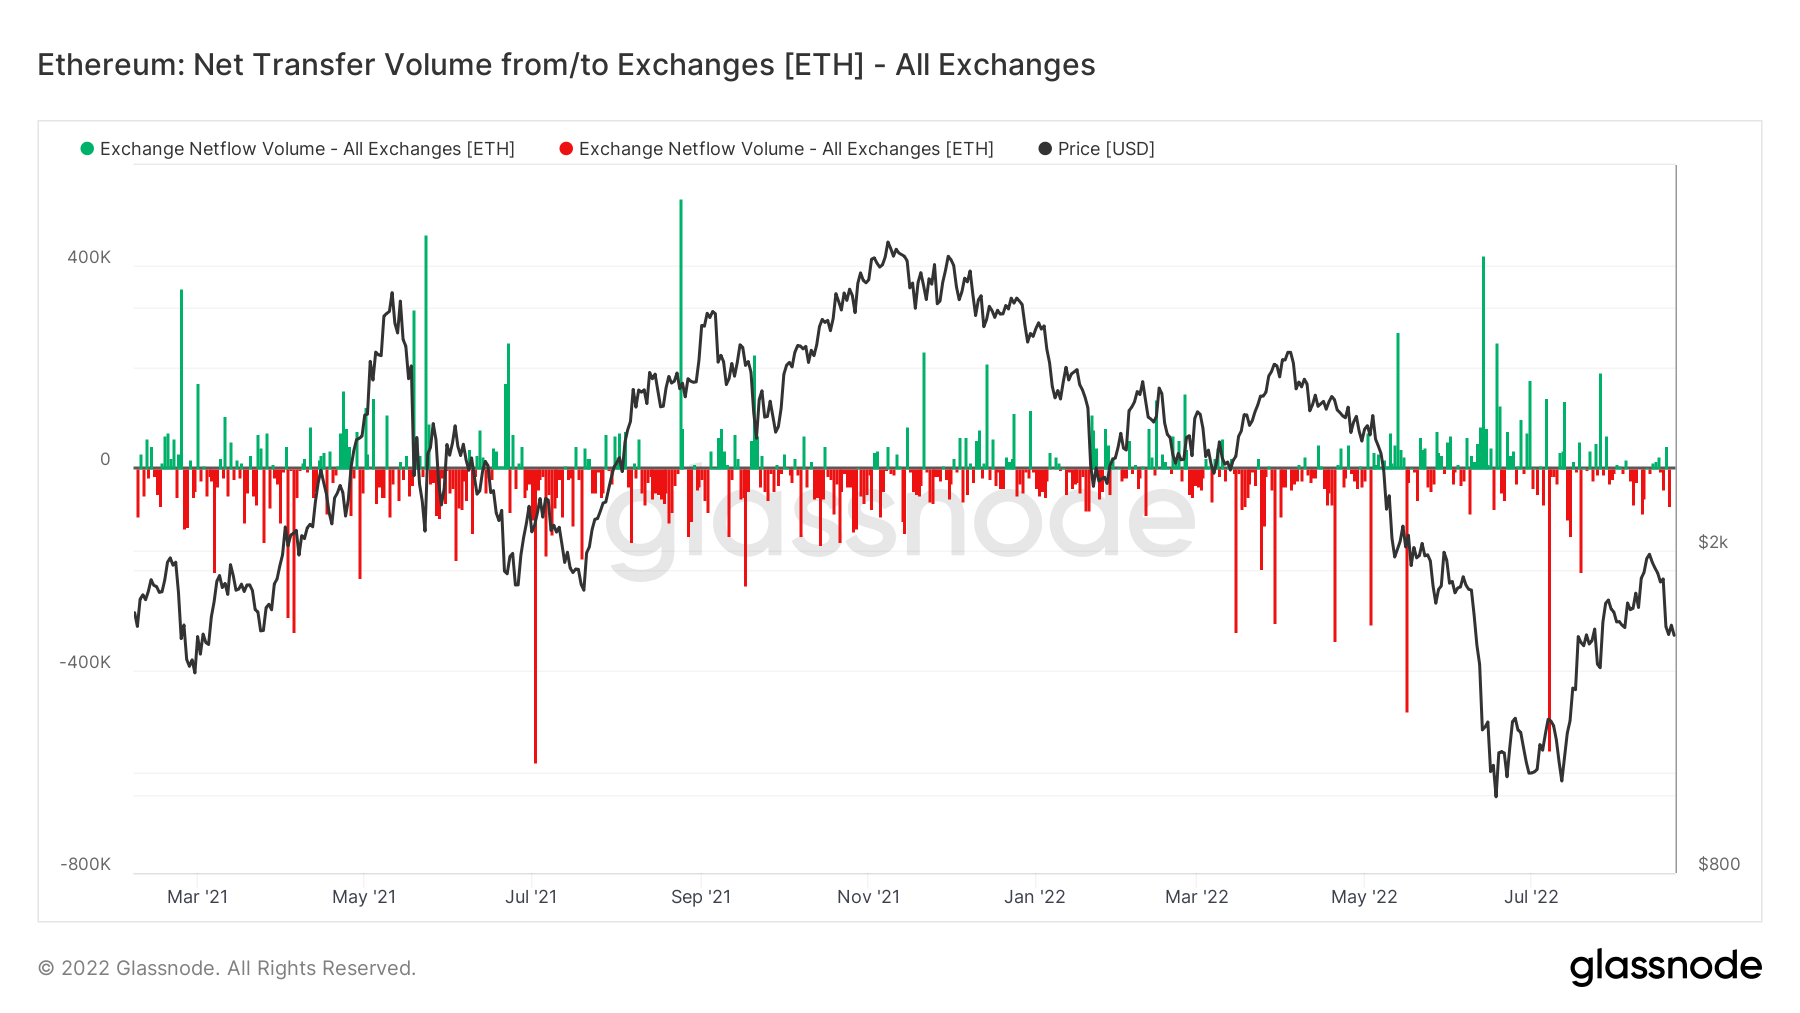
If we look at the same metric but for Ether, we can see that other than one day where there was a large amount of Ether that flowed out from Exchanges, in the majority, inflows of Ether to Exchanges have outweighed outflows from Exchanges.
Ether – Exchange Netflow Volume
DOT
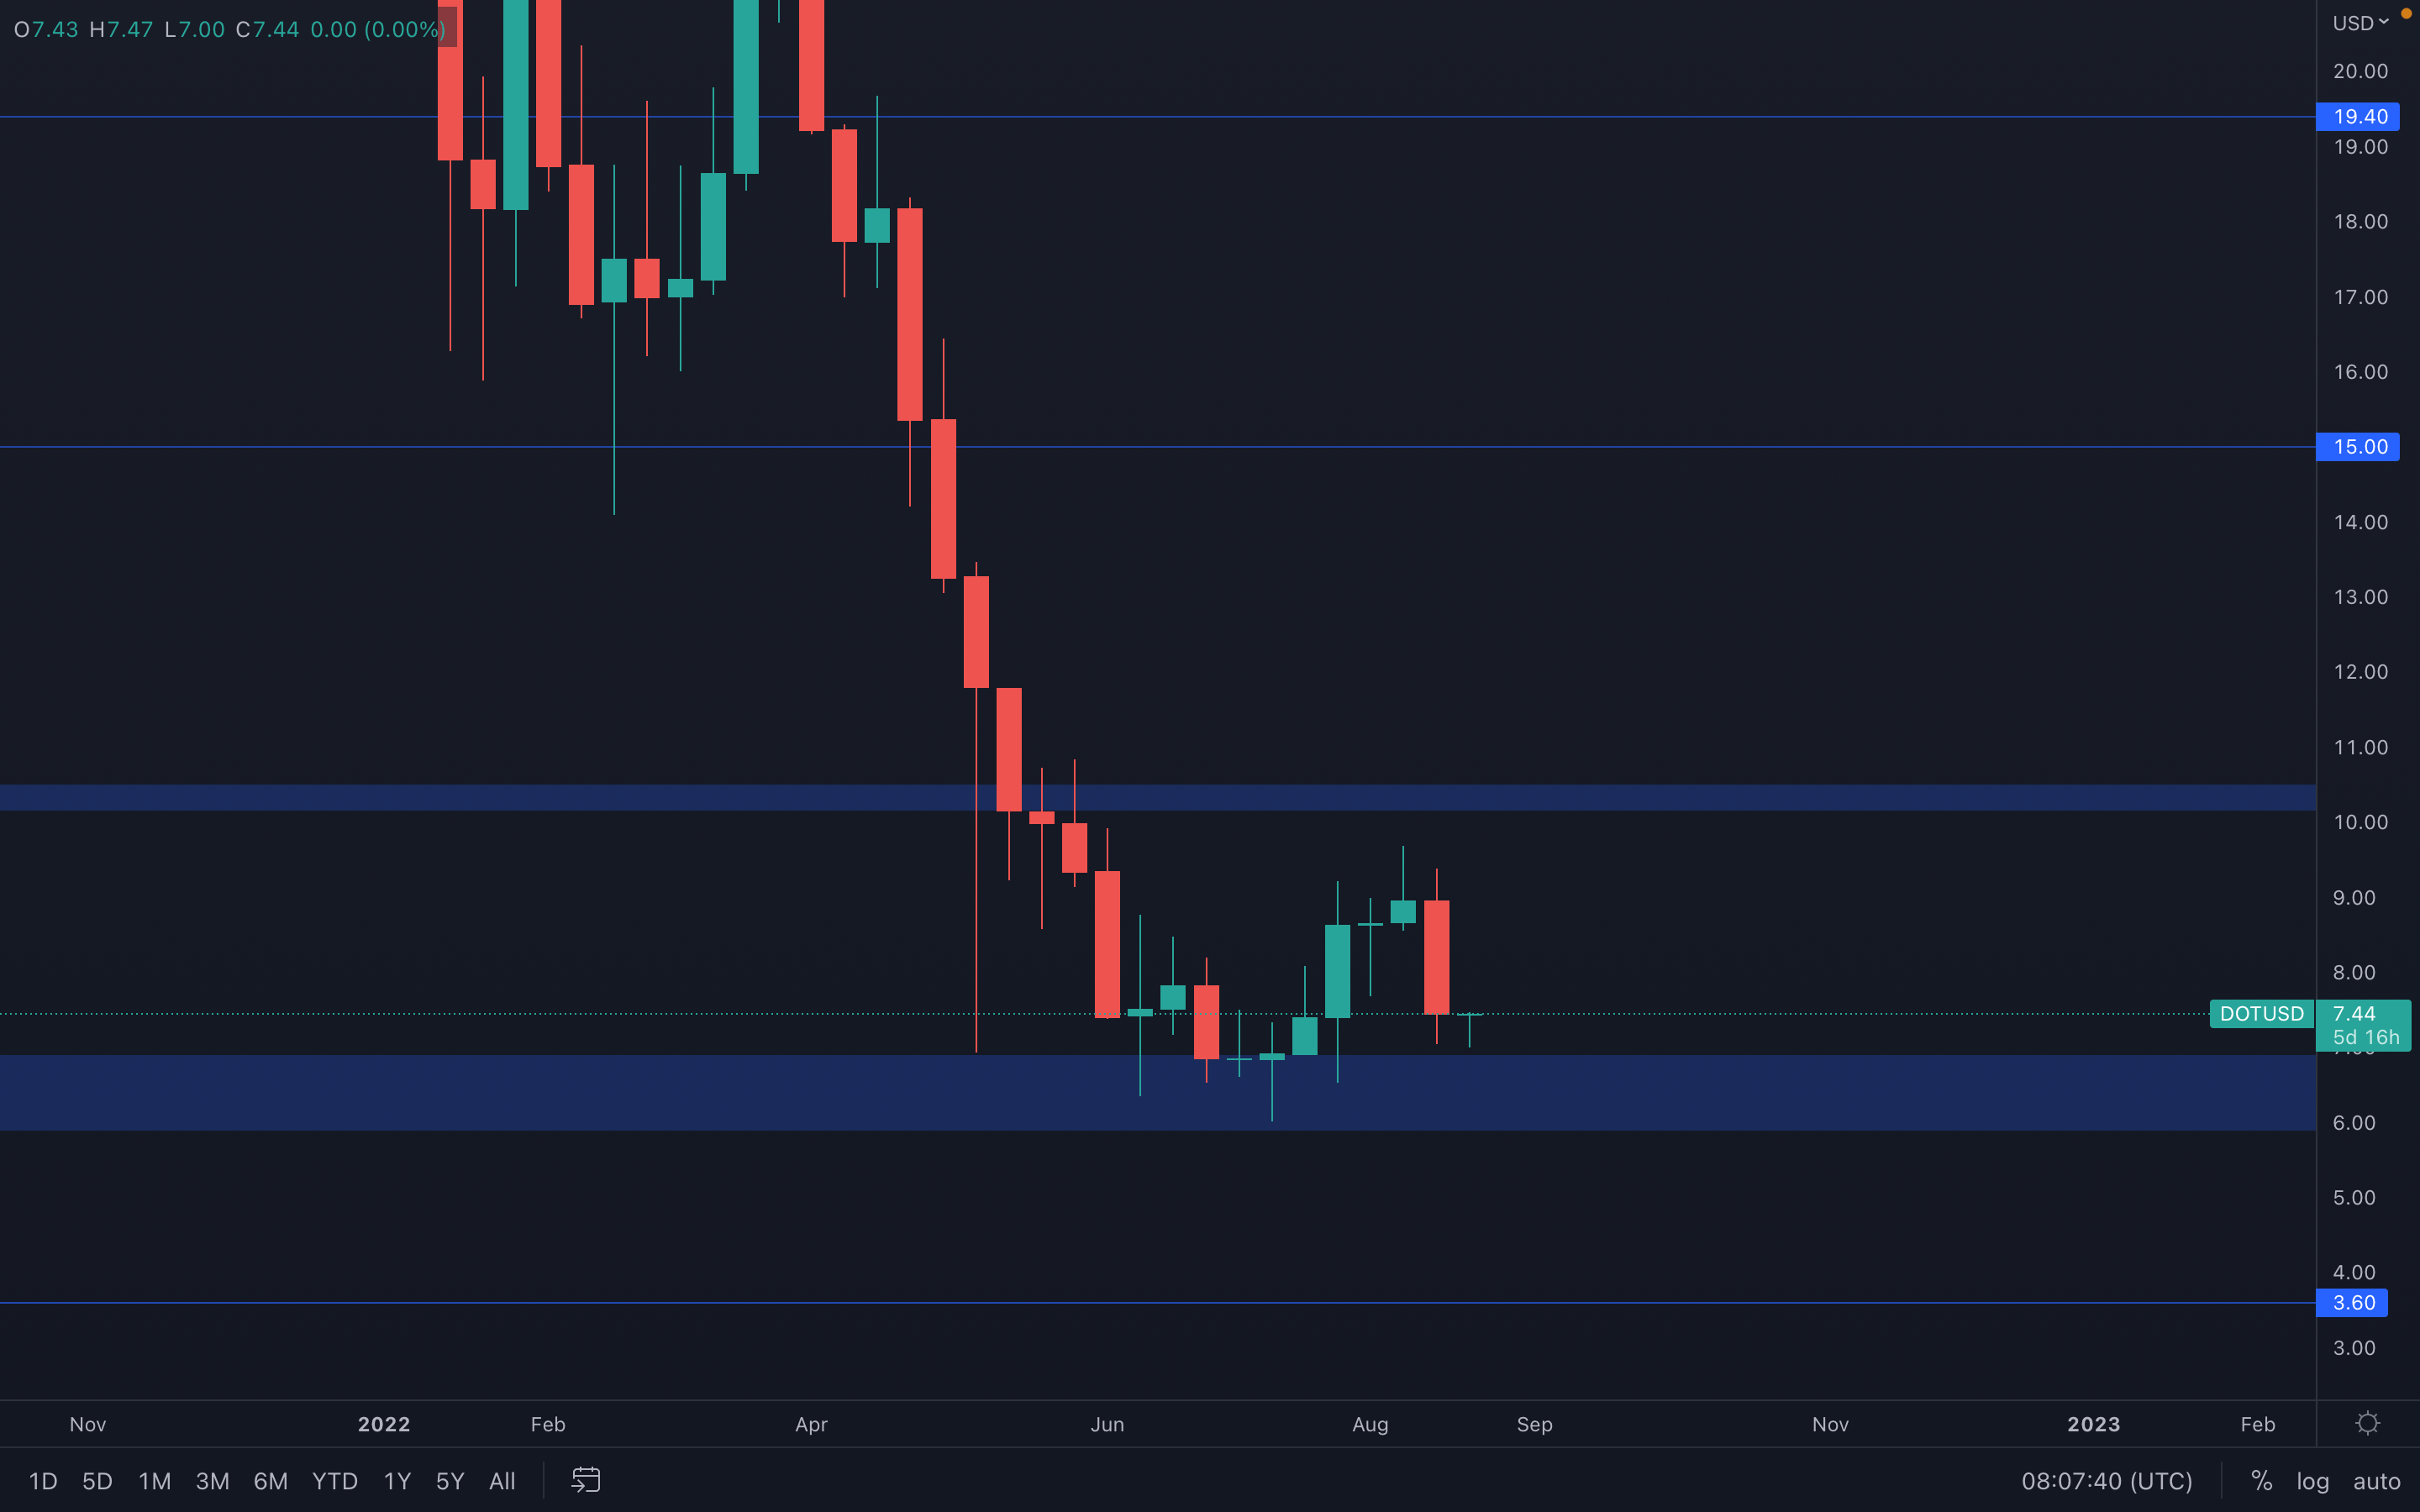 Huge candle printed last week for DOT, losing over 17% of its value which invalidated a push towards $10. Even though the asset is close to a major support area, we could still see prices drop as low as $6 while still maintaining this area as support - this makes DOT's price action extremely indecisive, with no hint as to where its price is likely going next.
The only thing we can do is to follow the majors - where the majors go, DOT will follow. There's also a change in market structures on the daily timeframe, from bullish to bearish, after DOT aggressively dropped under its previous higher low. This also suggests that we may not see any upside momentum from DOT, unless the majors aid in pushing its price higher.
SNX
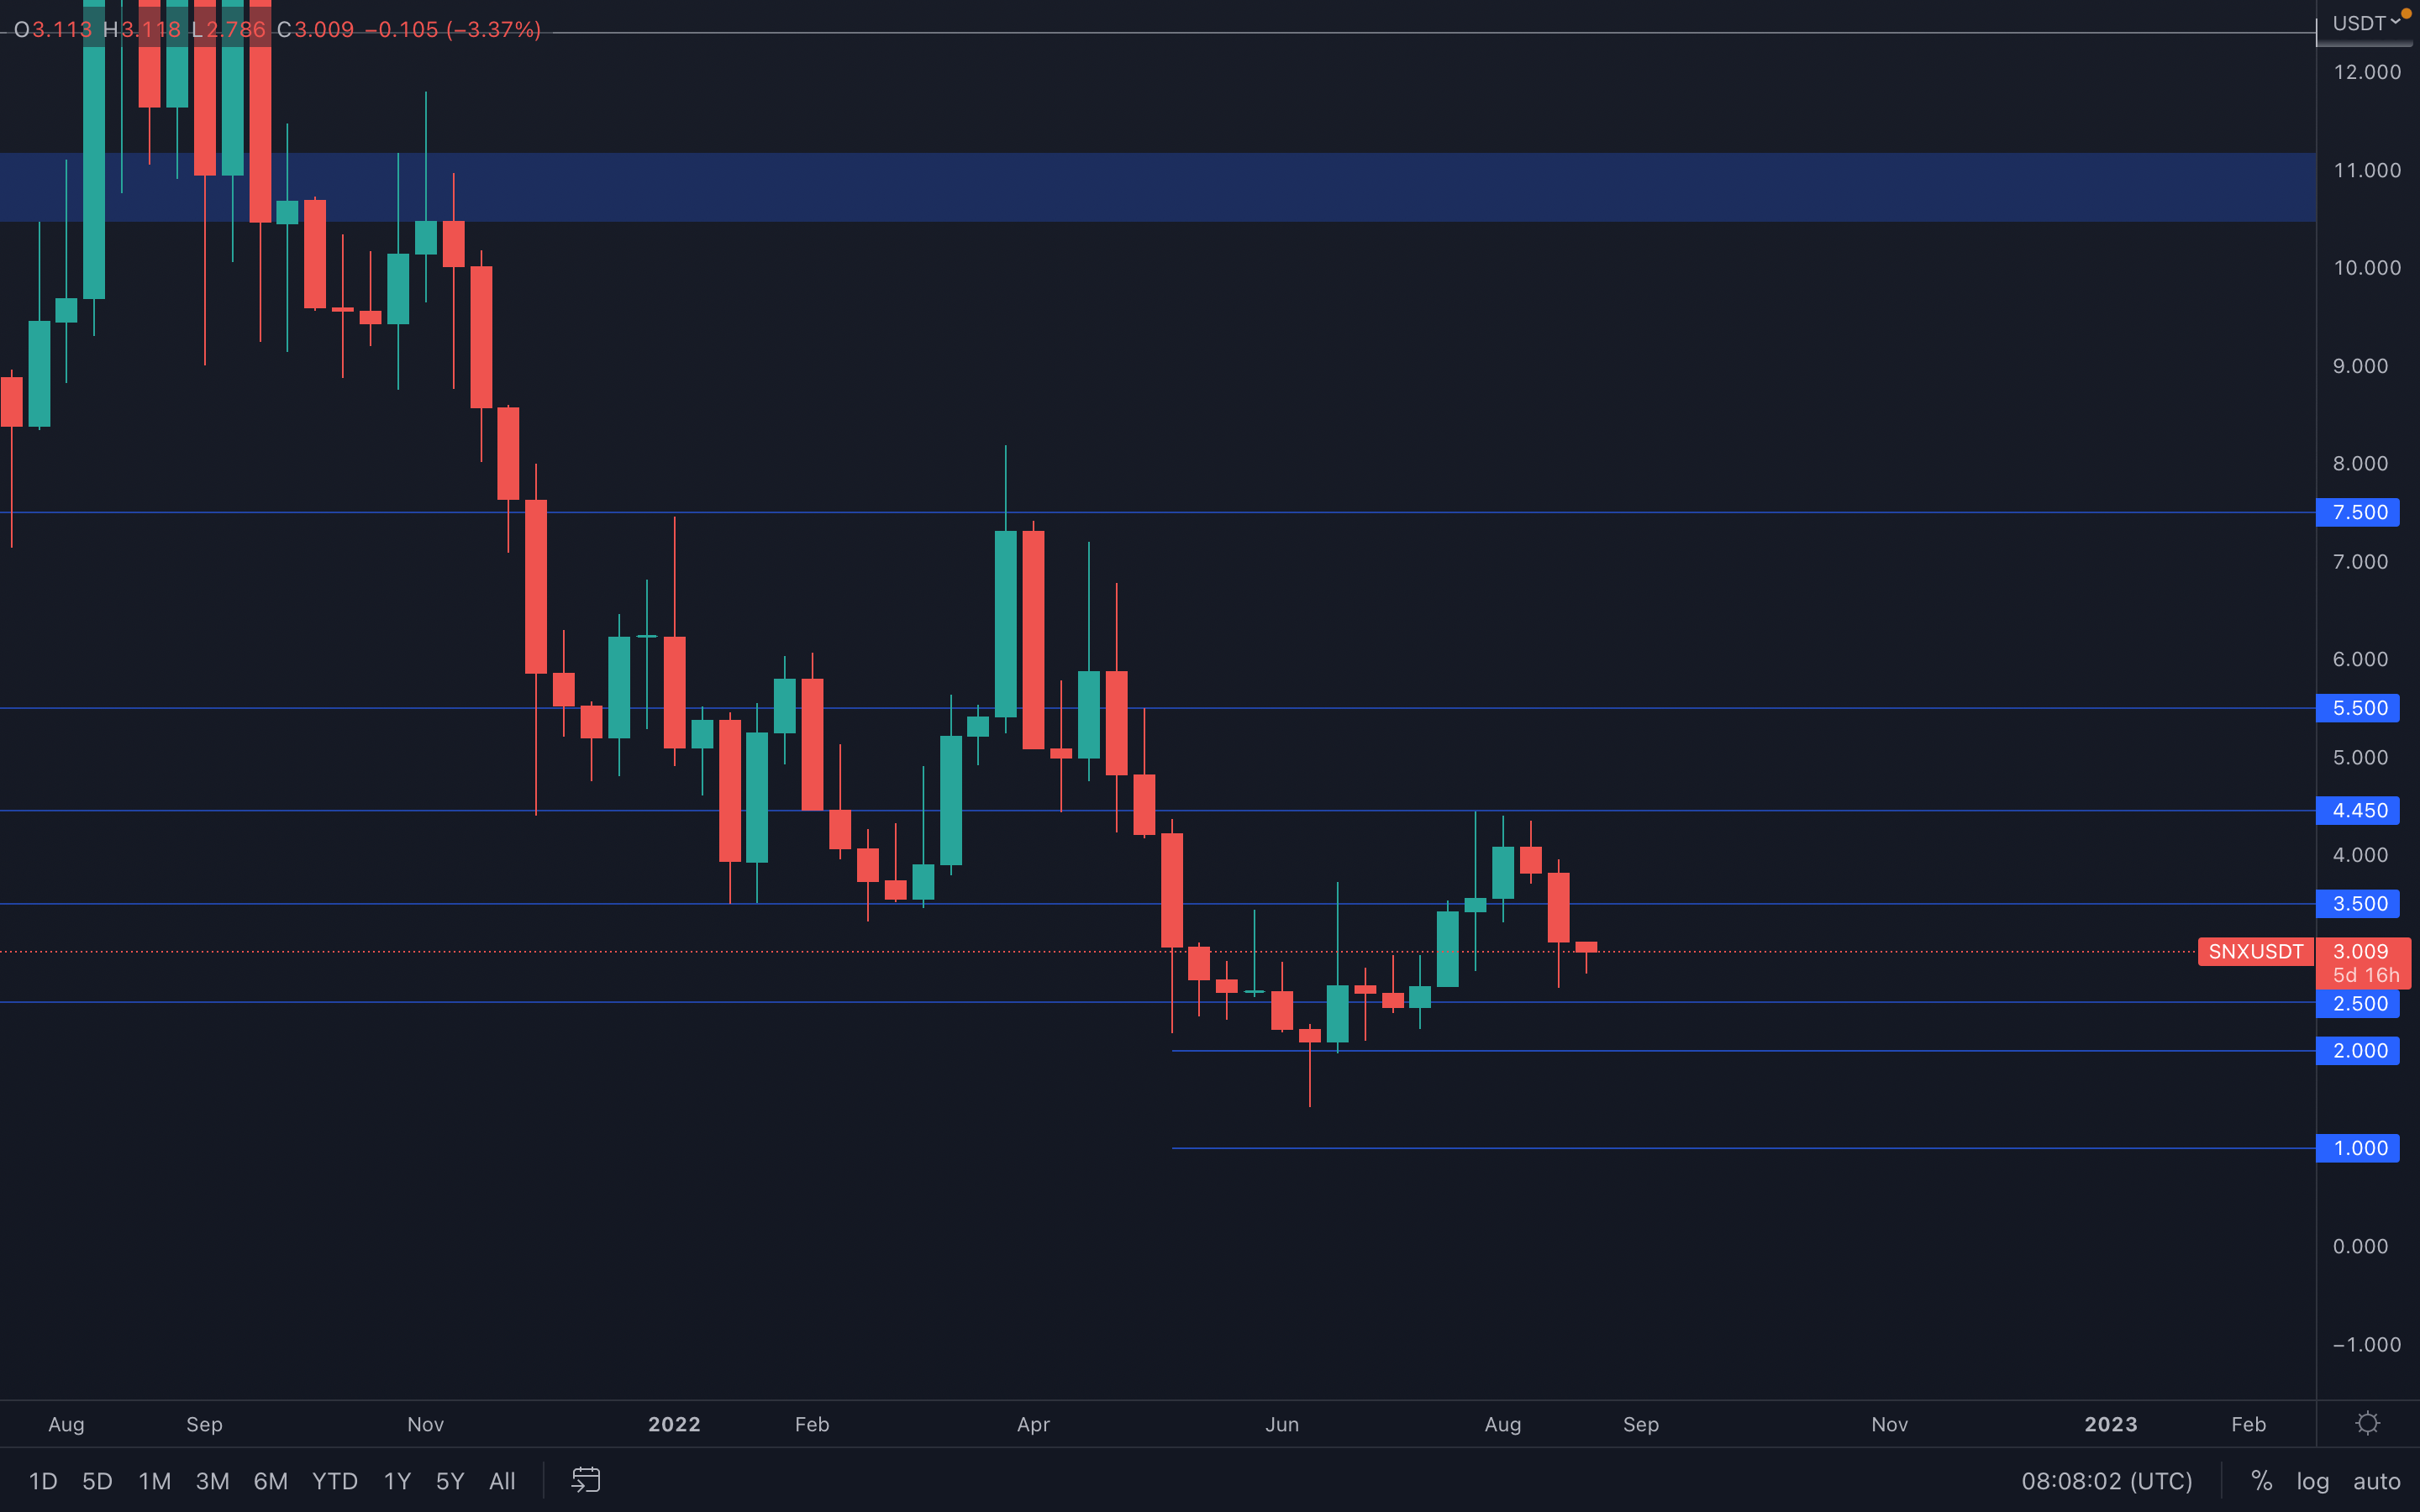 Clear picture for SNX - after a weekly loss of its $3.5 support level, $2.5 is now on the cards. We could still see some buying pressure this week, but not to the extent of breaking above $3.5 - market participants have already lost conviction after last week's volatility.
RUNE
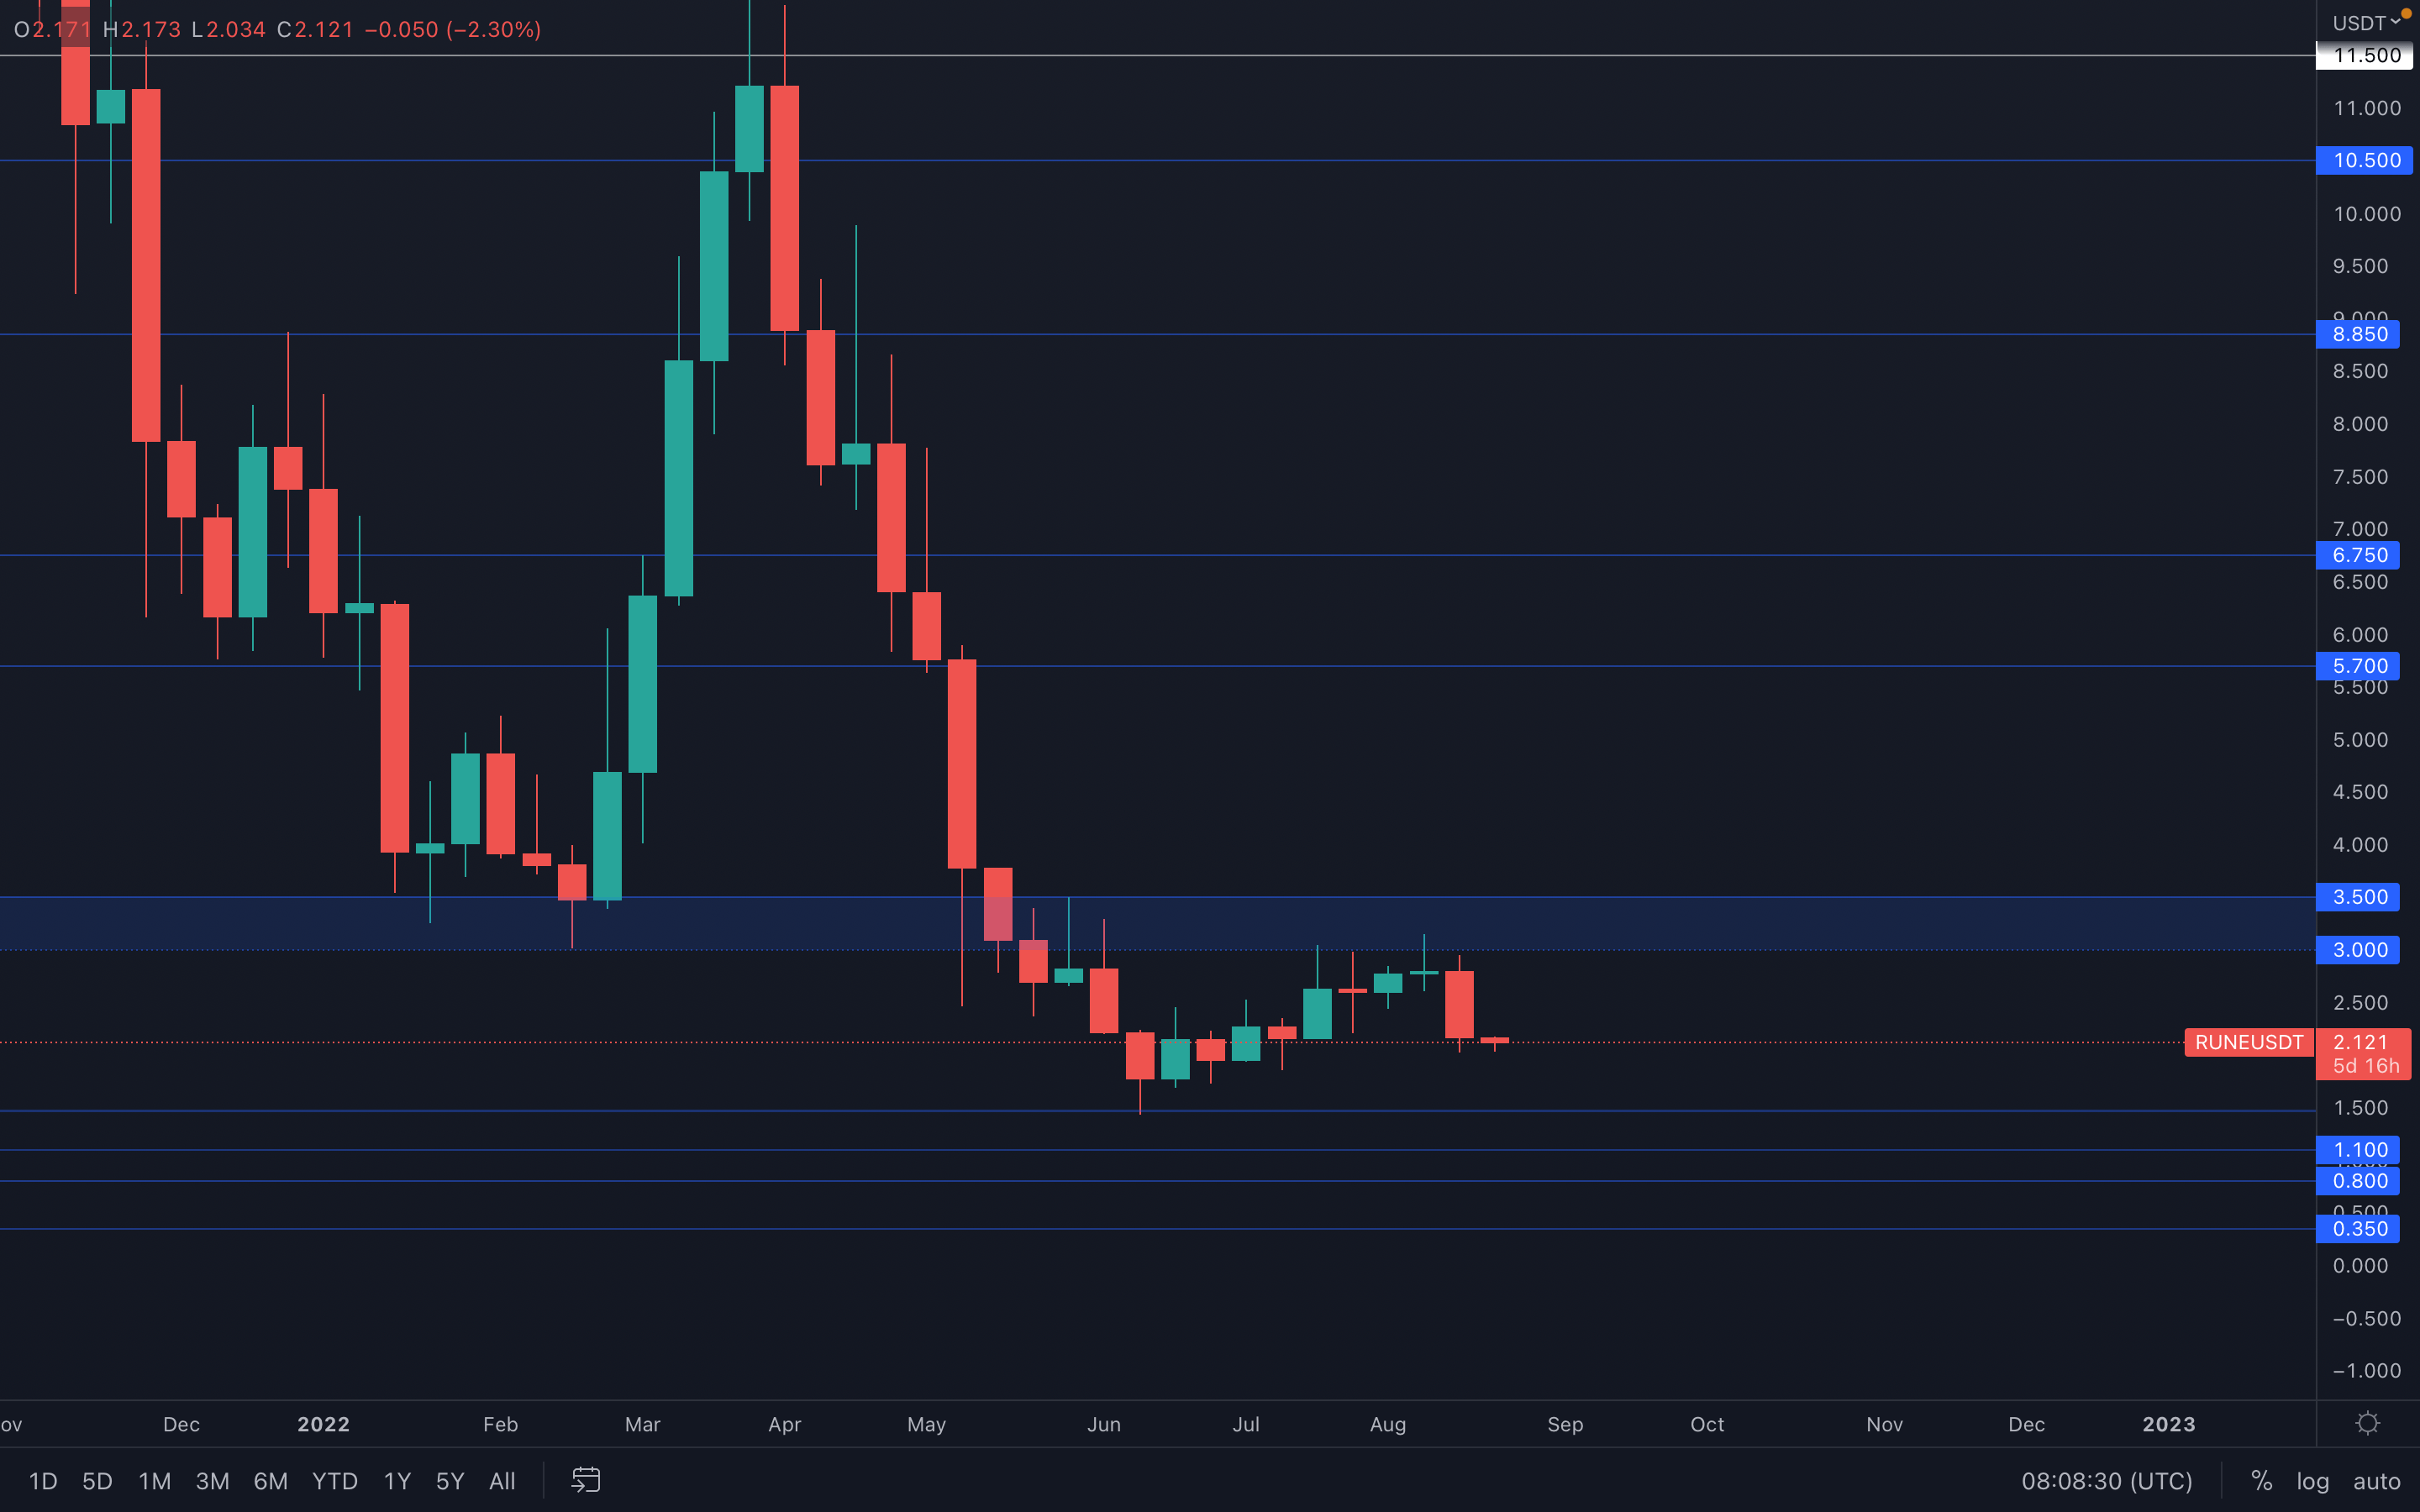 RUNE seems to have formed a local support around its $2 level (on lower timeframes), which suggests we can see a rise in its price this week. Most assets are actually at local support levels, so the majors will most likely aid RUNE in pushing towards $2.5 this week.
SOL
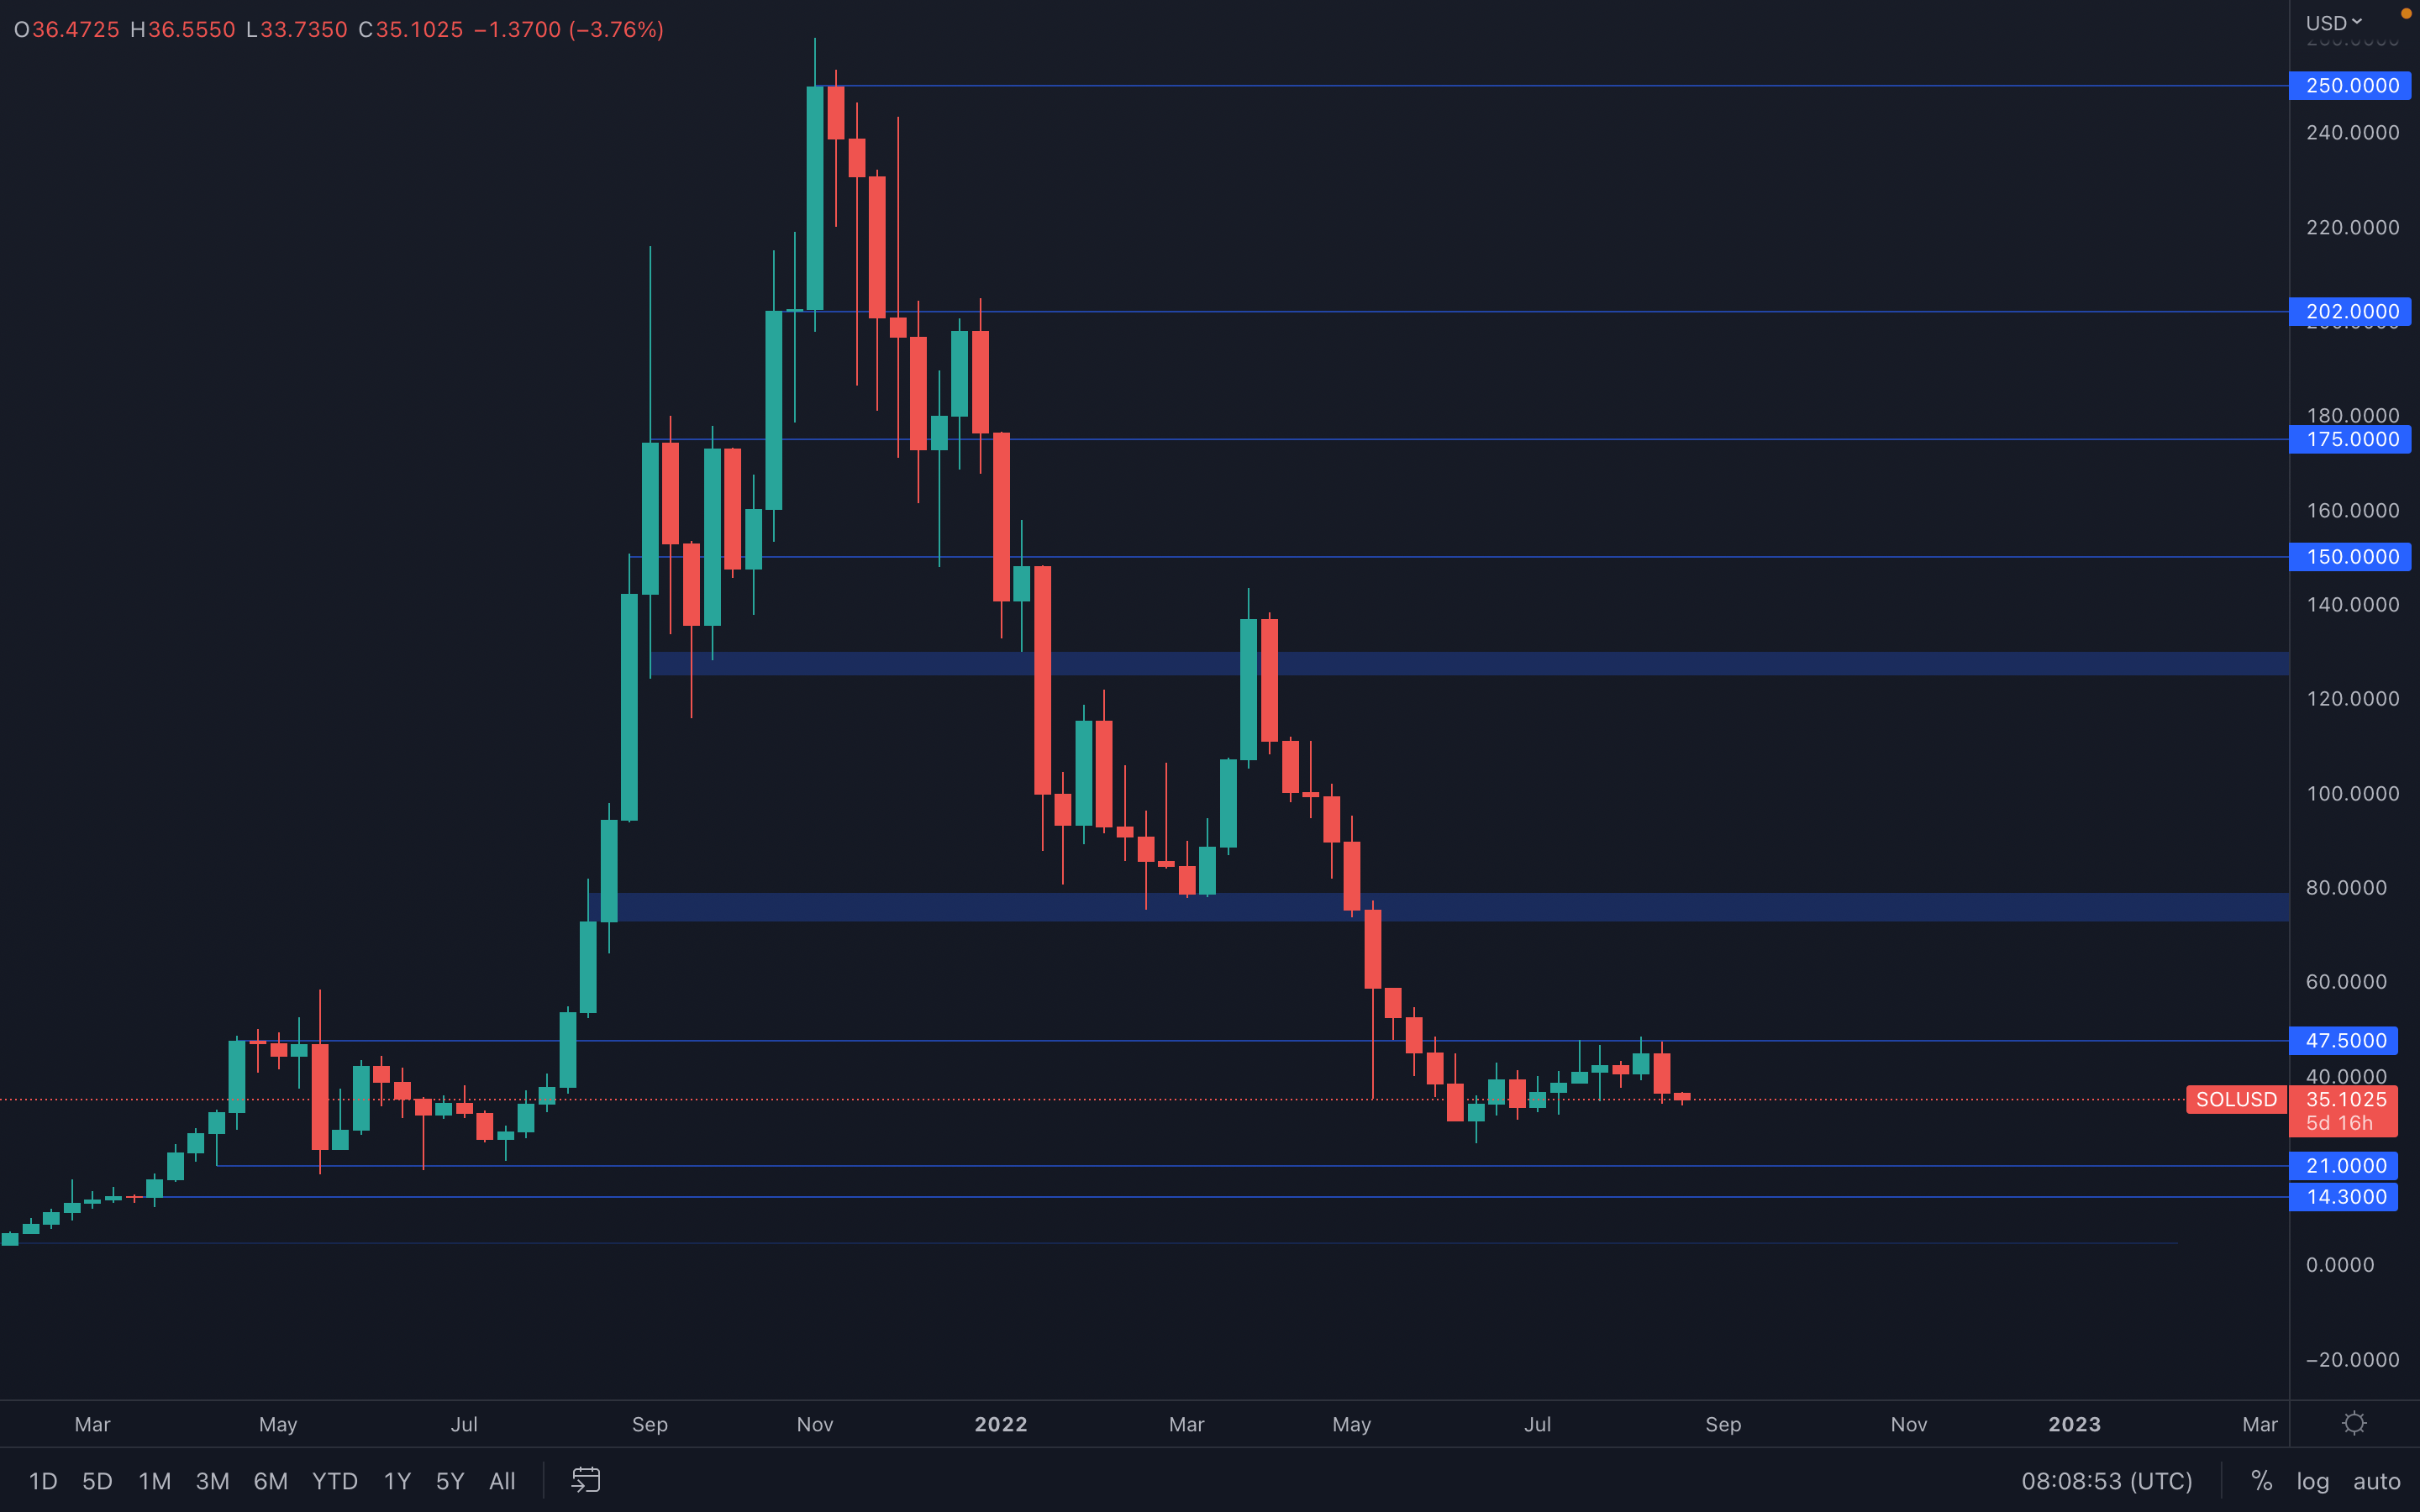 Having a bearish engulfing candle on the weekly timeframe is one thing, but having a bearish engulfing candle form right under resistance is another thing - this suggests that there has been strong selling pressure at SOL's $47.5 level, making it difficult in rising further.
We always make sure to never underestimate candlestick patterns, because candlesticks represent the one true source of data that binds everything together - a simple candlestick can indicate who is and who isn't in control, and in SOL's case, sellers have regained control over the price and will most likely push it towards $30.
SRM
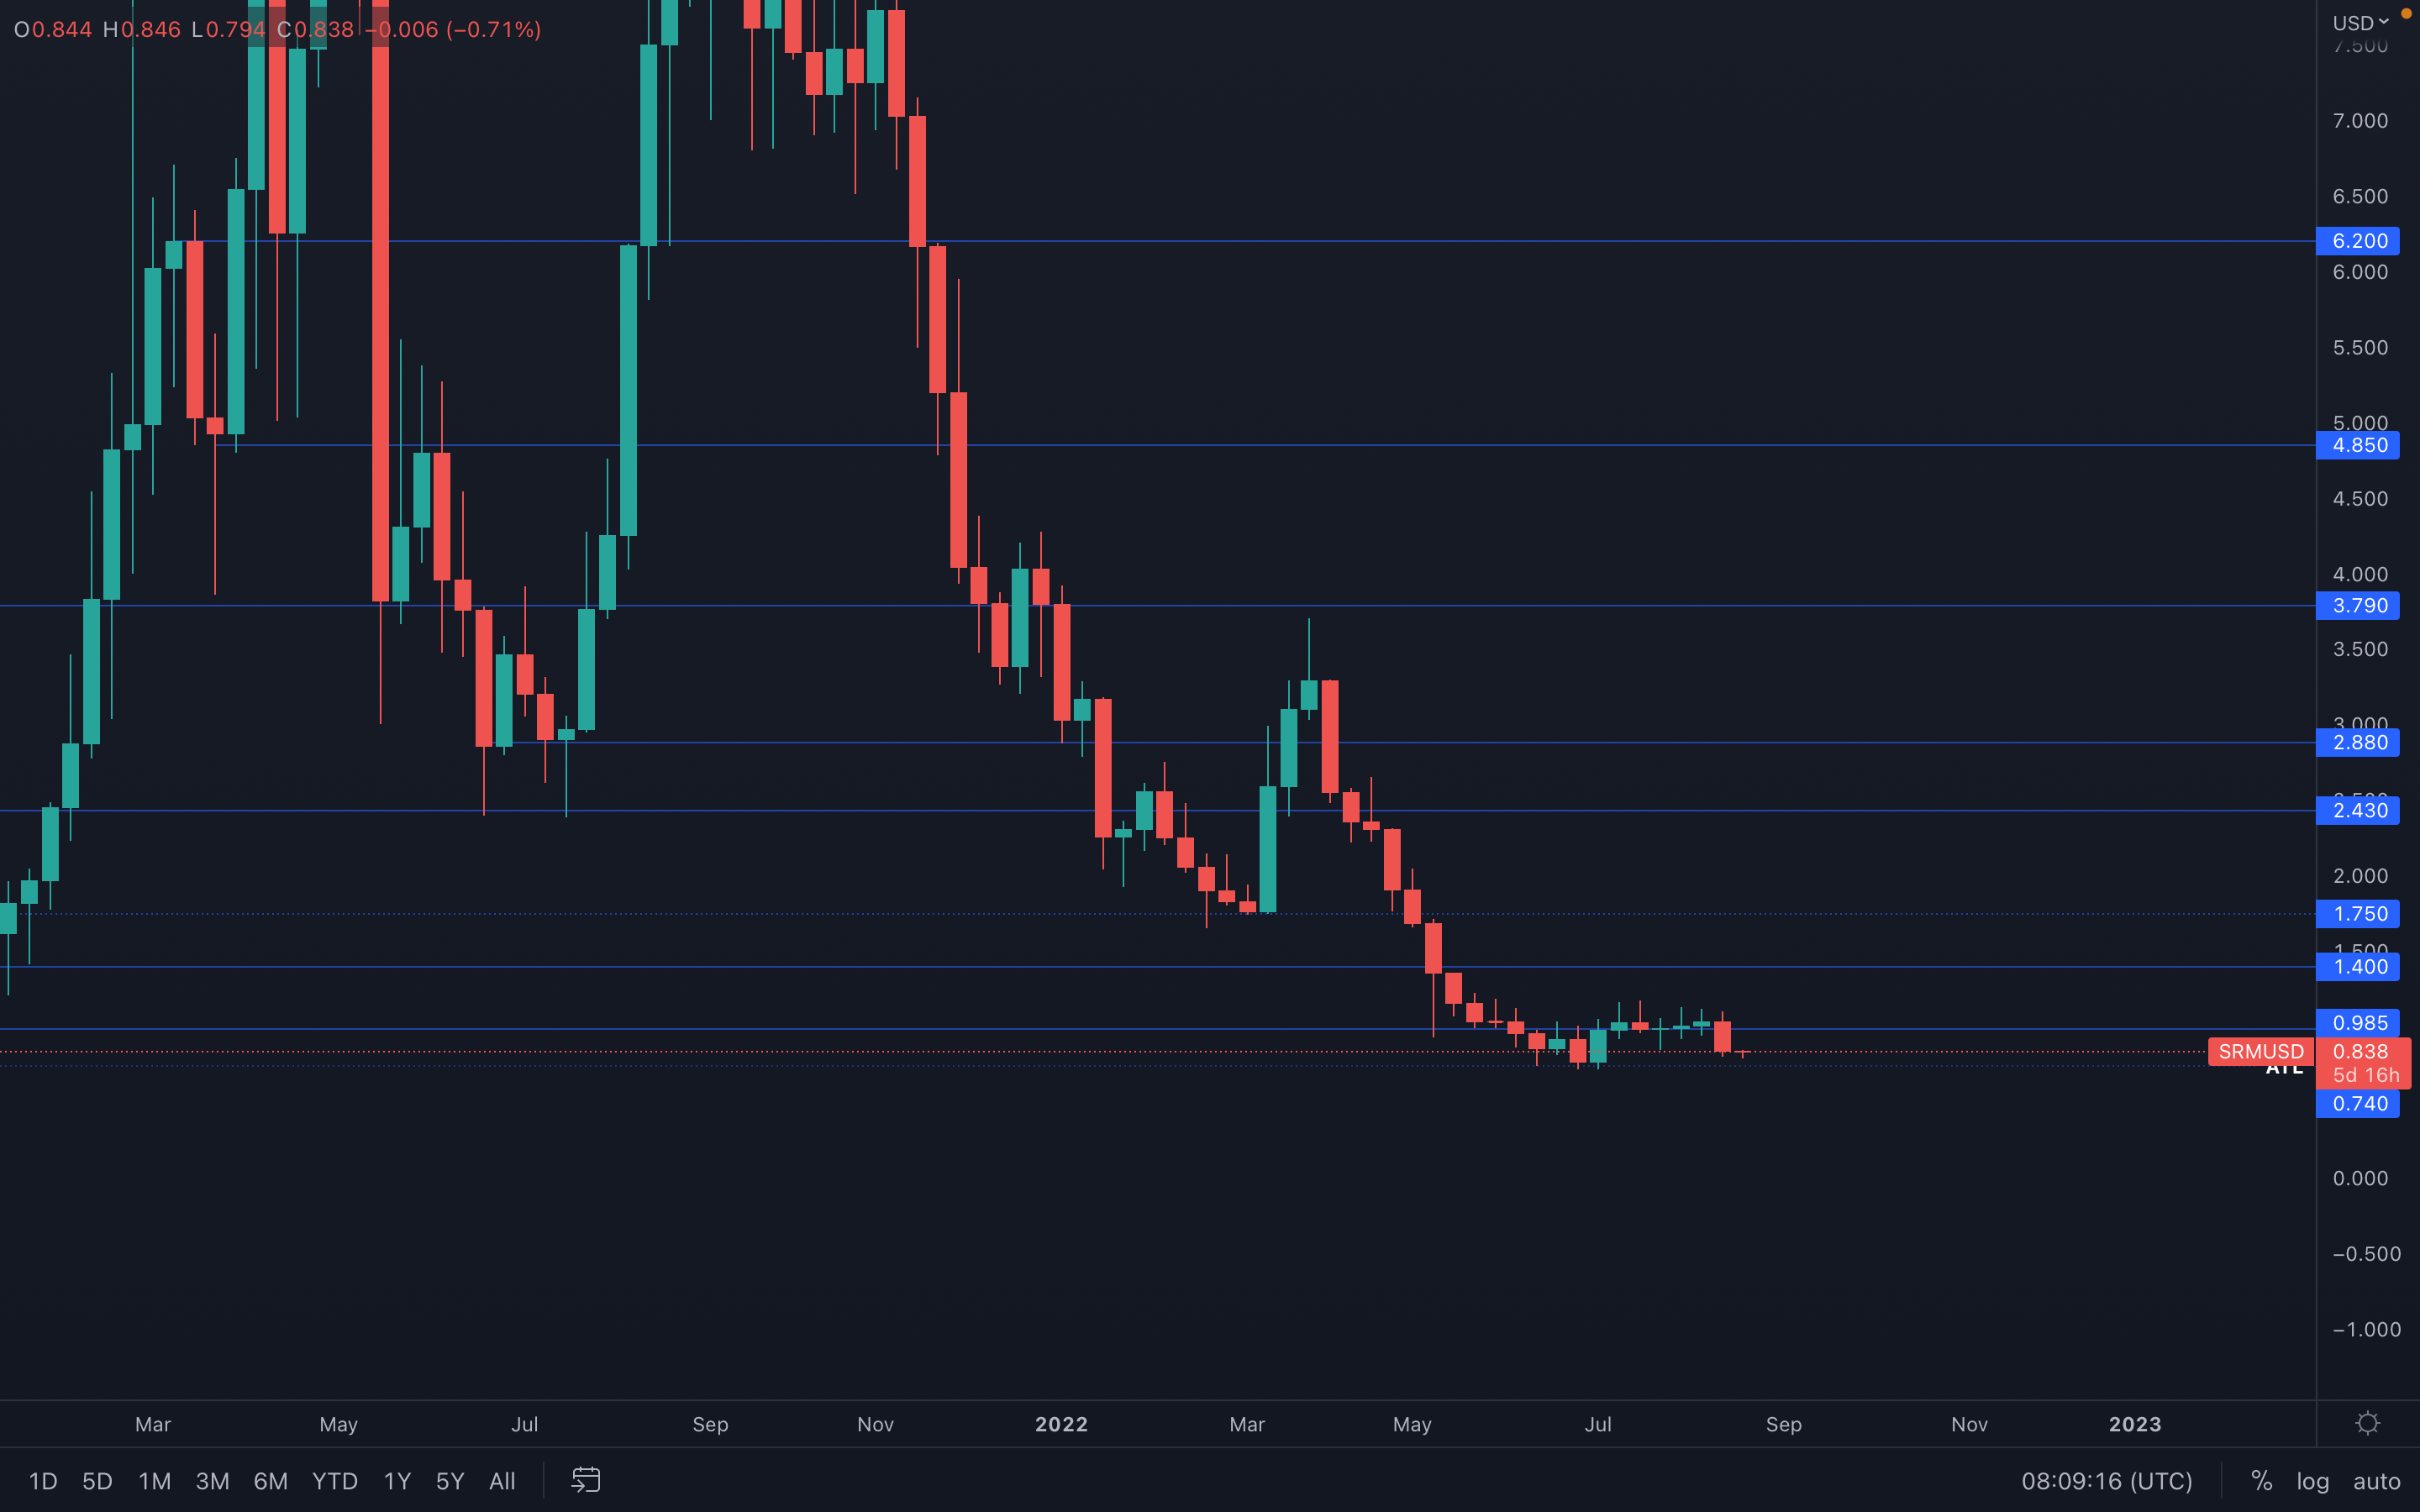 Probably one of the most boring charts in existence - SRM has been ranging in the same area for over 100 days, making it extremely indecisive. However, short-term price movements can still be deduced from its price action - after losing the $1 level last week, $0.74 is now on the cards.
FTT
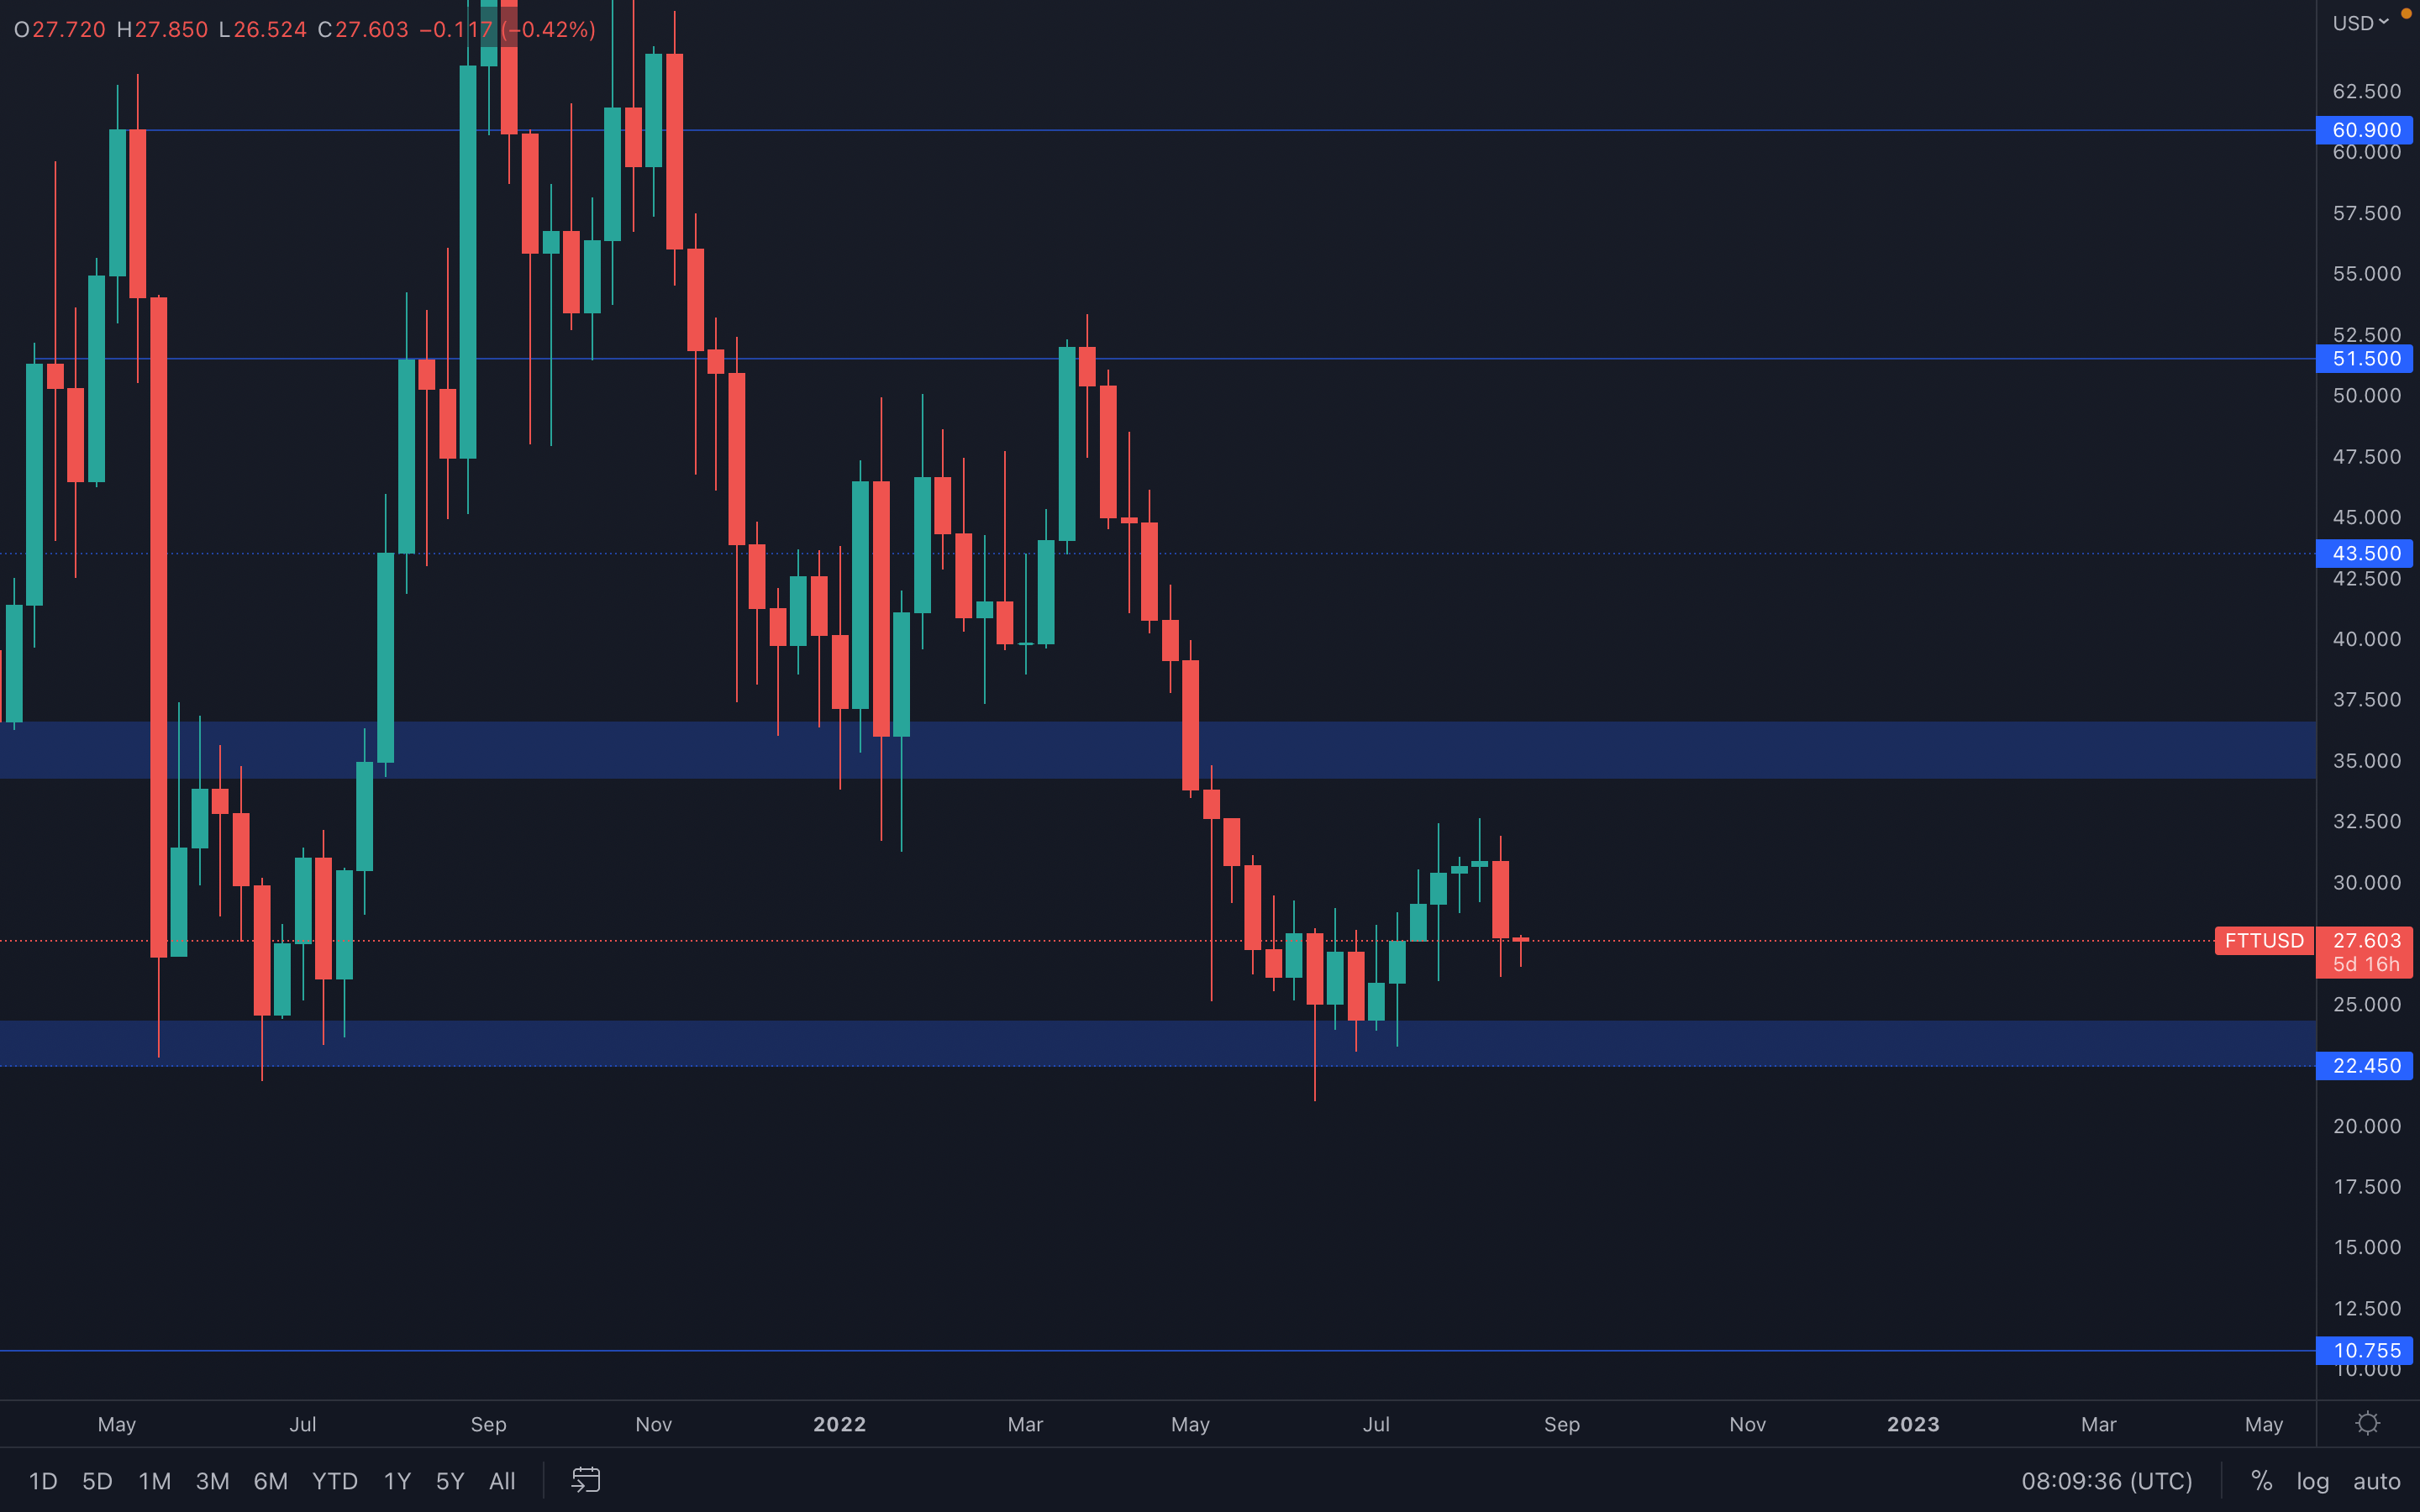 In last week's report, we mentioned that FTT has been losing traction and was unable to rise further due to its lack of buying pressure. We also mentioned the possibility of a weekly lower high being formed - both of these statements are now true.
After printing a lower high on the weekly timeframe, the only thing we can deduce is that either a higher low or a lower low are now needed to confirm where FTT is actually going next. With the asset still inside the famous $34 - $22.45 range, we should get even more comfortable with it remaining in this range for a longer period of time, until either $34 or $22.45 are broken.
MINA
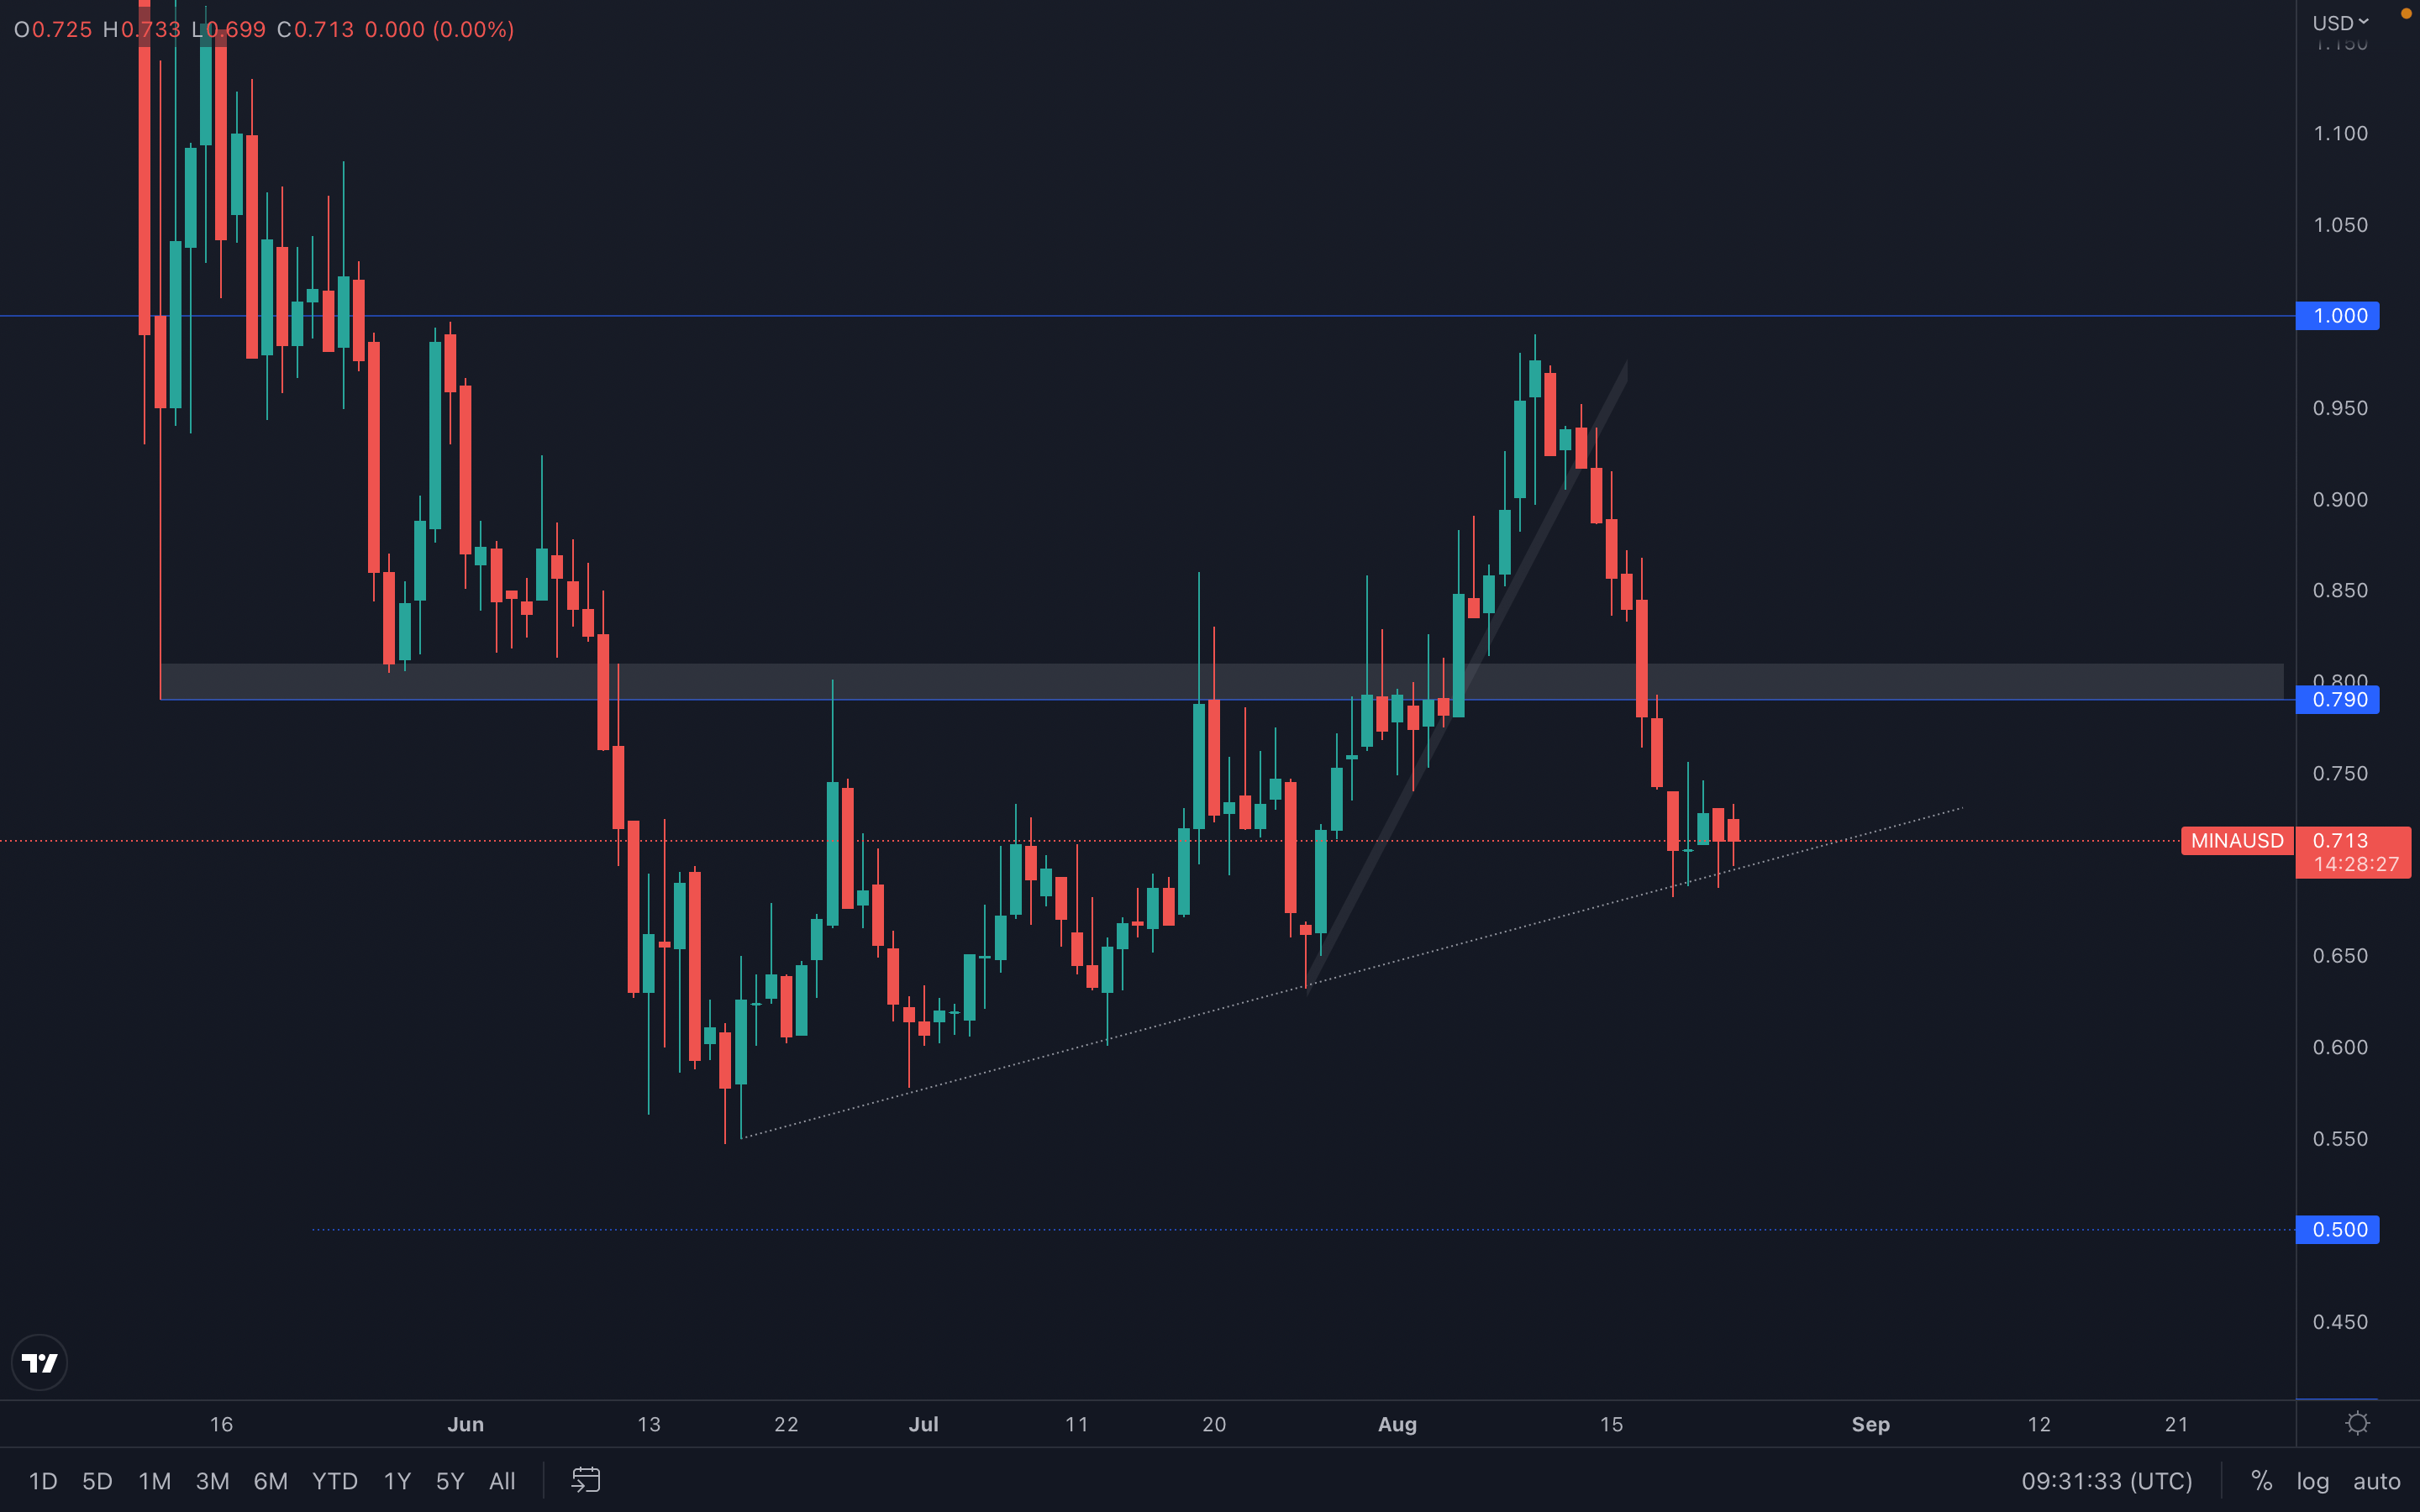 (Daily chart was used)
After getting rejected from its $1 psychological and technical level, MINA has descended towards $0.80 and managed to lose this support as well. This quickly brought its price to the supporting trend line we highlighted on the chart - this trend line has acted as support perfectly four times in the past, which suggests there is some strength to it. As long as MINA doesn't drop under, then a $0.80 resistance test is on the cards.
dYdX
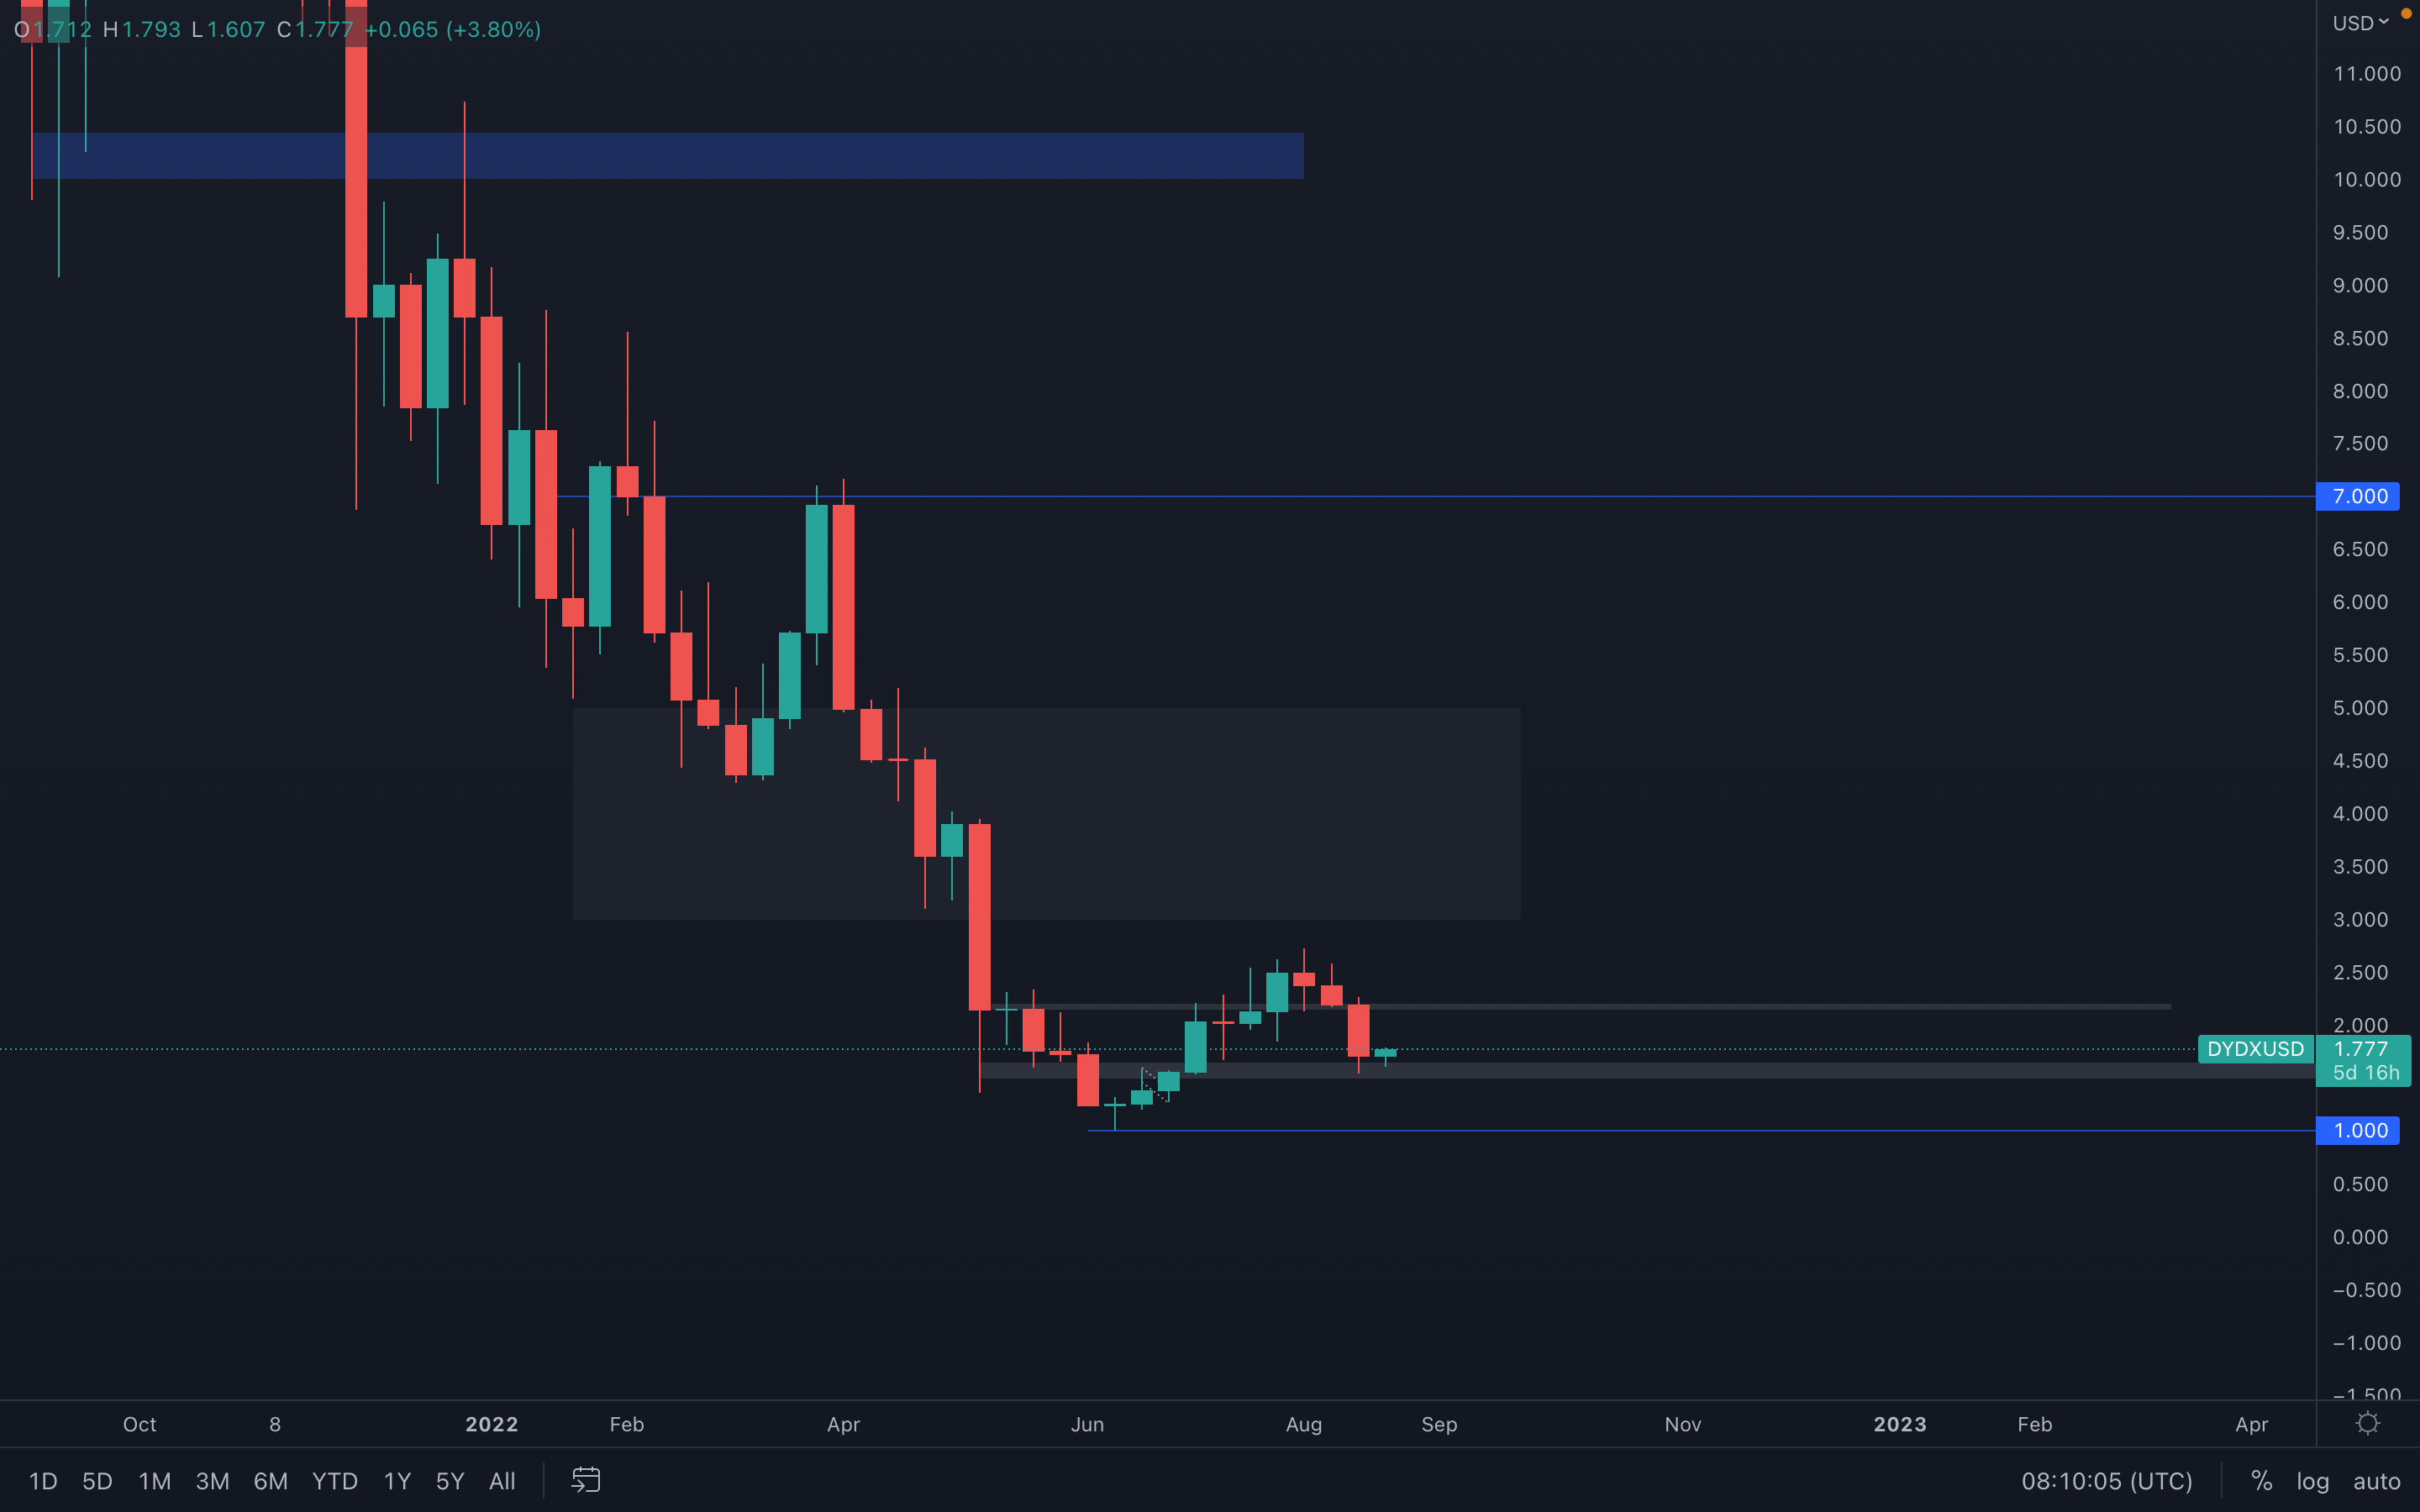 dYdX presented a clear reversal candlestick formation in the previous weeks, which we made sure to mention in last week's report. As a result, the possibility of a $1.50 - $1.60 has increased exponentially and this area has been tested just recently.
We've seen dYdX outperform the market time and time again  , even in the recent pump we've experienced - if the $1.50 - $1.60 support area is held successfully, we can expect dYdX to outperform most assets we cover in our reports again. This can easily lead towards a higher high on the weekly timeframe, shifting dYdX's market structure from bearish to bullish. Of course, we first need a confirmed higher low, and for that to happen, the $1.50 - $1.60 area needs to be held perfectly.
Summary
It can be said that some metrics have shown signs that a bottom has either been or is being hashed out - this is particularly highlighted by the mining metrics. However, we continue to see that overall sentiment is really poor and investors are looking to still exit the market at break-even levels and are really lacking the conviction for higher prices. We also see that there is still a high amount of leverage in the space – this does change weekly, so it may just be the case we’re seeing this currently – but usually, this leverage needs flushing out and therefore the market may currently be vulnerable to a volatile move.Recommended from Cryptonary


