Save 23% ($351) & Get a Free 1-1 Call with our Team ⏰ : 0d 2h 59m 43s

Disclaimer: Not financial nor investment advice. You are responsible for any capital-related decisions you make, and only you are accountable for the results.
Macro
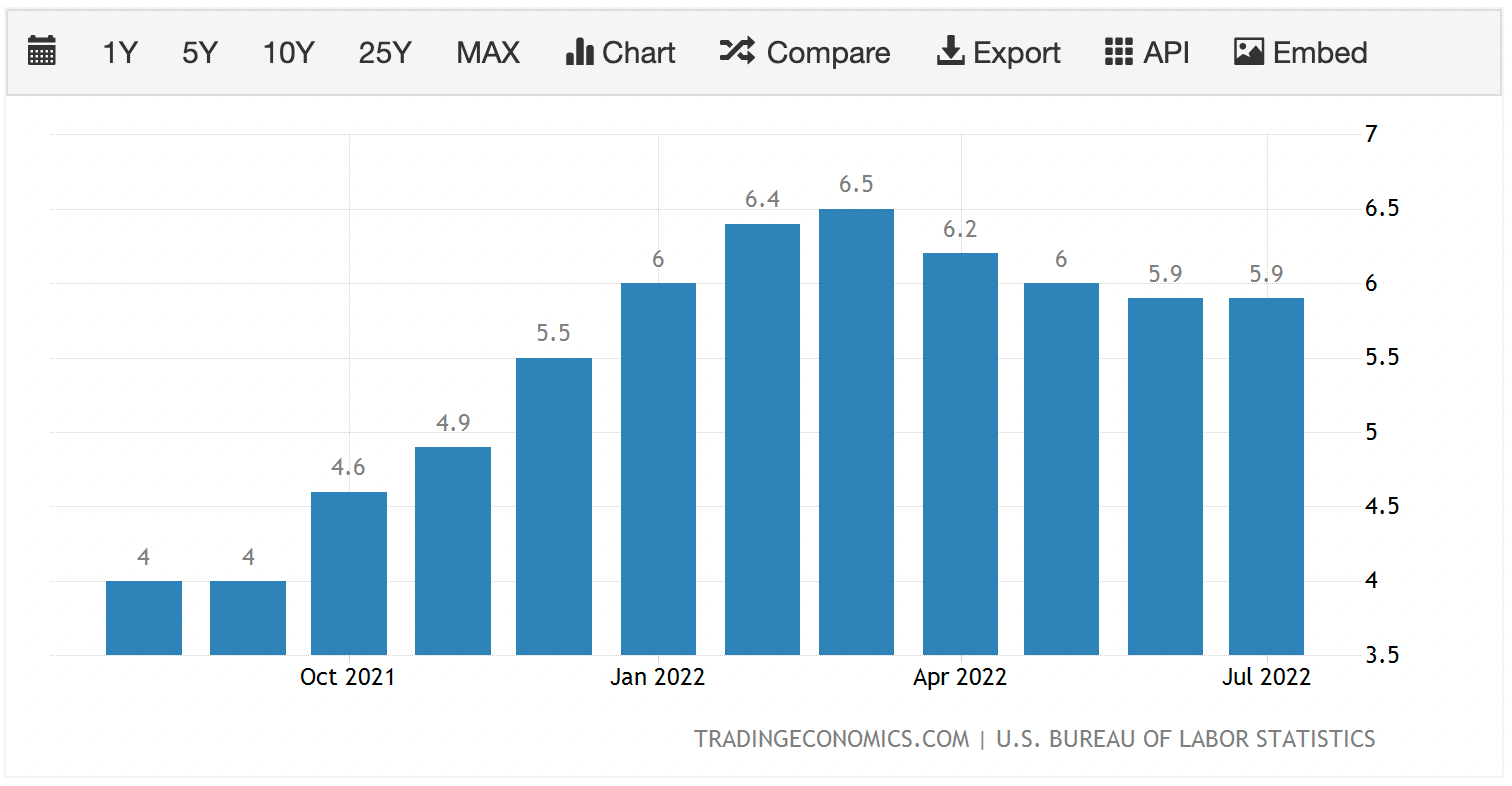
This week is set to be a key week for markets with there being key macro data coming out and on Thursday, the Ethereum Merge is scheduled to take place. On Tuesday we have Inflation data set to be released. The core Inflation Rate Year-on-Year is expected to be slightly higher (6.1%) than the previous month (5.9%), whilst the headline Inflation Rate is expected to be lower (8.1%) than the prior month (8.5%). Even though the headline rate is expected to come down to 8.1%, the FED and FED Chair J Powell will want to see that Core is coming down also and not sitting around the 6% mark. It is expected that headline Inflation is to come down to due energy prices falling over prior months, but the Core rate is what the FED claims to focus on as it is made up of the components the FED can control – it is the prices that consumers pay for a basket of goods which excludes food and fuel costs (FED less able to control).In order to bring down Core Inflation, the FED will need to continue raising rates (target range of 3.75% - 4.00% by year-end) to cause enough demand destruction that the ‘stickier’ aspects of Inflation that make up the Core Inflation such as shelter (housing) and wages also begin to come down. If we look at the below chart, we see that Core Inflation has remained relatively constant at the 6% mark. The FED will want to engineer some demand destruction to bring this down.
Core Inflation Rate
TLDR
- The wallets holding the least amount of Ether have slowed in their accumulation in recent months whilst the wallets holding a greater amount of Ether have begun re-adding Ether to their wallets.
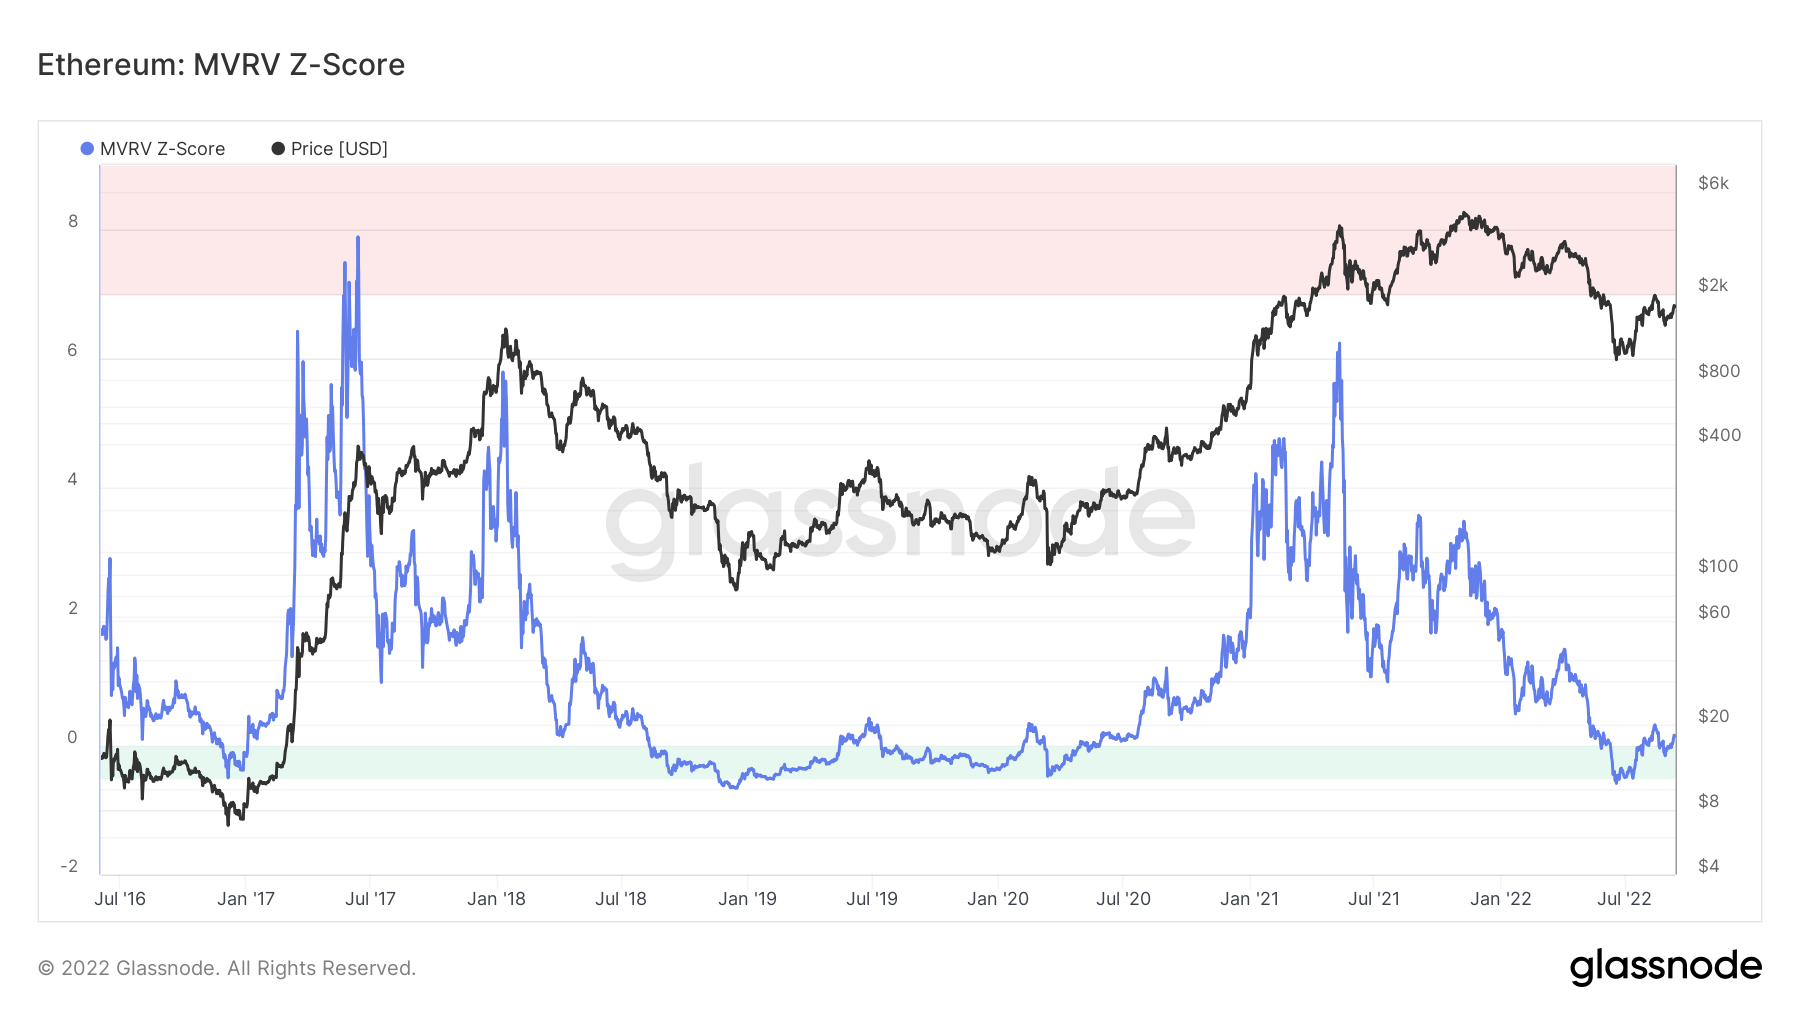
- The Realised Price metric shows where Ether has historically been in times of undervalued and where it may be worth dollar cost averaging in. It can be assumed that in the region of $1,000 to $1,300 is a worthwhile range. This would also be the range in which Ether is back in its green buy zone on the MVRV Z-Score chart.
Total Market Cap
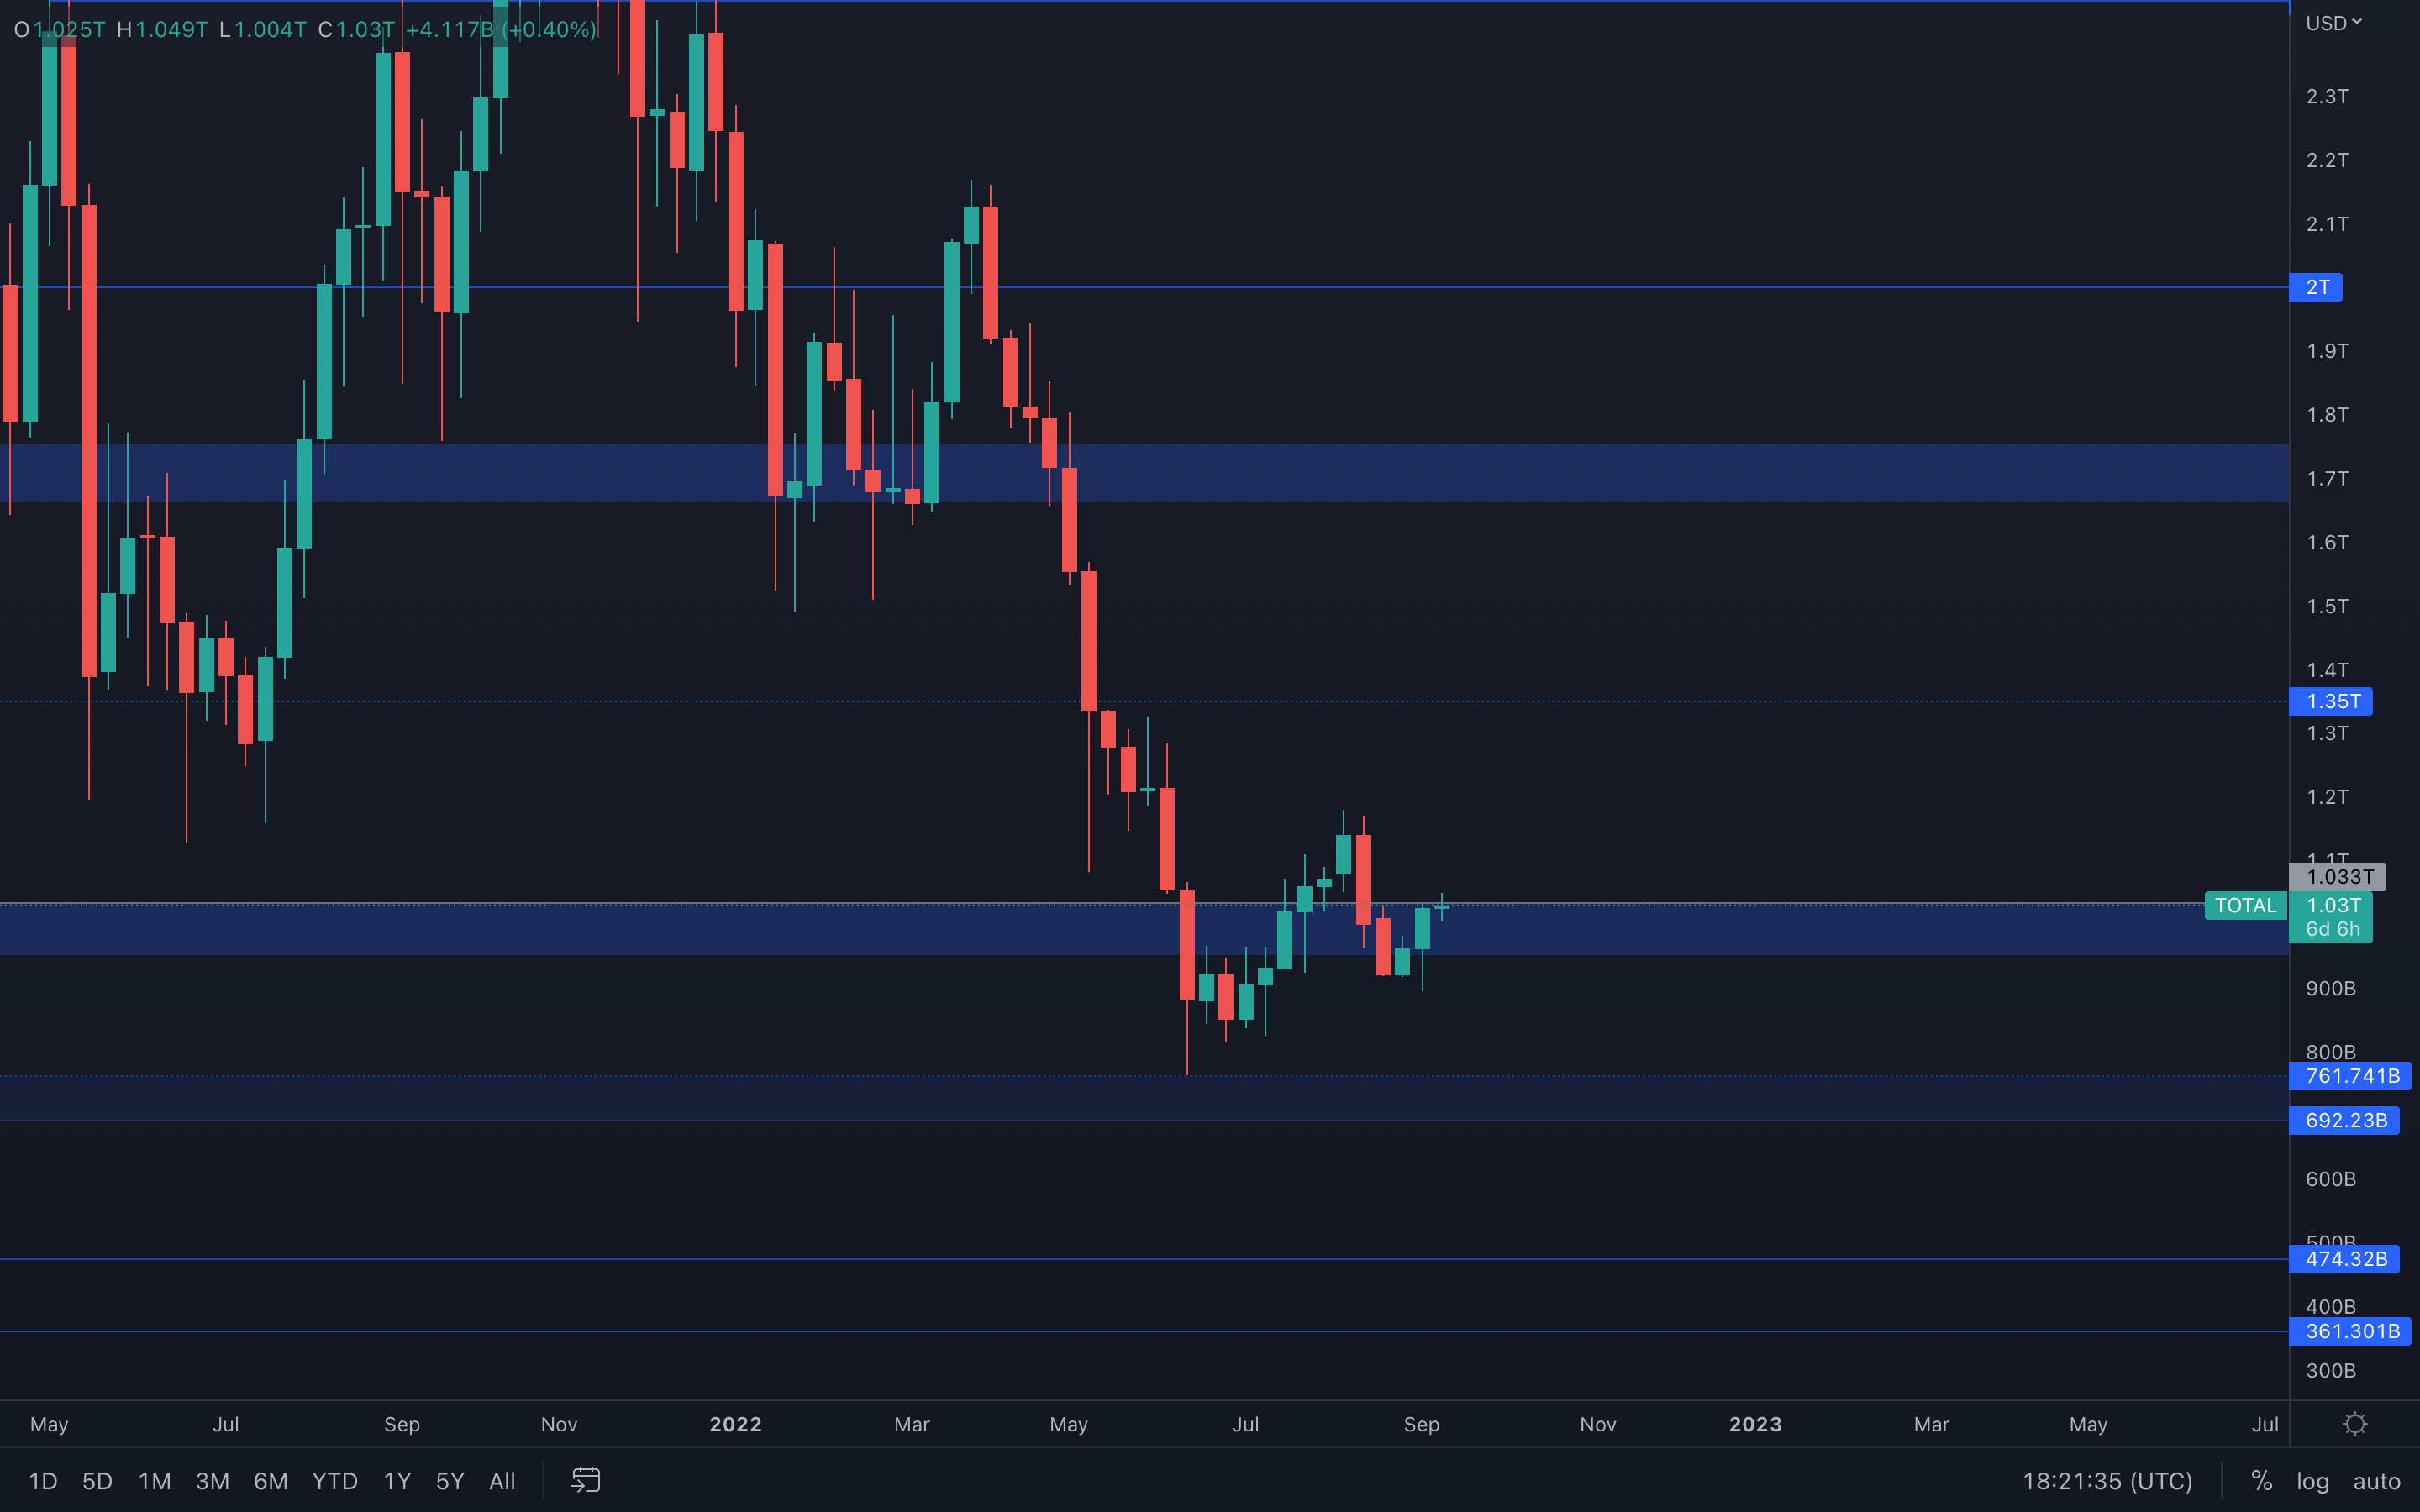 The Total Market Cap Index managed to reclaim its psychological and technical level of $1T, but can still be seen under resistance. The $1.03T level has acted precisely in the last couple of weeks, especially on the daily timeframe - this suggests a reclaim of this level, which is not far off, is now required for further upside.
Last week's candle closed full-bodied, indicating strong demand and a shift in control from sellers to buyers. This demand aided in the creation of a weekly higher low, which is a potential start to a weekly market structure change - the only thing that is needed now is a higher high. For that to occur, the index needs to close a weekly candle above $1.20T.
Altcoins Market Cap
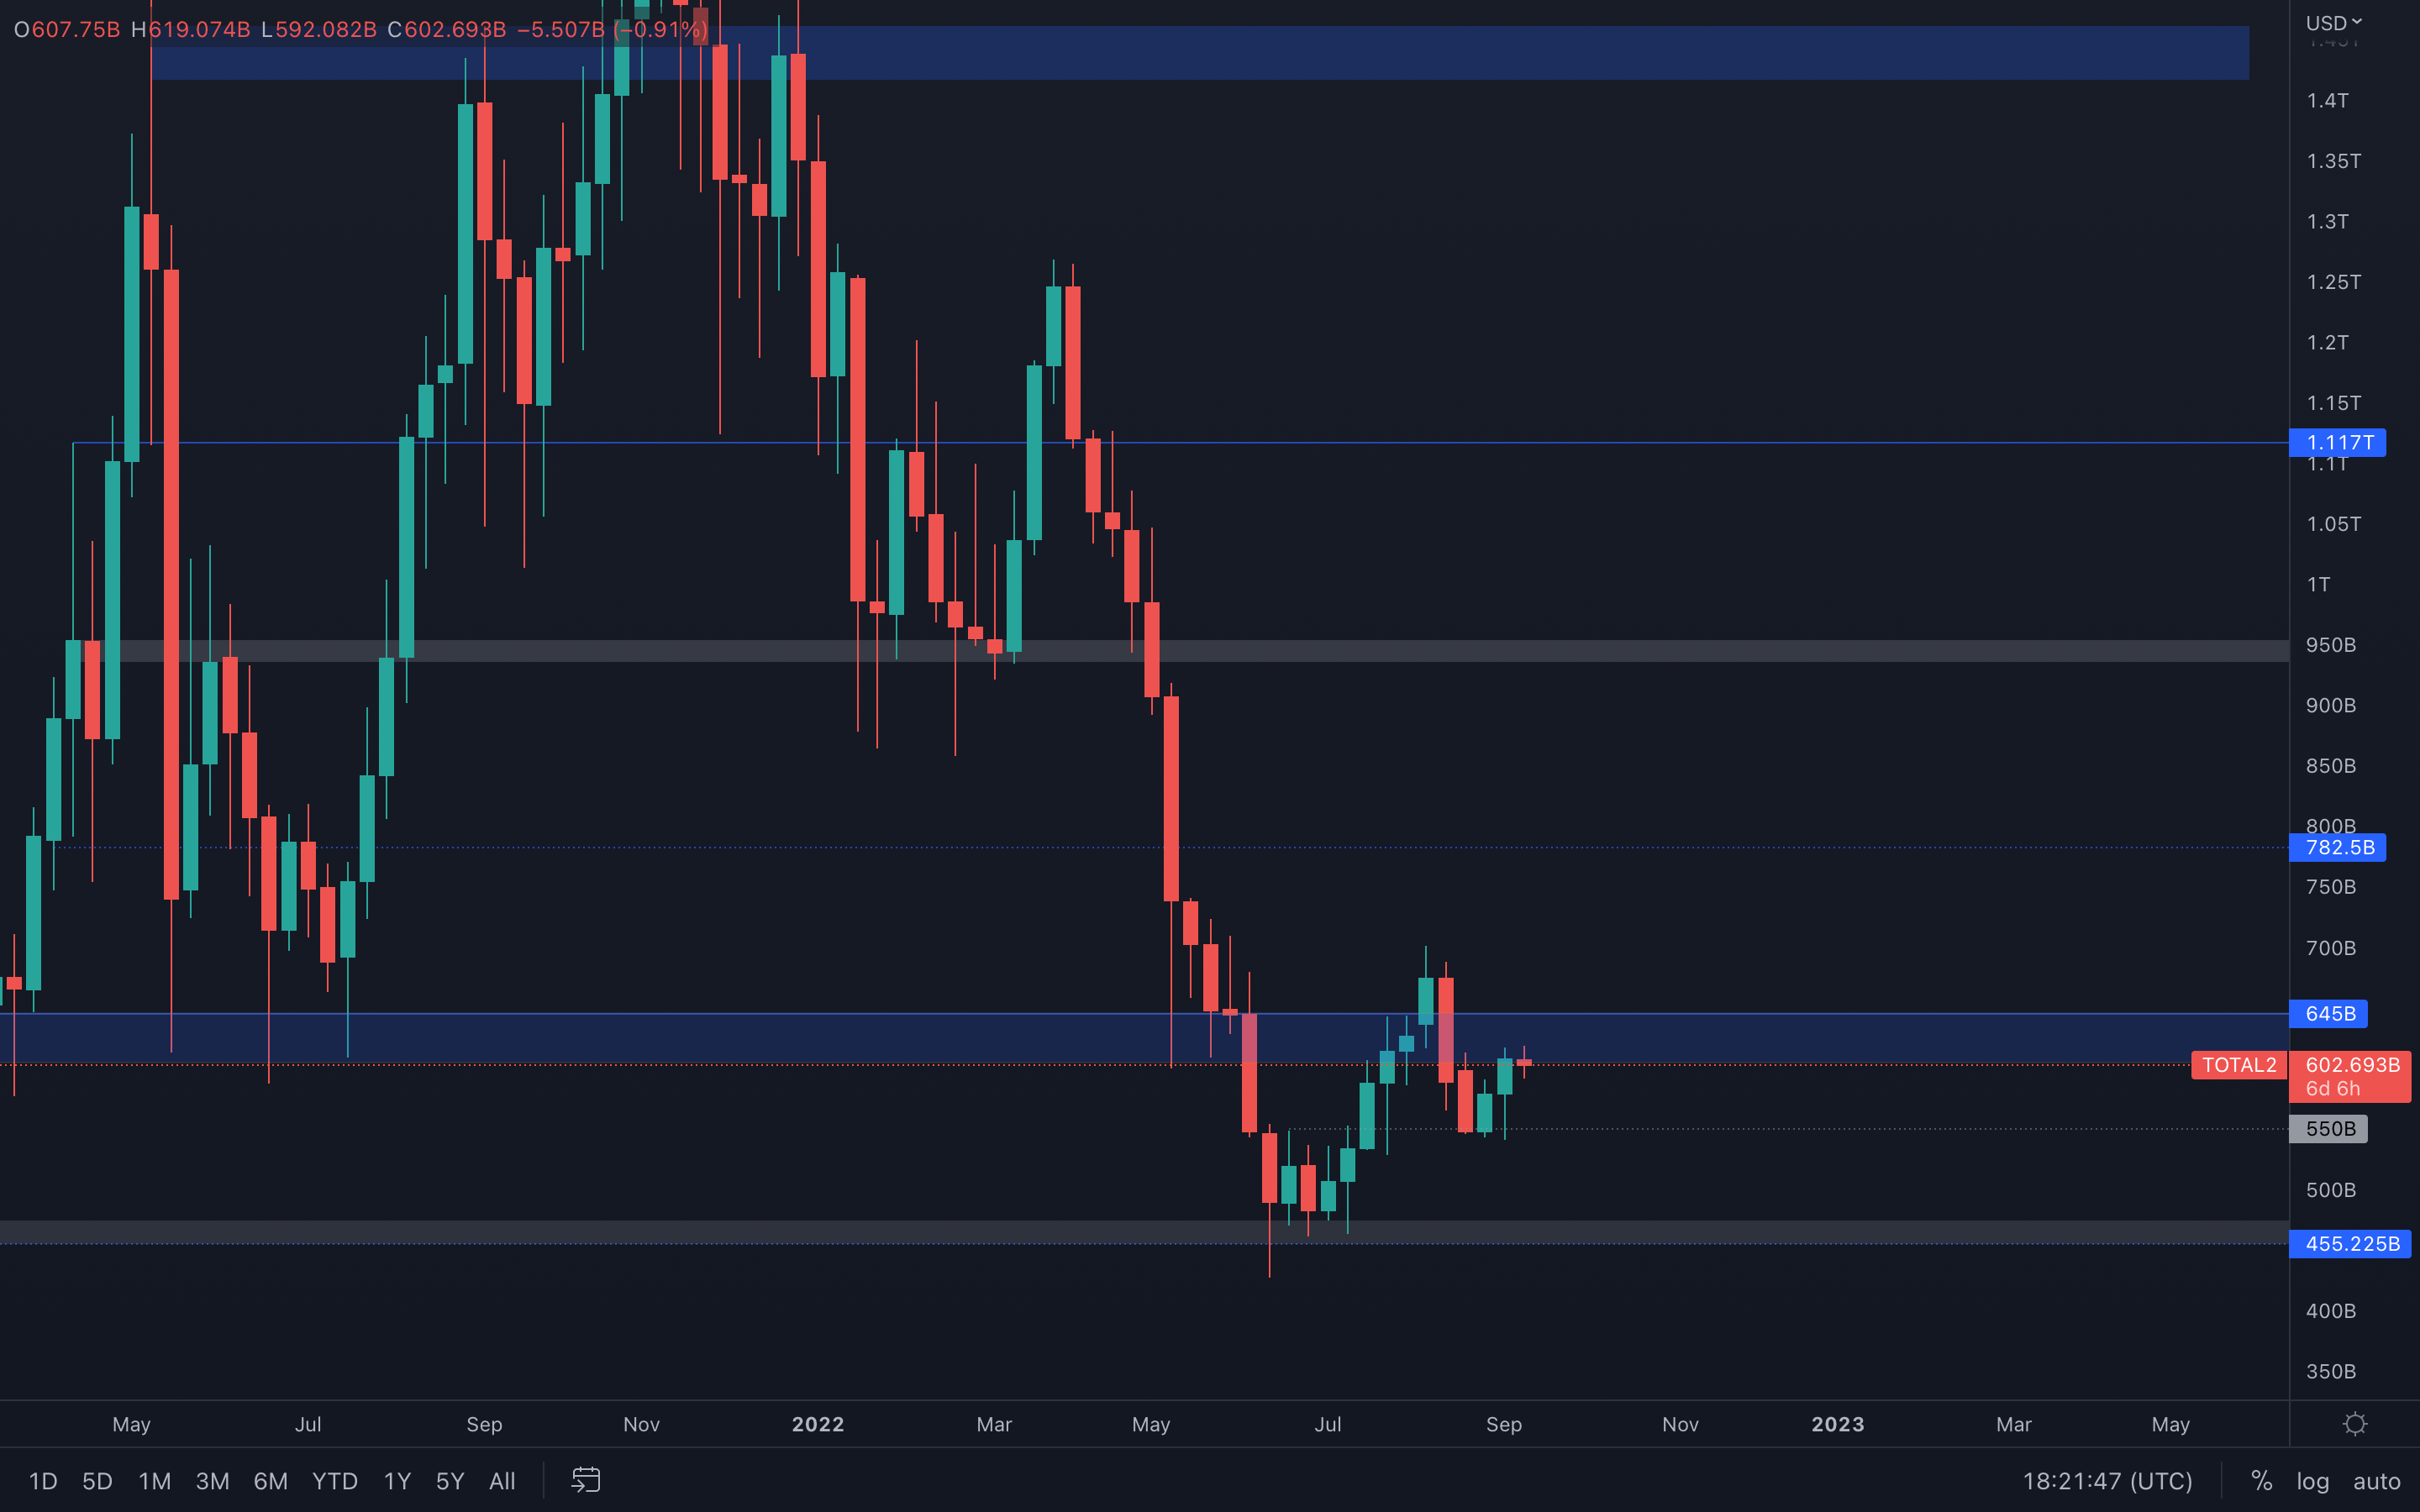 The same structure can be seen here as it can be seen on the Total Market Cap Index - the altcoins index is also showing a potential change in its weekly market structure but is still under a major resistance area. A reclaim of $645B is required for further upside to occur, otherwise, this index risks getting rejected and diving lower, to $550B and under.
Bitcoin - Technical Analysis
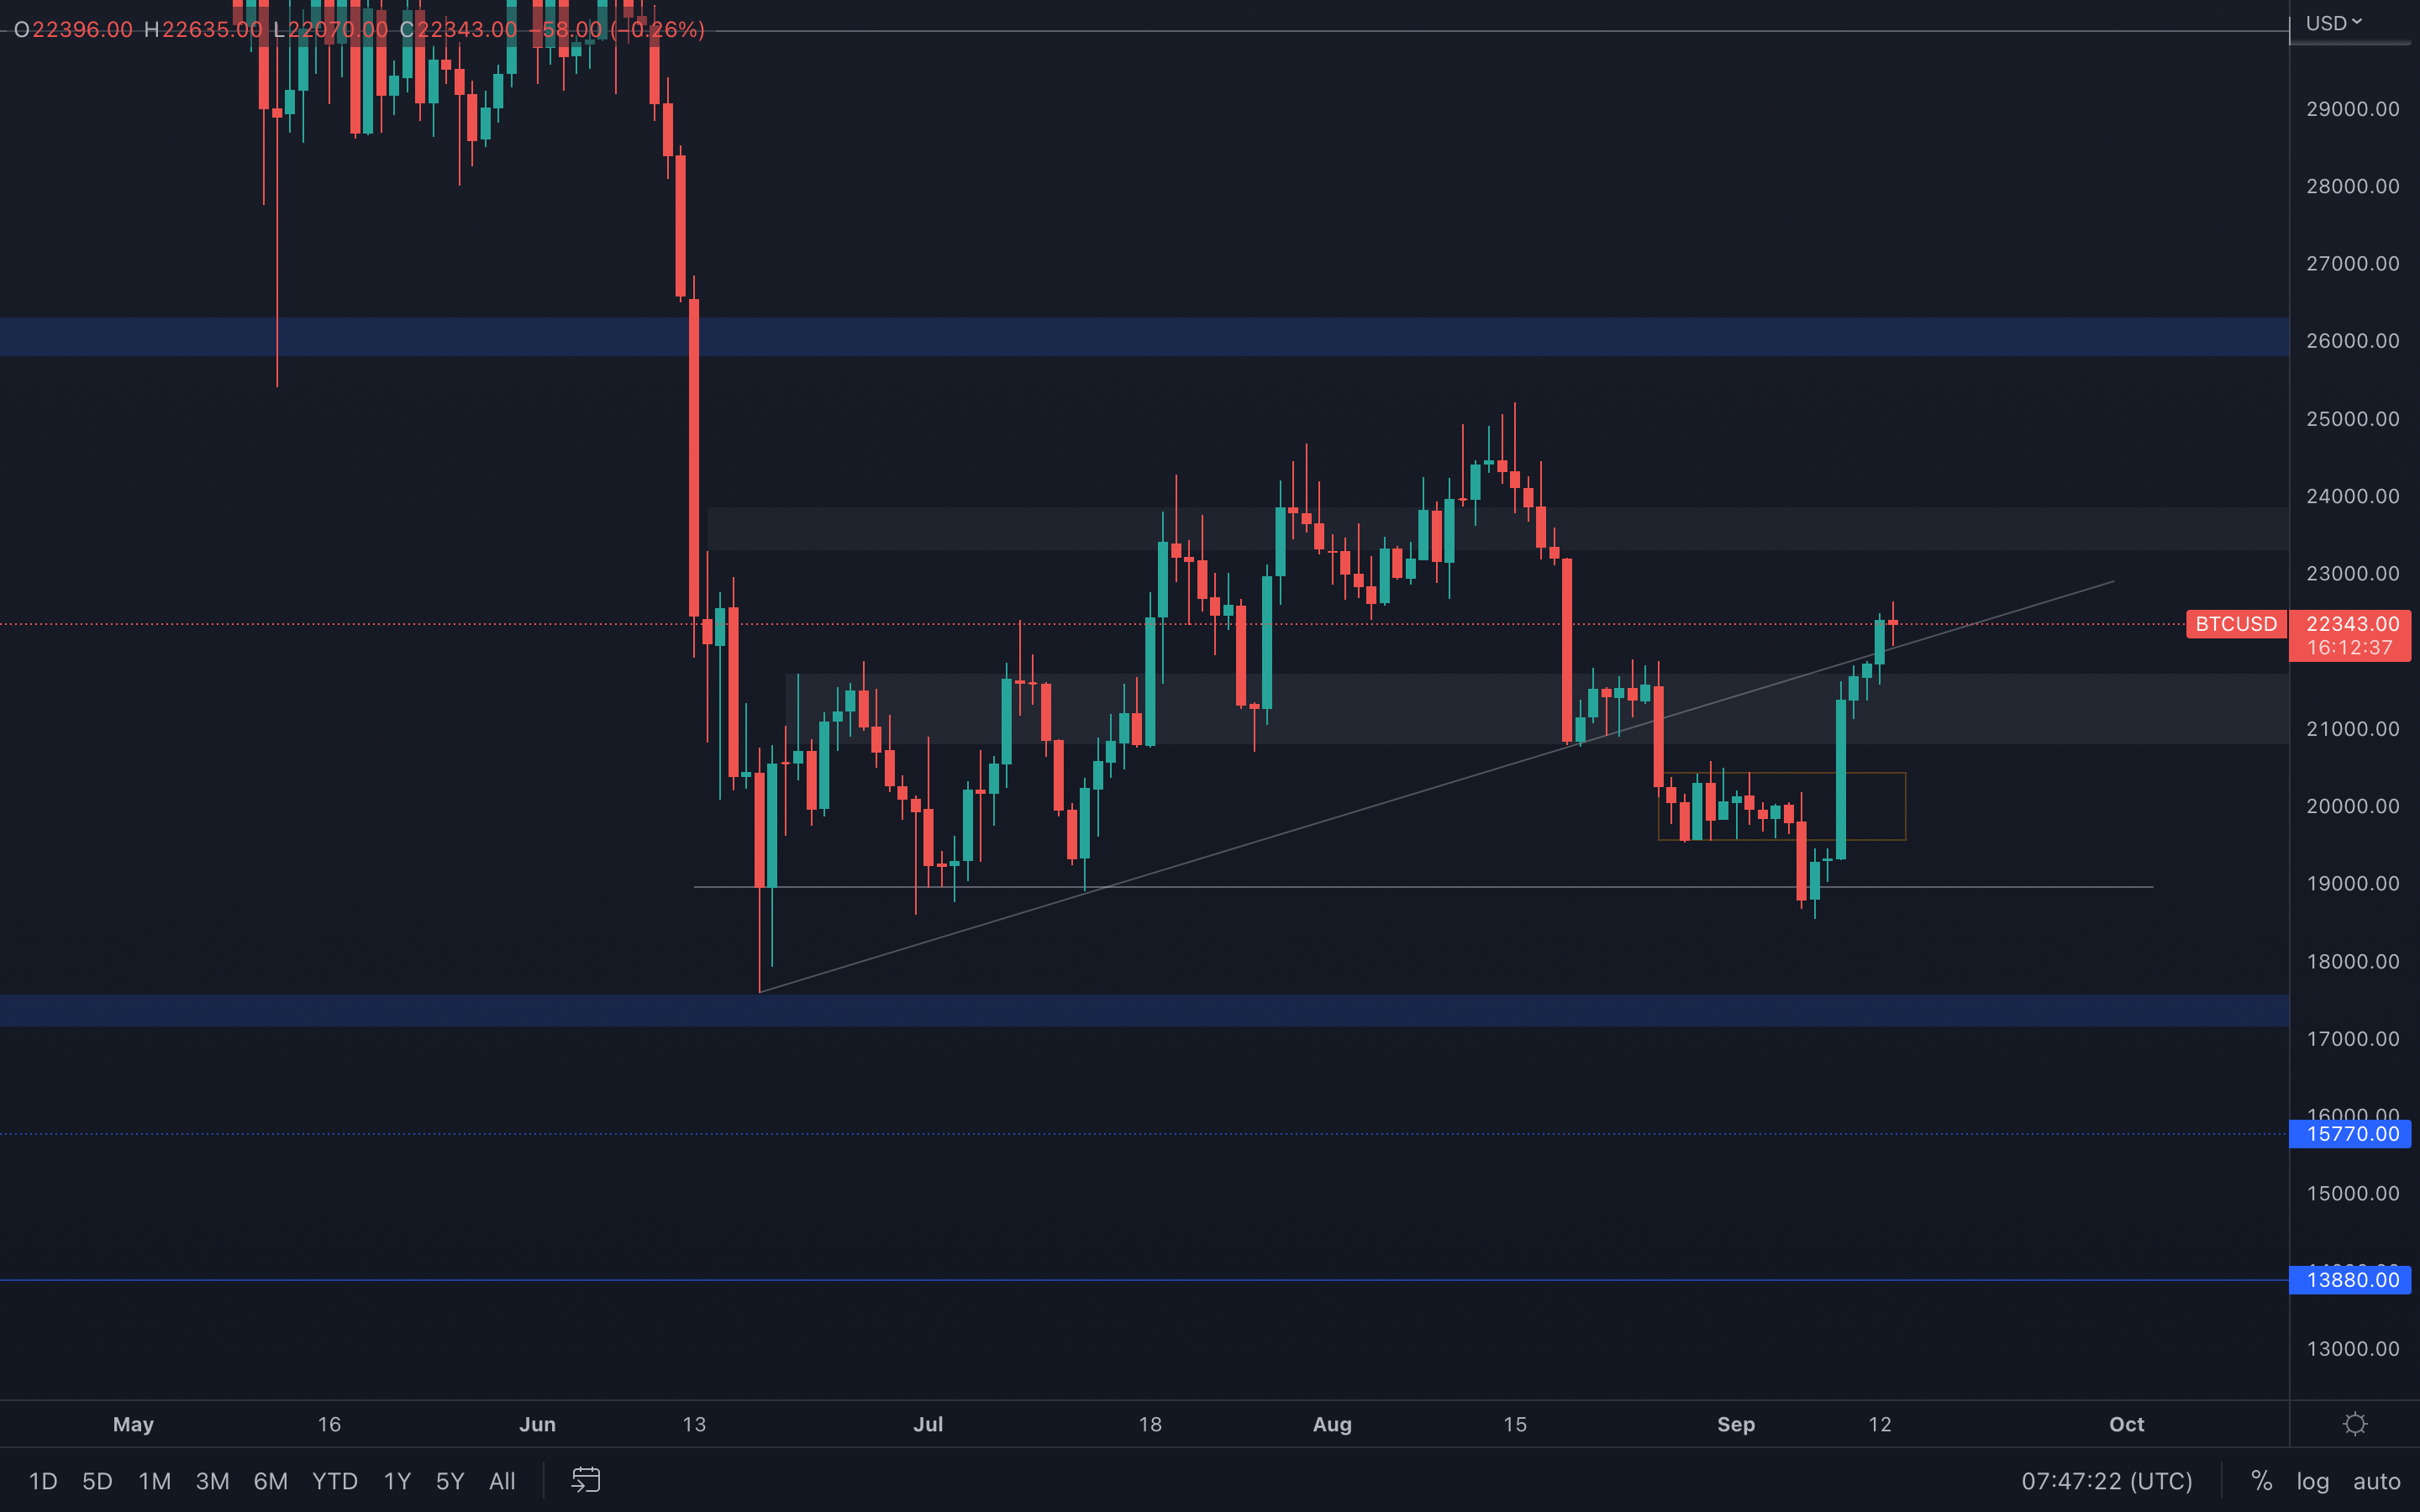
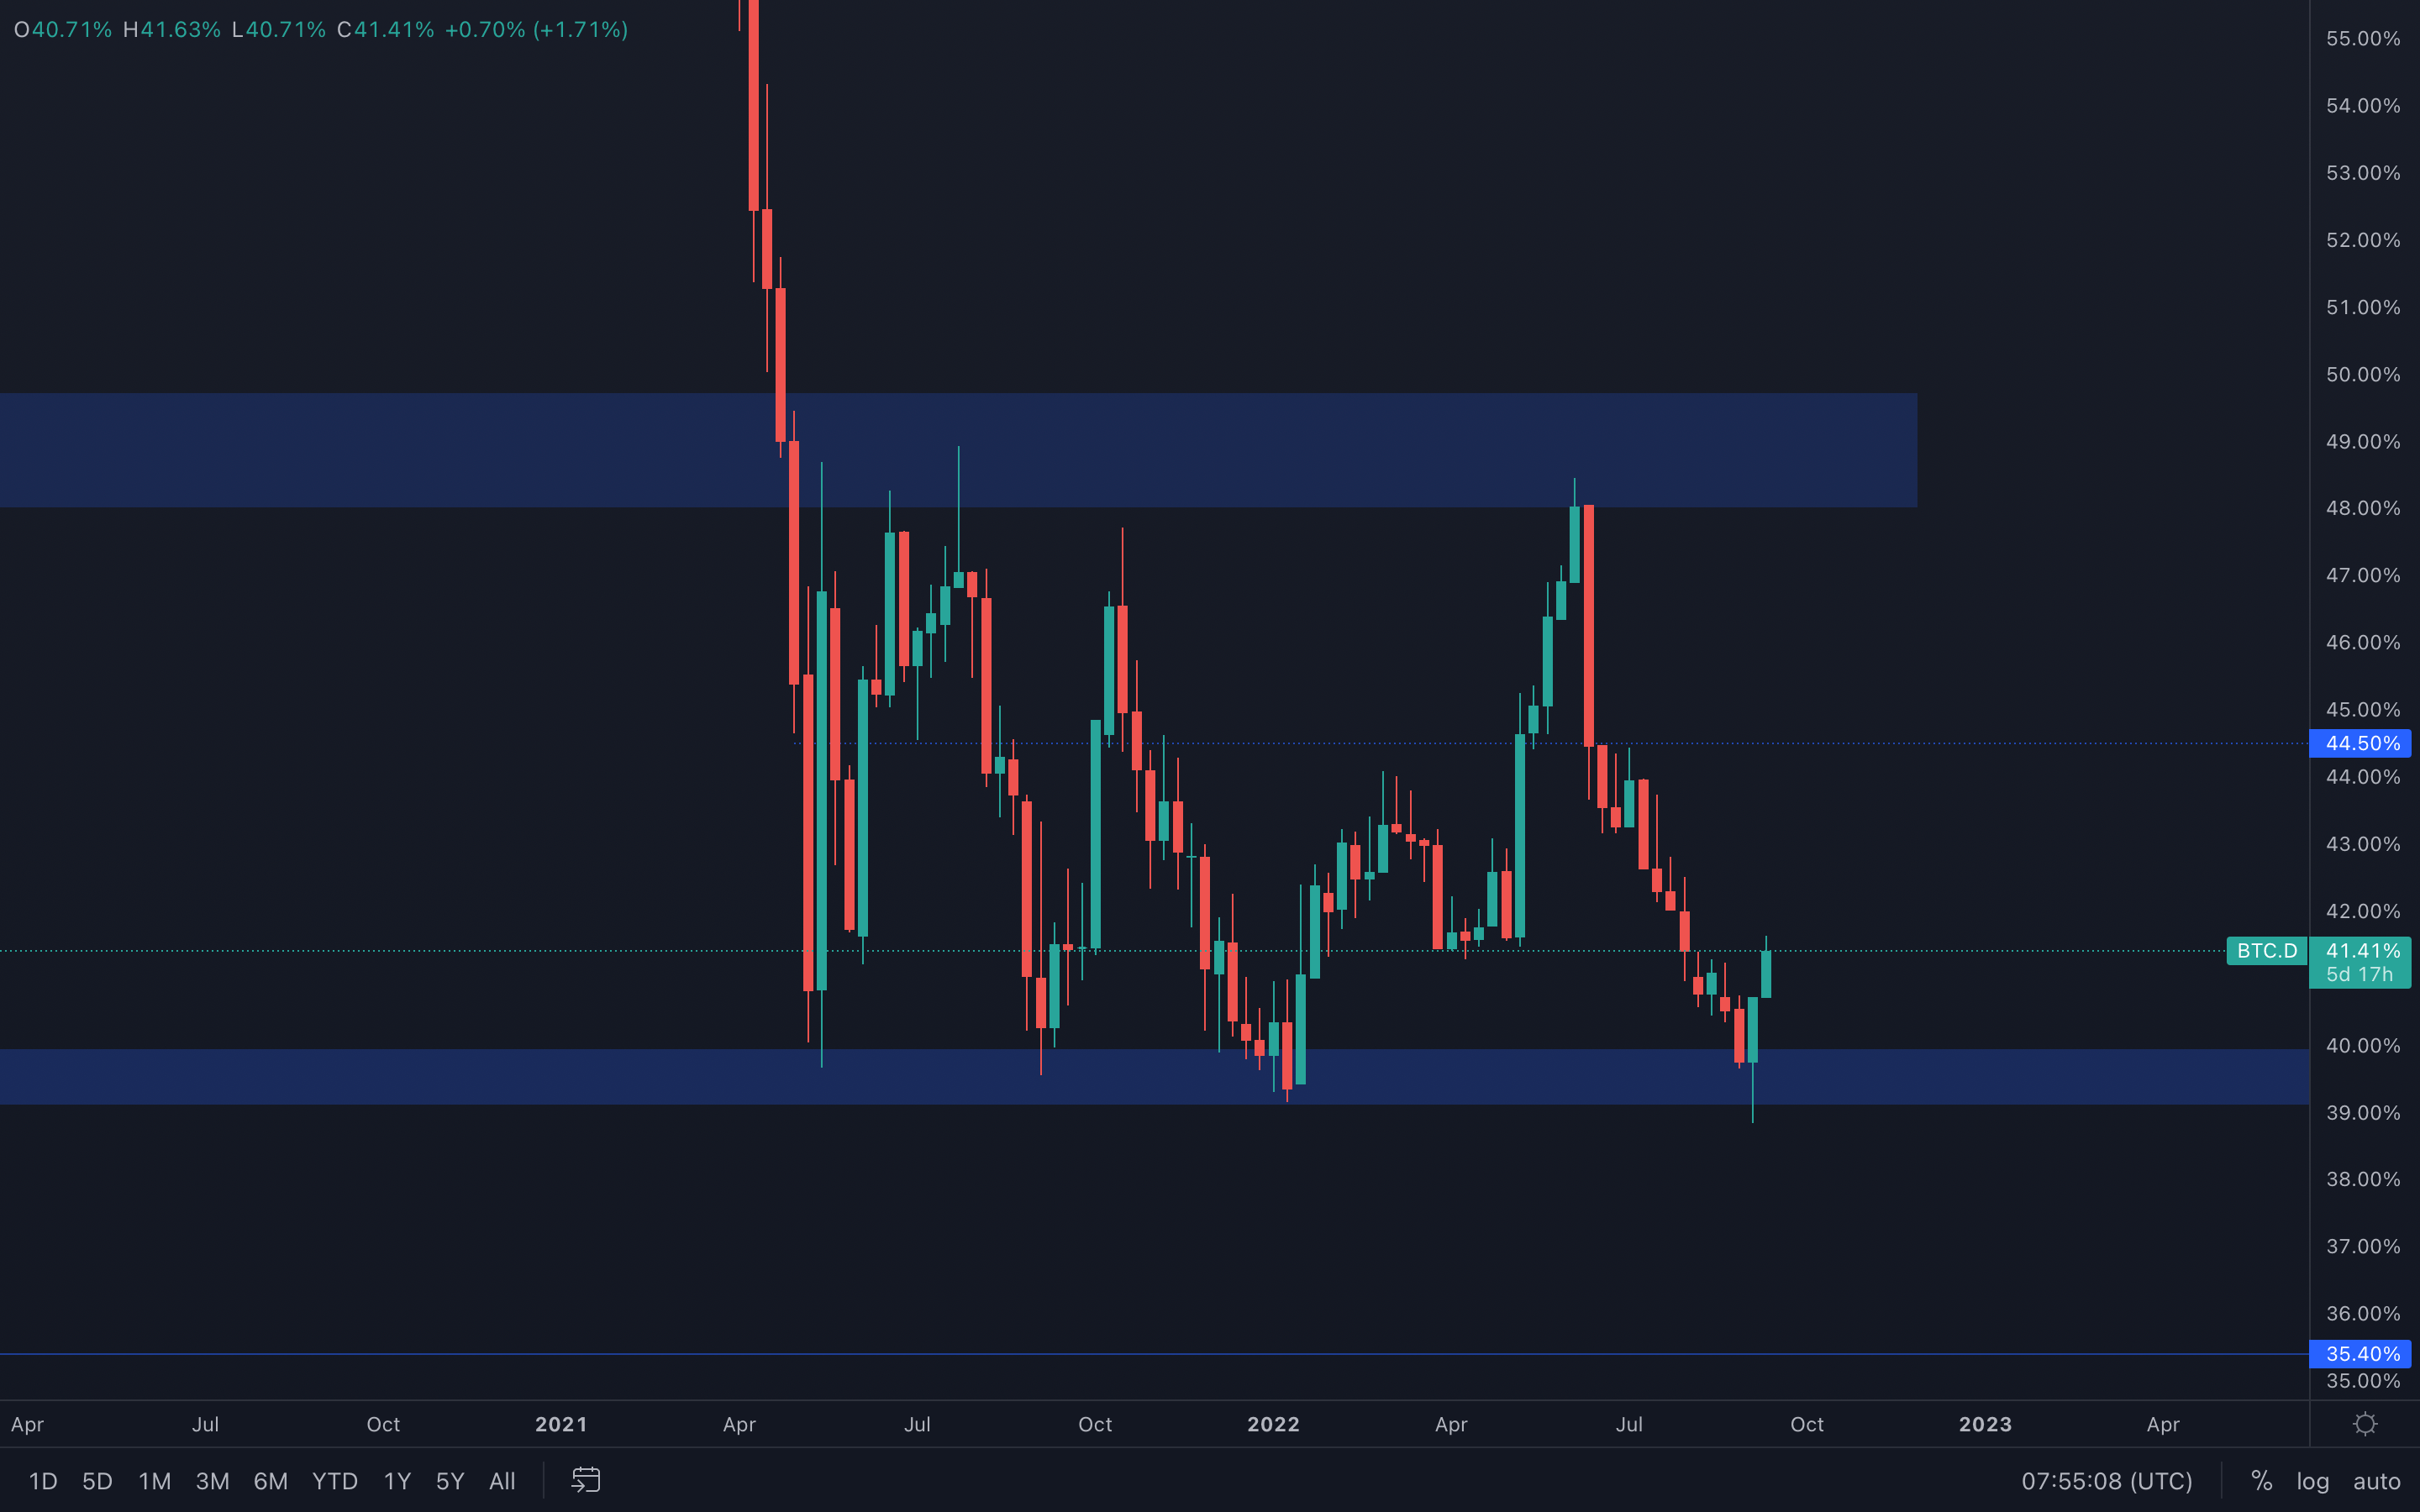
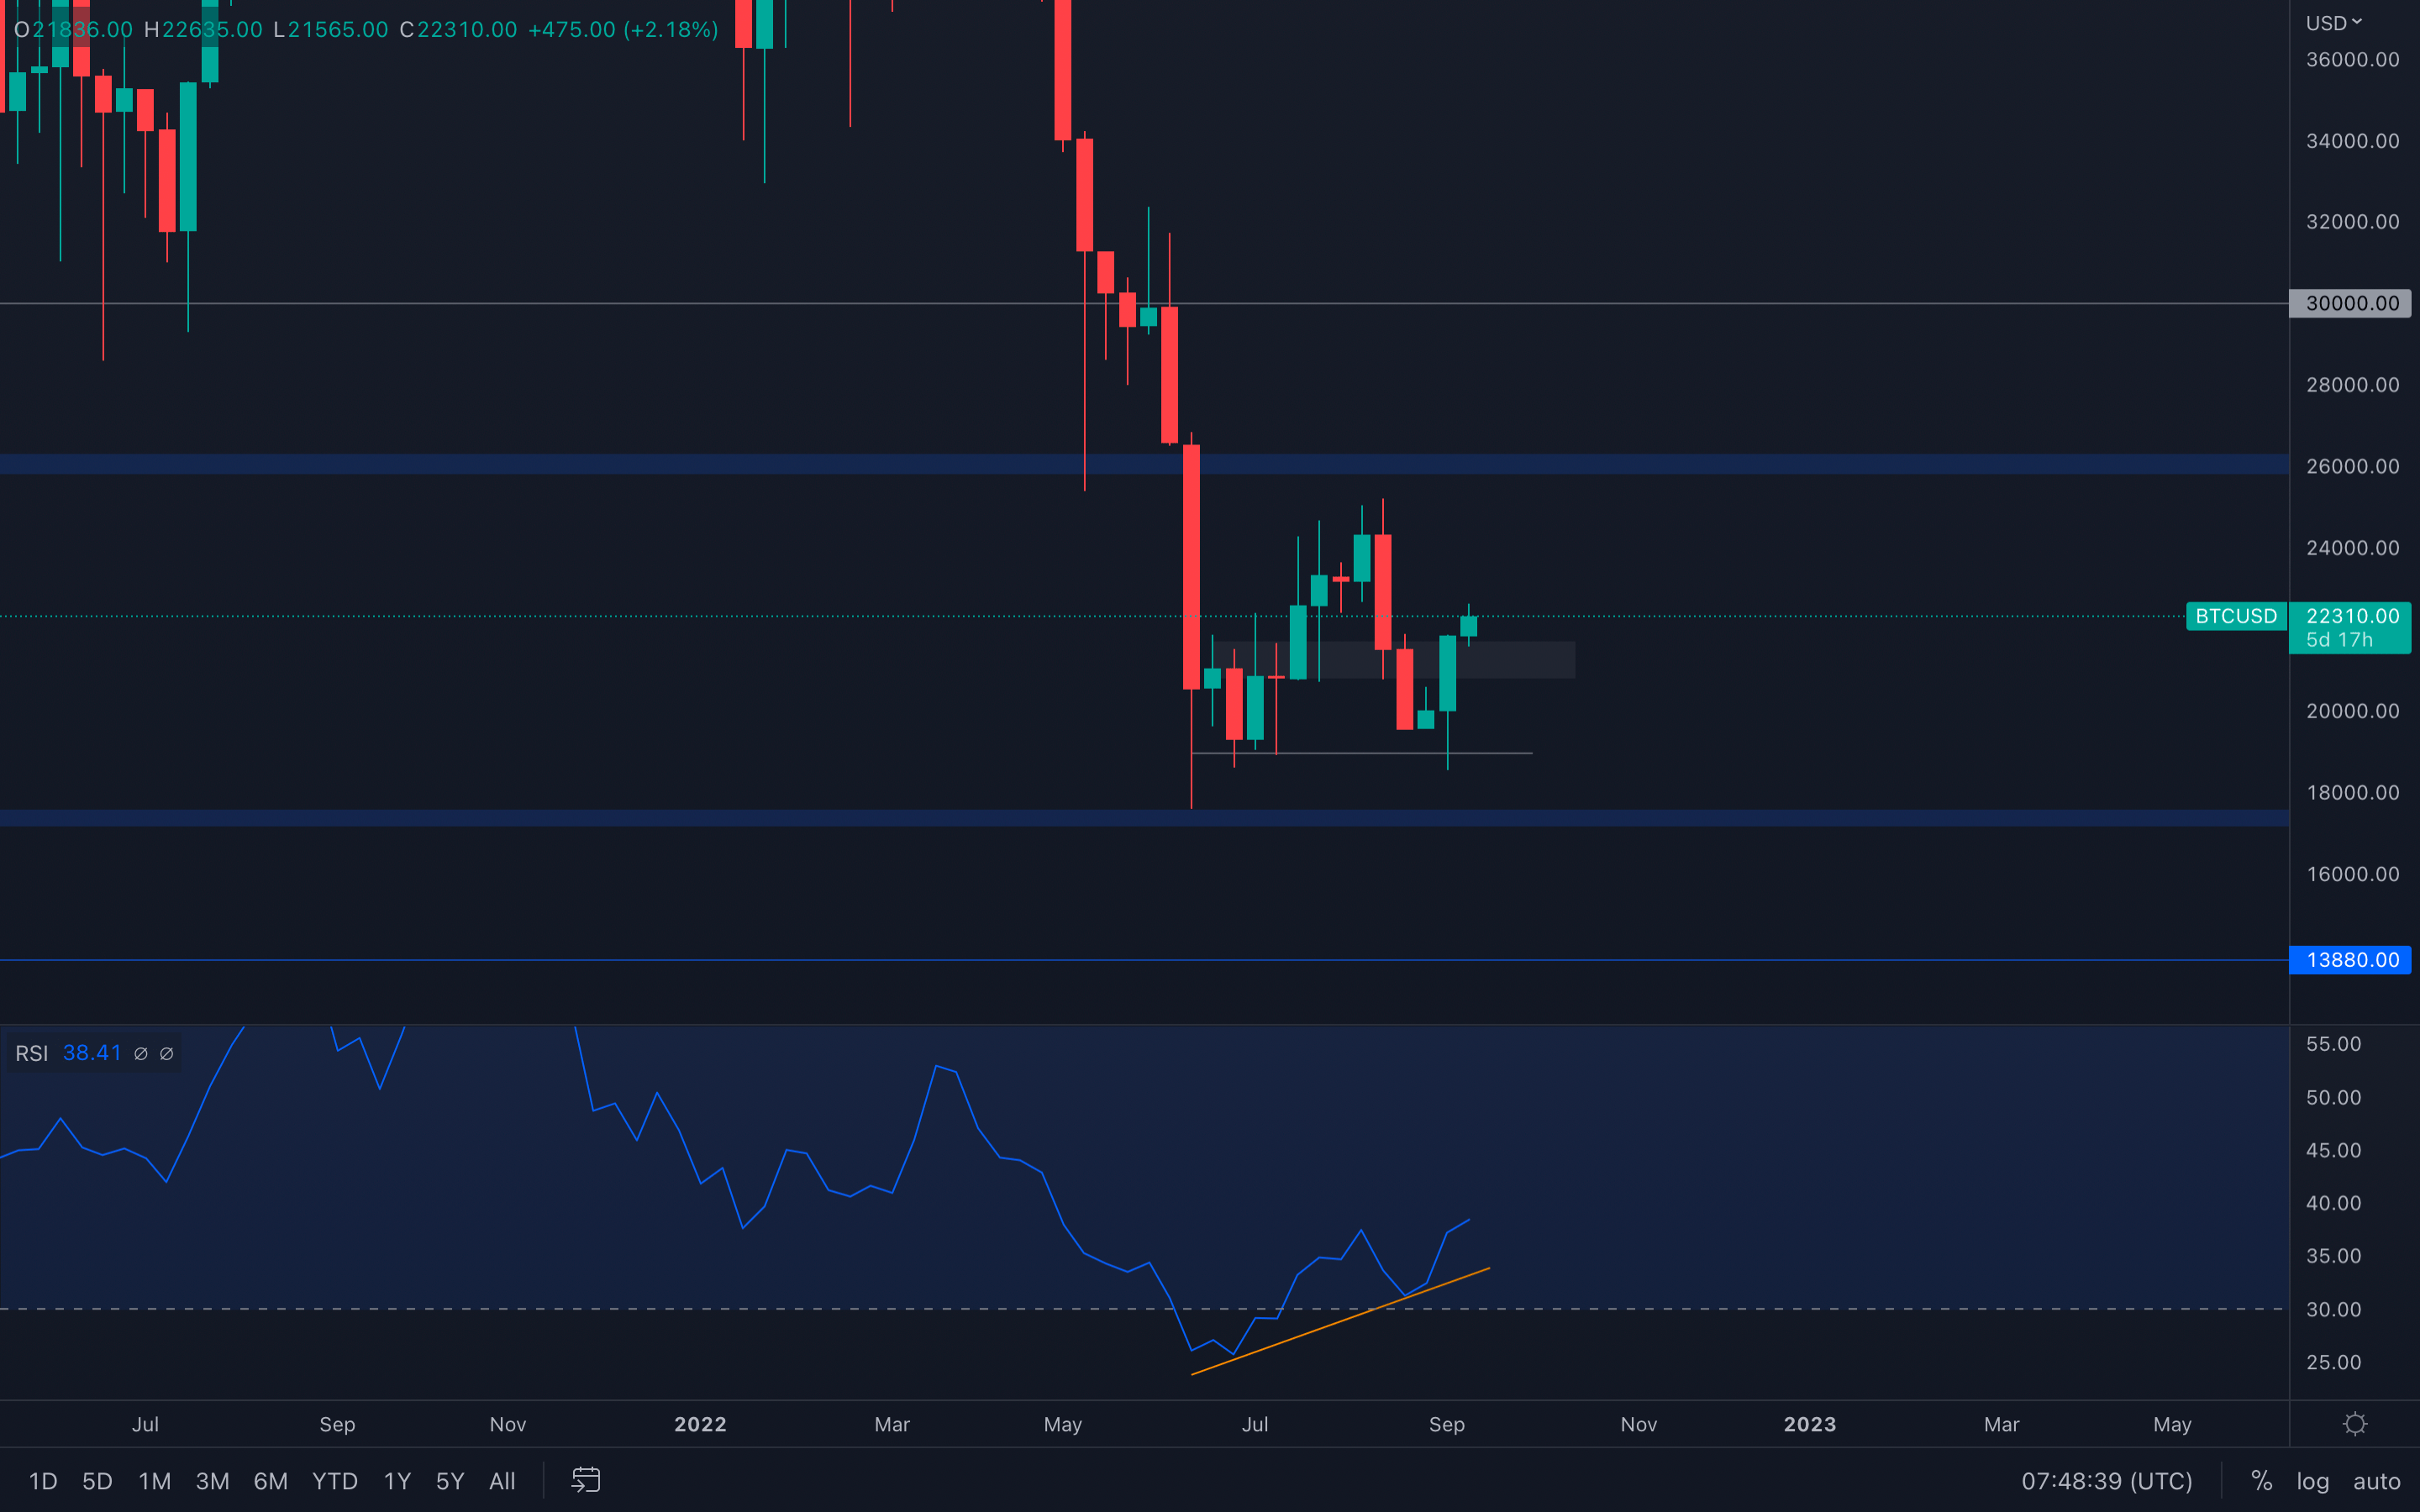 Last week's full-bodied weekly candle not only indicates increased demand, but also managed to close above a local resistance area, turning it into support ($20,750 - $21,750), which implies that from a technical standpoint, BTC now has a clear way toward a $24,000 test. Not only that, but Bitcoin's dominance has strongly bounced from a major support area, which might make it difficult for altcoins to outperform, even with the upcoming Merge on the 15th - this will make Bitcoin the outperformer.
If we dive into the weekly RSI, we can see that it has formed a higher low, while the price of Bitcoin has formed an equal low - this is known as a bullish divergence, it occurs when the oscillator forms a higher low and the price of an asset forms either a lower low or an equal low. Although an equal low doesn't provide the strongest buy signal, it's still worth mentioning as Bitcoin can experience better performance in the coming days/weeks.
On the daily BTC chart below, we can also observe a reclaim of a trend line, which further backs a $24,000 resistance test.
Bitcoin (Daily chart)
BTC Dominance
S&P 500 Index
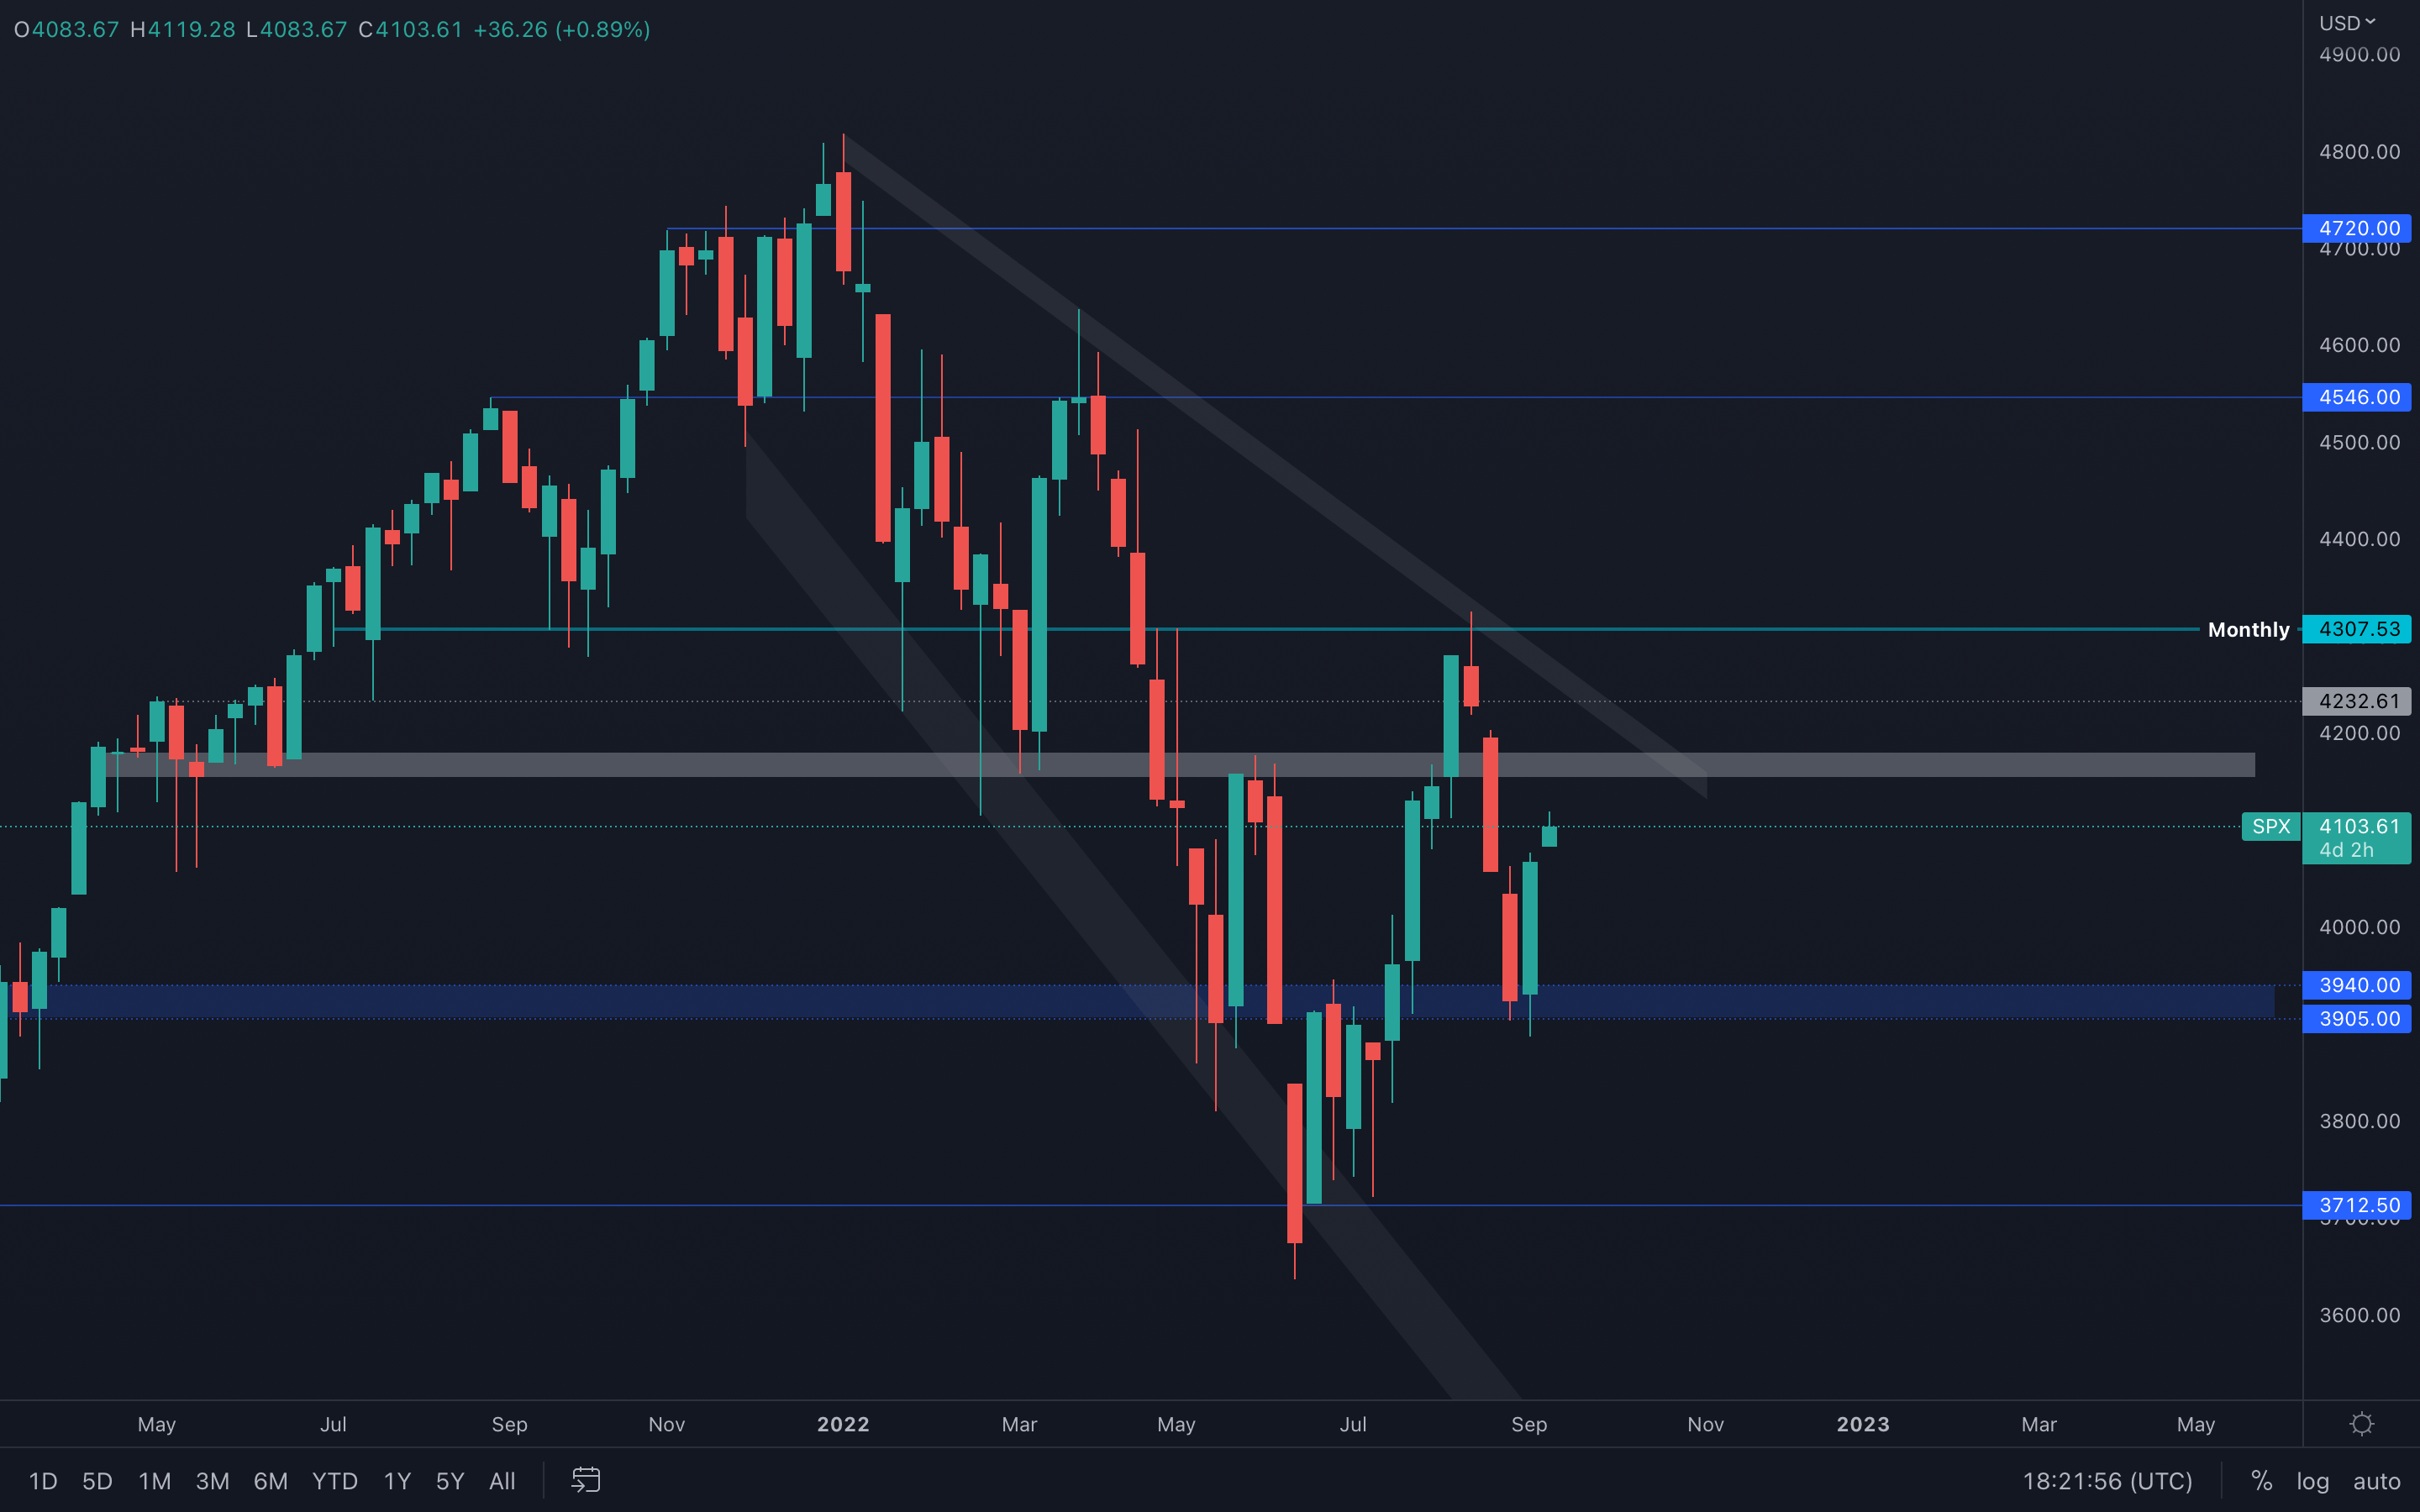 Last week, the S&P 500 Index registered a weekly bullish engulfing candle. This suggests a $4150 resistance test is now on the cards, something we mentioned in last week's report as well. There is one notable change on this chart, and that is a weekly change in market structures - with last week's candle, a higher low has been formed, which completes a weekly market structure change.
However, an important question needs answering - will this change actually be maintained for a longer period of time, or will it get short-lived as it has done last time, between January and March of this year?
Ether - Technical & On-Chain Analysis
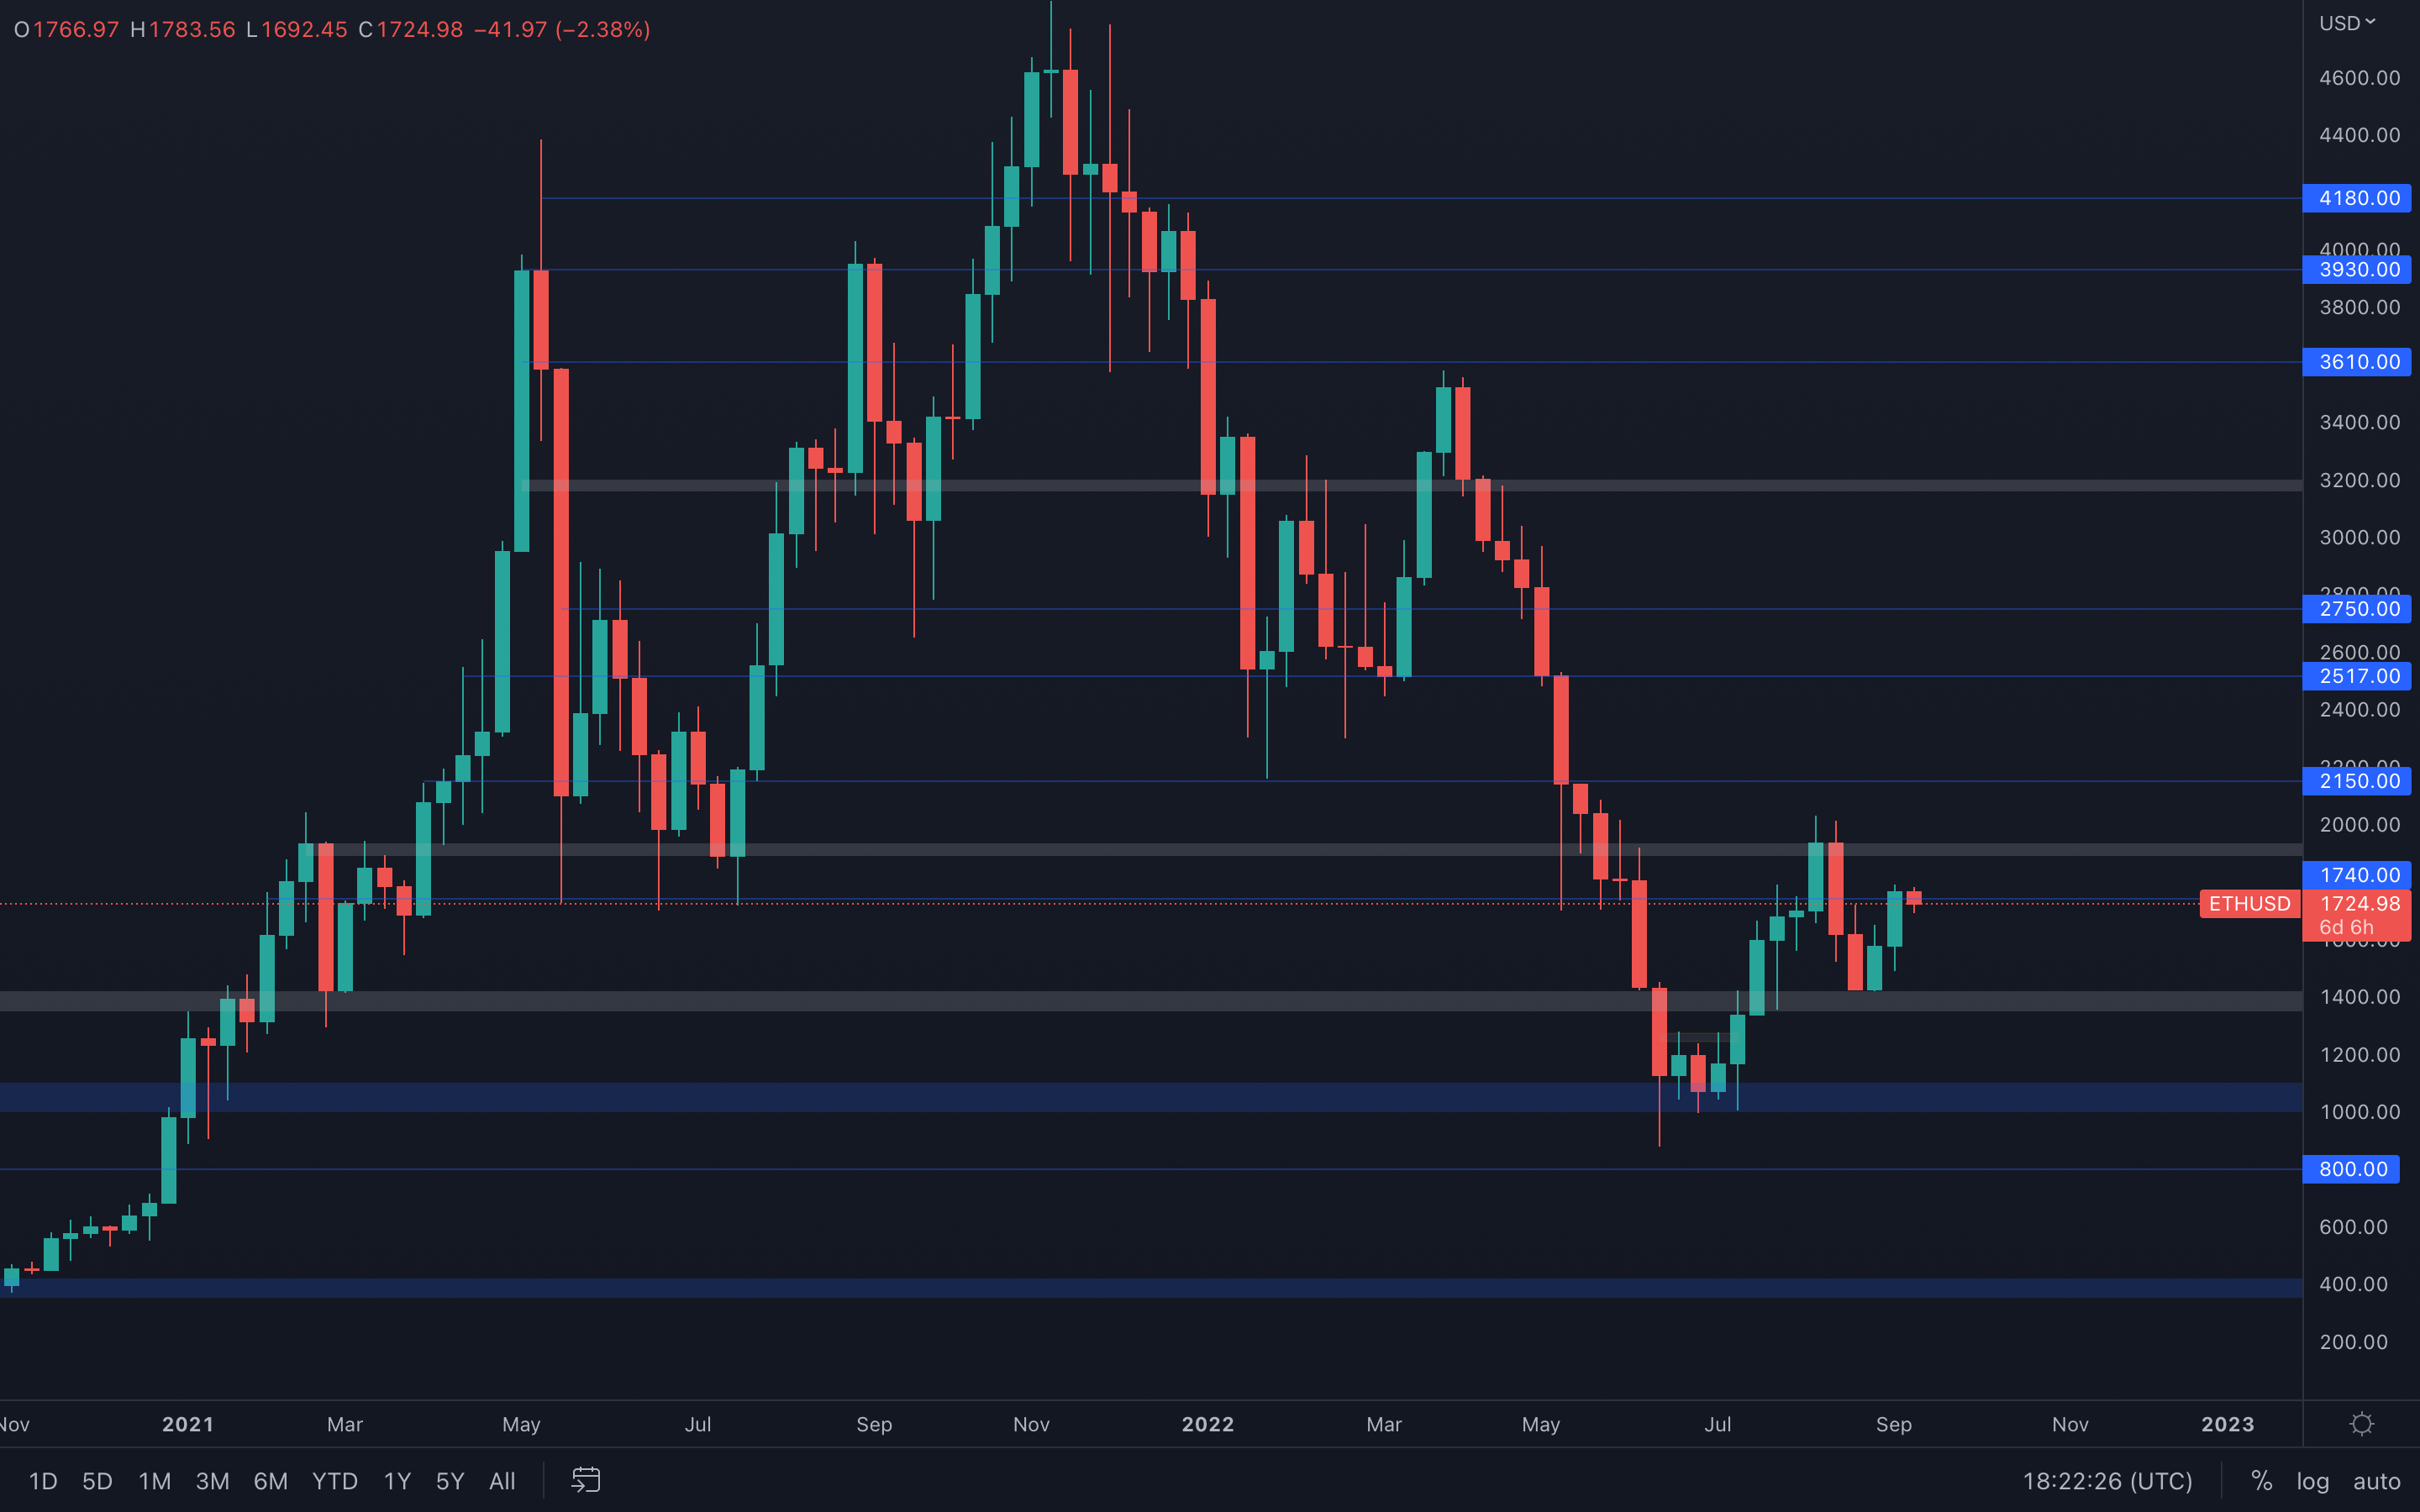 A strong performance has been seen from ETH's part, most likely driven by The Merge which comes in just two days time. Same as has been noted for the indexes & Bitcoin, Ether is experiencing a potential change in its weekly market structure, after registering a higher low at $1400 two weeks ago.
For now, Ether is battling with its $1740 resistance level, which, if reclaimed, can lead to a $1900 resistance test with little to no effort. In order for the bullish scenario to occur, Ether needs to reclaim $1740 on both daily & weekly timeframes, so that's what we will be monitoring.
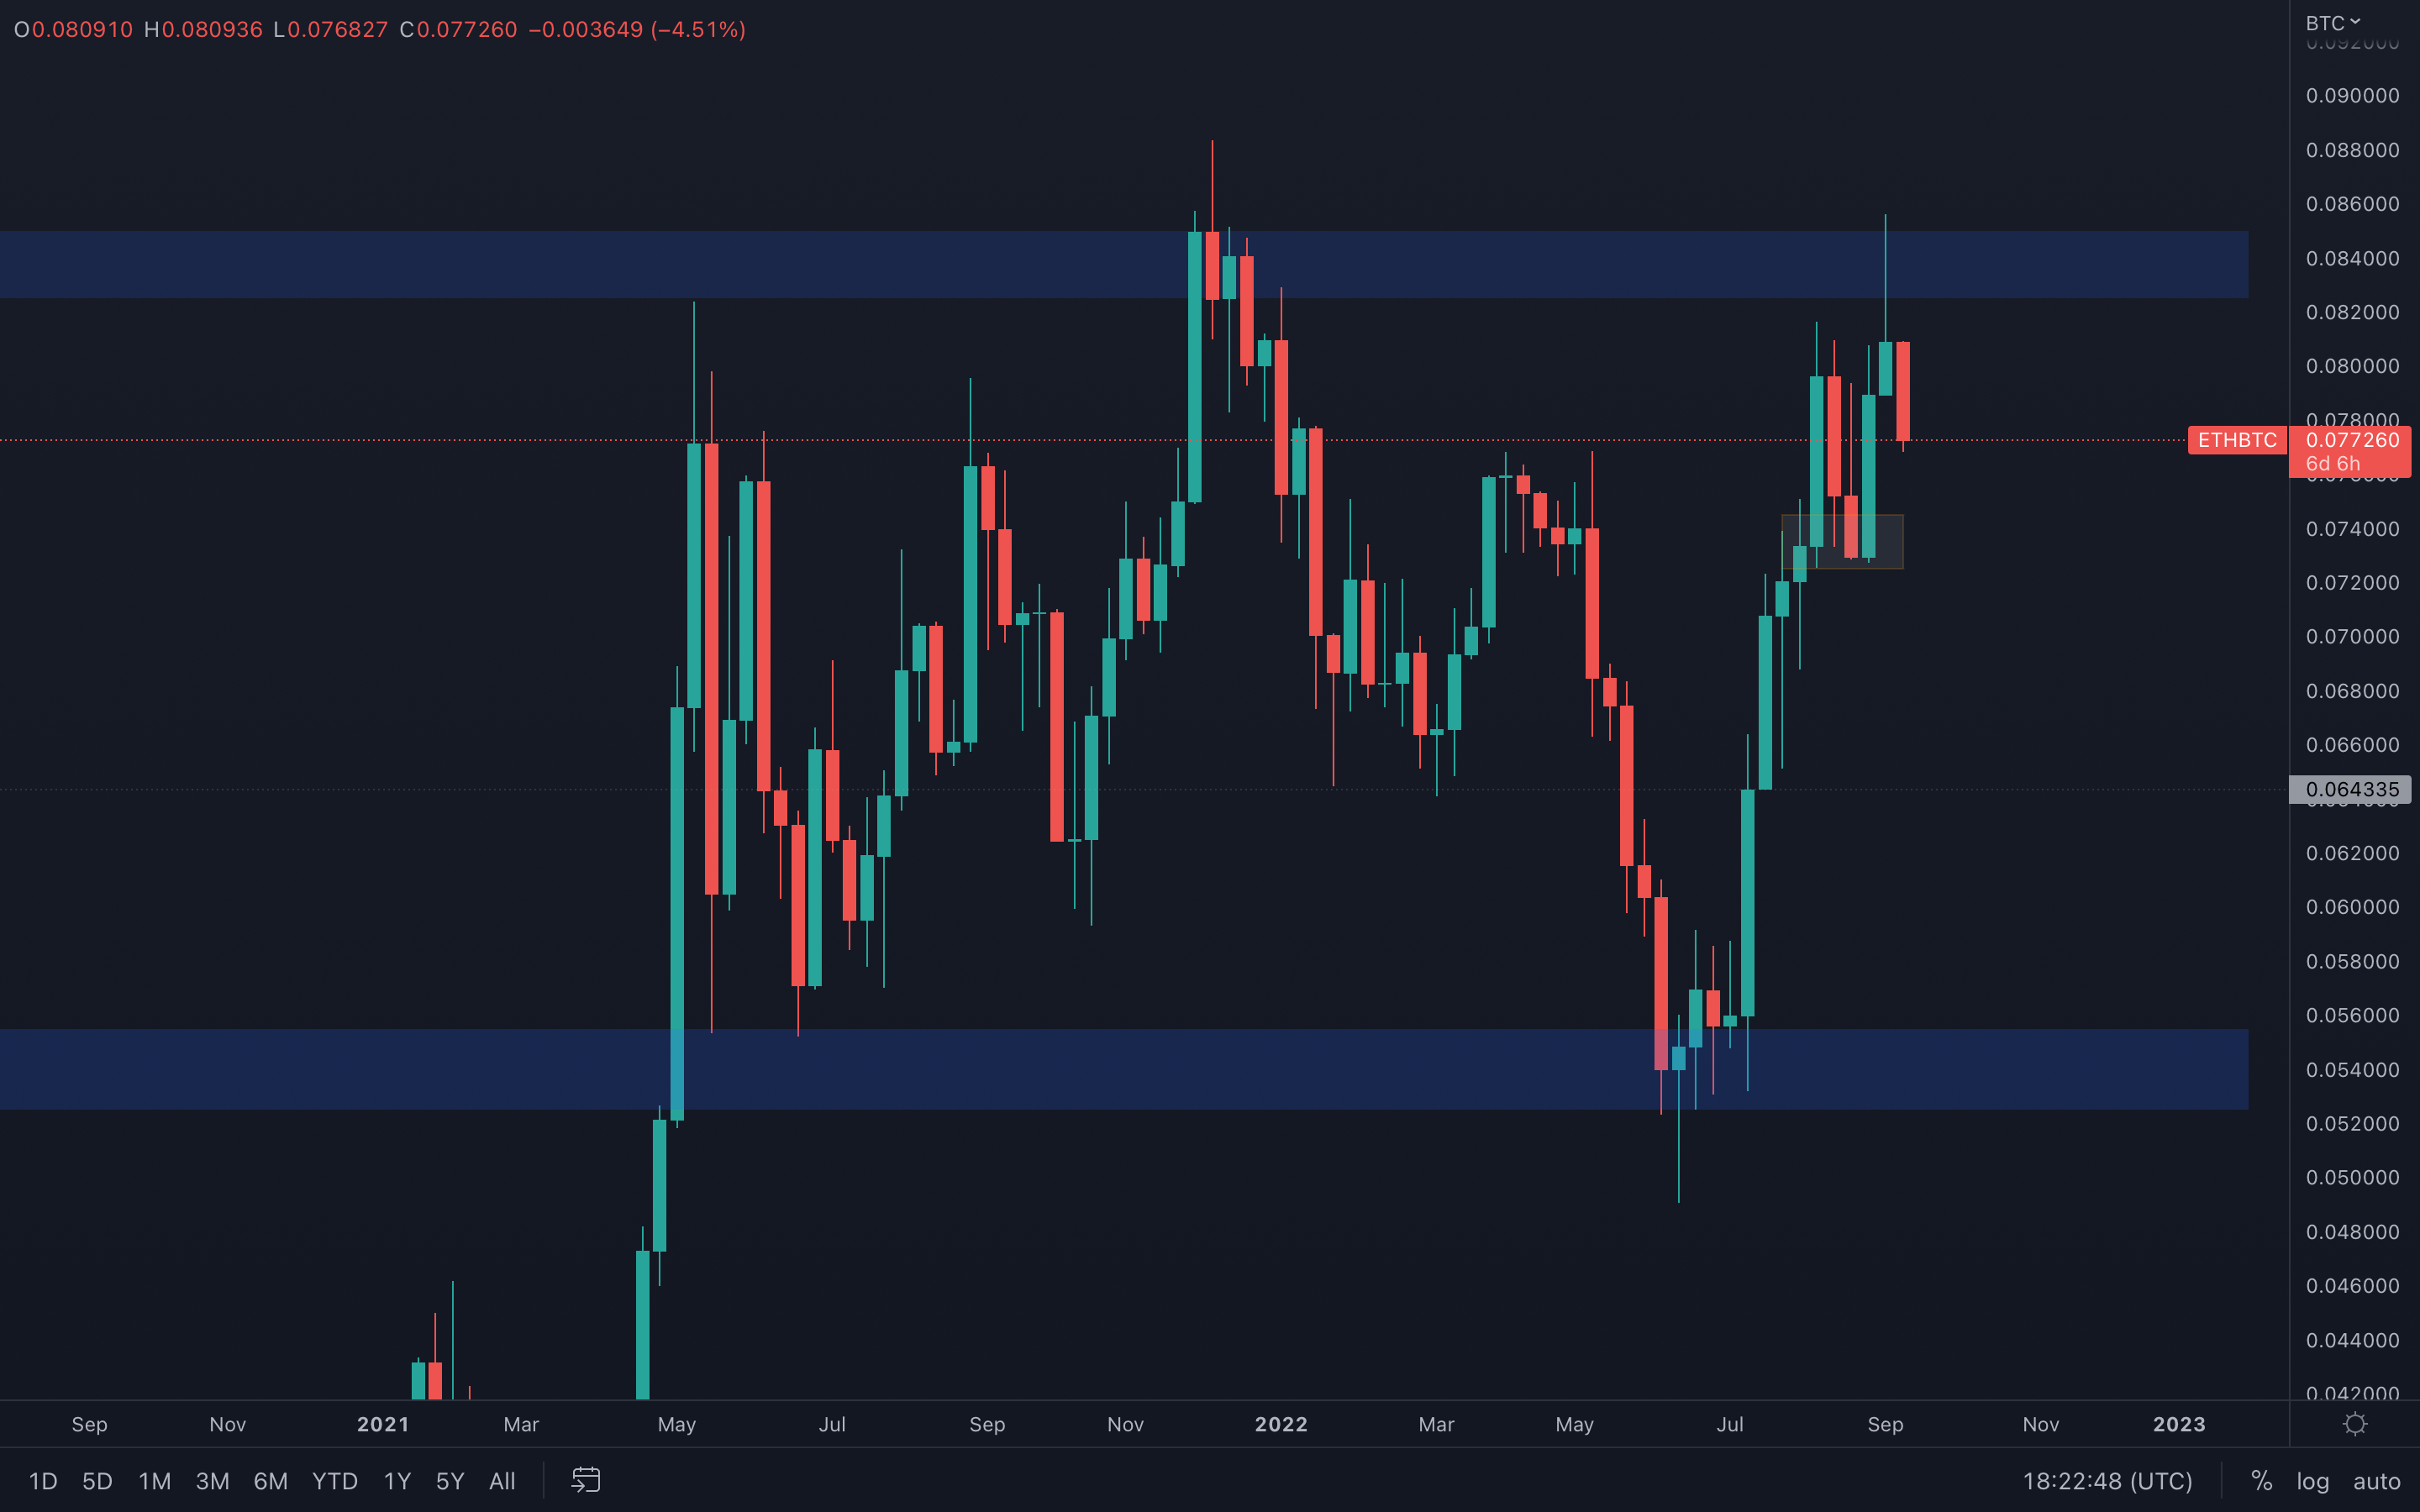
On another note, Ether's pairing with Bitcoin can also be seen getting rejected from a major resistance area - this only tells us that Bitcoin will most likely be the outperformer in the coming weeks, unless ETH experiences a strong increase in its demand that leads the pairing toward another resistance test. Check the chart below for context:
ETH/BTC
Metric 1 – Exchange Balance + ETH 2.0 Total Value Staked by Provider
The first set of metrics we will look into for Ether is the amount of Ether currently being held on Exchanges and the ETH 2.0 Total Value Staked by Provider. The number of Ether being held on Exchanges has dramatically decreased over the past two years - from a high of 31.7 million in August 2020 to in the past few weeks having been as low as 20.0 million. In the last week of August (2022), the amount of Ether on Exchanges was 21.0 million, however, in the price drop from $1,650 to $1,480, the amount of Ether on Exchanges decreased to 20.0 million. This means that in this last week of August, 5% of the Ether on Exchanges was accumulated by investors and moved elsewhere.
Ether – Exchange Balance
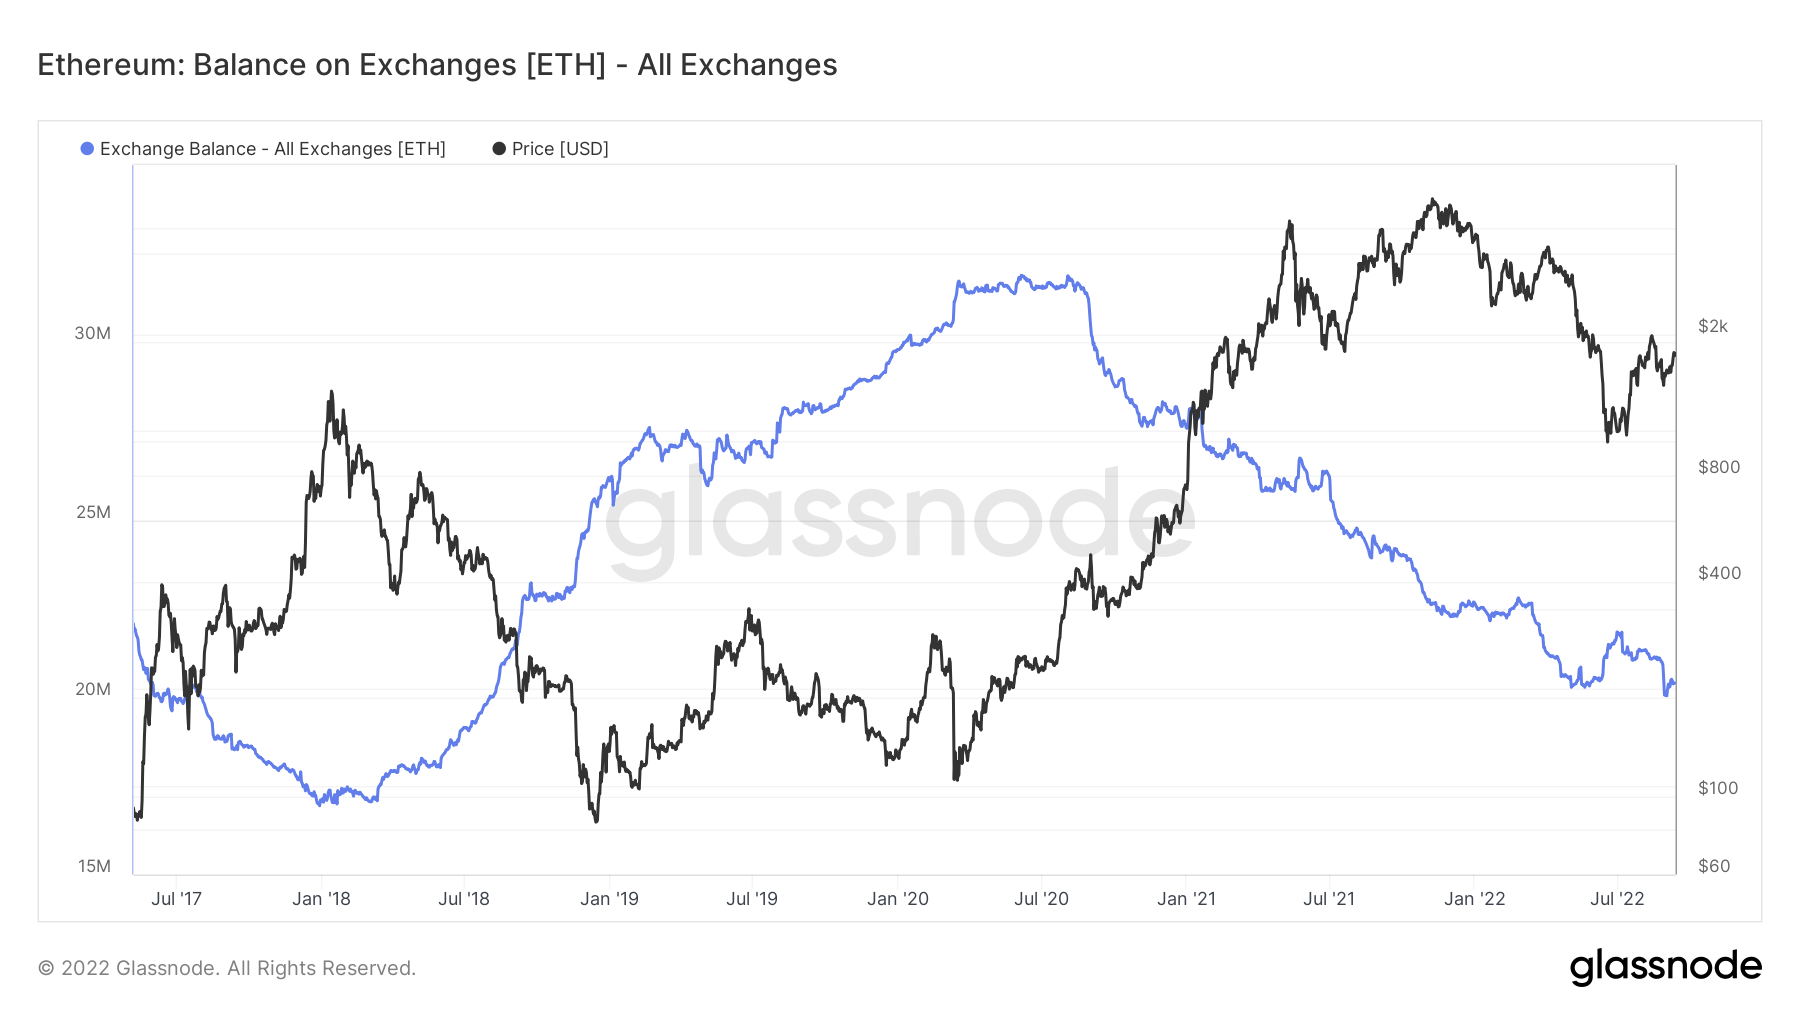
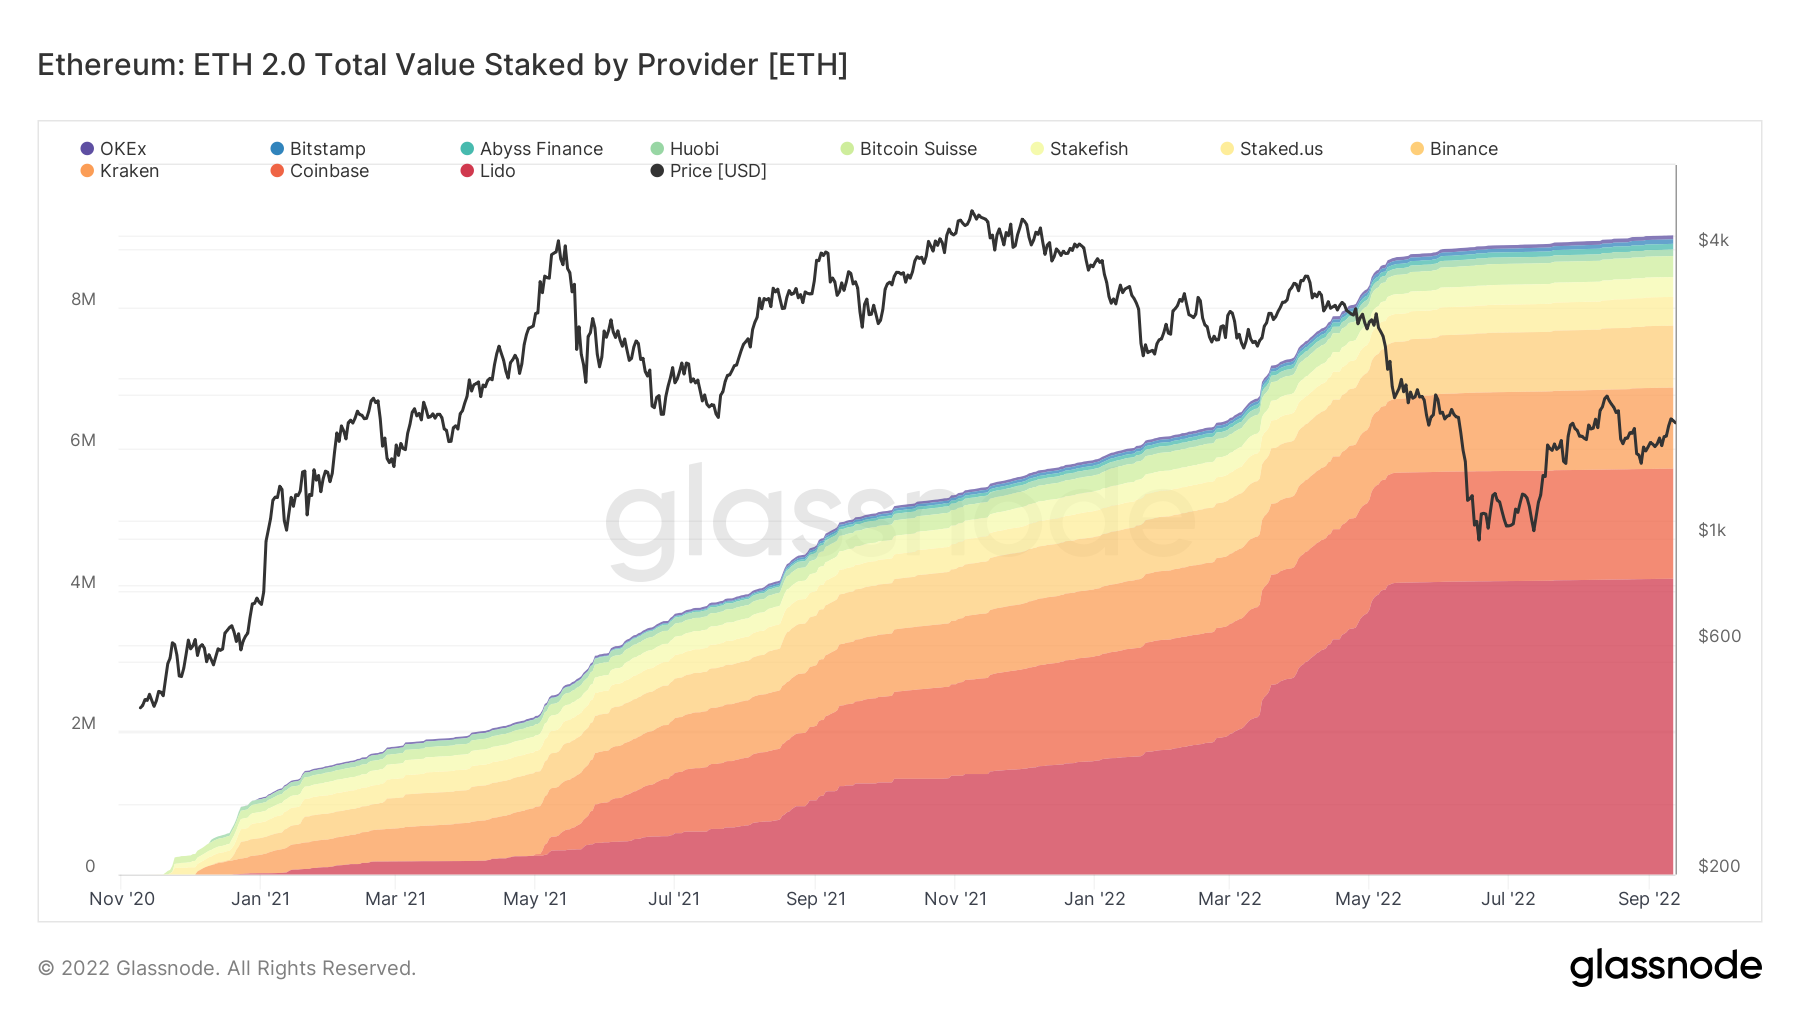
We can see in the above that since August 2020, the amount of Ether on Exchanges has decreased considerably. This may be due to investors selling some Ether into higher prices and looking to accumulate again at lower prices but also due to investors wanting to stake their Ether. We can see in the below chart that since Q4 2020, nearly 9 million Ether have been staked. This is likely to be a reason in why in this same time period, the amount of Ether on Exchanges has fallen from just shy of 32 million to now just over 20 million.
Ether – ETH 2.0 Total Value Staked by Provider
Metric 2 - Addresses
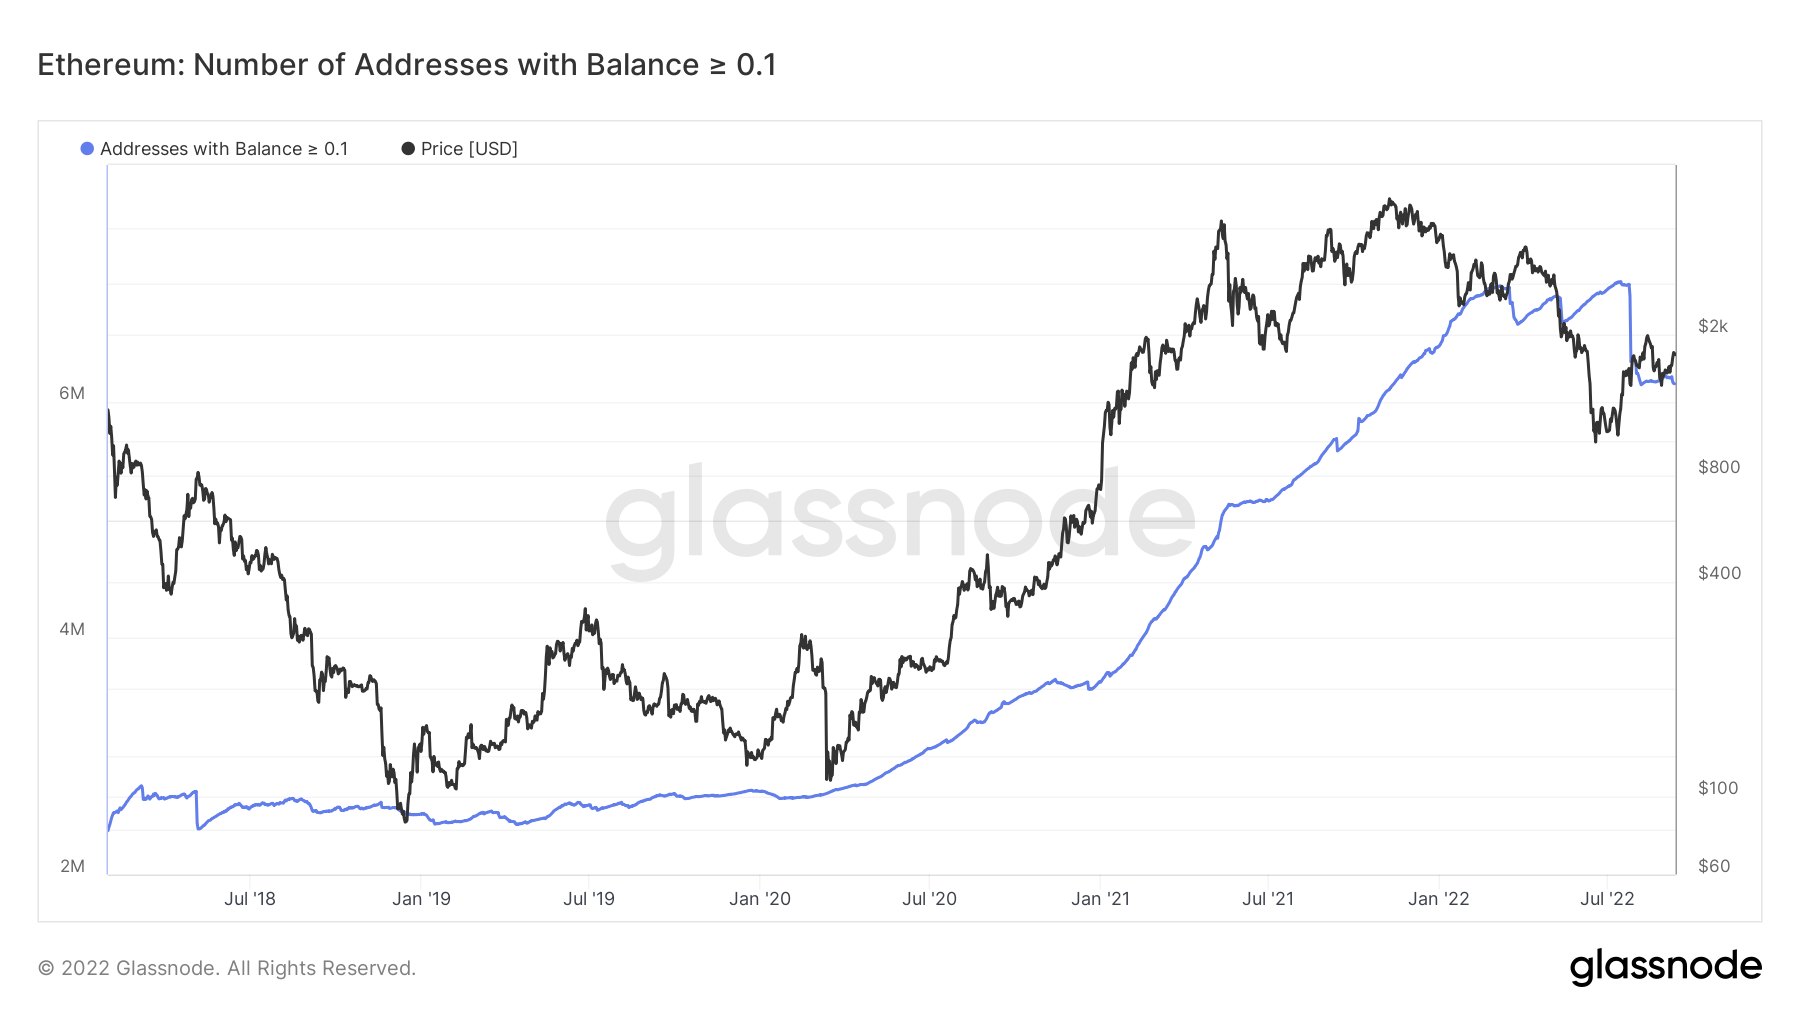
In general, the wallets holding a lesser amount of coins have continually accumulated up until the June lows. Since then, these wallets have sold off some of their supply.
Ether – Addresses with Balance > 0.1 Ether
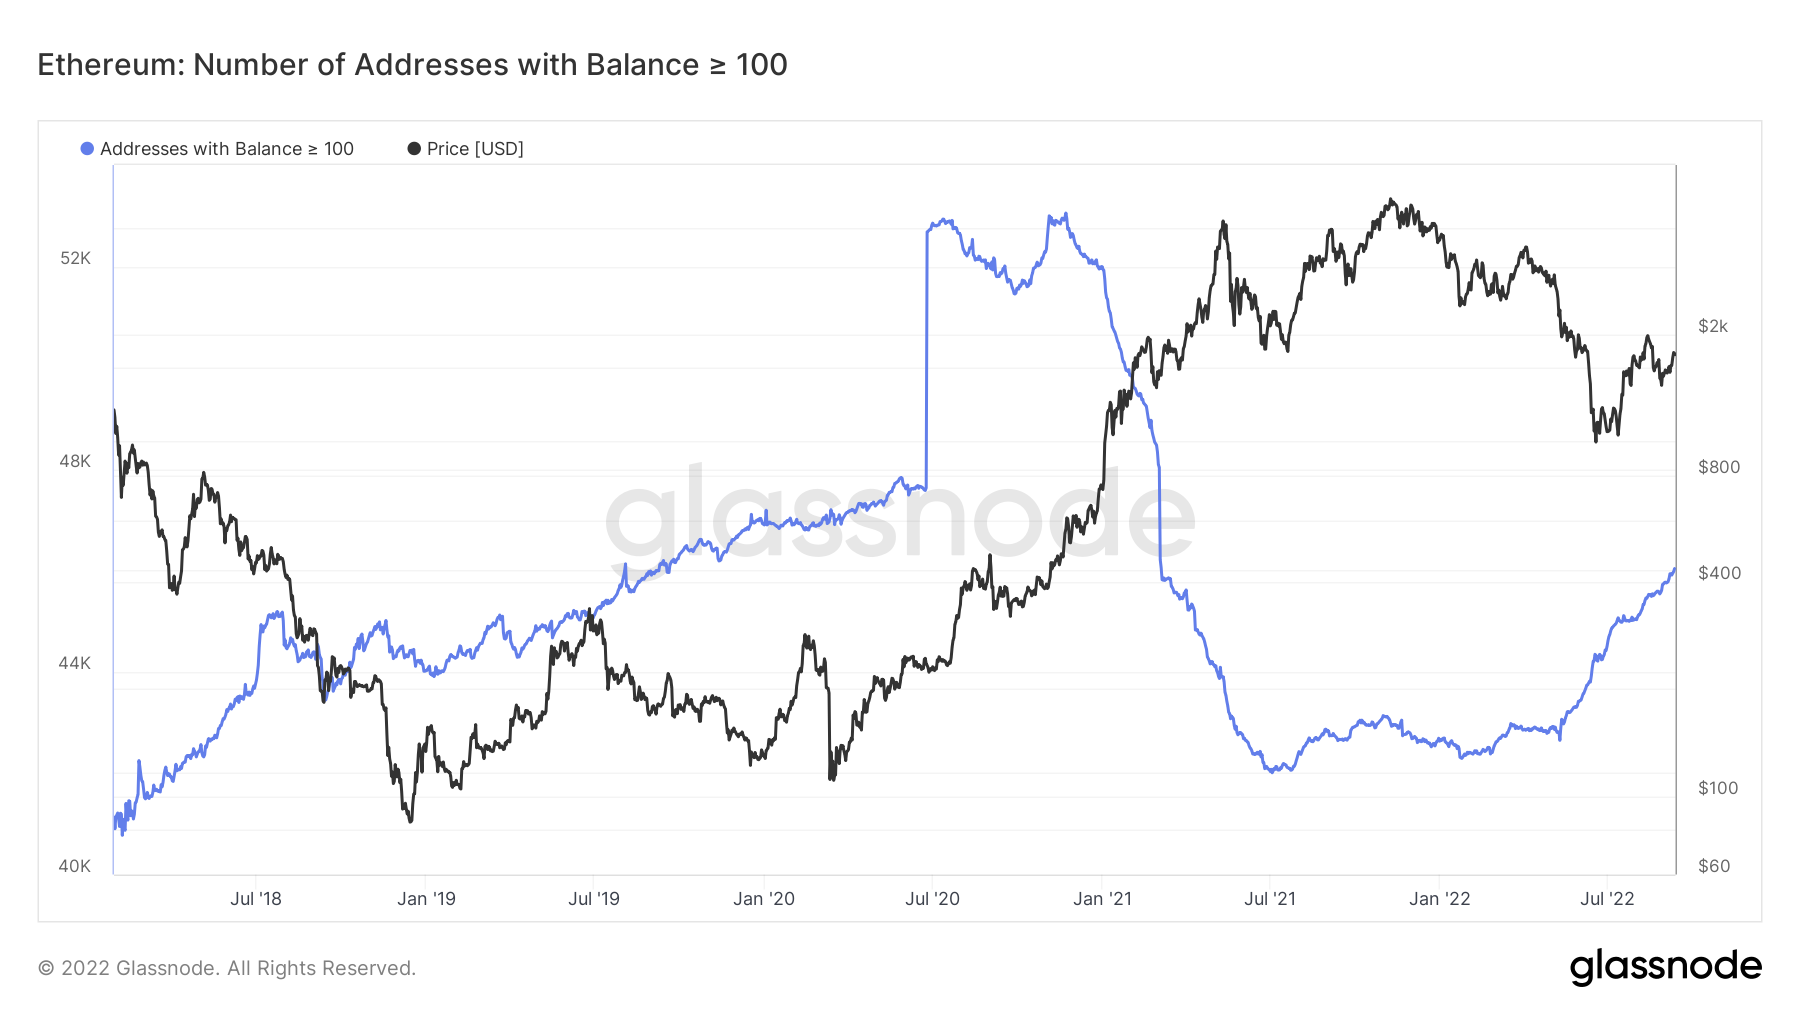
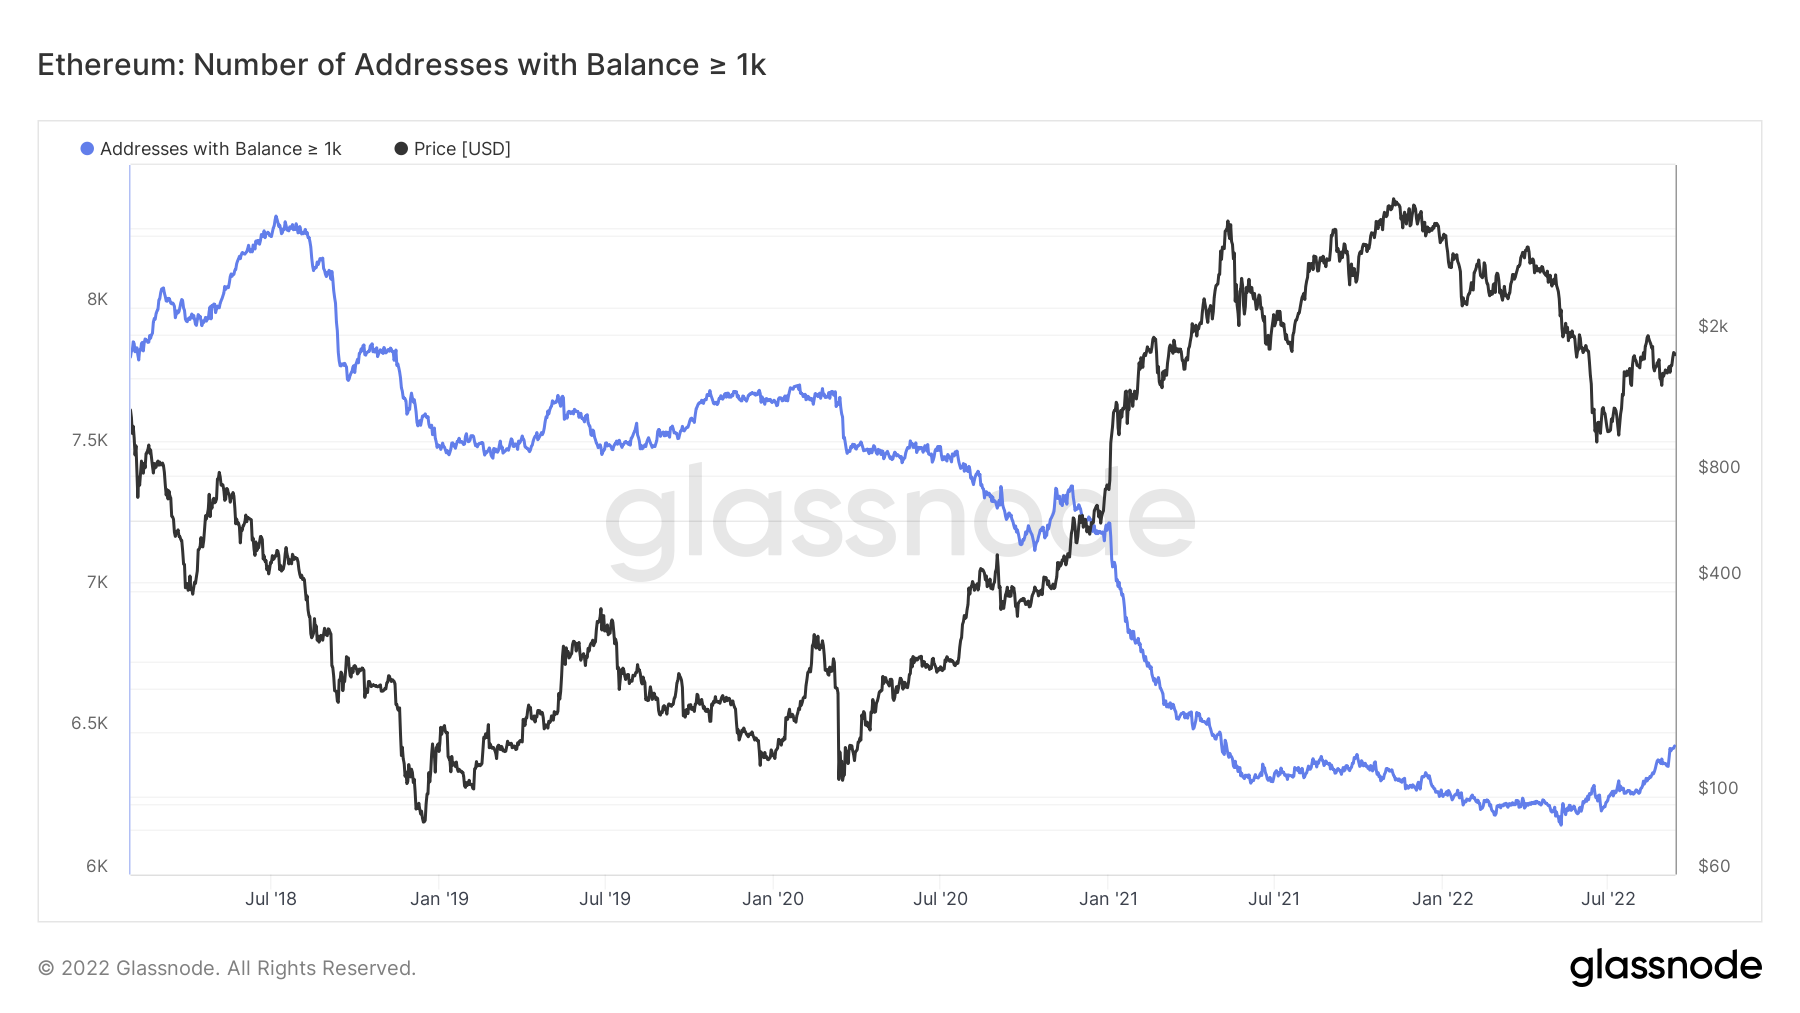
The wallets holding more Ether have behaved oppositely. They reduced their supply of coins (sold them to the market) when prices were increasing in 2021, however, they have begun increasing their supply again in recent months (accumulation at the lows).
Ether – Addresses with Balance > 100 Ether
Ether – Addresses with Balance > 1,000 Ether
Metric 3 – Realised Price
The third metric we will cover today is the Realised Price. The Realised Price is the Realised Cap divided by the current supply of coins. The Realised Price allows us to see what the average cost basis is for investors. We can see that in the past, when price has been below the Realised Price line, this has acted as a good opportunity to buy. This was correct for the June lows of 2022. However, we can see that the Realised Price can act as support and resistance areas for price. The Realised Price is currently in the low $1,600’s which may provide support for Ether, however, if price were to come below this level it may also prove to be a resistance.
Ether – Realised Price

Metric 4 – MVRV Z-Score
The last metric we will look at today is the MVRV Z-Score. This metric shows when Ether is overvalued or undervalued relative to it’s fair value. We can see in the below that historically the green zone has been the area that has been macro bottoms for price and therefore provided good opportunities to buy coins. If Ether can retest back into the green zone, it may be worth dollar cost averaging in.
Ether – MVRV Z-Score
DOT
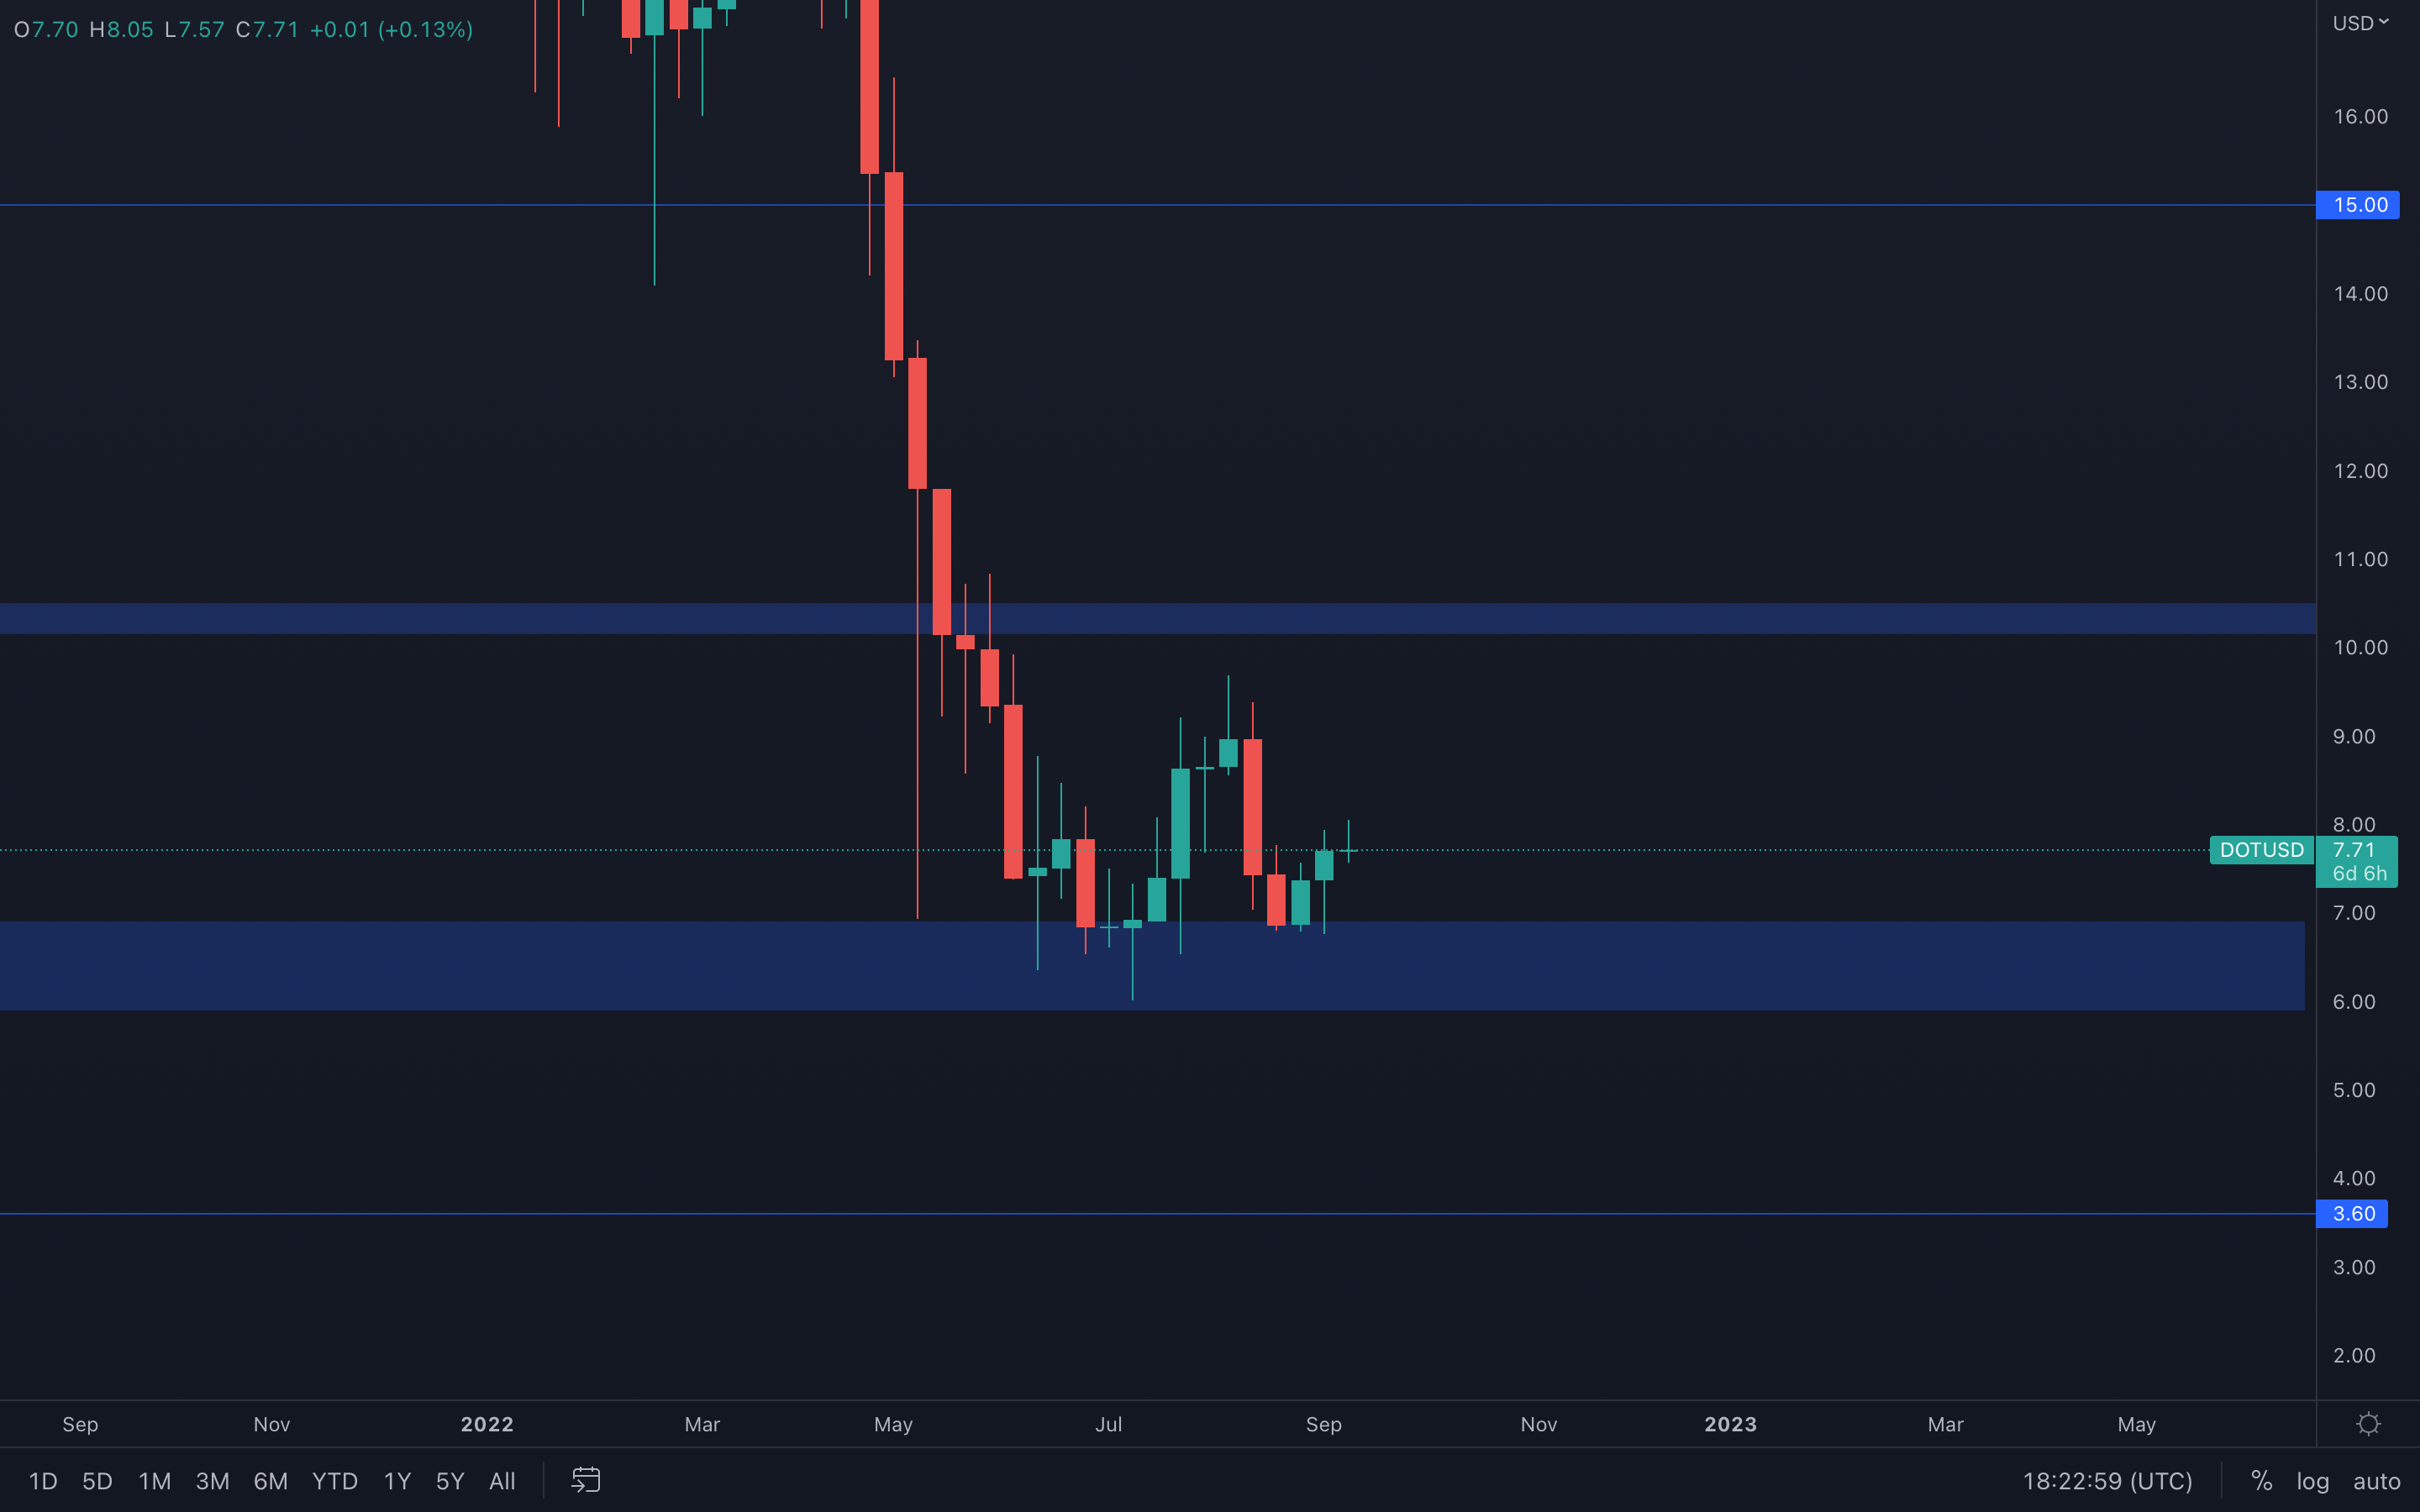 With no weekly closure under our $6.85 - $6 support area, we cannot assume the asset will be heading lower yet, but rather that upside can occur. All upside movements will be highly influenced by the majors, as DOT lacks the proper volume to outperform or at least perform well on its own. For now, the asset might be headed to $8.50 (daily resistance level).
SNX
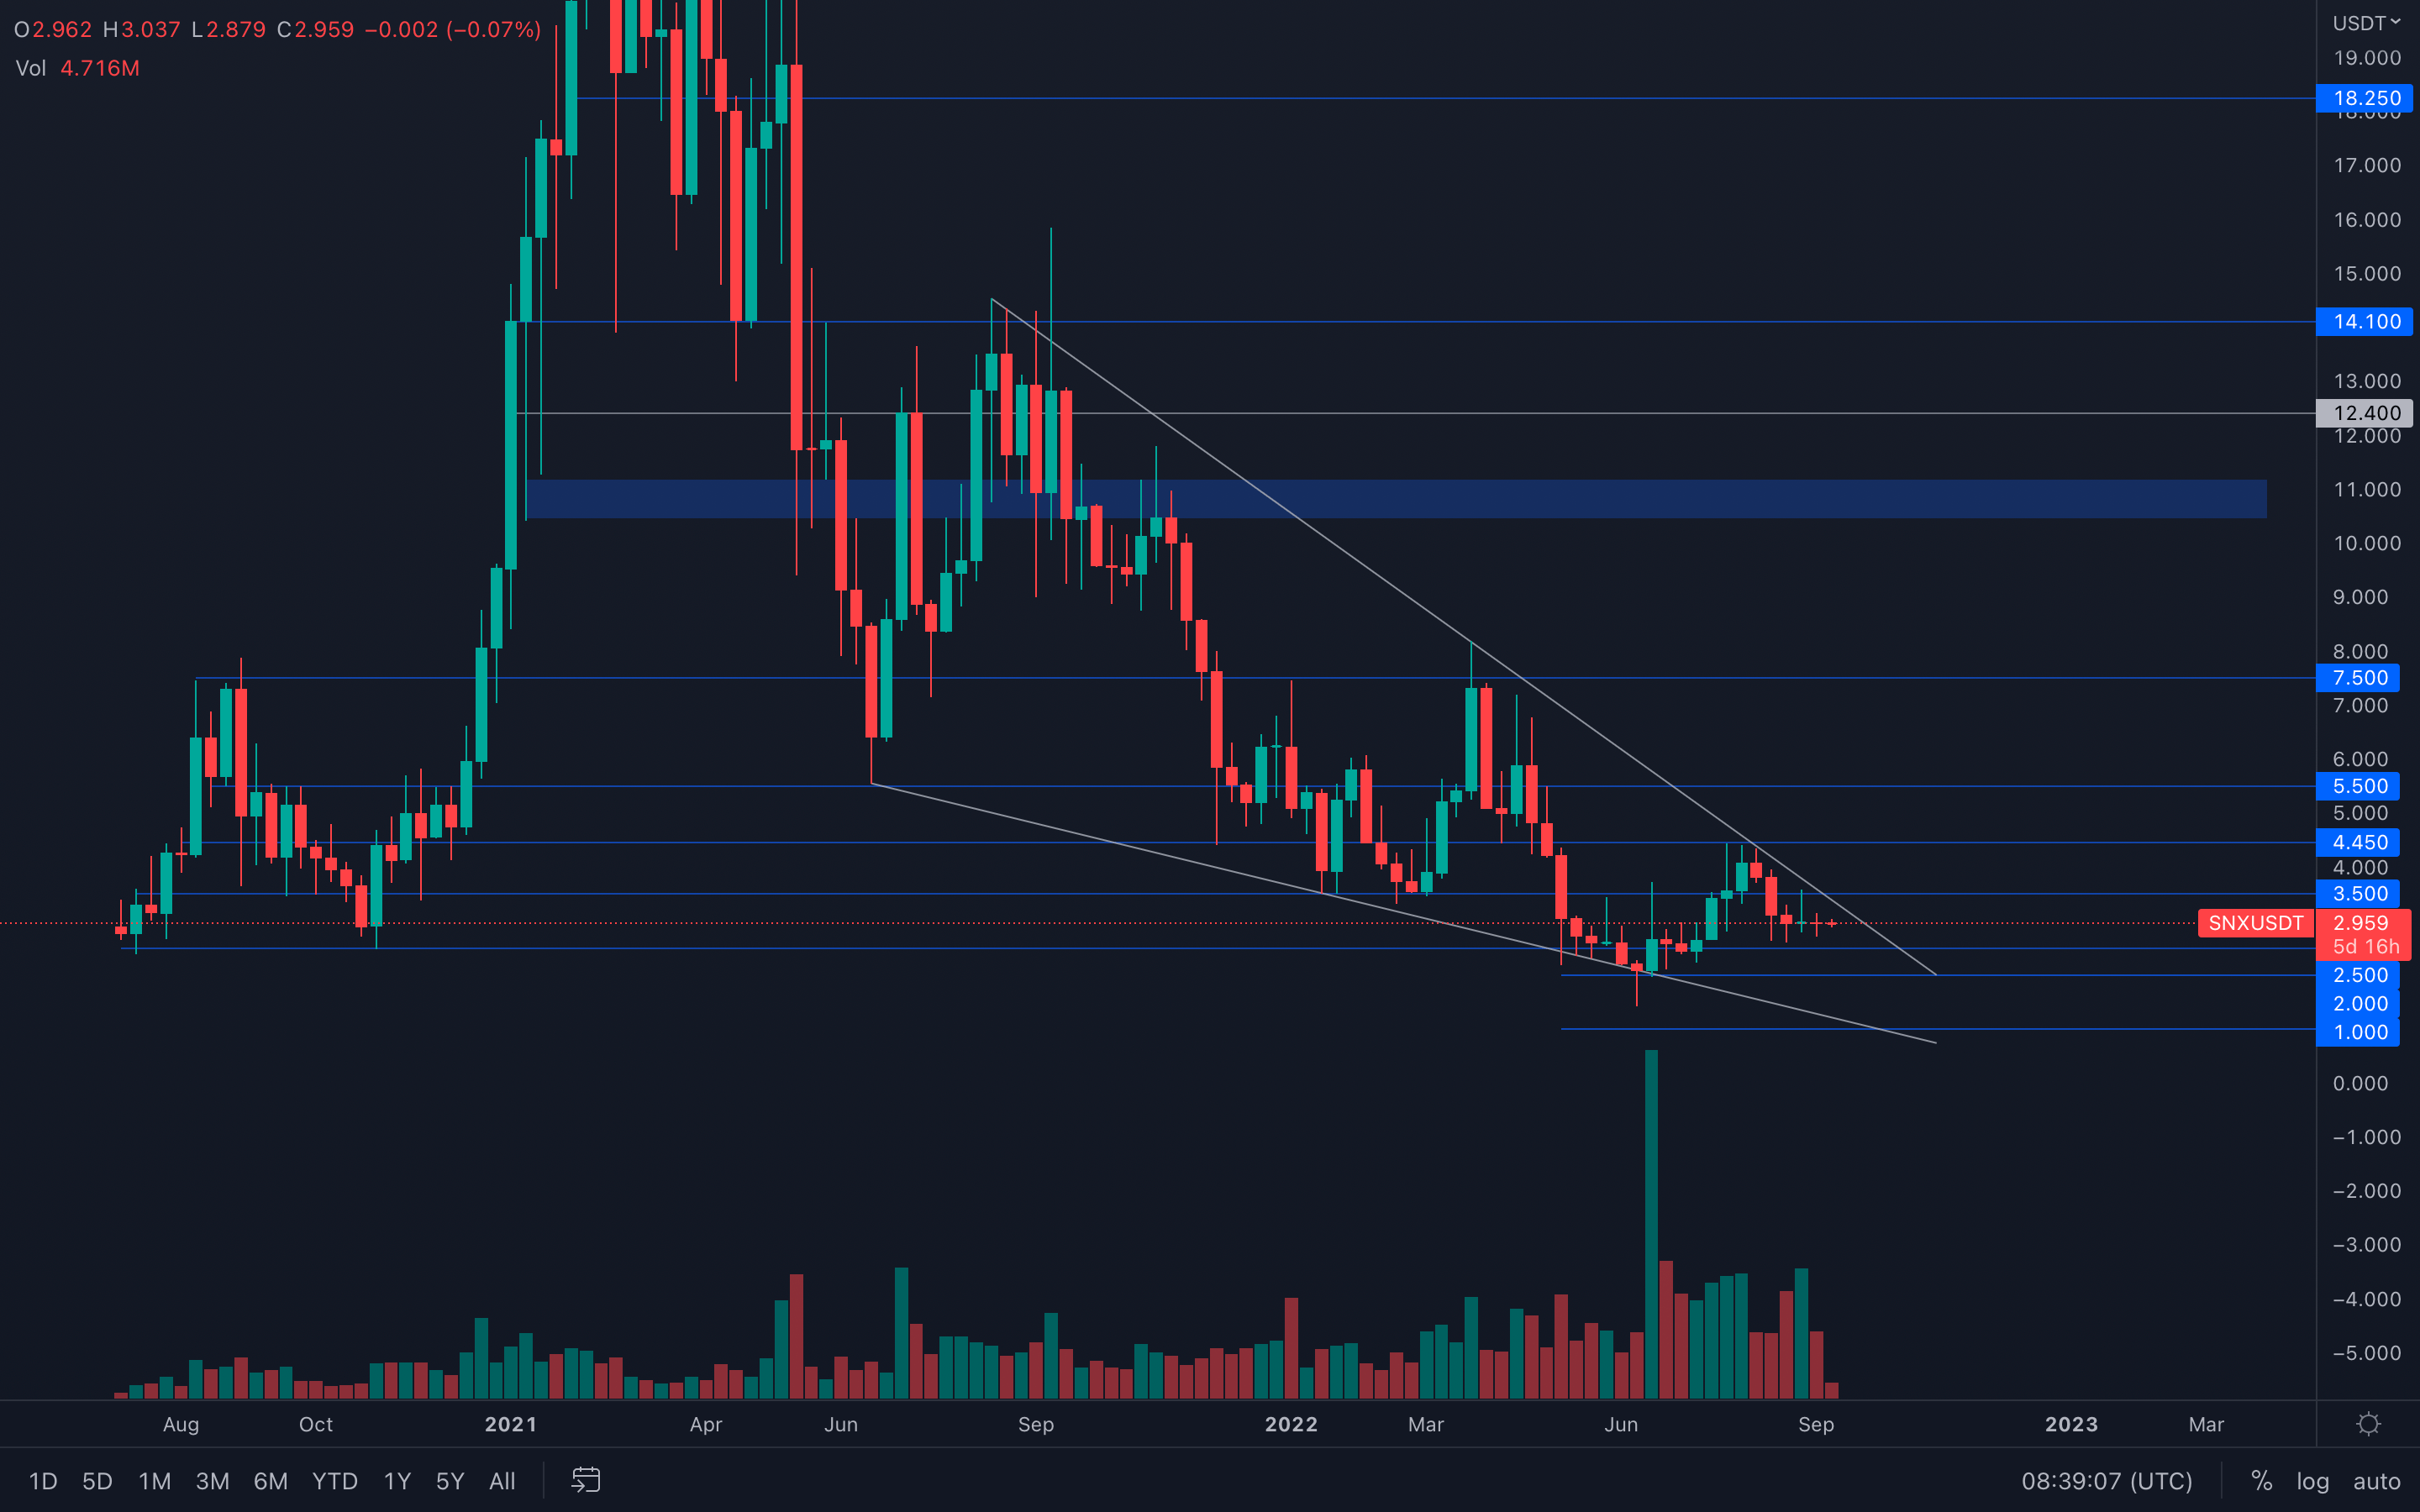 We've identified a new perspective for the SNX chart - a massive falling wedge has been formed, with multiple tests to confirm it as so. A breakout from this wedge will provide a solid investment opportunity, one we might also be interested in if all confluences are in flux.
For now, a solid confirmation of a breakout can occur after a $3.50 reclaim, which is what we will be waiting for. Surprisingly, SNX's volume has also experienced increased volume in the last weeks, which might indicate that a breakout from this wedge can perform better than expected, even with the current market conditions.
RUNE
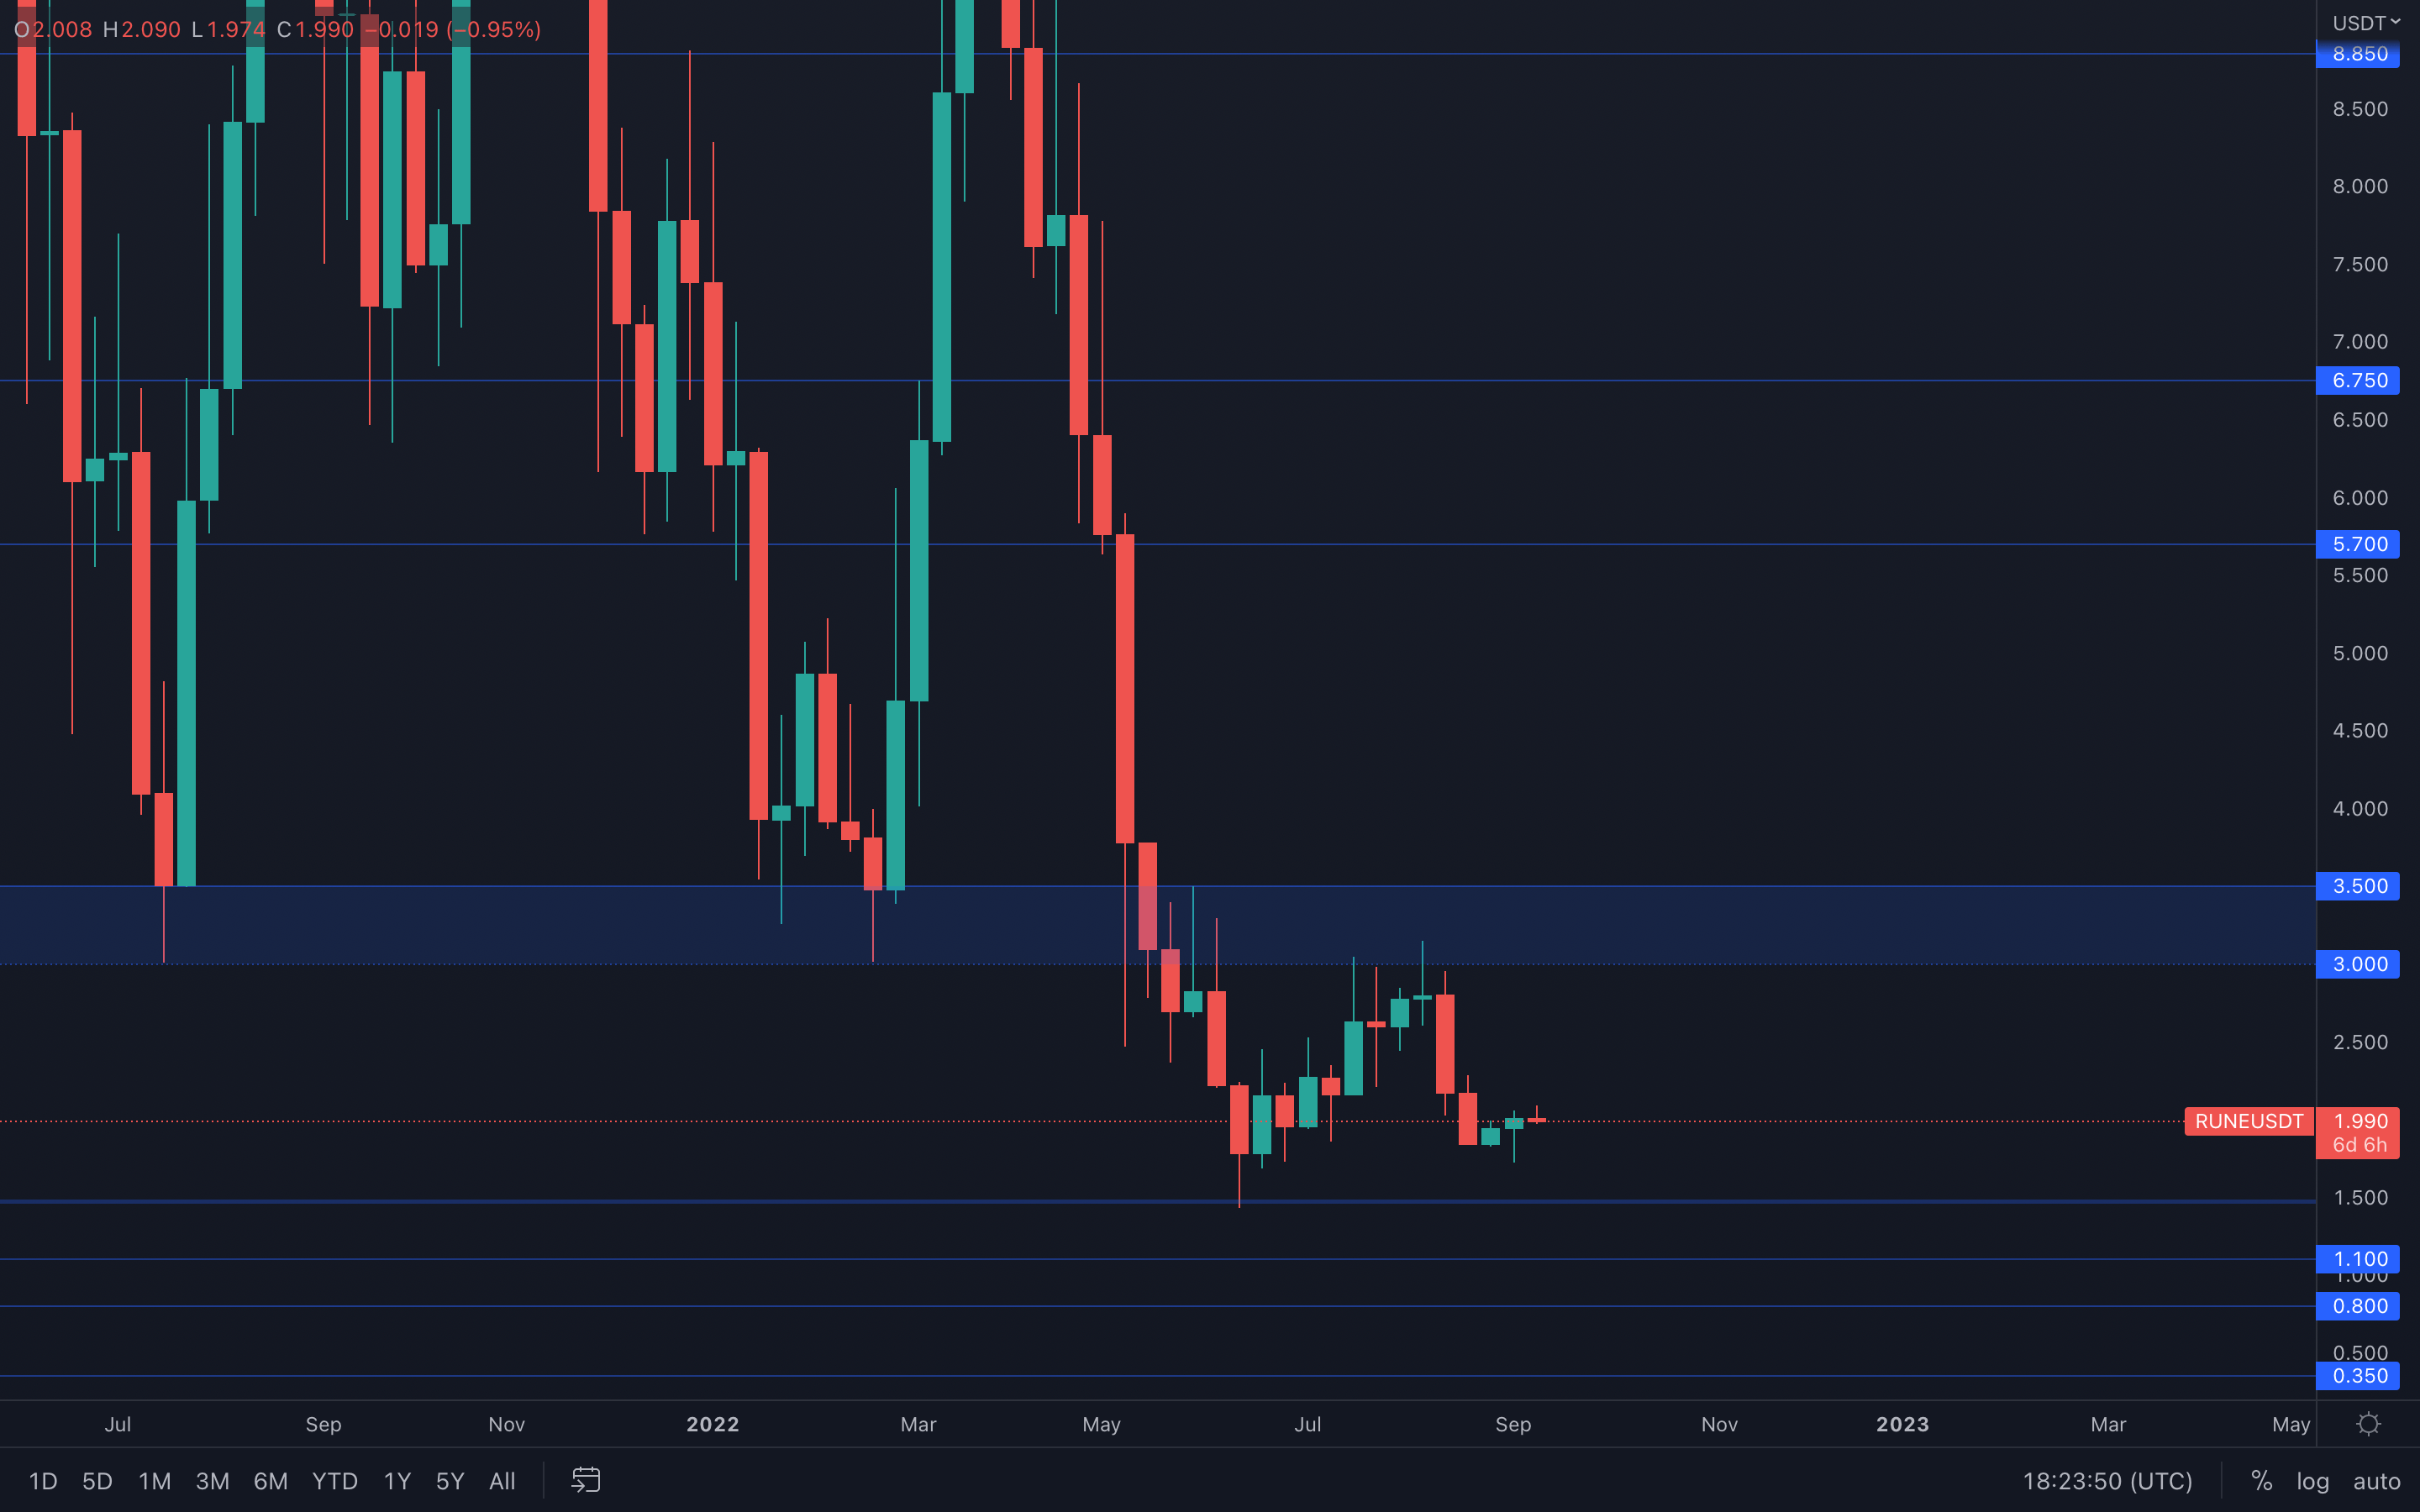 Little to no demand - RUNE is left in the hands of the hands of the majors which makes it likely to head a bit higher in the coming weeks.
SOL
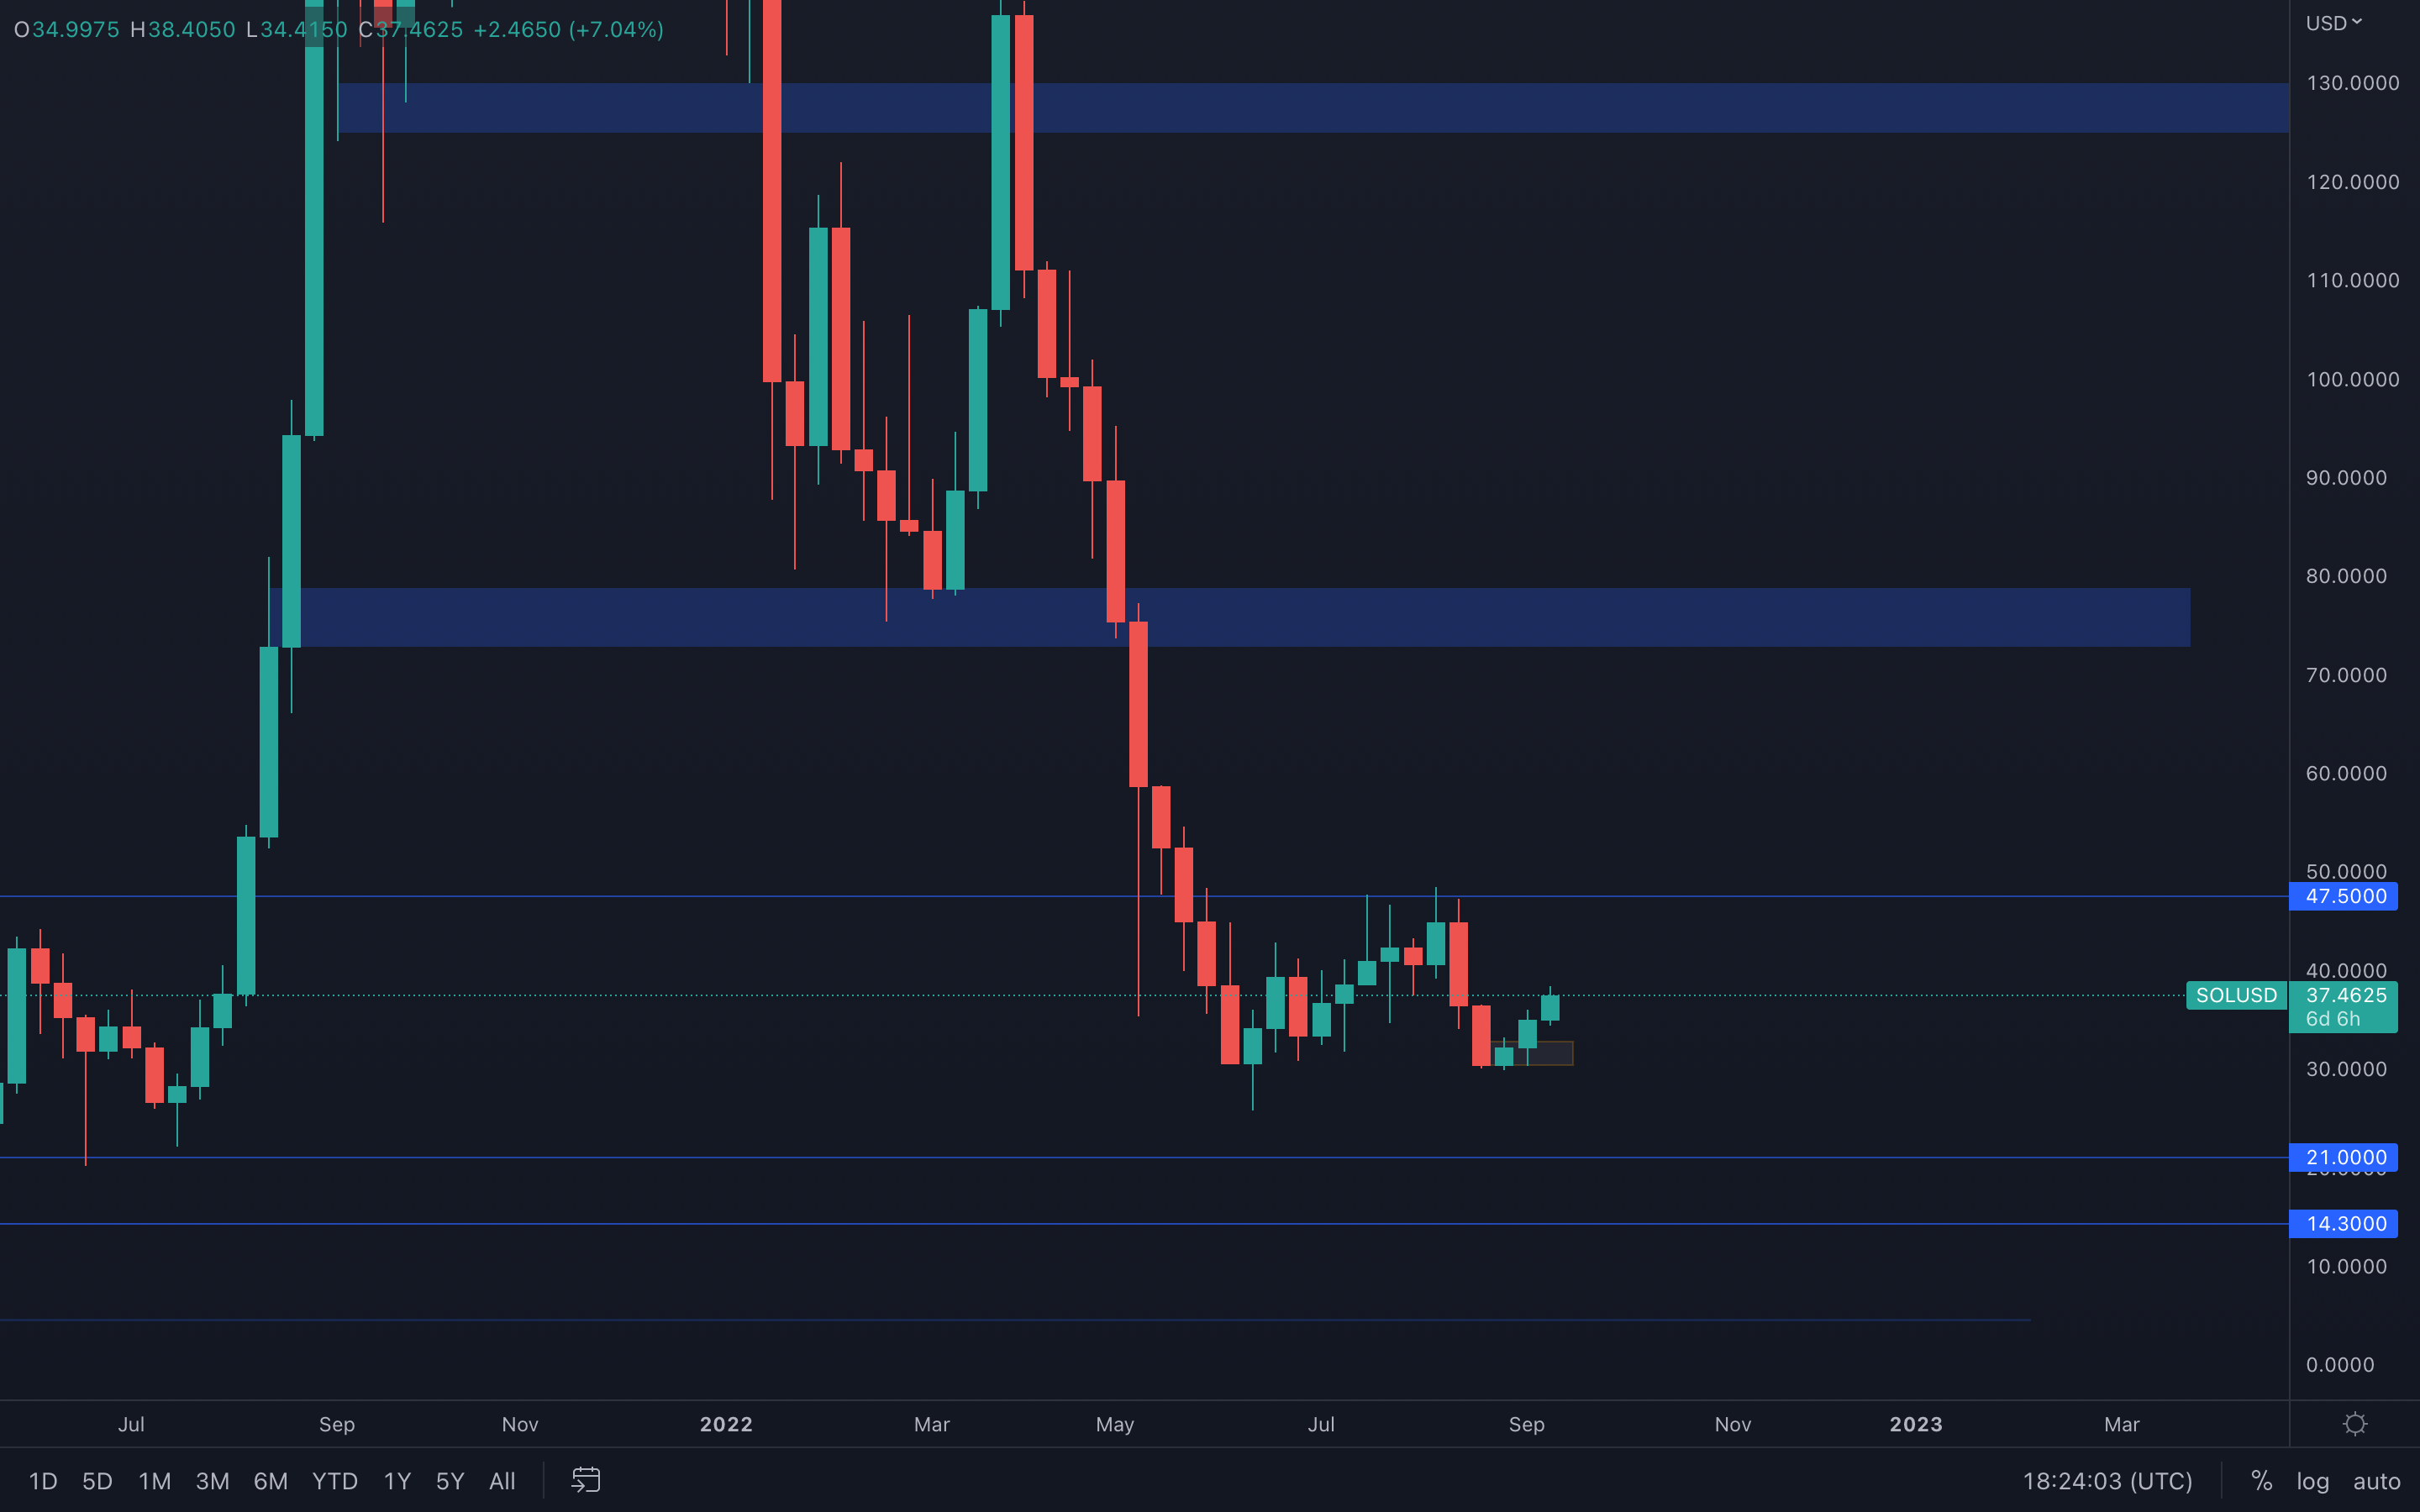 Compared to RUNE, SOL has seen a better performance, rising over 25% after perfectly bouncing from its June low. Since the $36 resistance level has been reclaimed and flipped into support (daily level), we can expect SOL to test its next local resistance level sitting at $42.50 in the coming weeks.
SRM
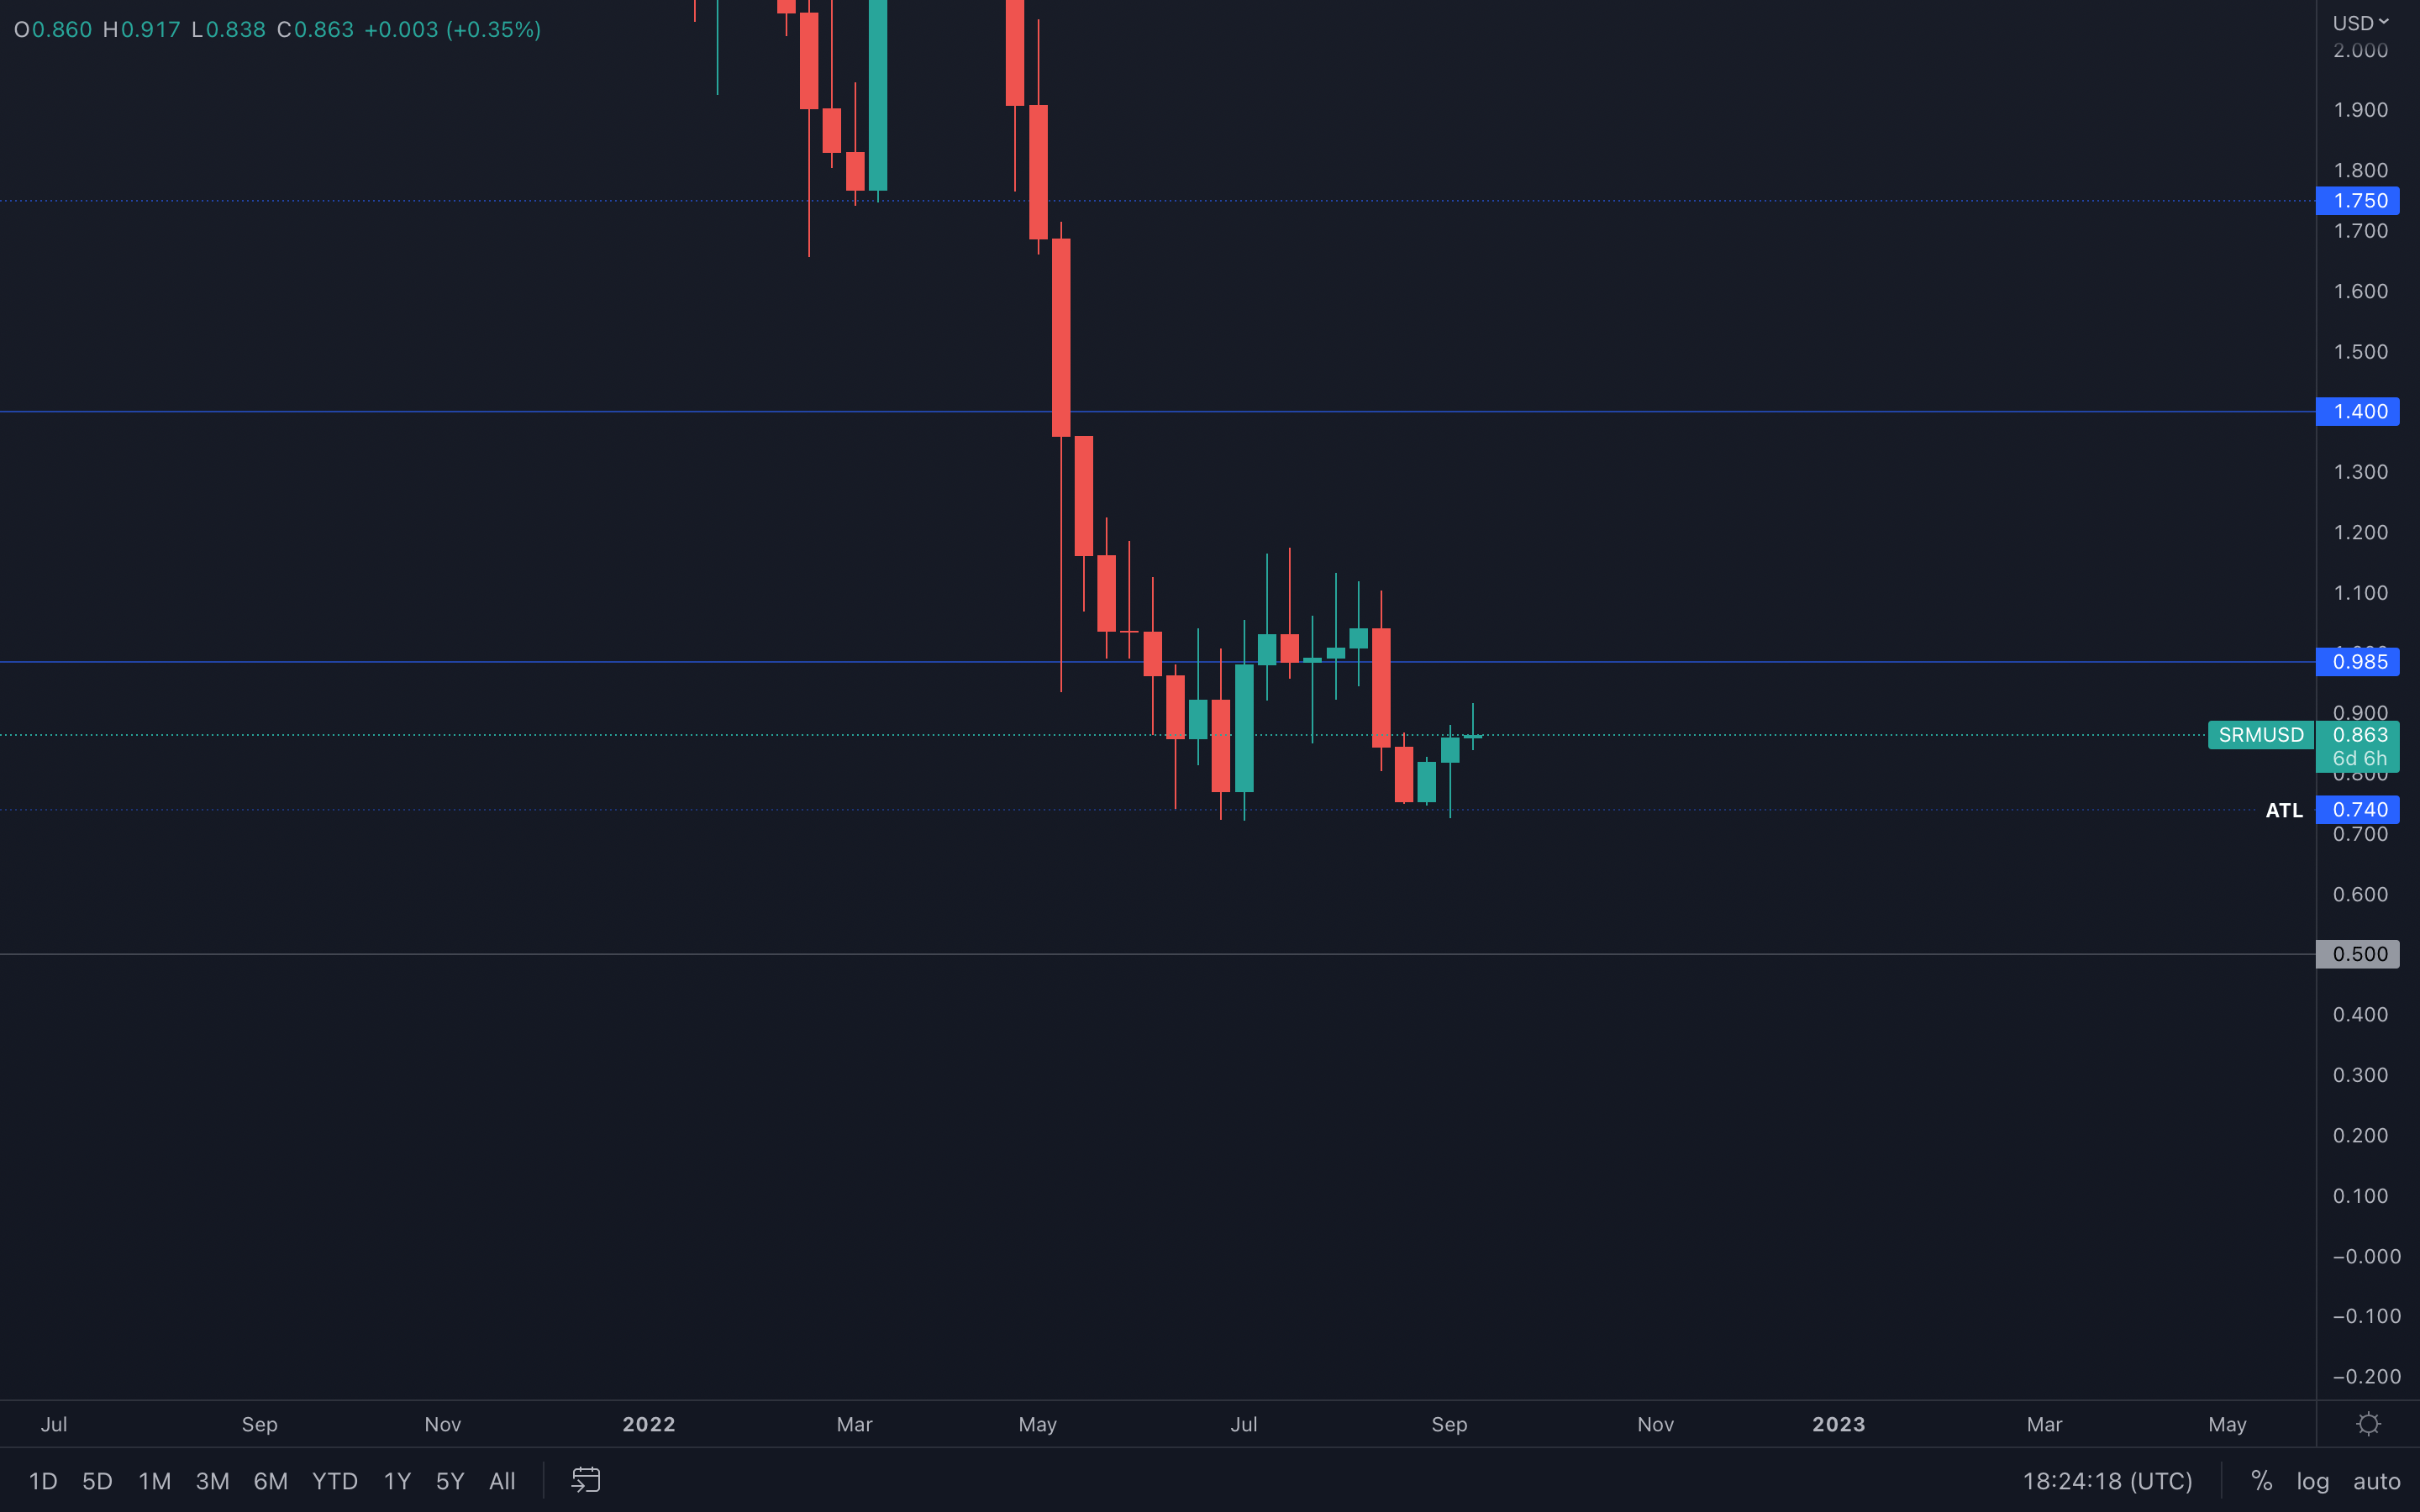 It seems there's a bit of a struggle at SRM's current level on lower timeframes, but from a weekly standpoint, SRM should have no issues in testing its psychological and technical level of $1 next, especially with the majors indicating upside potential.
For short, $1 is now on the cards.
FTT
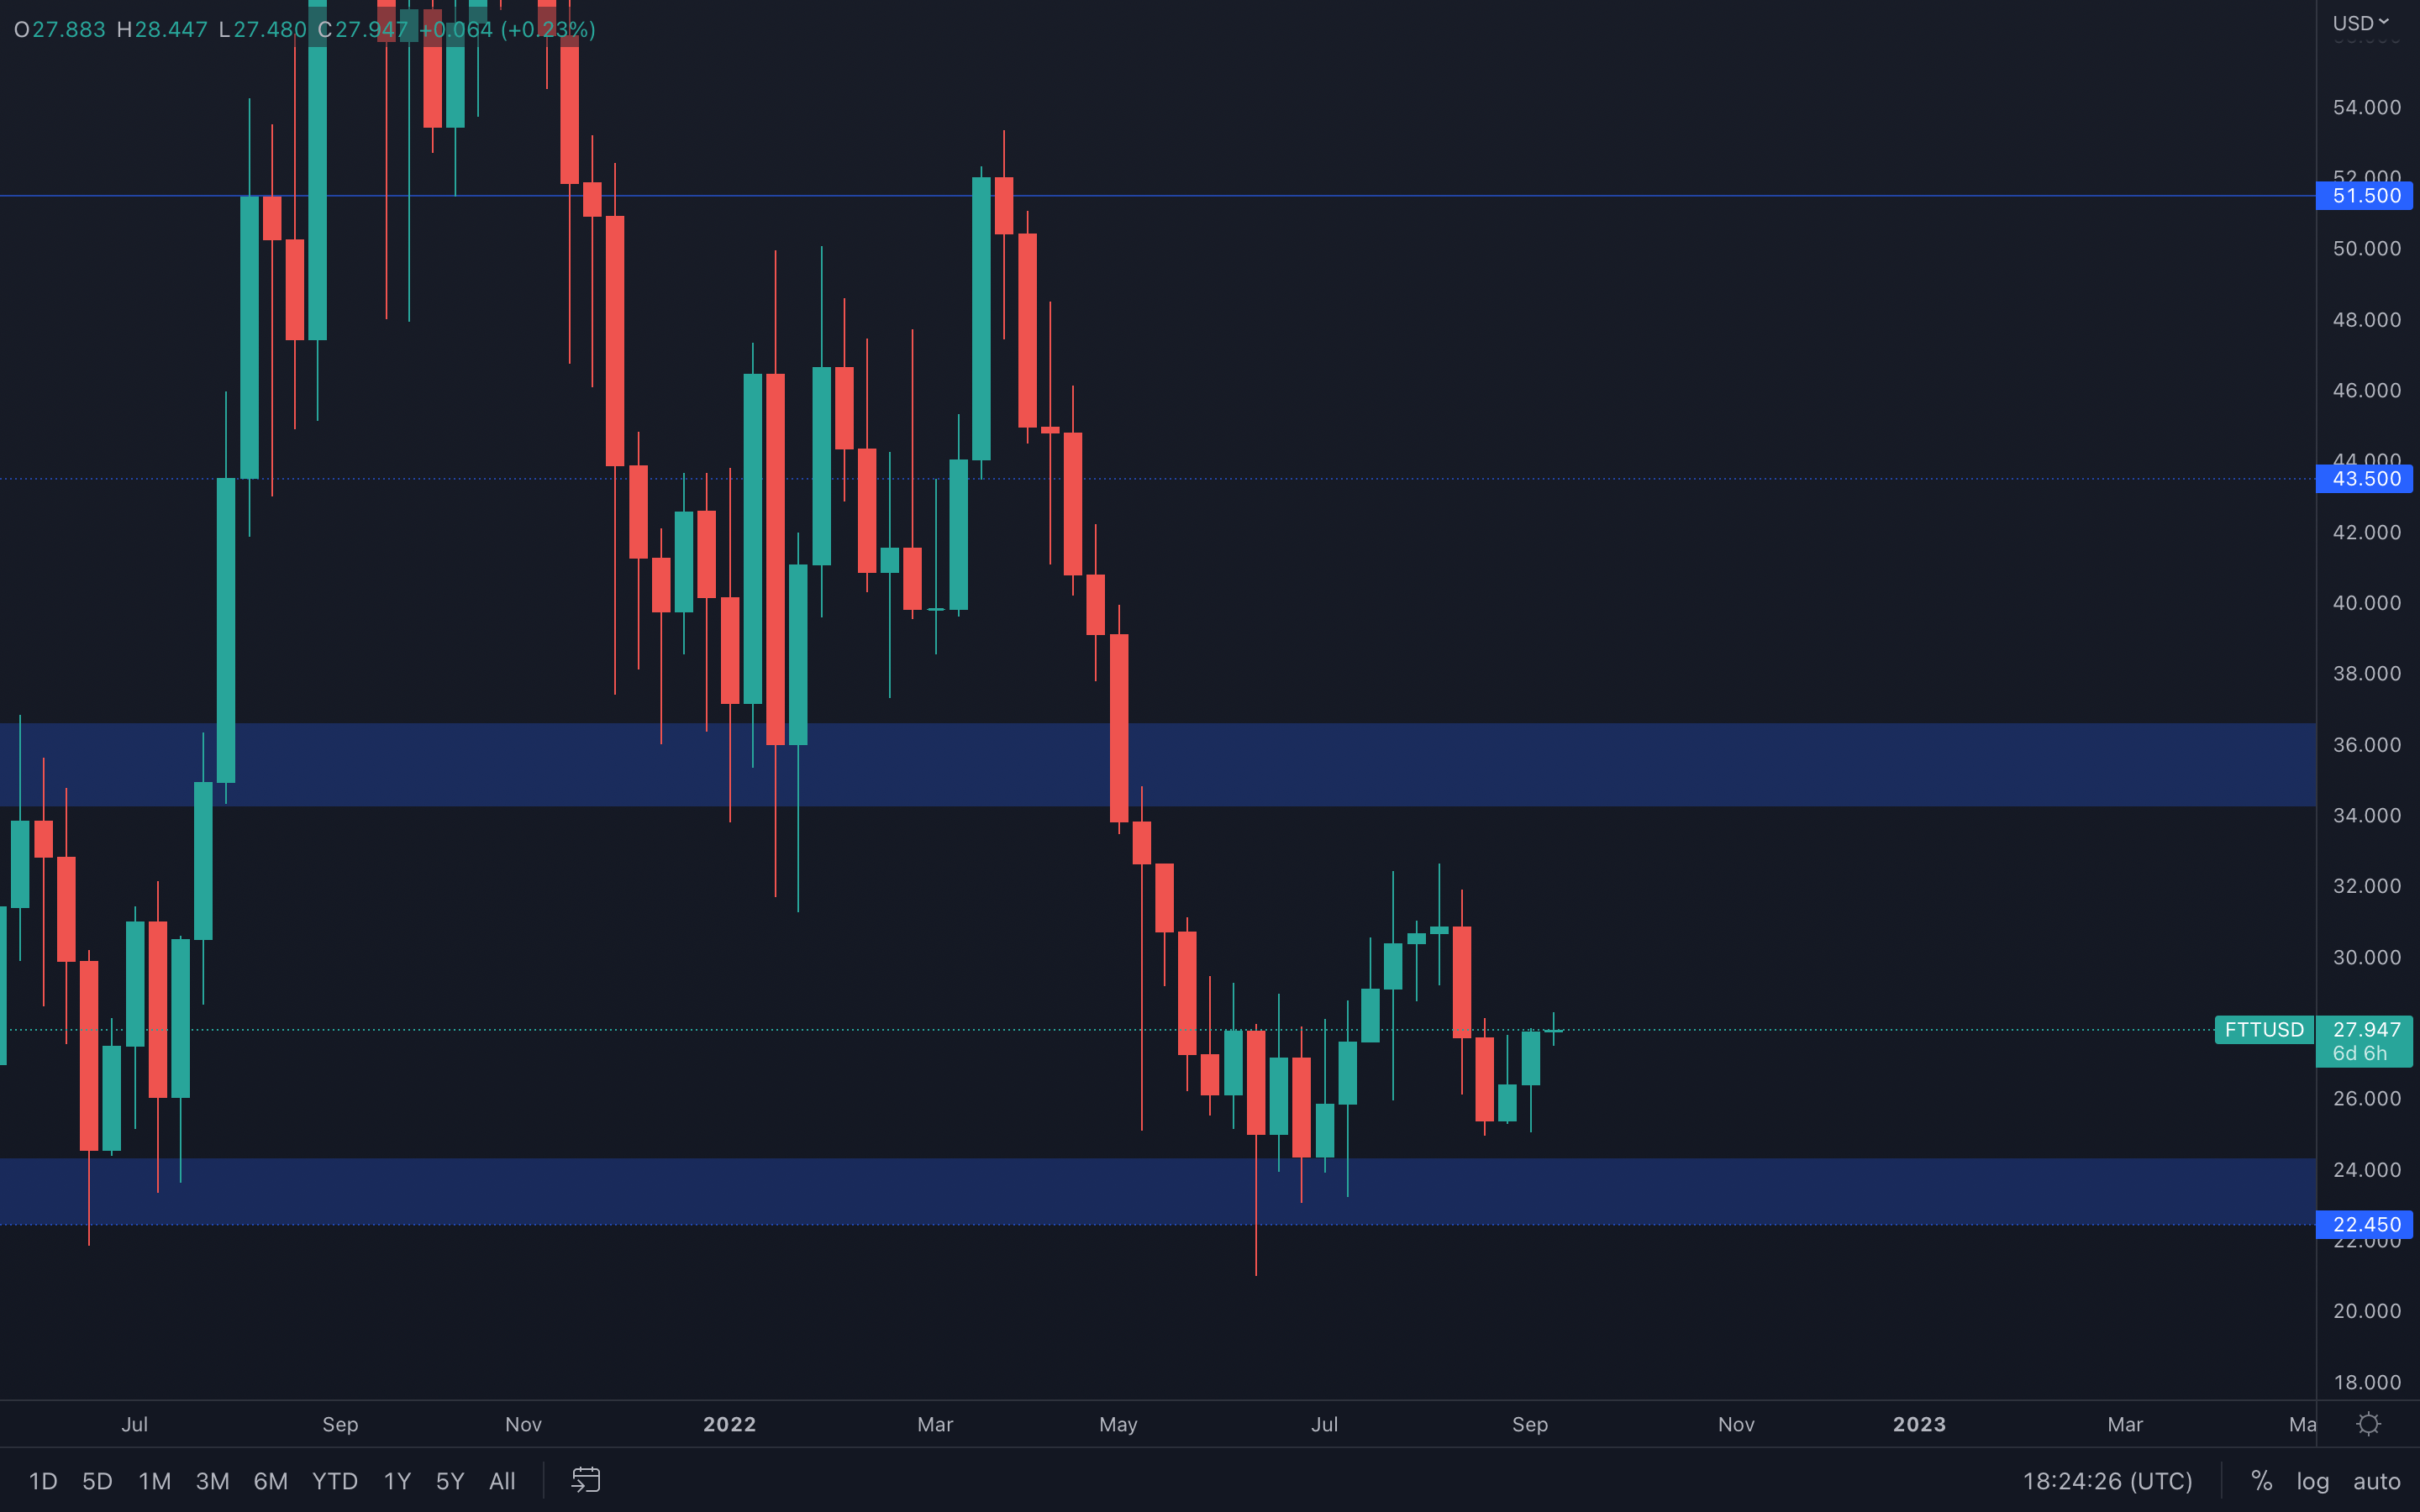 We're witnessing yet another full-bodied weekly candle closure, which suggests FTT will most likely head higher. A highly tested resistance level sits at $30, which is also the middle of the famous $36 - $22.45 range. Because $30 is not really that far from here, it's safe to assume the level will be tested in the coming days.
MINA
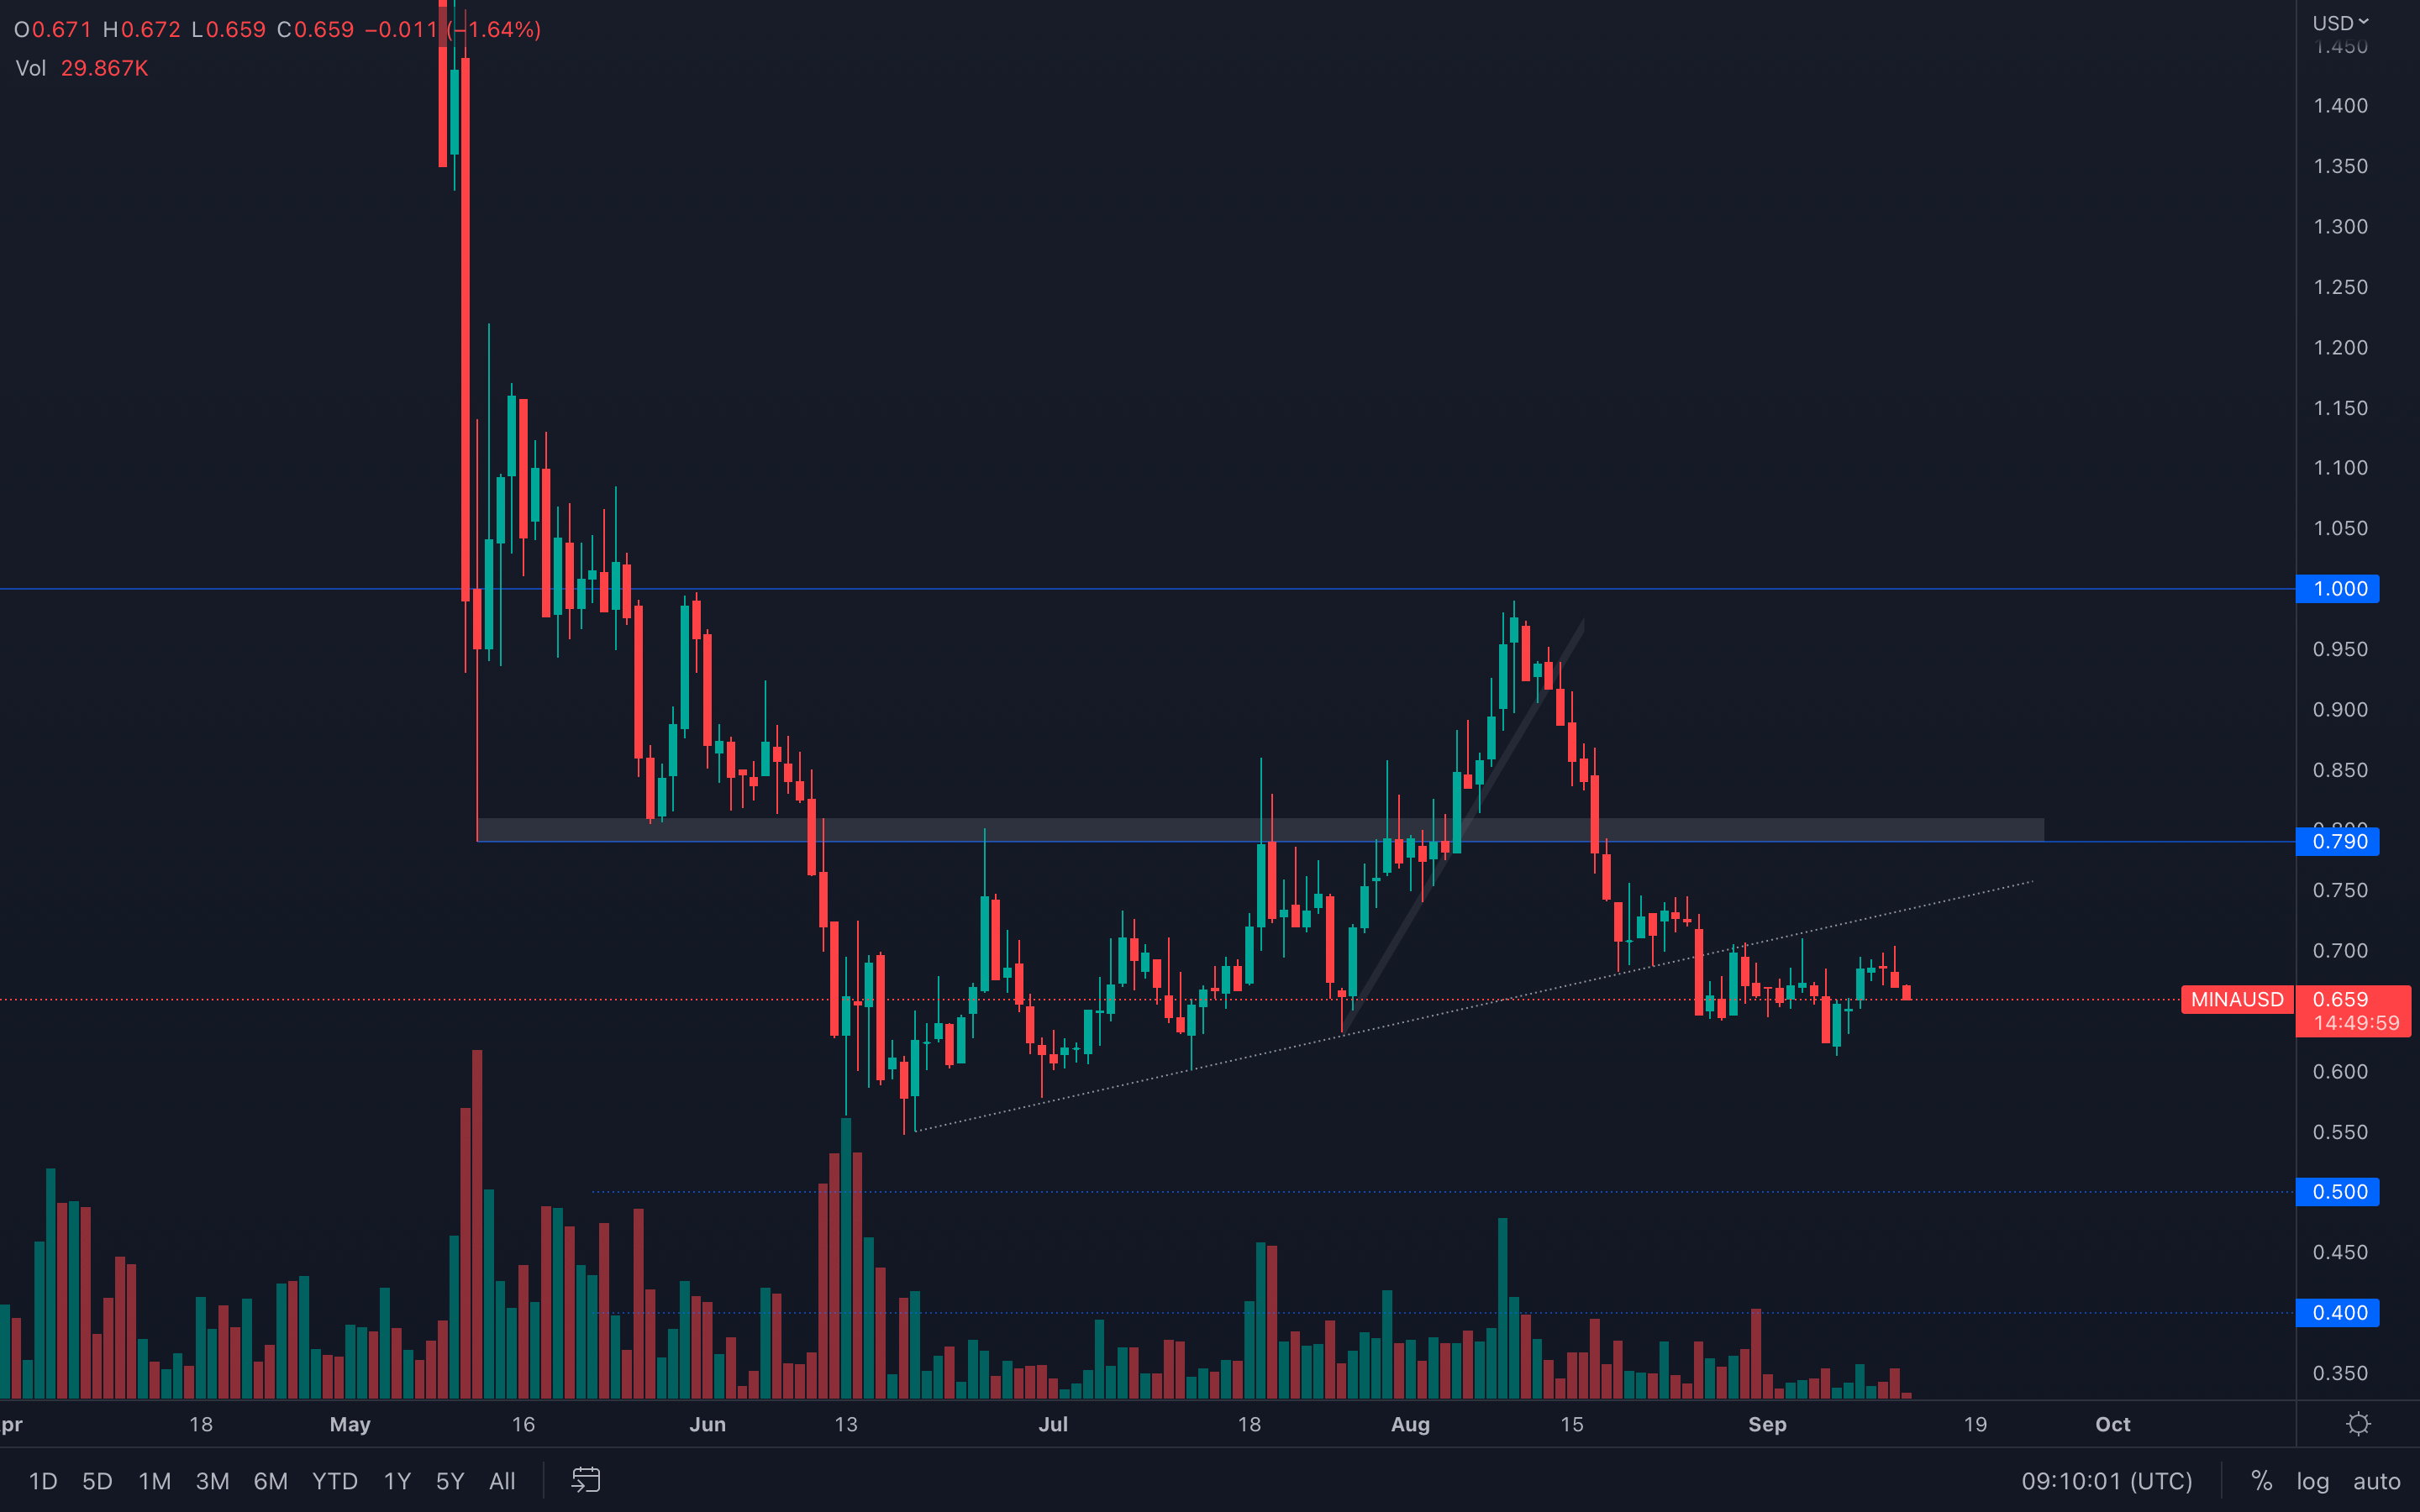 (Daily chart was used)
No retest or reclaim of the trend line has occurred, which implies MINA will indeed head lower. Its volume has been decreasing for weeks and can now be seen at minuscule levels, which also suggests a bad performance in the coming weeks.
(Daily chart was used)
No retest or reclaim of the trend line has occurred, which implies MINA will indeed head lower. Its volume has been decreasing for weeks and can now be seen at minuscule levels, which also suggests a bad performance in the coming weeks.
dYdX
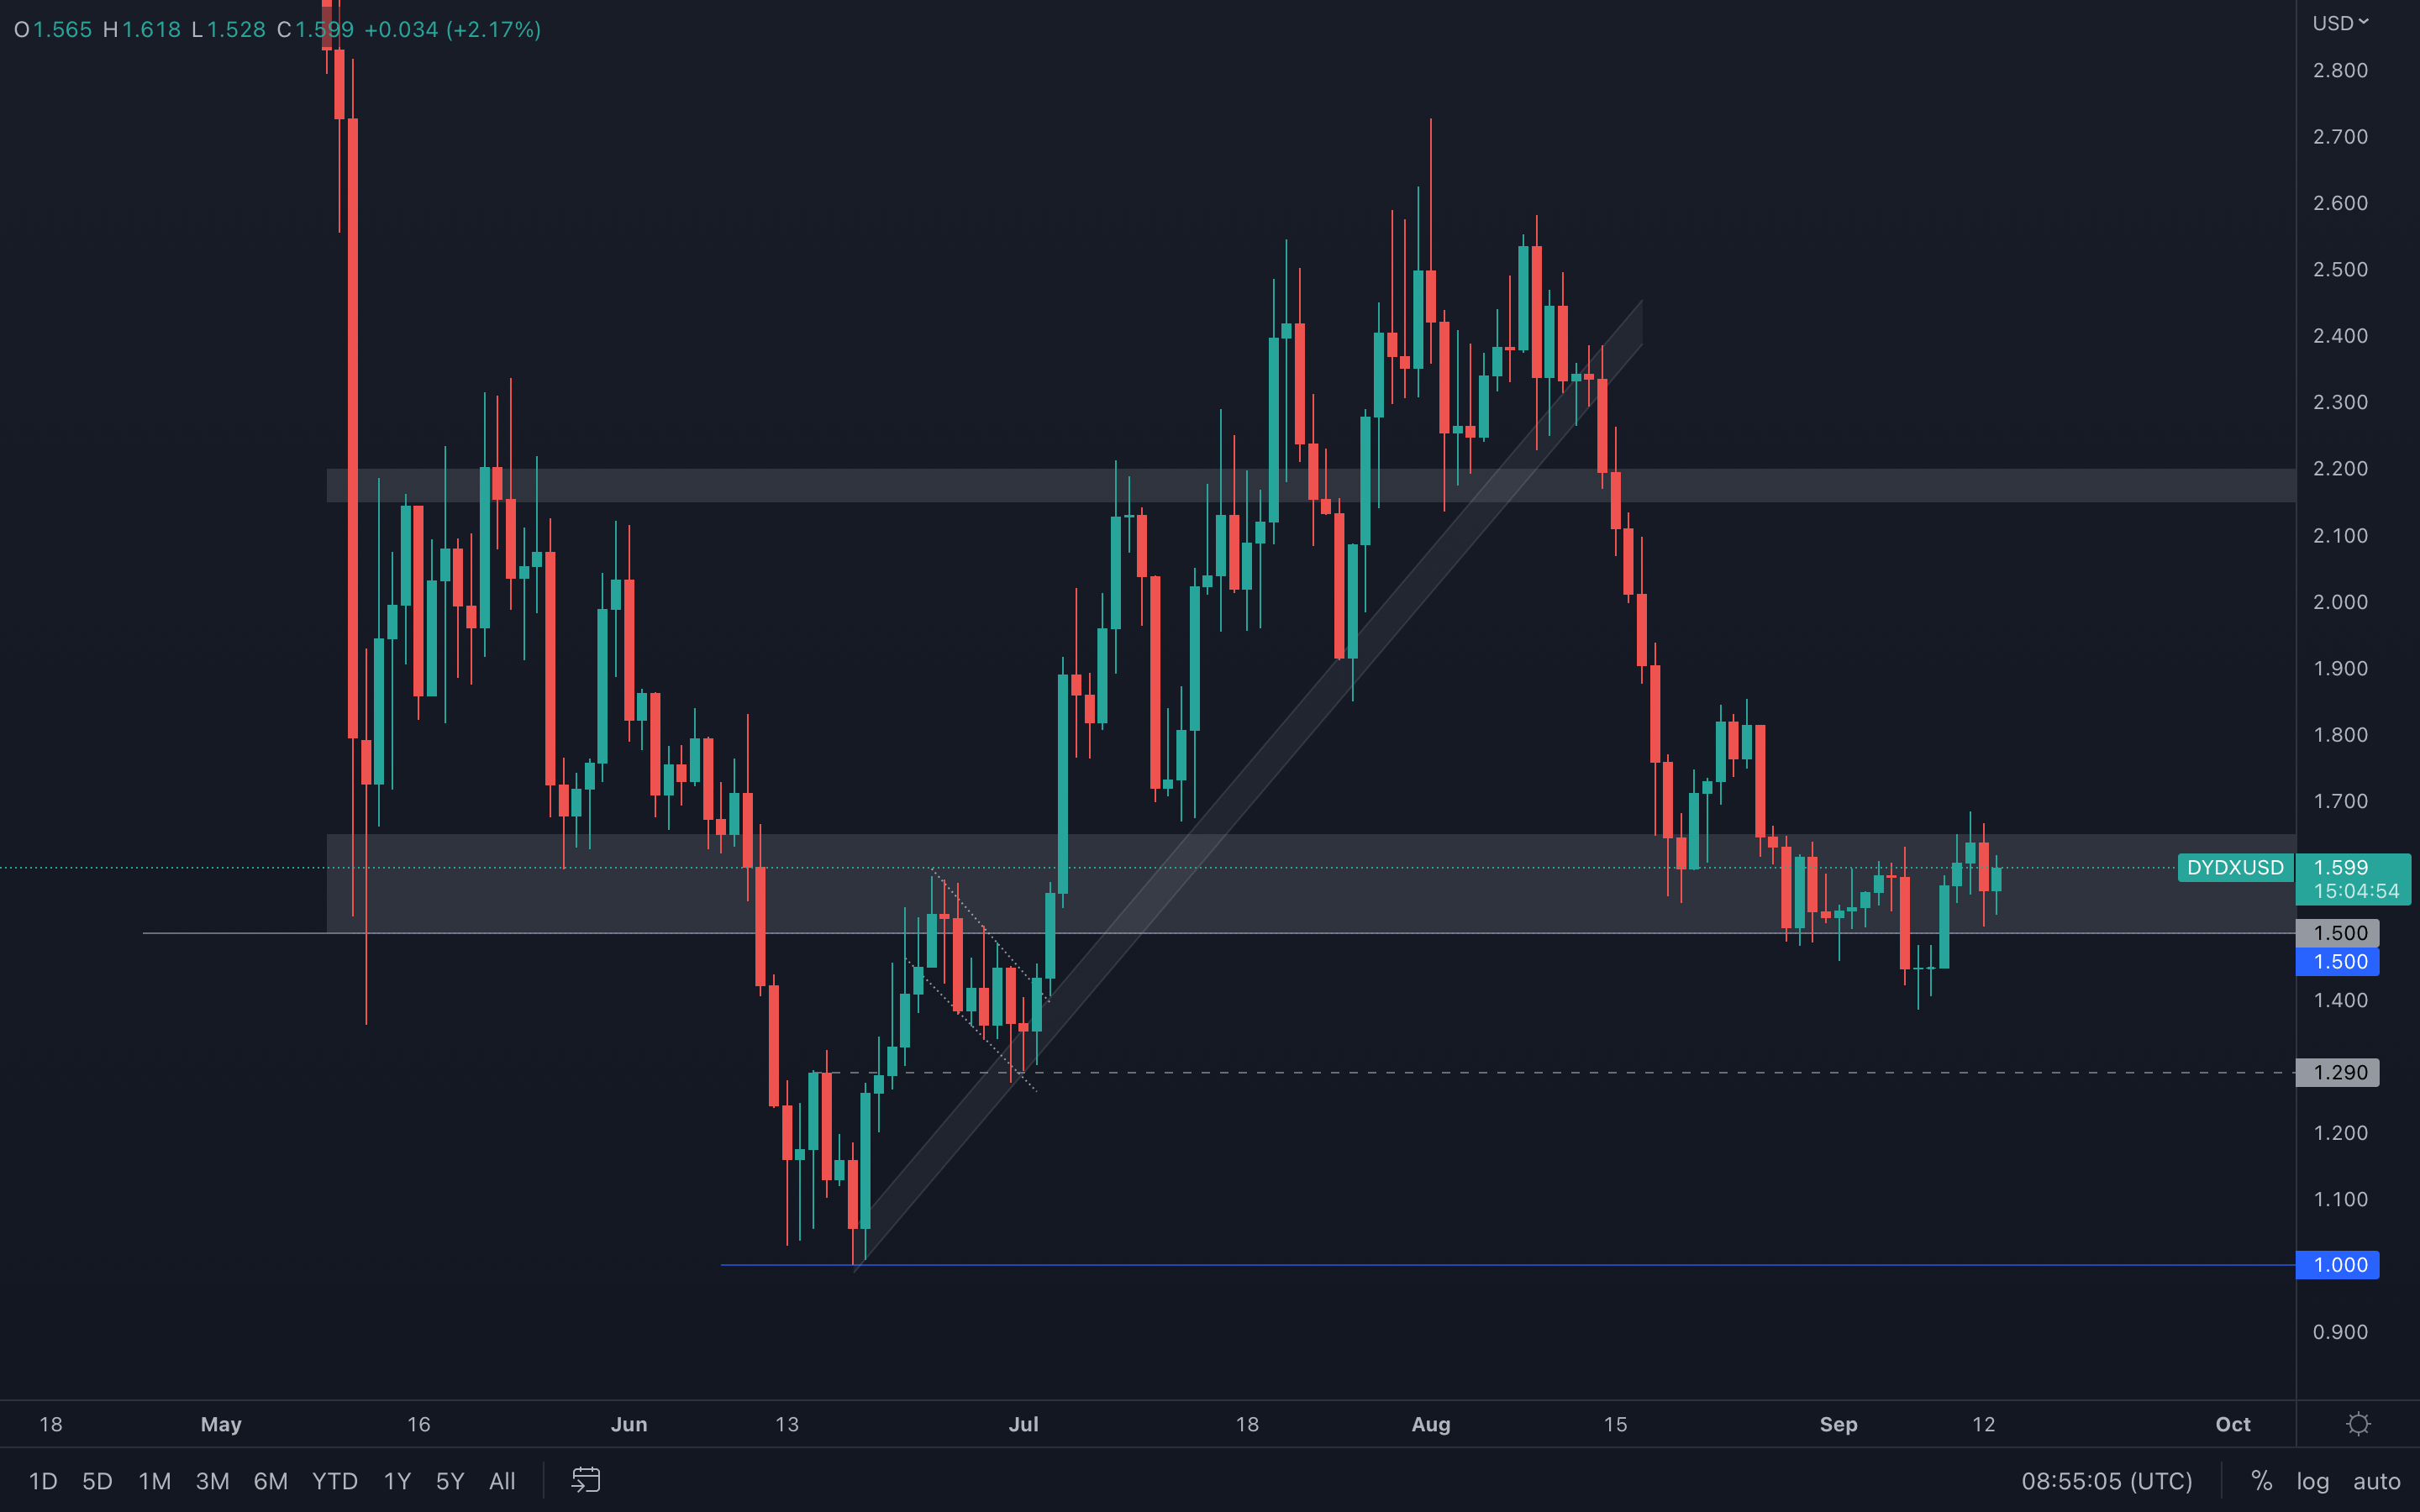 (Daily chart was used)
Things are looking quite simple for dYdX - as long as $1.50 isn't lost via a daily candle closure under (weekly closure will provide an even stronger confirmation), then no further downside can occur and we should be expecting higher prices in the coming weeks, since the majors are showing signs of upside potential.
(Daily chart was used)
Things are looking quite simple for dYdX - as long as $1.50 isn't lost via a daily candle closure under (weekly closure will provide an even stronger confirmation), then no further downside can occur and we should be expecting higher prices in the coming weeks, since the majors are showing signs of upside potential.
Summary
Over the past few weeks, the largest wallet holders of Ether have begun to add more Ether to their wallets as the price has been low enough that dollar cost averaging has been more acceptable. This is despite the fact that there continue to be a number of macro risks on the horizon.
Recommended from Cryptonary


