
Disclaimer: Not financial nor investment advice. You are responsible for any capital-related decisions you make, and only you are accountable for the results.
Macro
In this past week, the market has re-assessed where it believes interest rates will end up. This is due to the FED increasing their interest rate projection to 4.6%, with the markets now pricing in a FED Funds Rate of somewhere between 4.5% - 5.0% by Q1 2023.With it now looking likely that another 150 basis points in rate hikes are still to come, the markets have sold off following this news from the FED last Wednesday (21/09/2022). Whilst the FED and Chair Powell remain hawkish and are likely to whilst they carry out these further rate hikes, the market will also likely continue to suffer in the coming months. However, there are now some concerns that the FED is raising rates too aggressively here and the odds of them ‘over-shooting’ (raising rates too high – in order to destroy demand and bring down inflation – but to the point that something in the economy breaks) have increased.
The Equity market has never bottomed whilst the FED has been raising rates, so if we know that rates may continue to be raised into year-end, possibly into Q1 2023, then it is possible we could expect a market bottom in the coming couple of months – particularly with Crypto, which is known to the bottom first as it is one of the assets furthest along the risk curve.
TLDR
- The FED’s rate hike cycle will likely continue to provide headwinds for risk assets in the coming month or two.
- The Exchange Net Position Change shows a large inflow of coins to Exchange wallets. The two previous times this has happened, there was a large drawdown in Bitcoin’s price.
- Some of the eldest Bitcoins were once again spent this week, showing a continued risking-off from this cohort.
- The 1K Bitcoin wallets continue to also risk-off. This is the cohort we try to emulate, and they are yet to aggressively add to their wallets.
- The Hash Ribbon looks to be turning lower once again as Bitcoin’s price comes under pressure from the macro conditions.
Total Market Cap
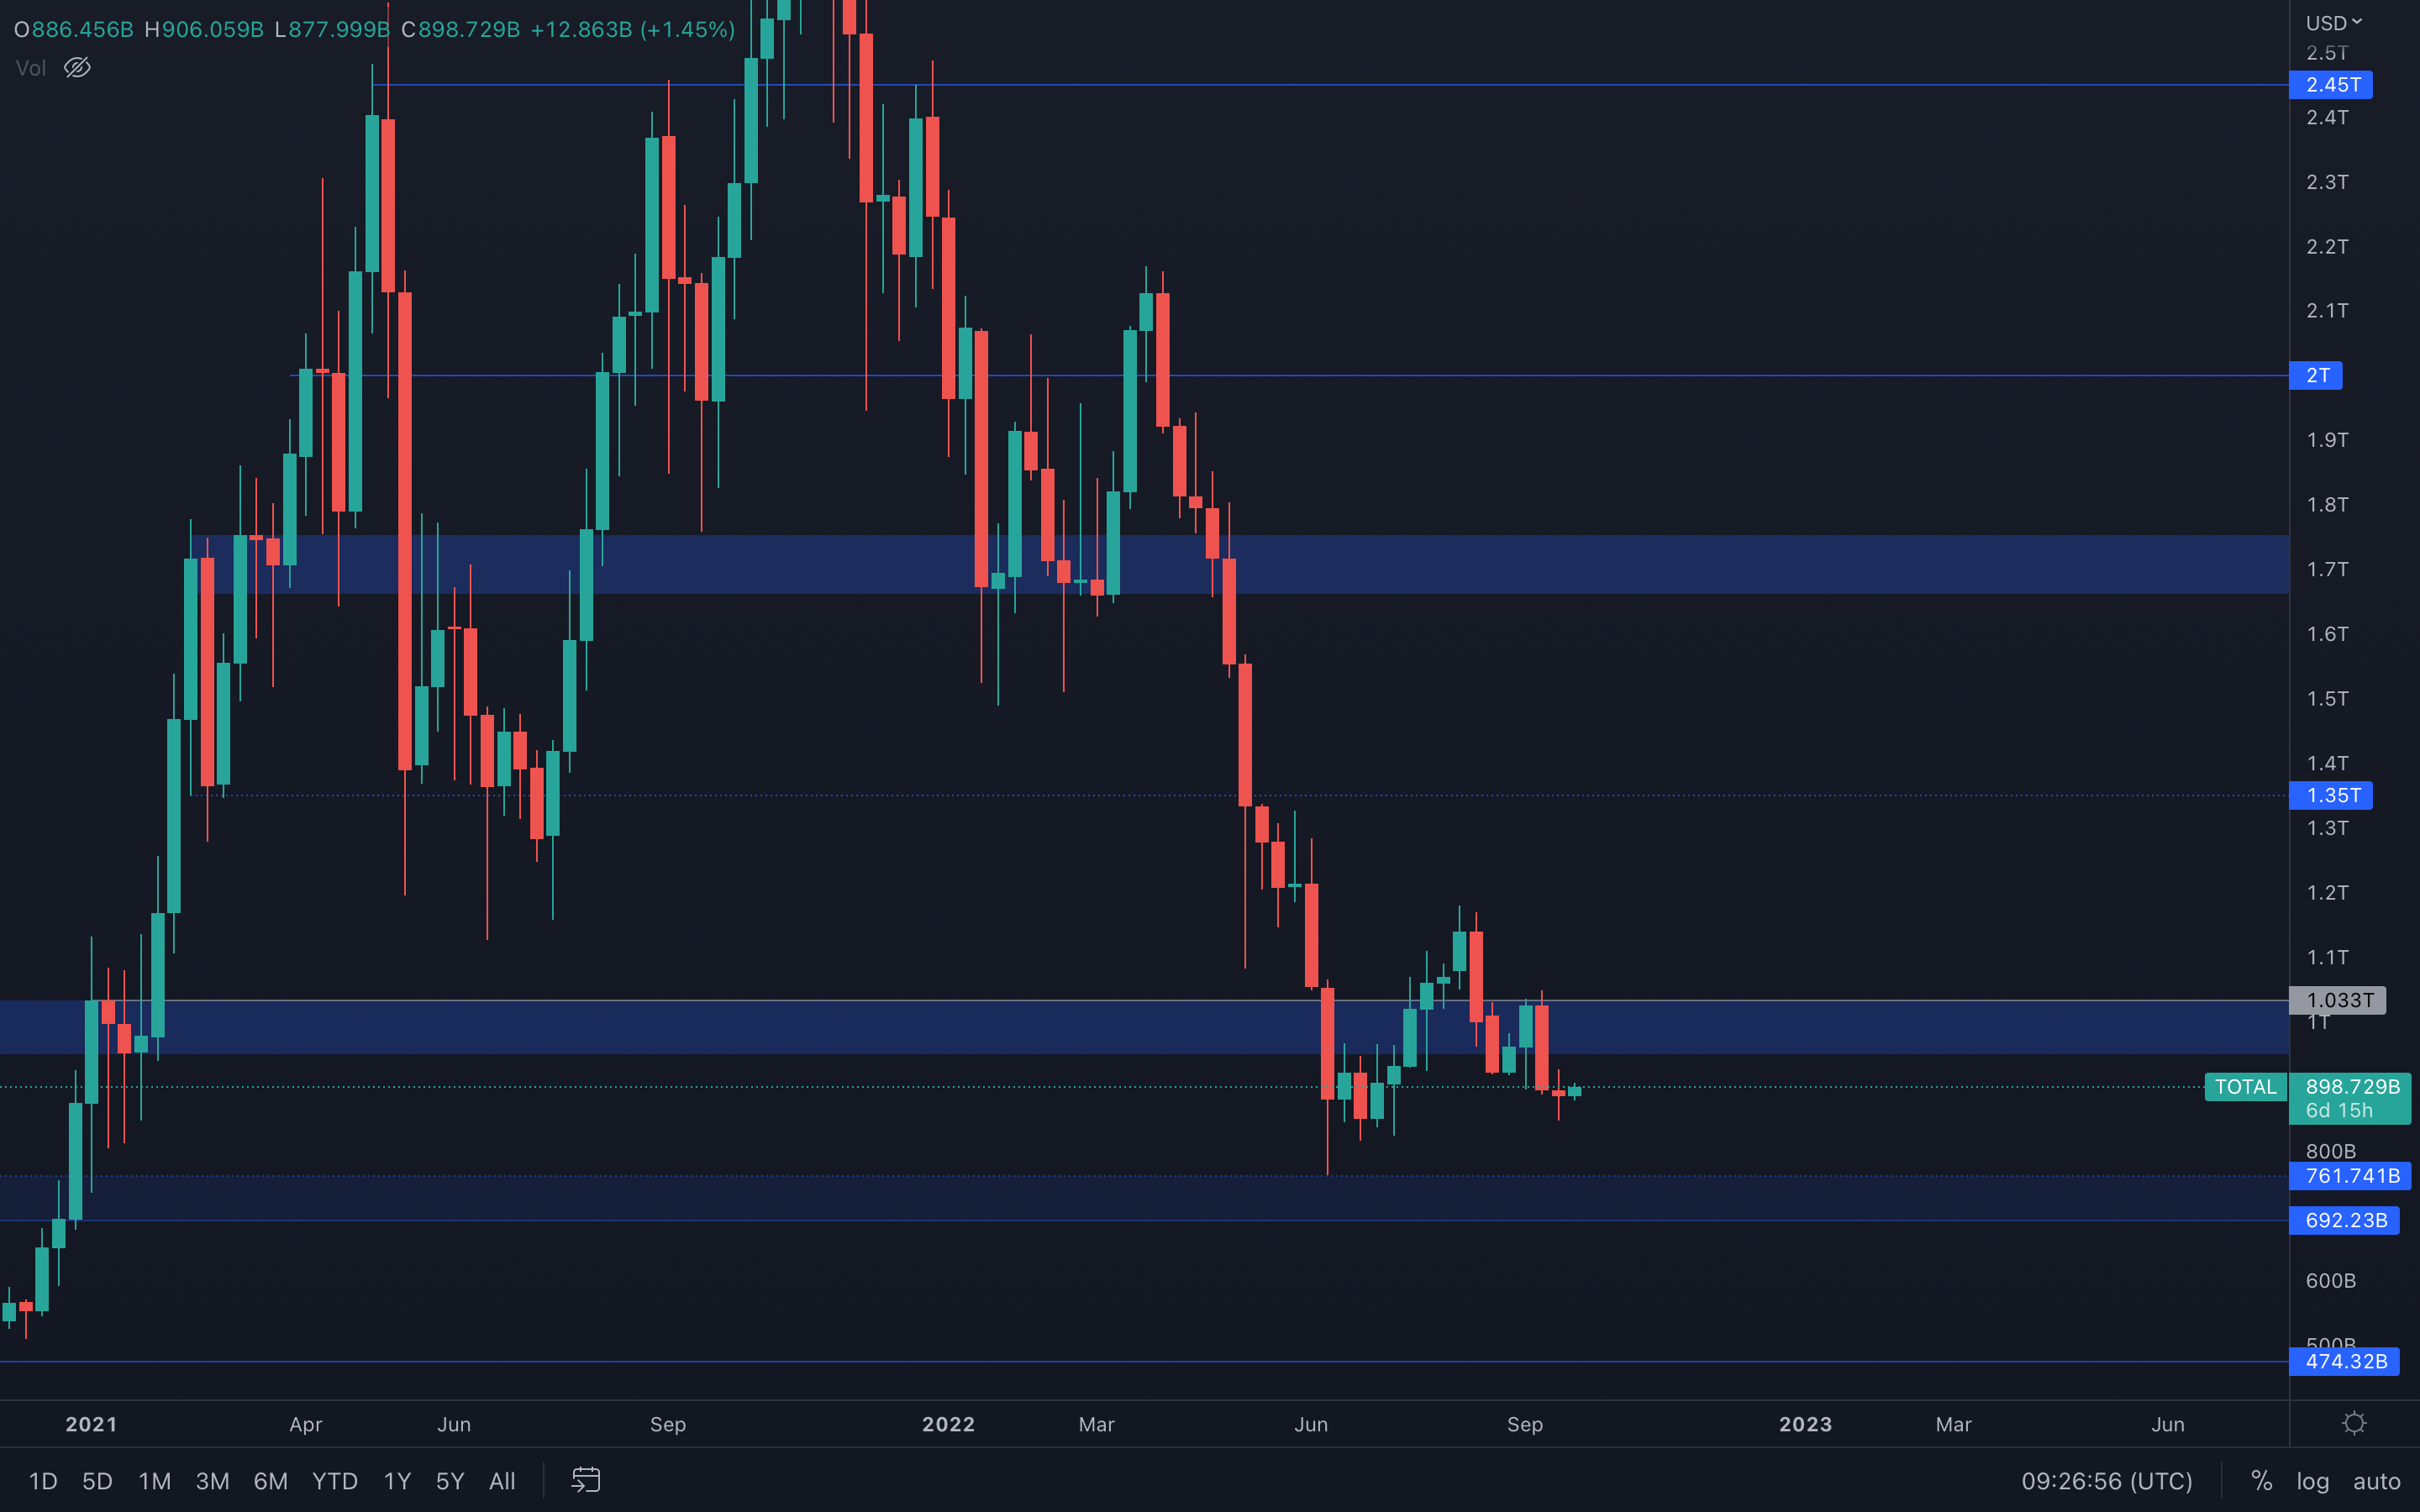 After the Total Market Cap lost its $950B - $1T support area two weeks ago, we mentioned that the index is on a path toward $760B - this statement remains valid. The Total Market Cap is still on a path to $760B unless it can reclaim $1.03T, which is the previous high.
The weekly market structure remains bearish, so there's no reason for us to expect higher prices at this moment in time.
Altcoins Market Cap
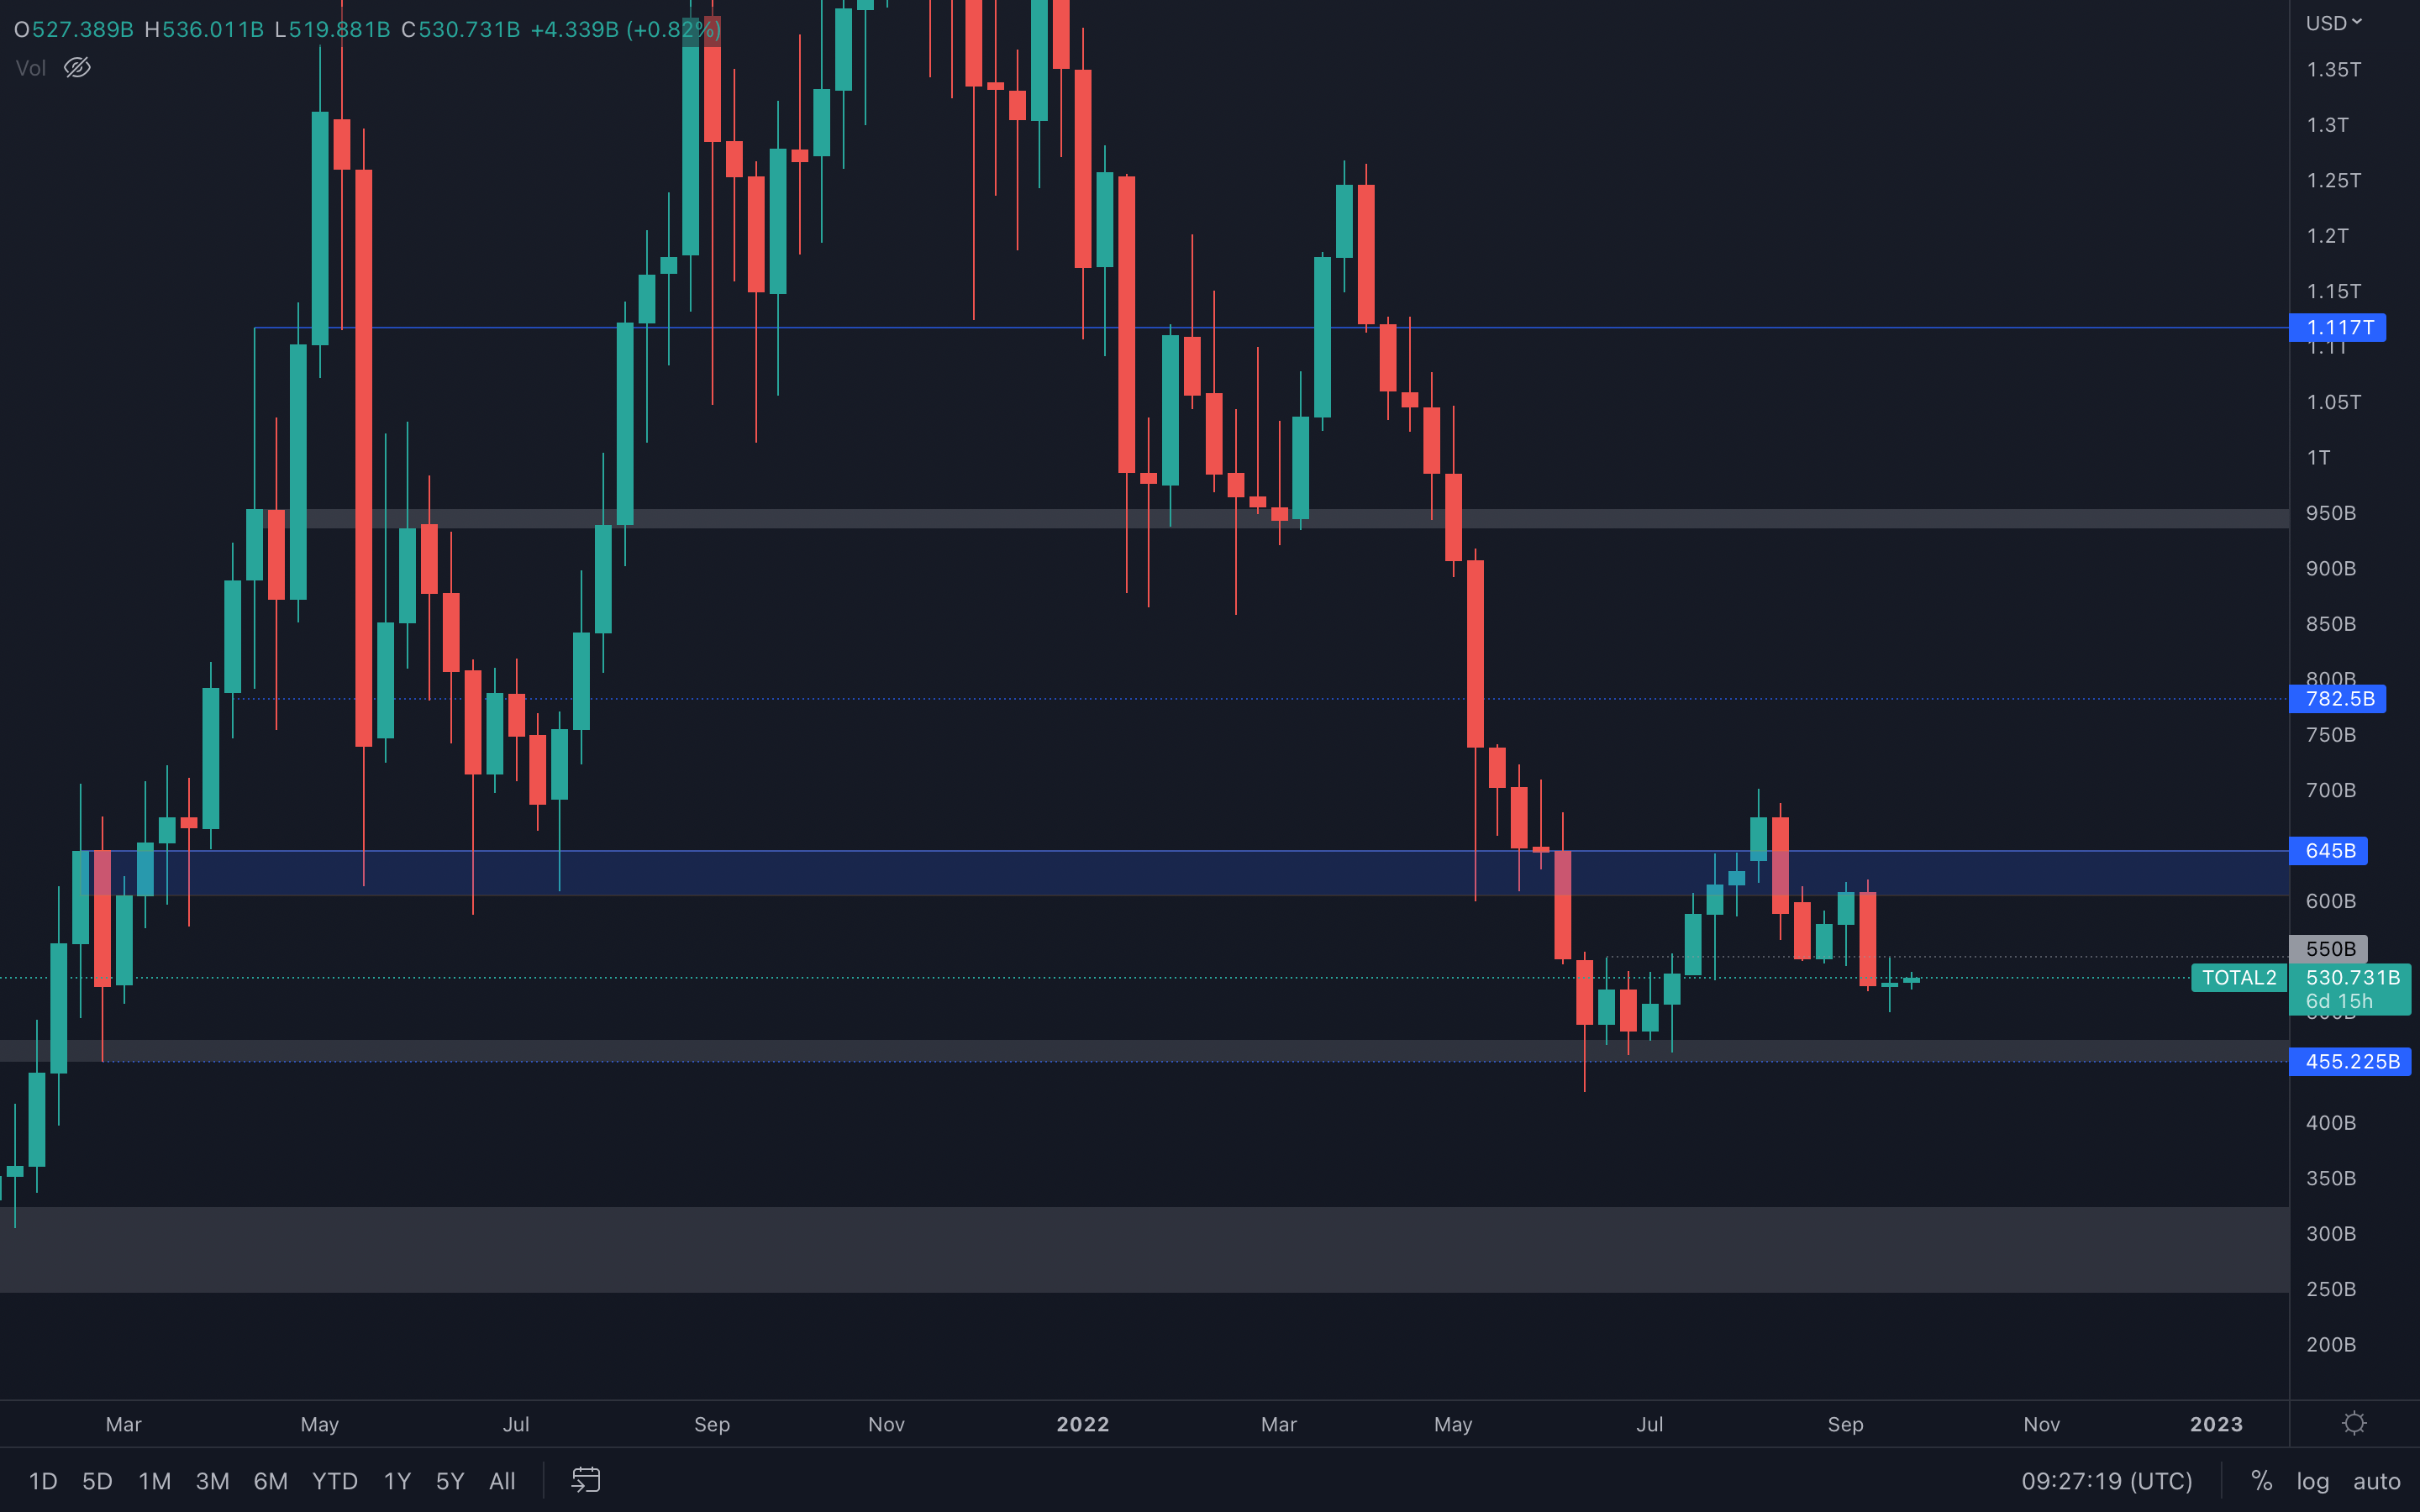 The Altcoins Market Cap index was unable to close above its $550B intermediate support level, which suggests a move toward $455B remains on the cards. Same as the Total MCap index, a reclaim of the closest resistance level is required to confirm any potential moves higher.
Since we don't have that yet, the Altcoins MCap index is still headed for $455B.
Bitcoin - Technical & On-Chain Analysis
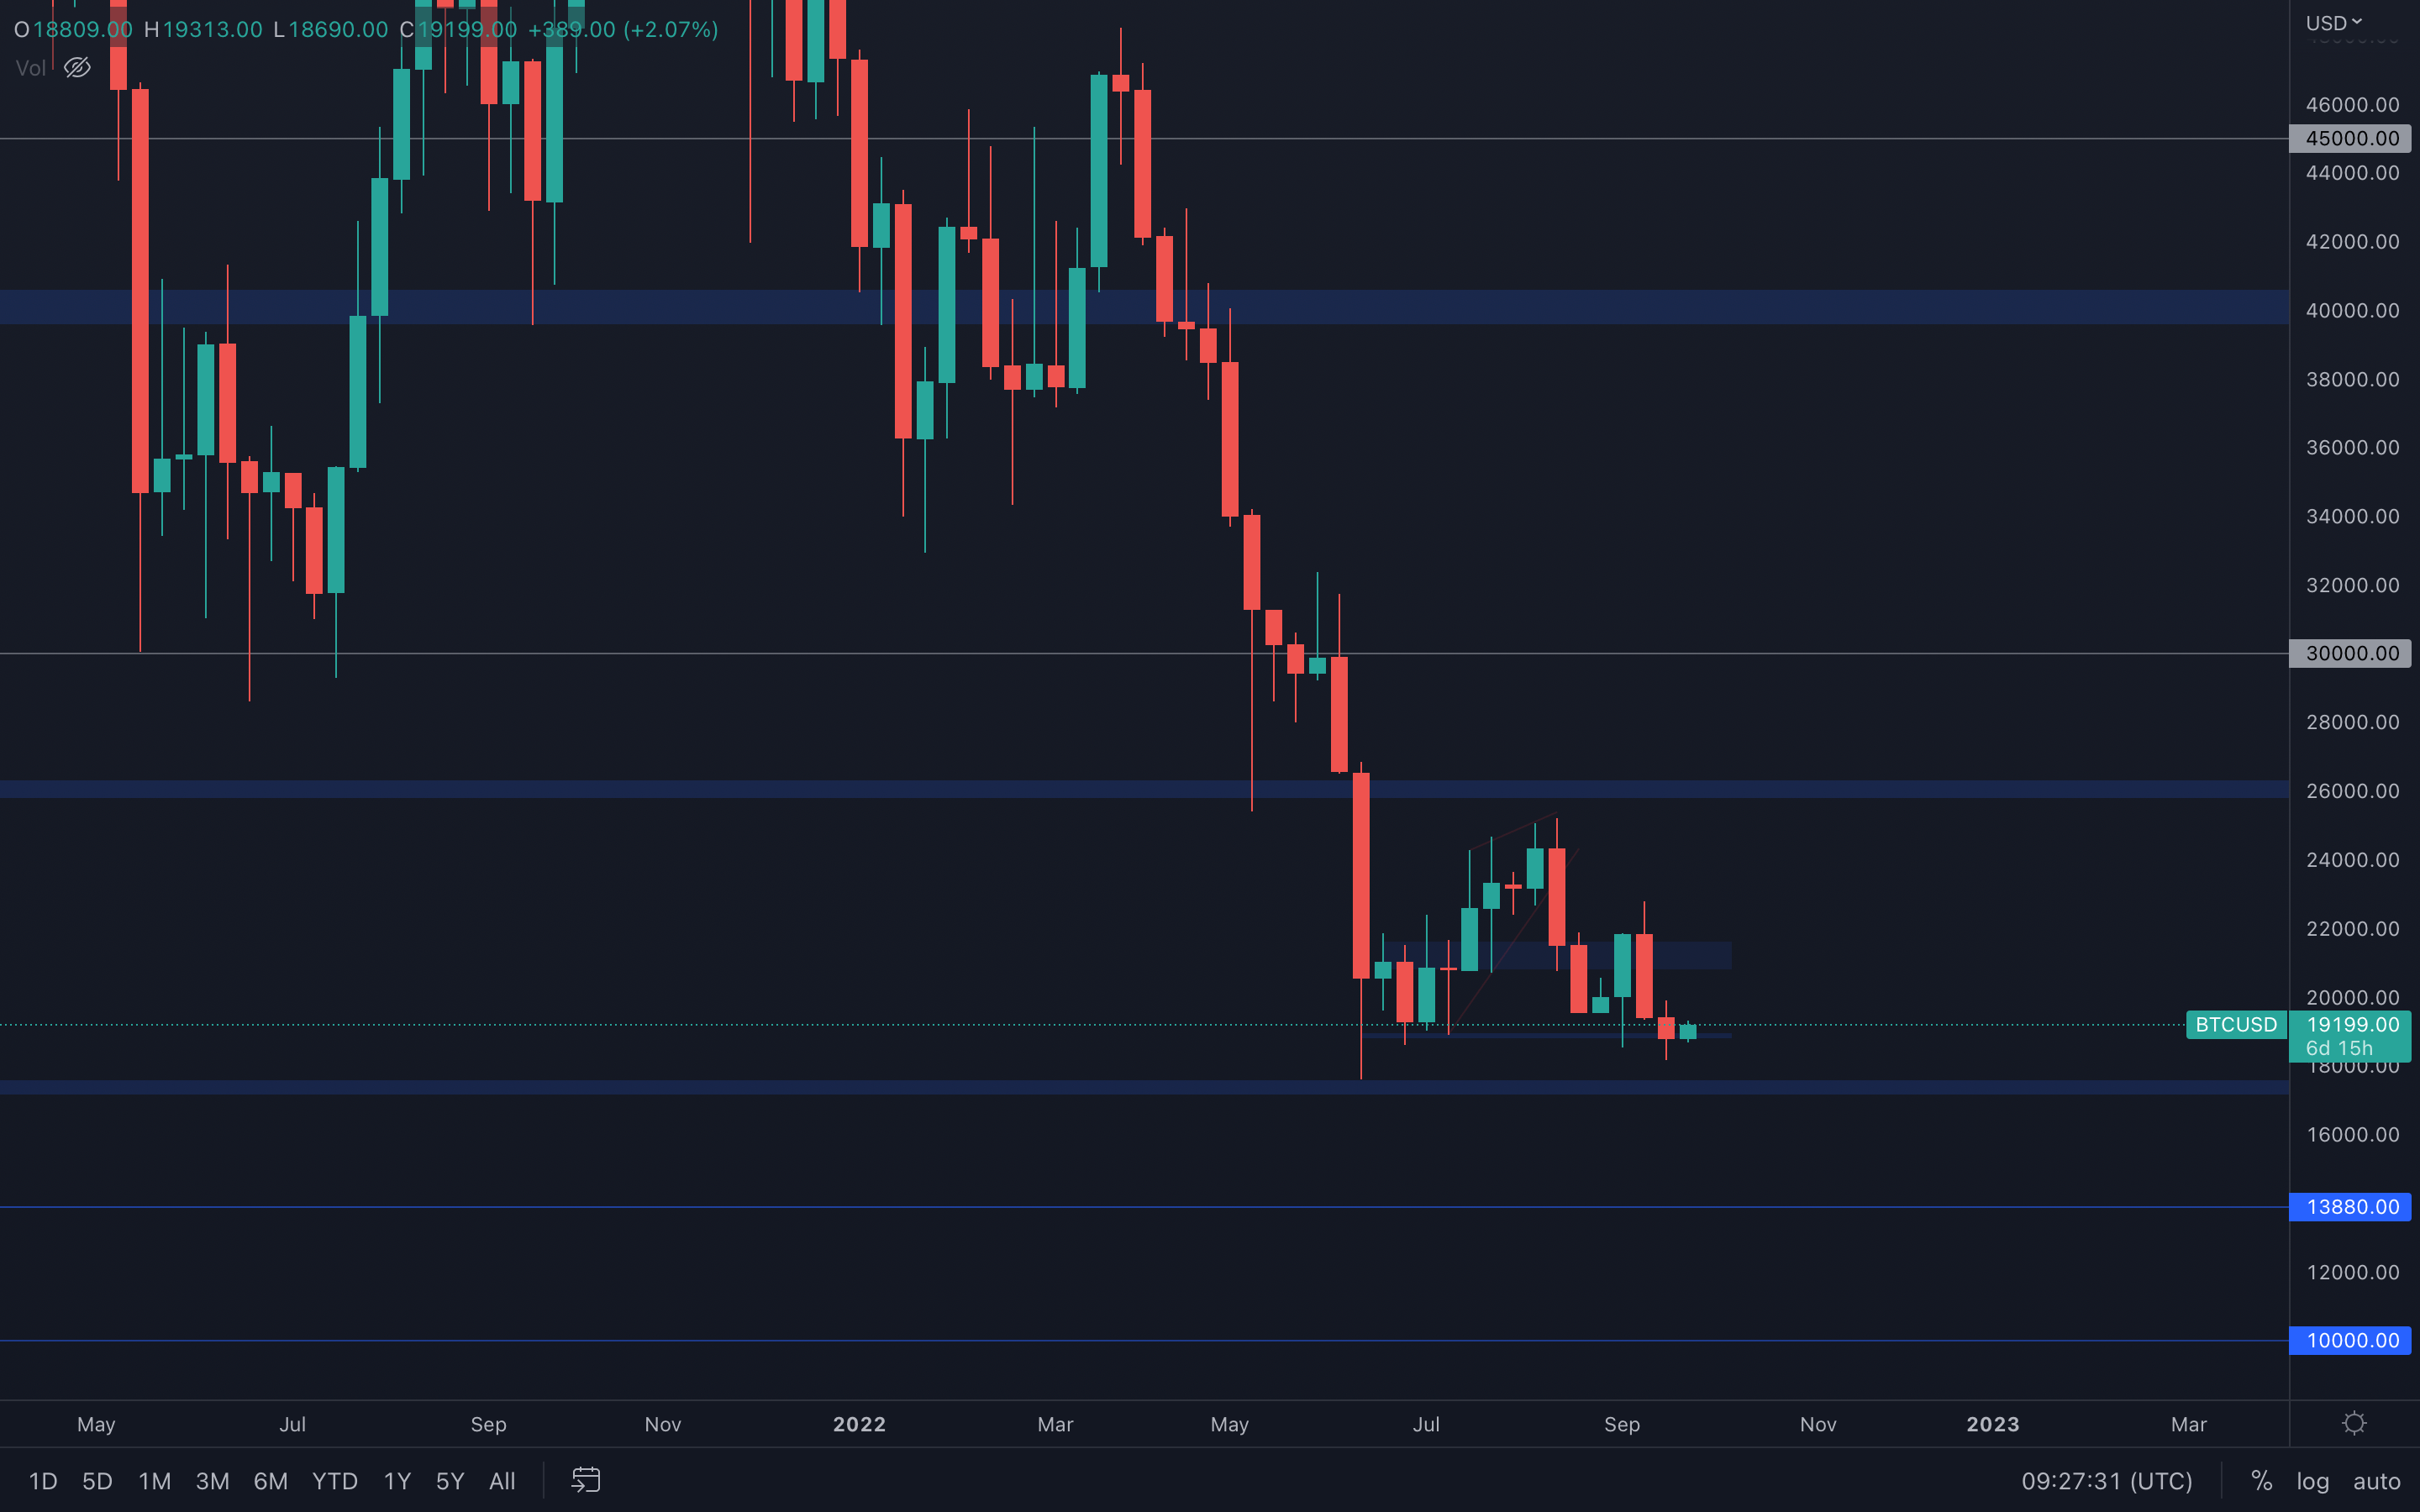 With the asset still above its $19,000 support level on both weekly and daily timeframes, understanding where Bitcoin is headed next might be a bit confusing. We know for a fact that the more a level is tested, the weaker it becomes, since buy orders, respectively sell orders are taken out after each test of said level.
A question remains that only time will answer - where is Bitcoin headed next? If we had to guess, with the way the market has been looking for the past few months, there's no reason for us to be bullish - a $17.5k support test might still be on the cards.
Metric 1 – Exchange Net Position Change
The first metric we will cover is the Exchange Net Position Change. This is the 30-day change of the supply of Bitcoins held in Exchange Wallets. We can see that in the last two weeks, there has been a positive net change (more coins flowing into the Exchange wallets than out of them and into cold storage). This tells us that there is a growing abundance of coins in Exchange wallets either having already been sold or waiting to be sold.
We can see from the last two periods of significant green spikes in this metric (January and late May) that following these spikes, the price declined significantly: from $44,000 down to $35,000 in January 2022 and from $32,000 down to $19,000 in late May/early June 2022. This may indicate that we could expect to see further declines in the coming month or so once the current green spikes have diminished. This may see Bitcoin test into the $12,000 to $15,000 range.
Bitcoin – Exchange Net Position Change

Metric 2 – Spent Outputs > 10 Years
The second metric we will look at today is the Spent Outputs metric. This set of metrics highlights to us the age of coins that were spent on that day. Historically, it has been a concern when the oldest coins have been spent, as this may indicate a change in the typical ‘hodler’ mentality.
Overall, there have not been too many significant changes in the past week from most coin cohorts. However, there has been one change that could be alarming. The Spent Outputs > 10 Years (coins that haven’t moved in the last 10 years) metric has recently seen a large spike, indicating a lot of coins from this cohort were recently sold. This may mean that some of the largest Bitcoin ‘hodlers’ are sensing the market may see more downside and are beginning to reduce their exposure.
Bitcoin – Spent Outputs > 10 Years

Metric 3 – New Addresses and 1K Wallet Addresses
In bull markets, we look for new entrants to be coming into the market in order to bring more liquidity in and as a result lift prices higher. Recently, we have seen New Addresses increase which has seen some in the space get excited and as a result, they have suggested that the bottom is in. However, in the last week, this metric has moved lower again and quelled some of the excitement.
Bitcoin – New Addresses

In order to really assess bear market bottoms, we look to a specific cohort of Bitcoin investors who have been historically excellent at knowing when to risk-on (add Bitcoin to their wallets) and when to risk-off (sell Bitcoin from their wallets). This cohort is the Addresses with Balance > 1,000 Bitcoin. In late 2018 and early 2019, this cohort aggressively accumulated Bitcoin, which proved the best time to do so in the past 4 years. However, we can now see that they’re continuing to de-risk and the number of wallets in this cohort is reducing considerably and is in a long-term downtrend. Once, they begin a new uptrend (preferably one that is steep), this will likely be a key metric in deciding when we ourselves should be risking back-on again.
Note: The large spike up on the last day of March 2022 was not a misprint but also not an organic print. It was Exchanges opening up new wallets to hold coins. This was confirmed by the data provider – Glassnode.
Bitcoin – Addresses with Balance > 1,000 Bitcoin

Metric 4 – Hash Ribbon
The last metric we will cover today is the Hash Ribbon. The Hash Ribbon is a market indicator that tends to suggest that Bitcoin reaches a market bottom when miners capitulate. This usually sees the 30d MA cross back above the 60d MA on the hash rate. We can see in the below that this has already happened, however, Difficulty and Hash Rate are at all-time highs, so it is likely that it is just the most efficient miners remaining. But with the 30d MA turning lower again (due to the price of BTC turning lower) could we see another dip underneath the 60d MA from the 30d MA if the price were to capitulate again? This would likely be due to another macro shock i.e., another bad inflation print.
Bitcoin – Hash Ribbon

S&P 500 Index
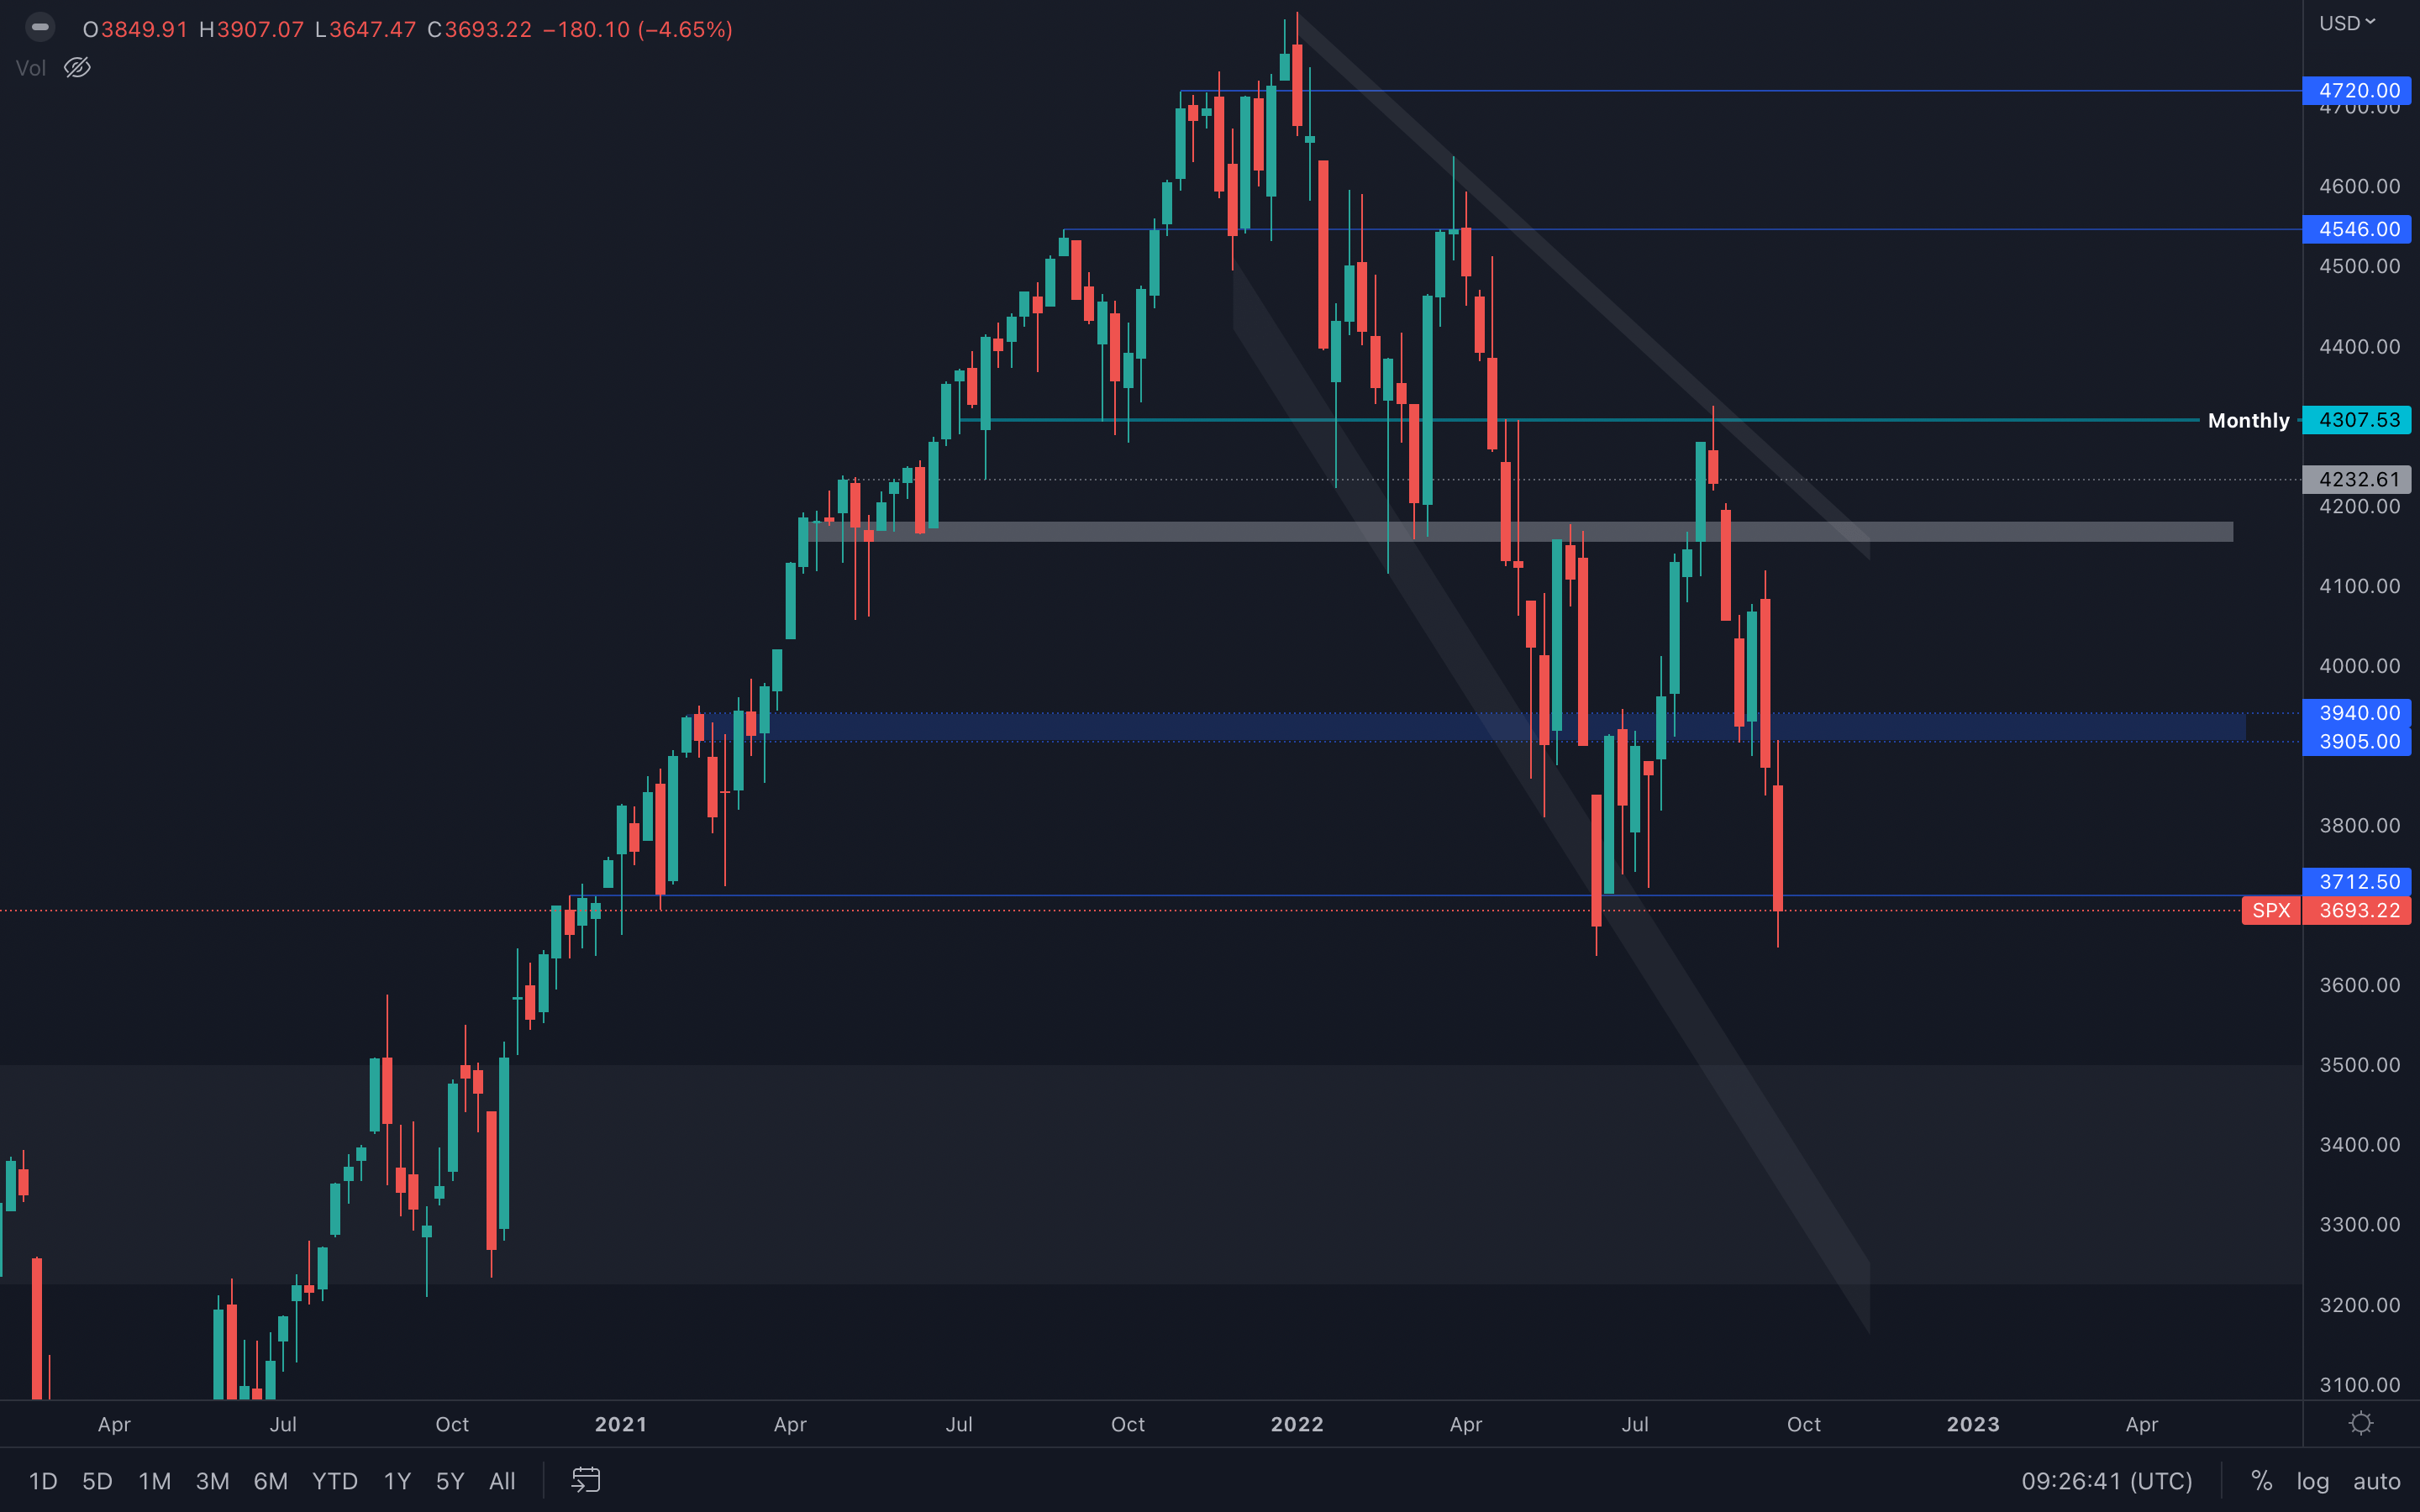 The S&P 500 Index has reached its $3700 support level, something we mentioned in last week's report. The index has now created an equal low on the weekly timeframe, which is still not enough to invalidate the potential shift in market structures. Only a new low will invalidate the shift, which is a scenario that occurred between January and April of this year as well.
For now, SPX is currently forming an even lower monthly closure for September than in previous months - if the index closes September under $3700, then we are most likely going to test the $3200 - $3500 range in the coming months.
Ether - Technical Analysis
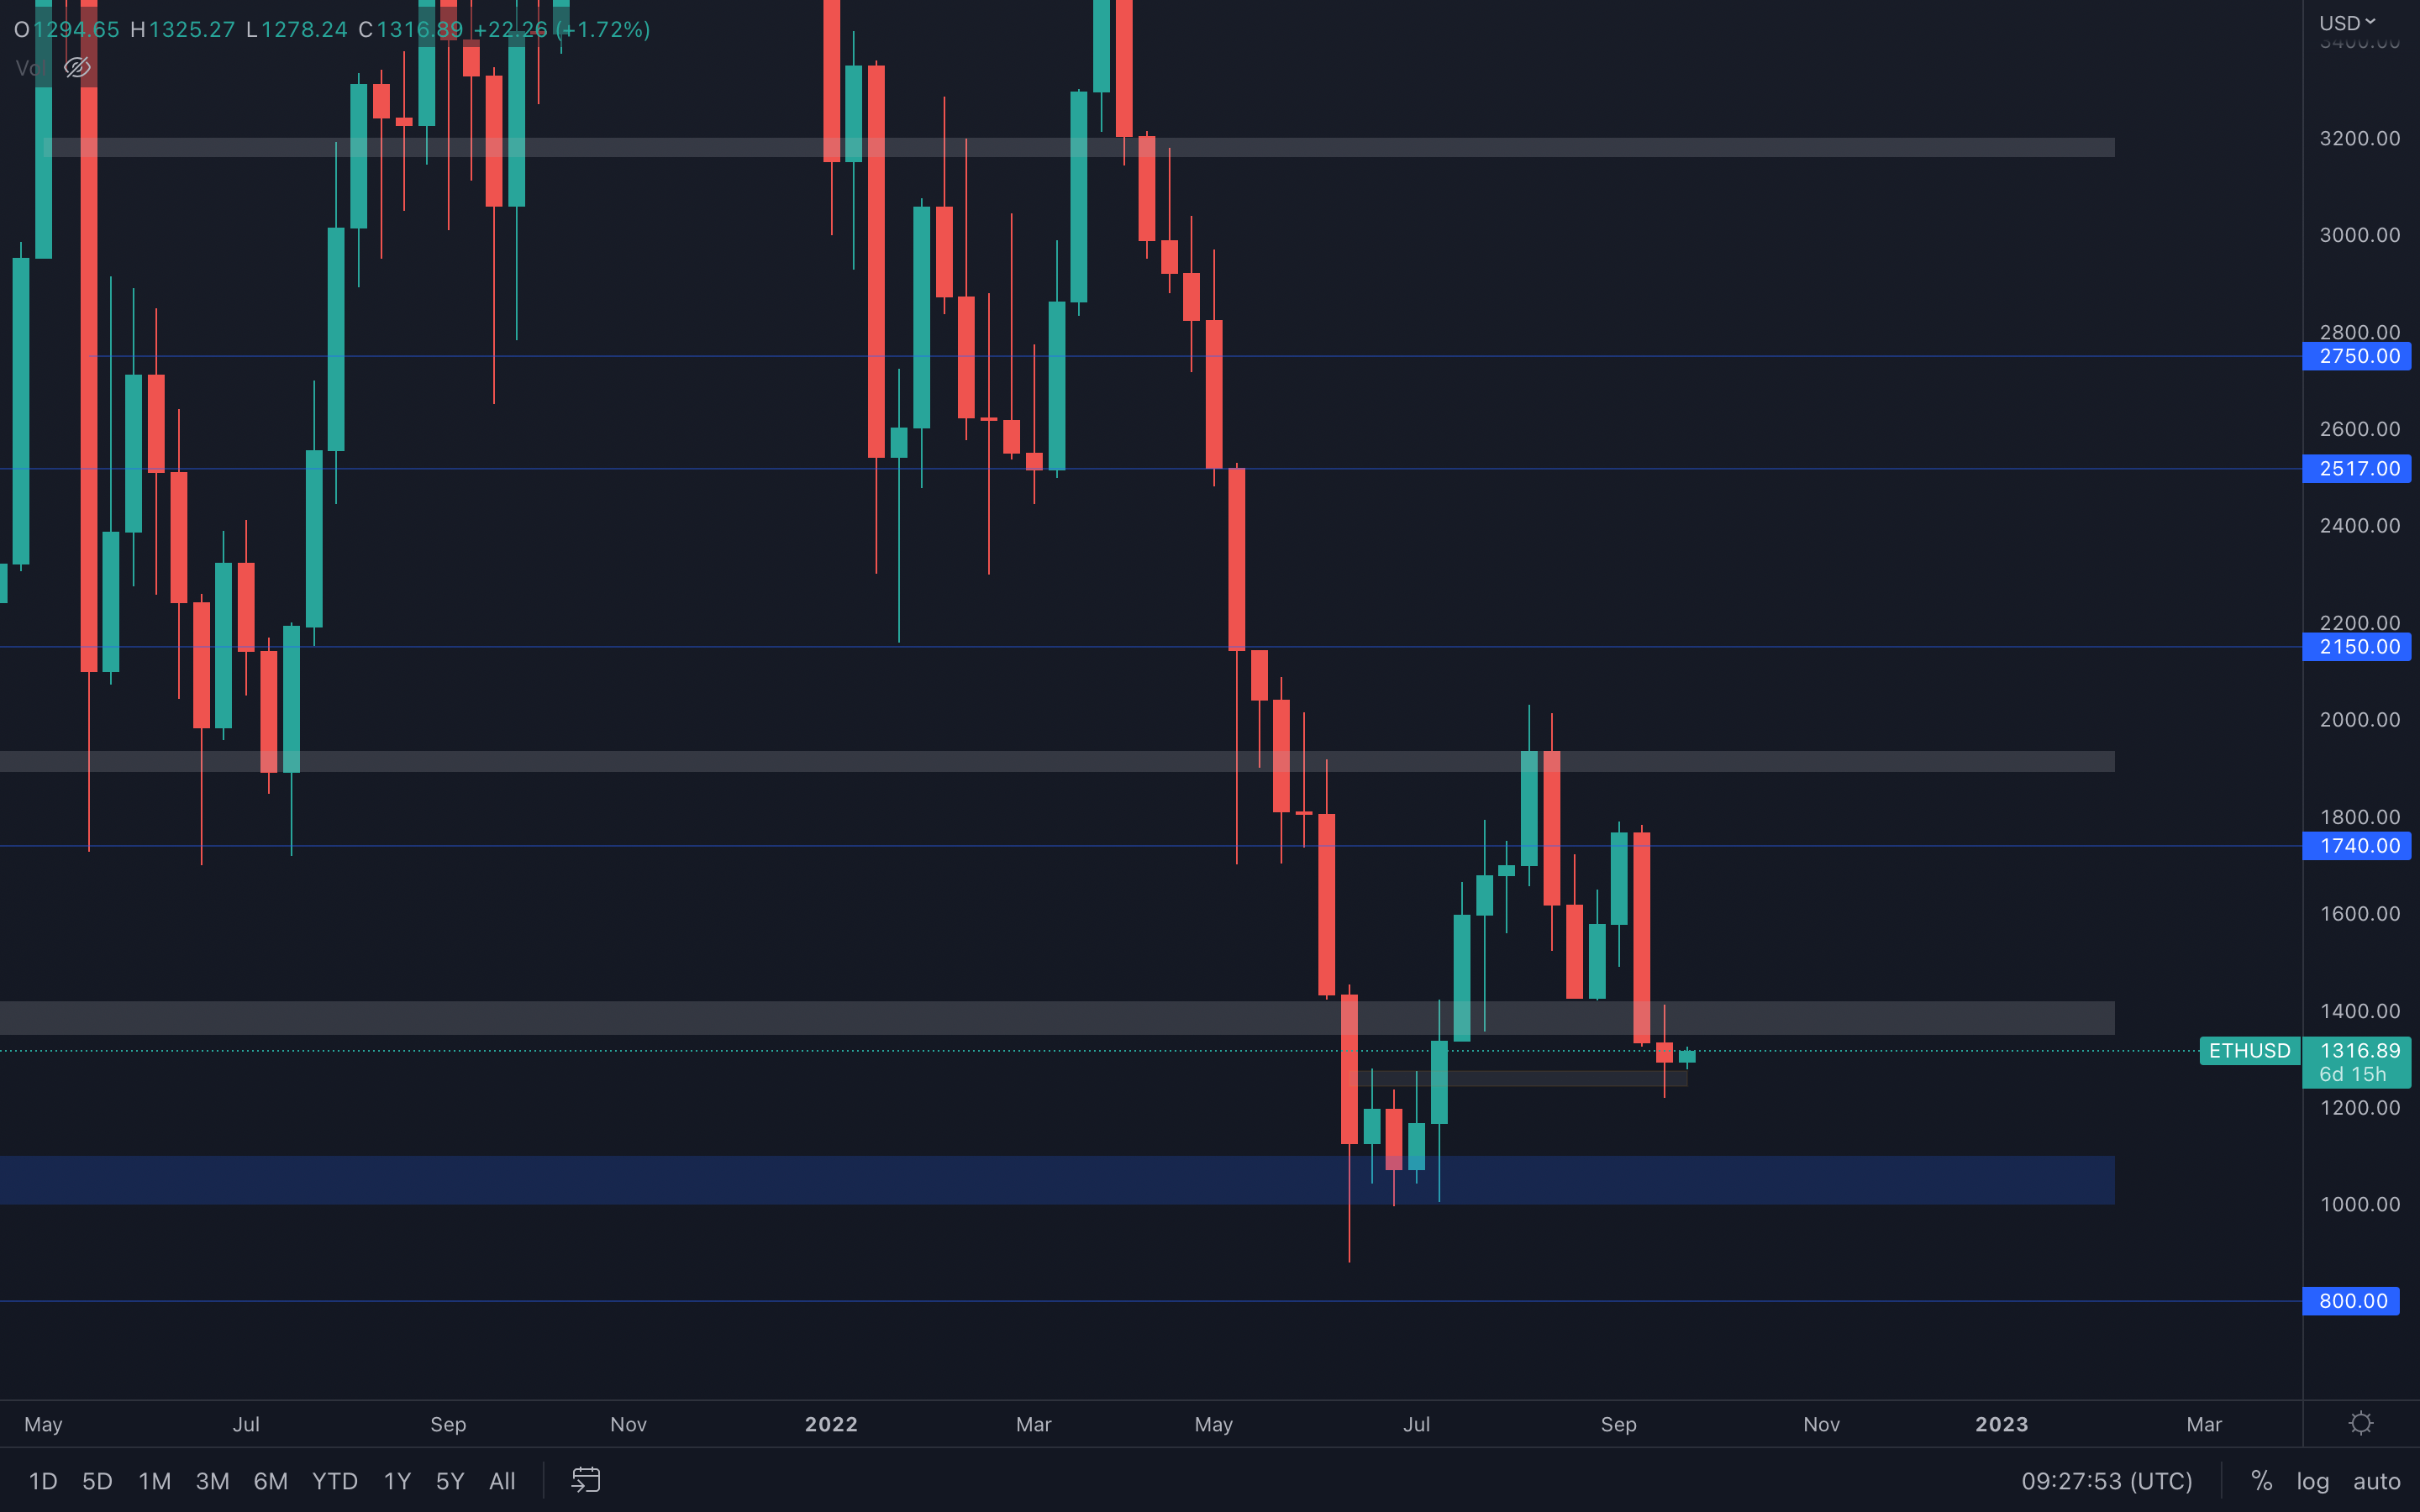 With Ether still above this local support area ($1275 - $1250), a $1400 resistance test can occur if no sudden bearish movements or volatility enter the market. However, we should prepare for even lower prices, such as the psychological and technical level of $1000.
The reason for that is truly simple - all timeframes are currently in a bearish market structure, which tells us there is absolutely no reason to expect bullish movements anytime soon. Our bias remains bearish and so should yours, otherwise, we can easily end up getting trapped by complicating something that should remain simple.
DOT
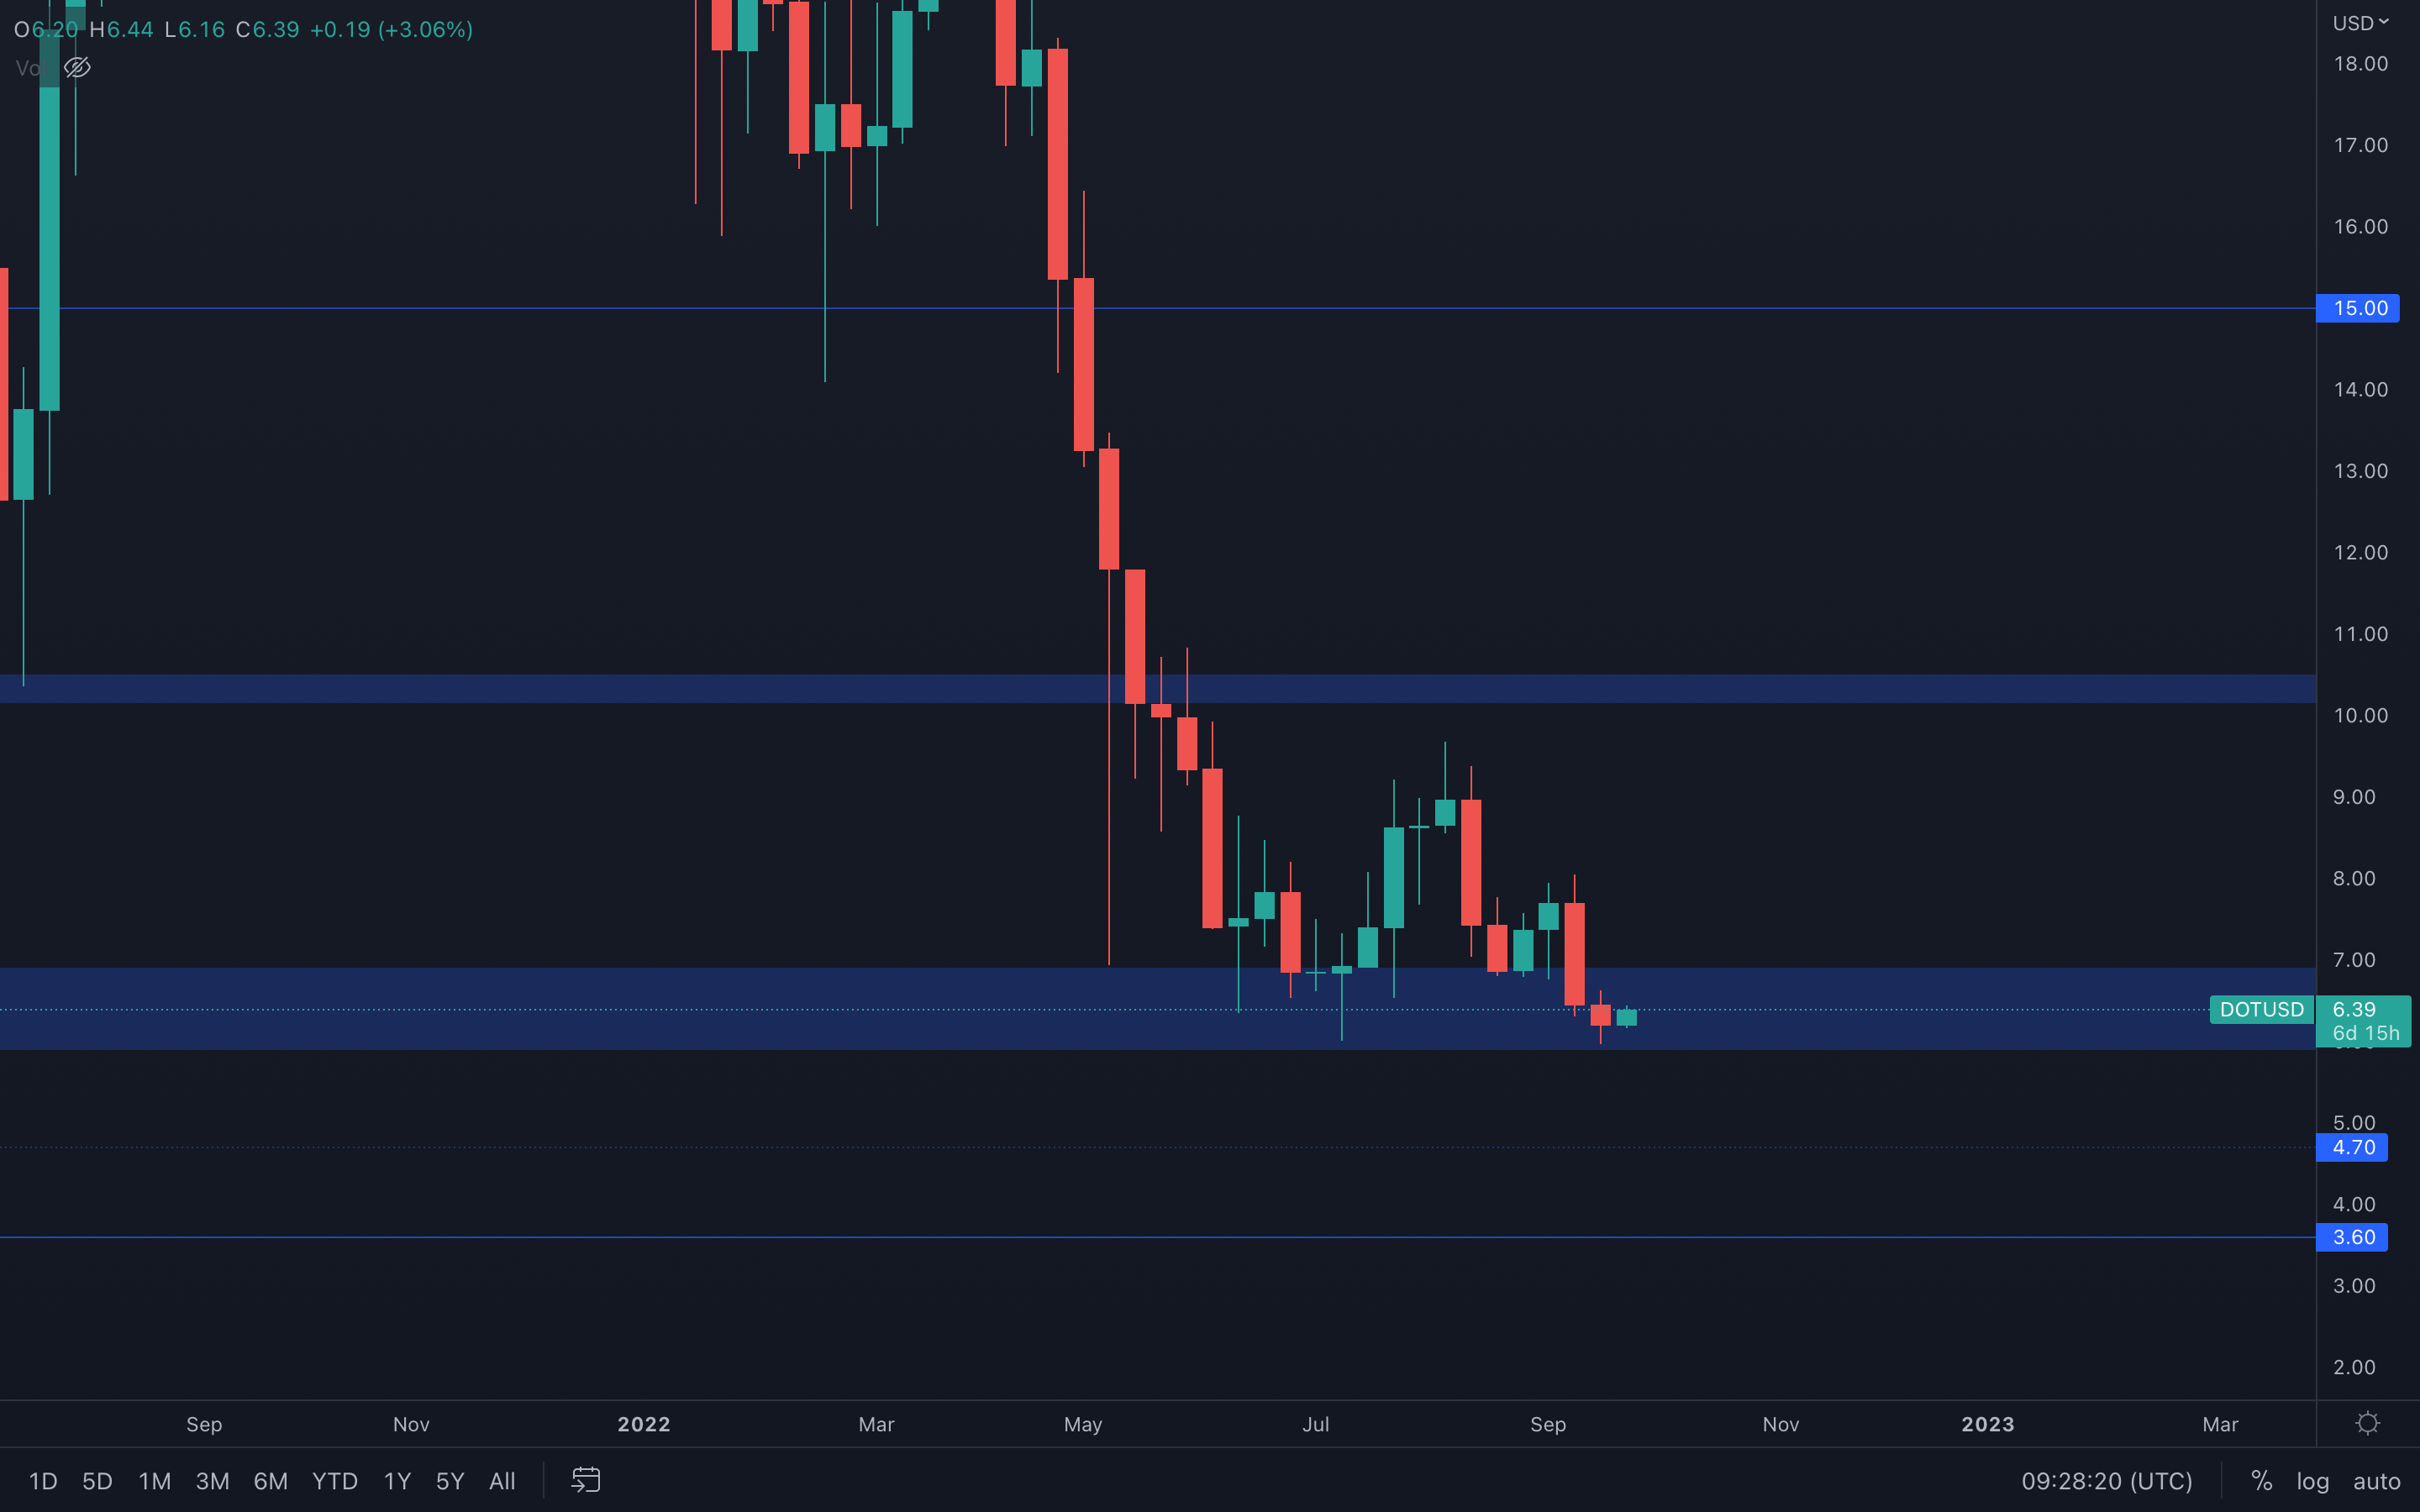 We're going to keep it short and simple here - since DOT is still above its $6 support level (the bottom part of the $6 - $7 range), then we cannot assume the asset will drop lower than said level.
What's left to deduce here is the following - with not enough volume to sustain moves higher, DOT will continue to range between $7 and $6 until either of these levels are broken (weekly closure under or above).
SNX
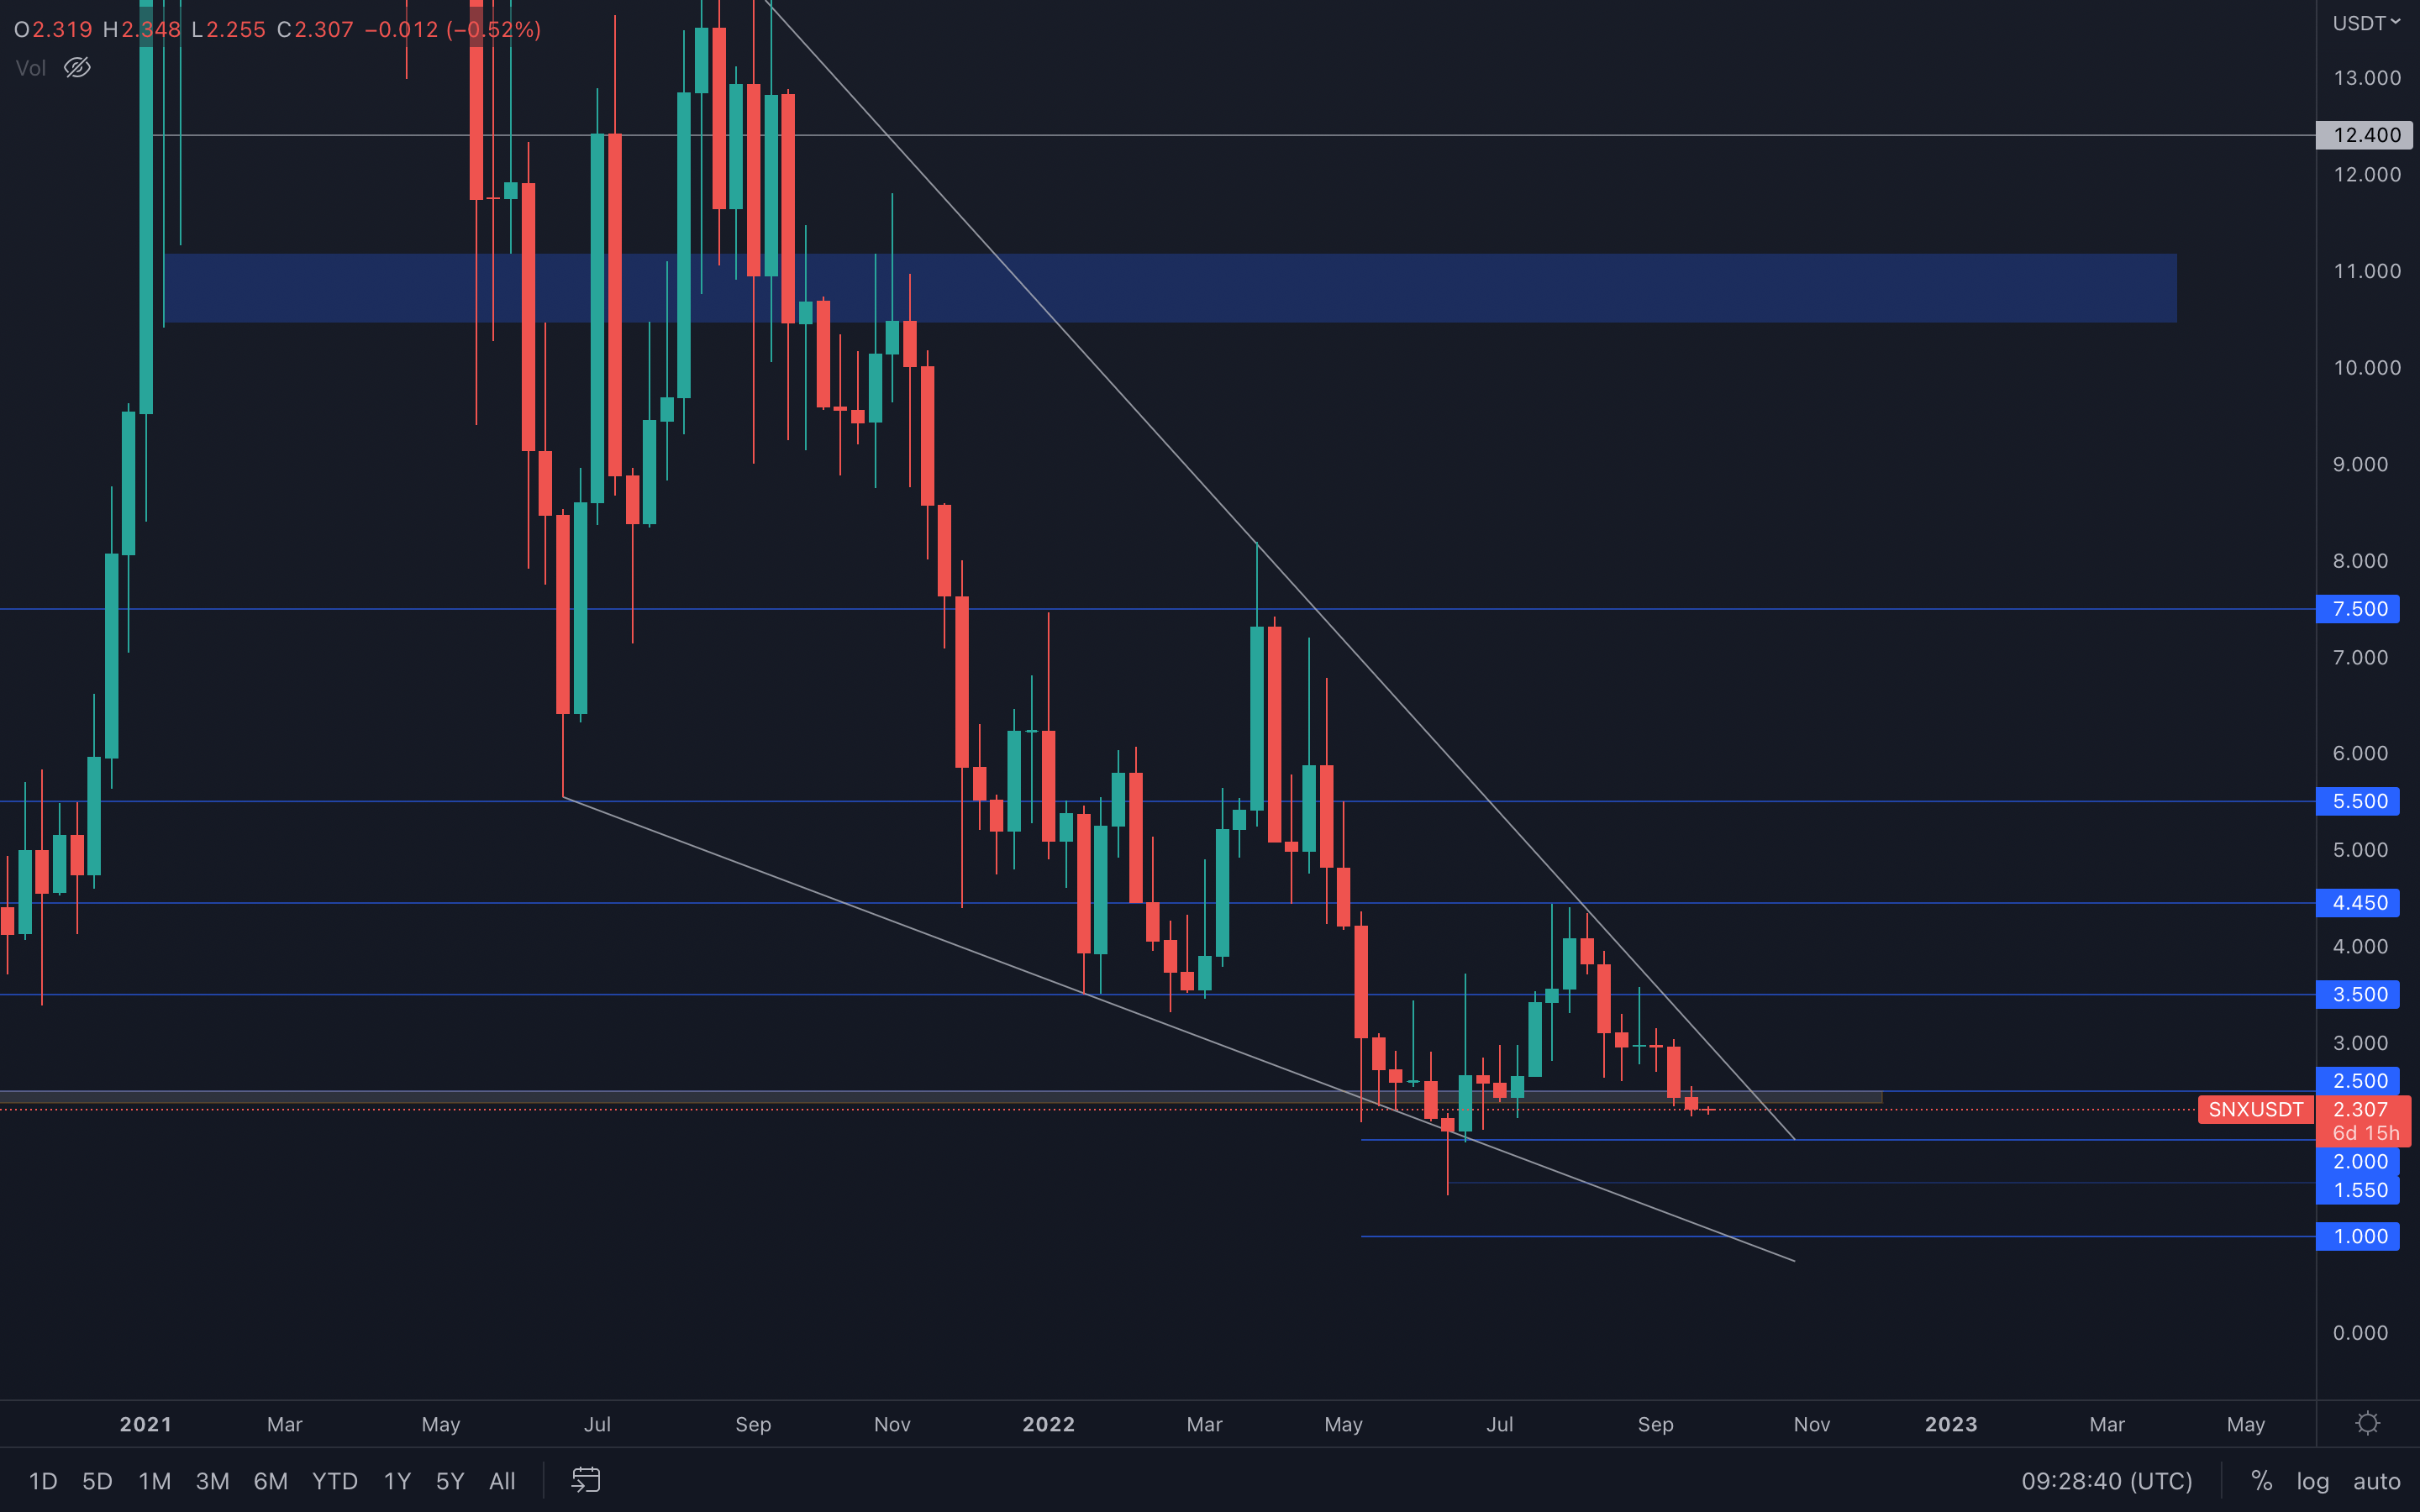 In last week's report, we mentioned that a loss of the $2.50 support level will put $2 as the next target for SNX - this scenario is now in play. Last week, SNX closed under $2.50, which means we are going to see a $2 SNX in the coming days/weeks, depending on the market's volatility.
An invalidation of this scenario occurs after the asset reclaims its $2.50 level.
RUNE
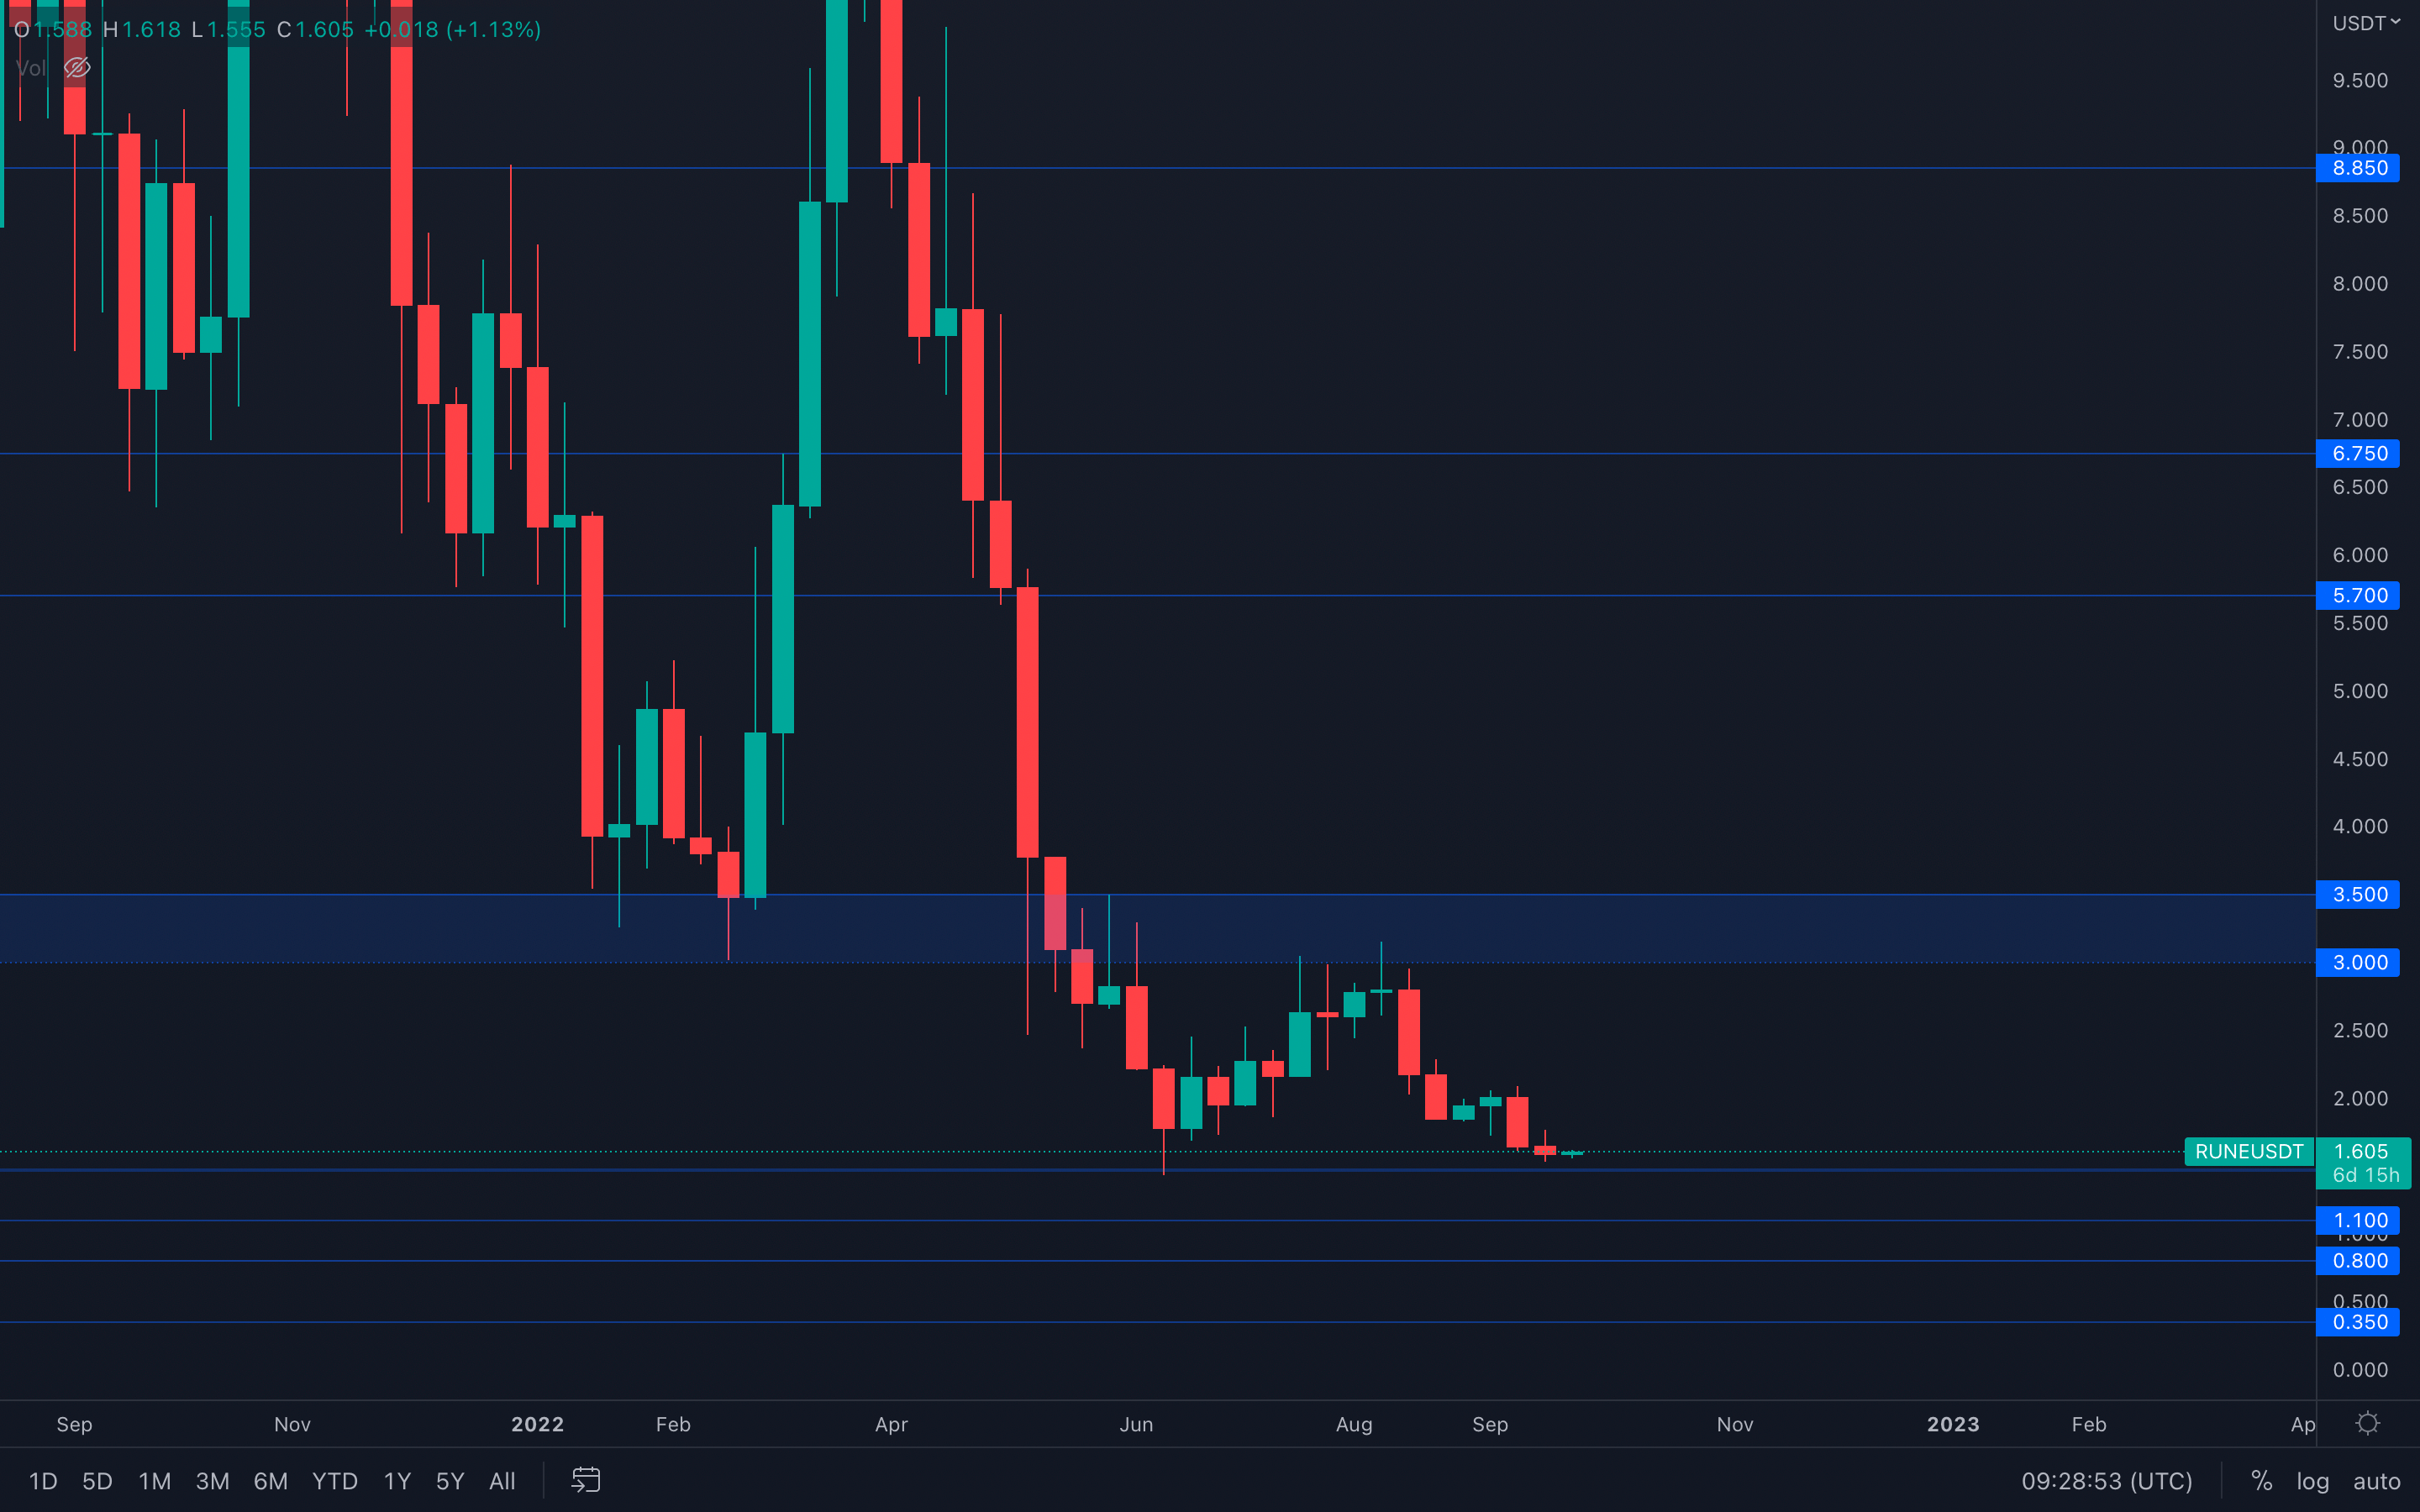 RUNE has found itself just above its June lows ($1.50), and since its volume is minuscule, then a proper $1.50 test should be expected soon. A loss of $1.50 will push RUNE toward the next support level, $1.10
SOL
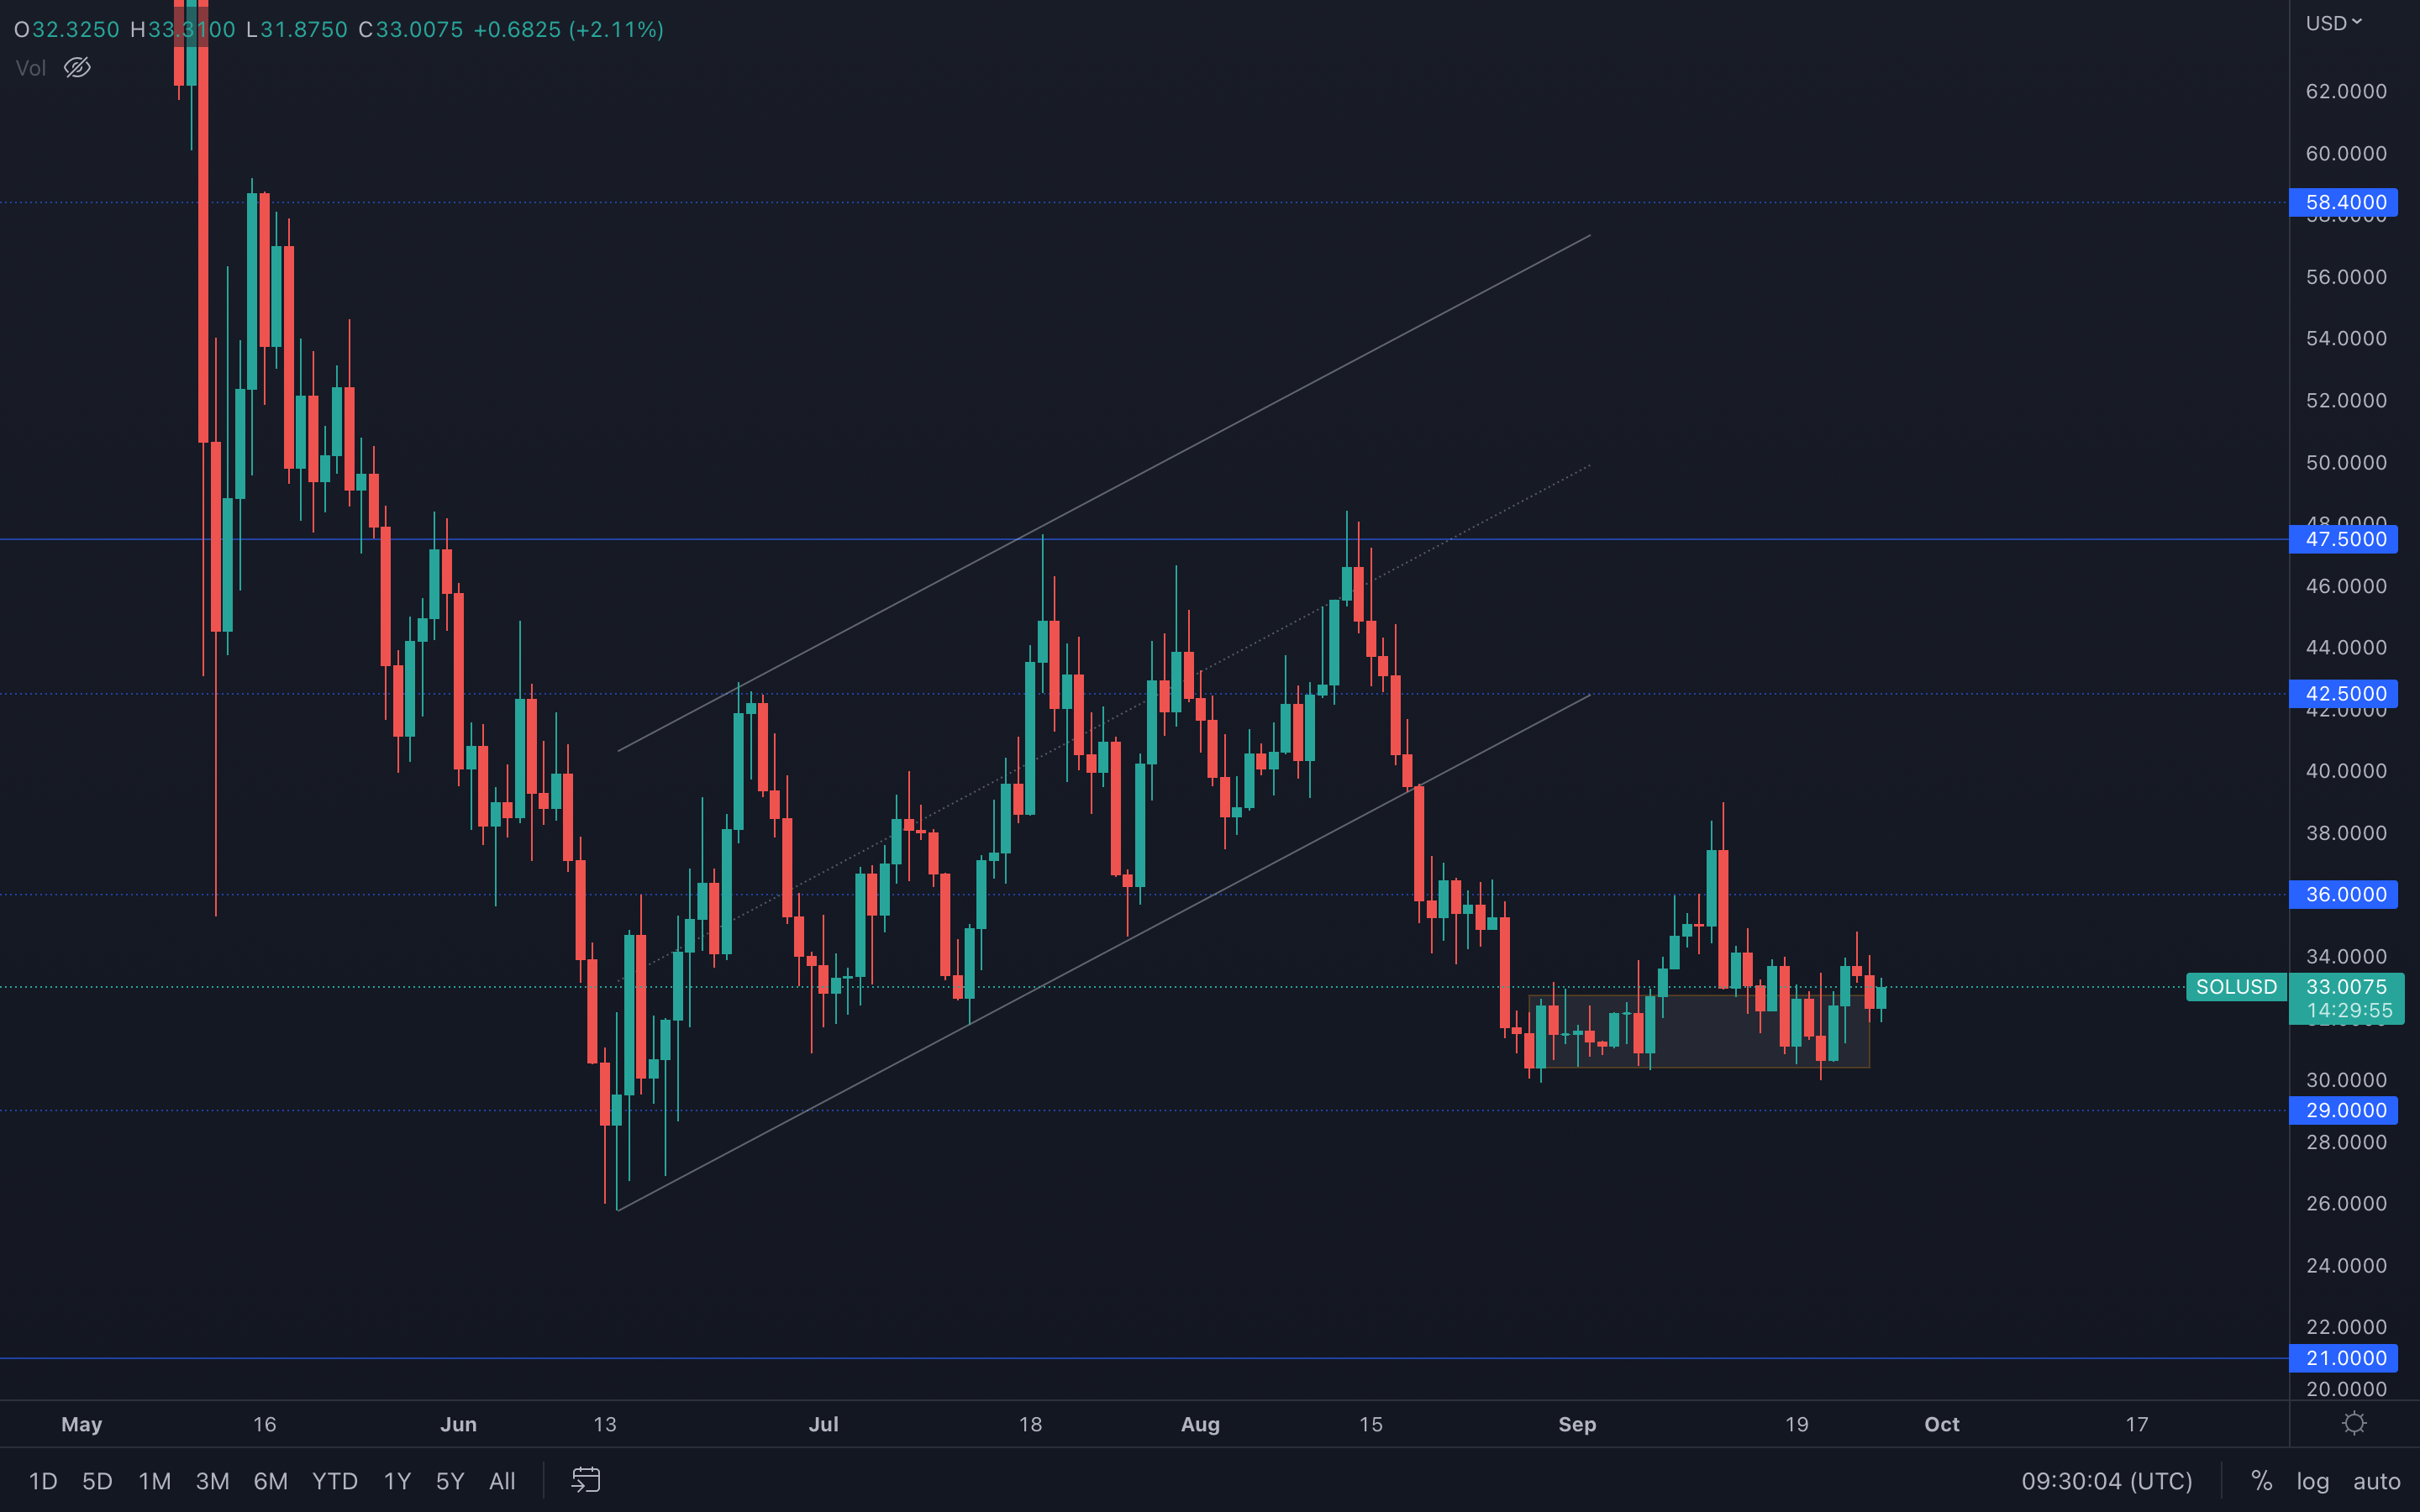 (Daily chart was used)
We've used the daily chart here for a better view of this local support area - SOL has been ranging above it throughout September which means $30, specifically $30.35 is an important local level for SOL. Until the bottom of this range is lost ($30.35), then there is no confirmation for a $29 support test.
Instead, since this level has been held perfectly so far, SOL can now try a move toward $36 where it's likely we're going to start descending again.
SRM
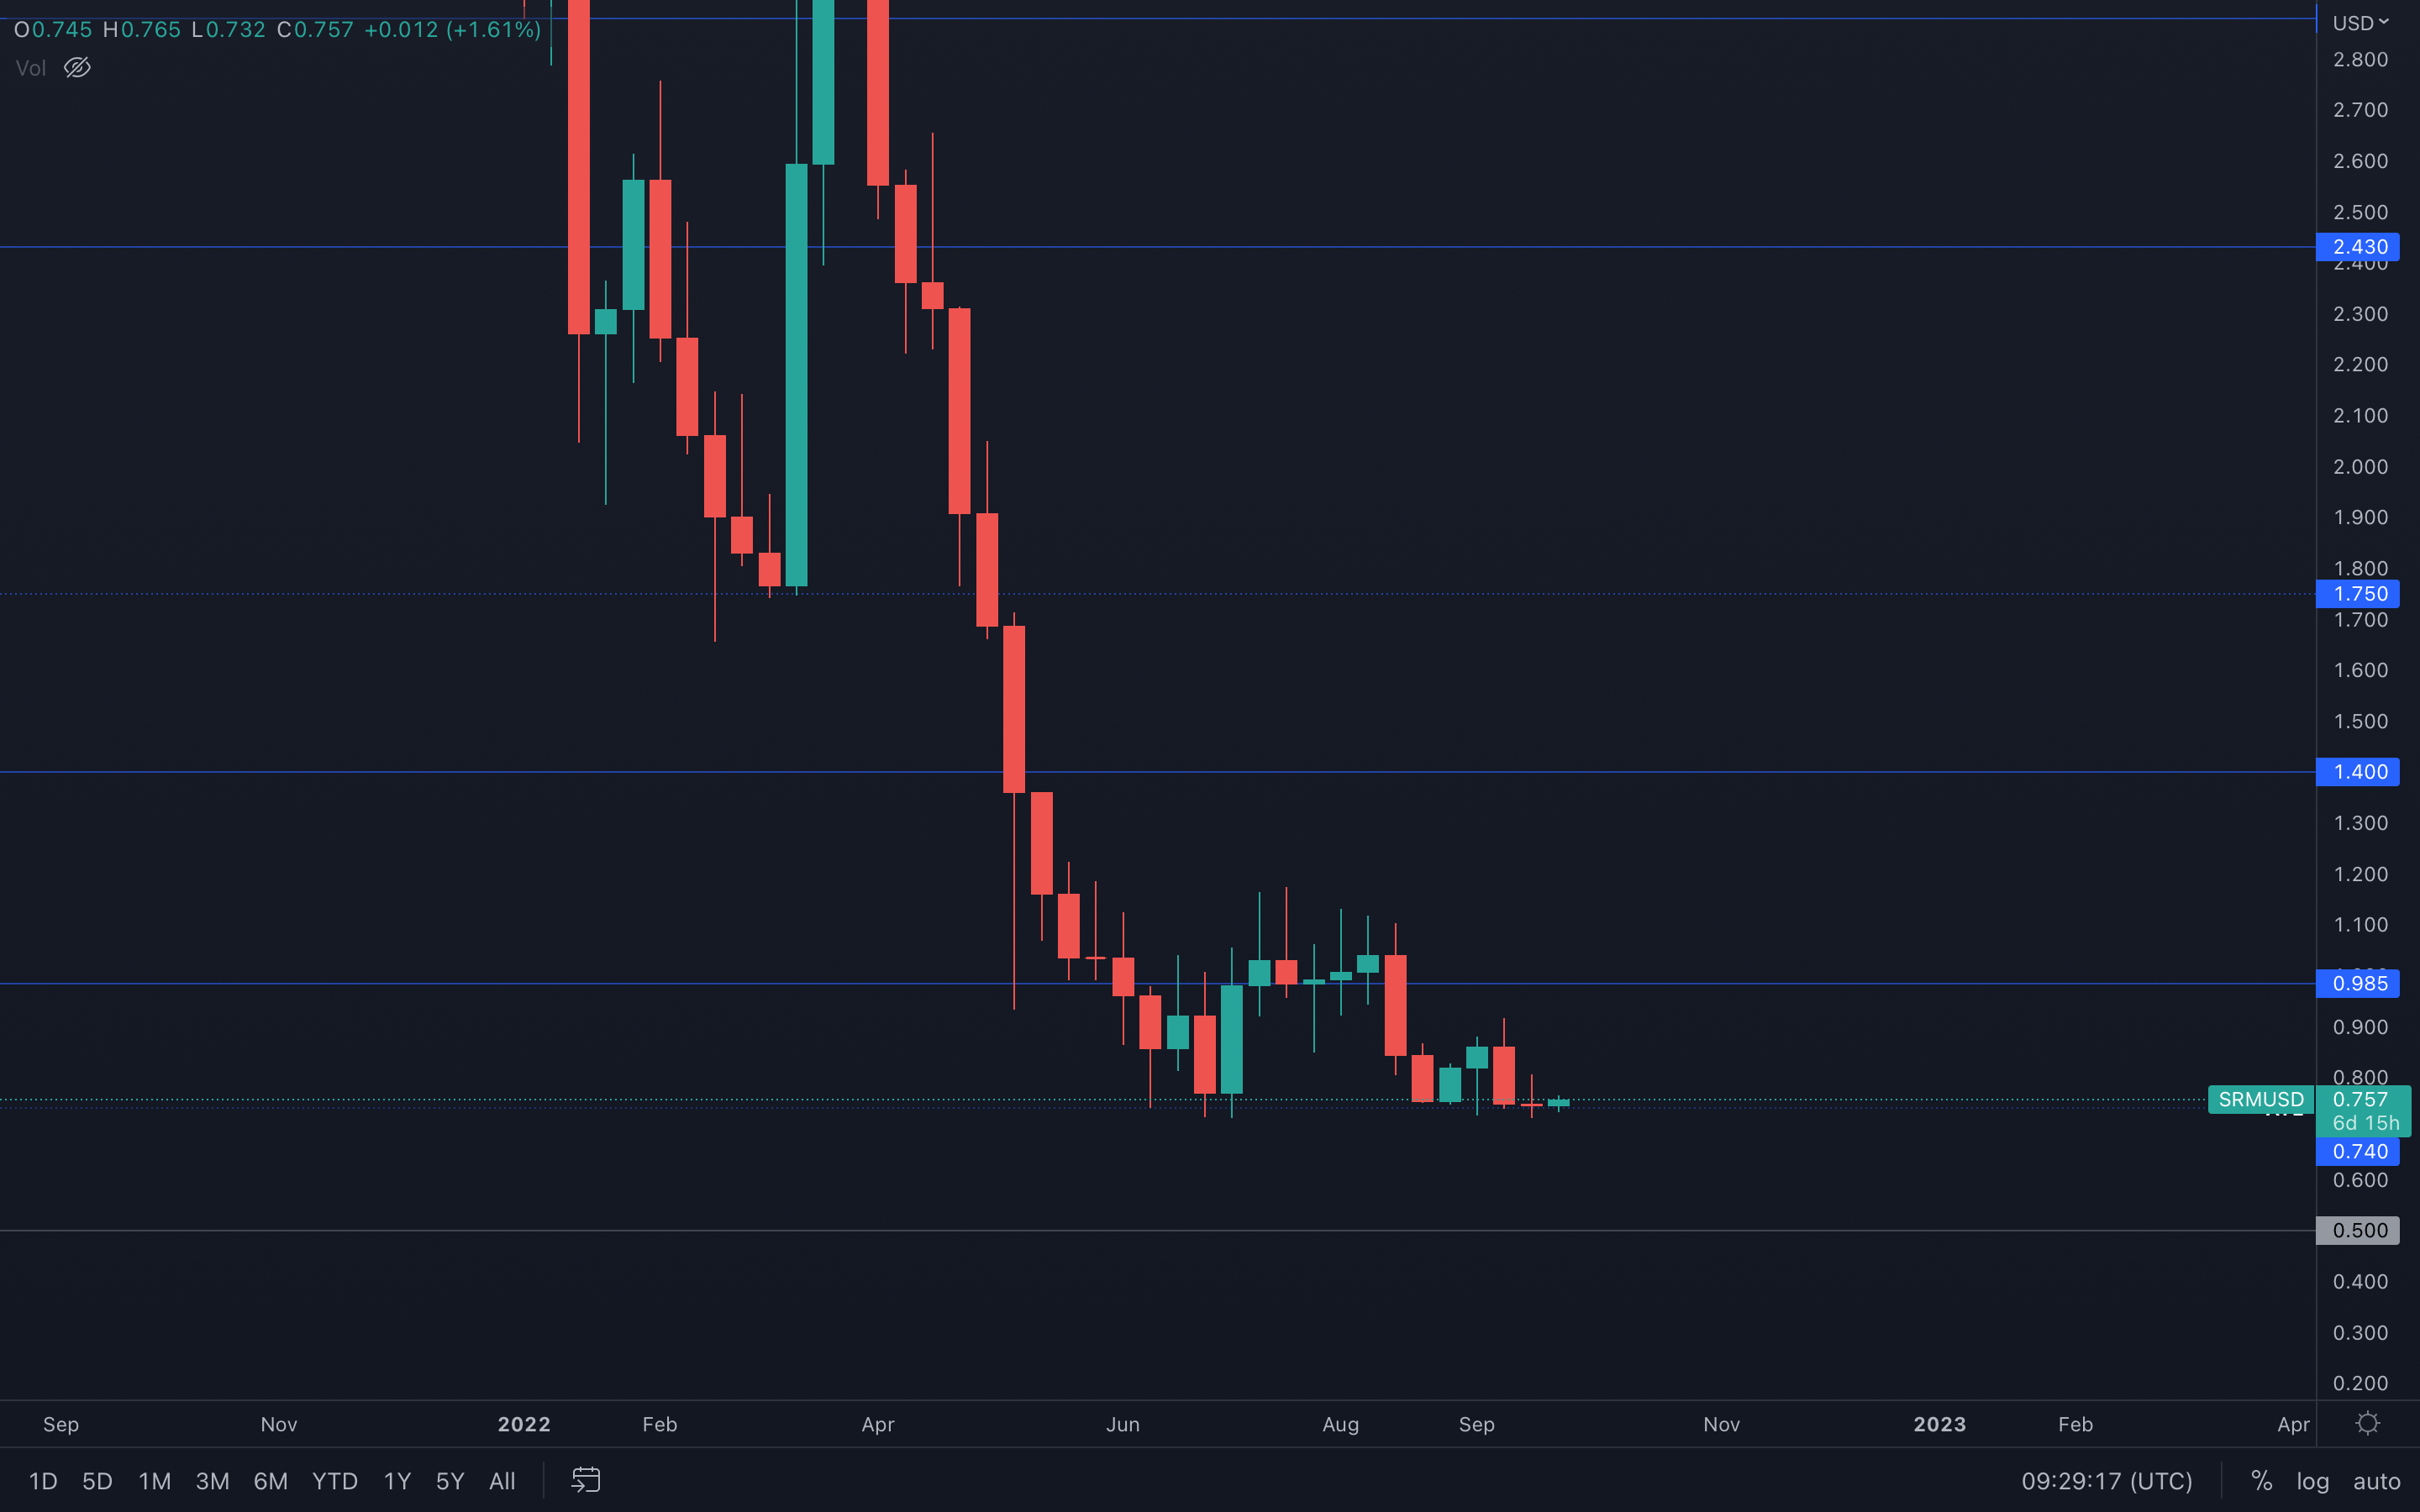 SRM is still battling with its all-time low after months of ranging above it, but we still cannot assume further downside unless this level is lost via a weekly closure under it.
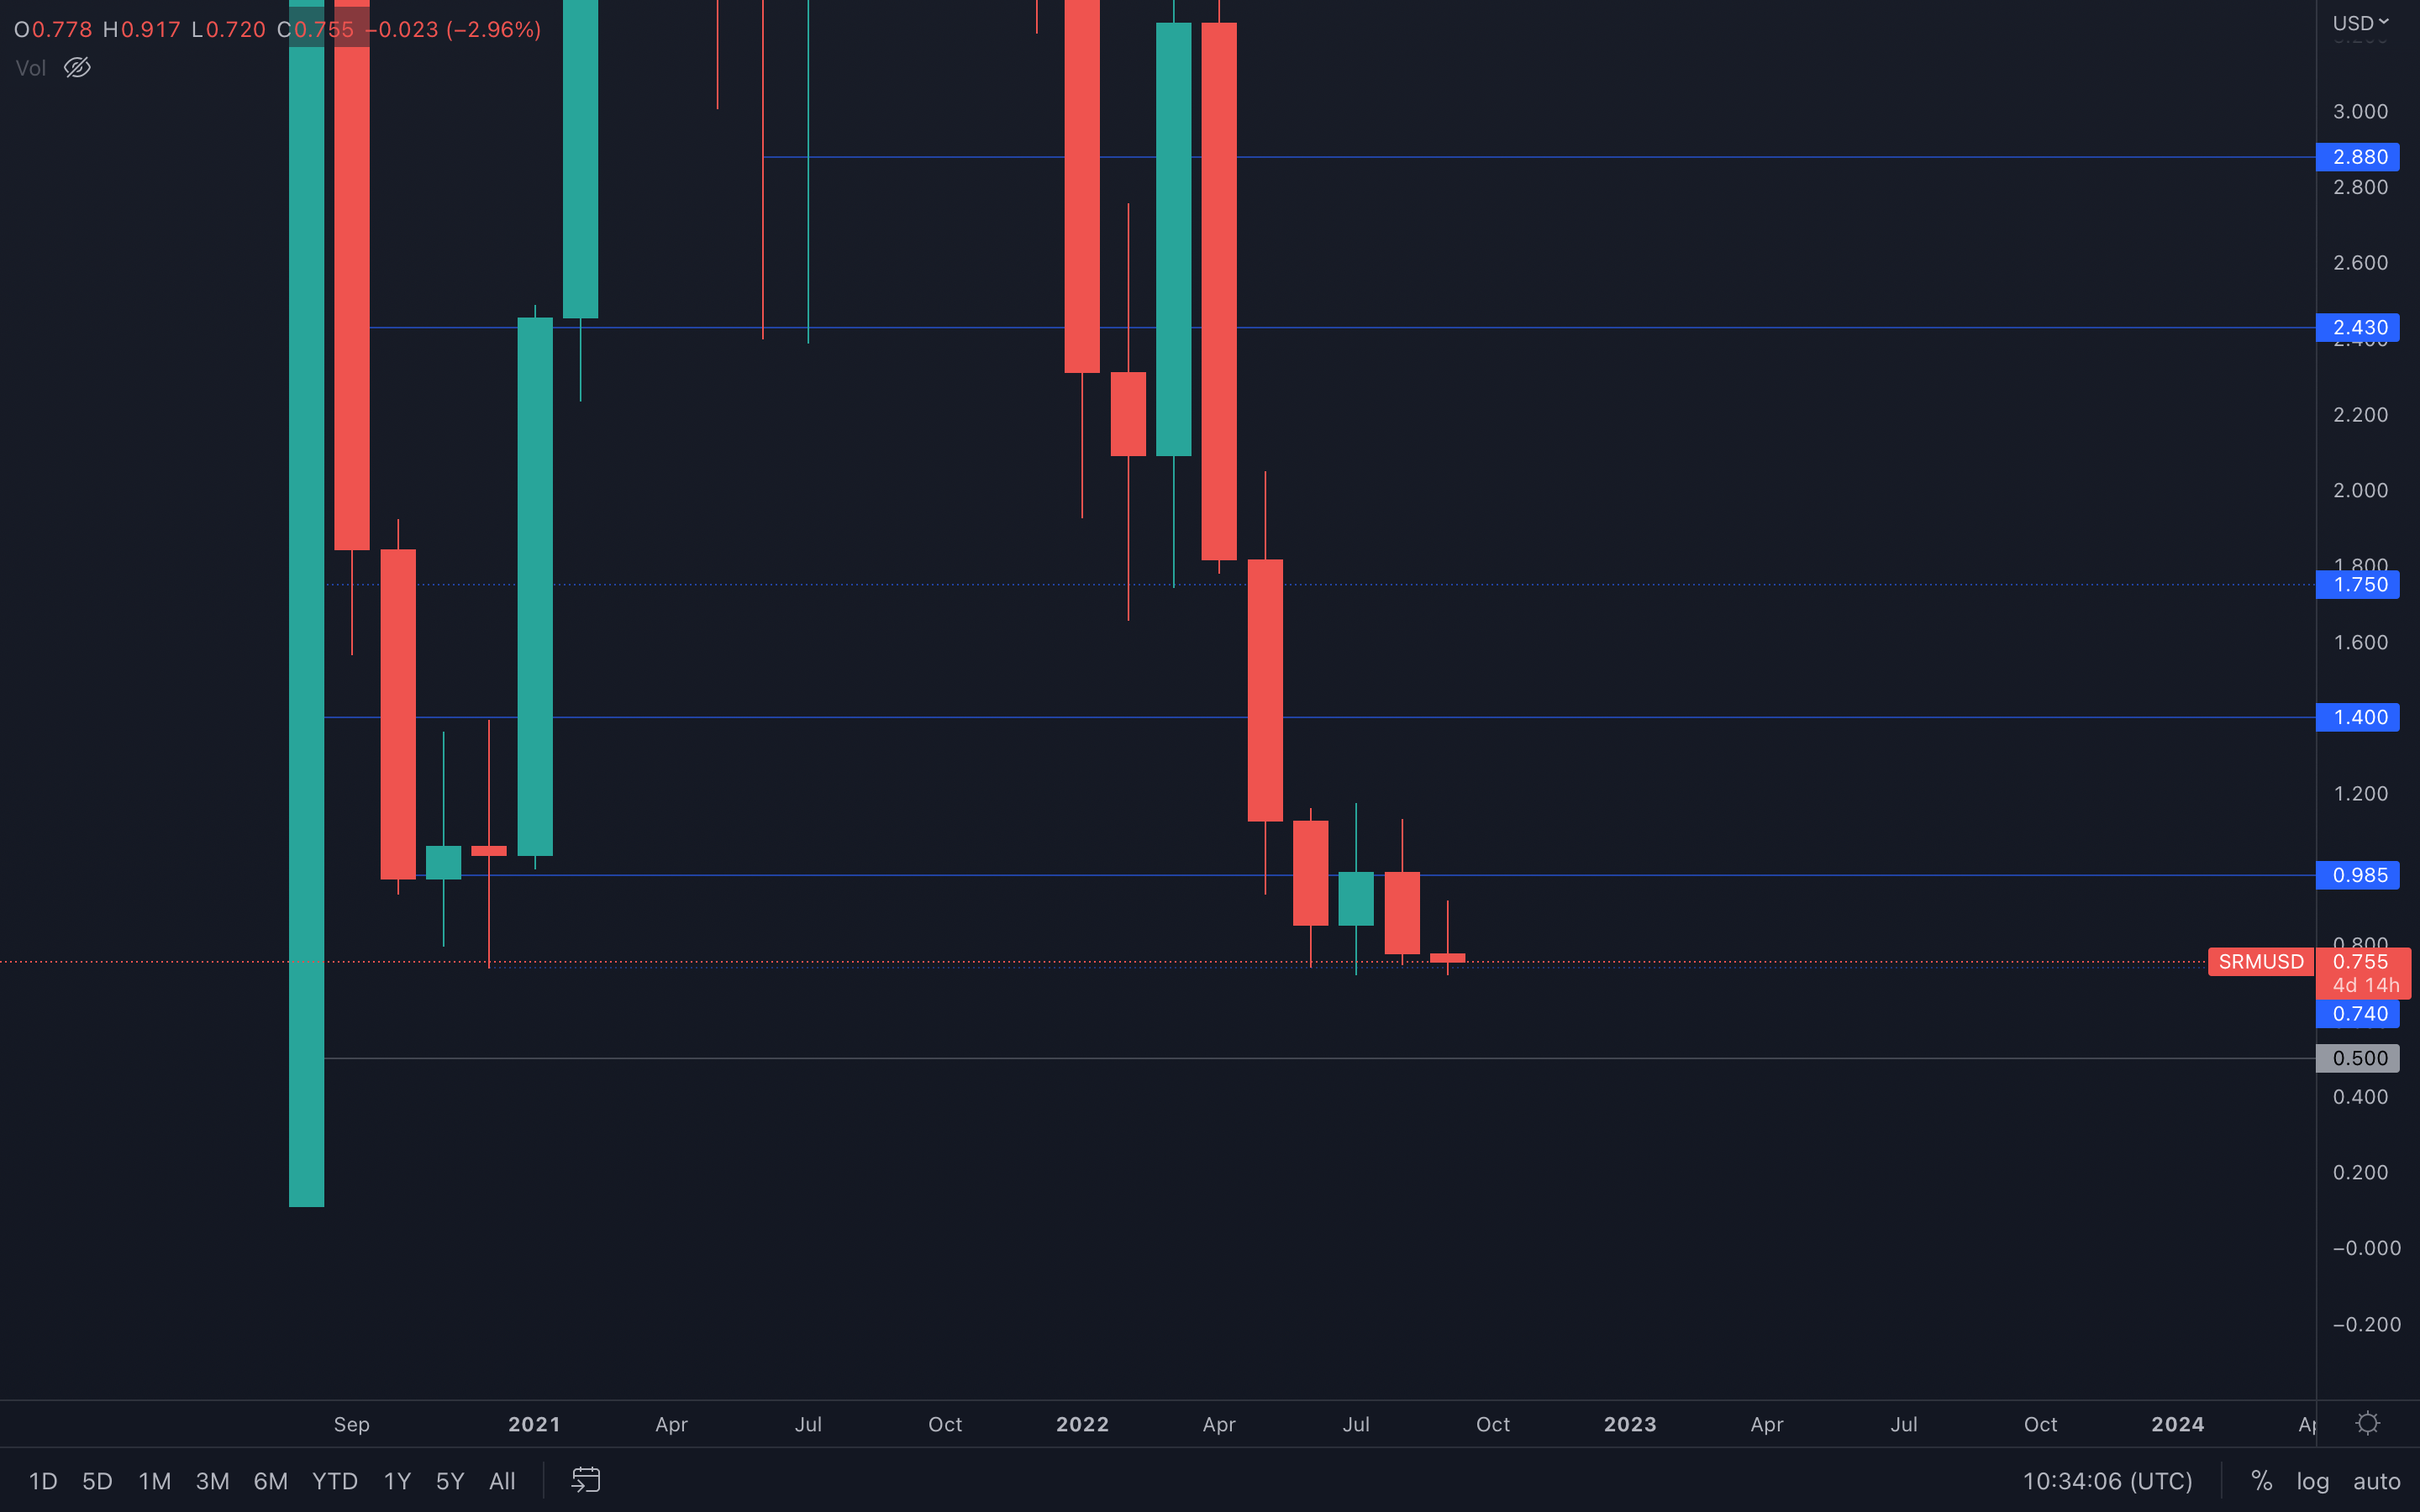
There is one thing to be noted here, and that is September closing even lower than previous months - this is a sign of weakness, uncertainty, and lack of buying pressure, which obviously leads to the idea that SRM will enter a downside price discovery in the next quarter. For context, we've added the monthly chart for SRM below:
SRM - Monthly timeframe
FTT
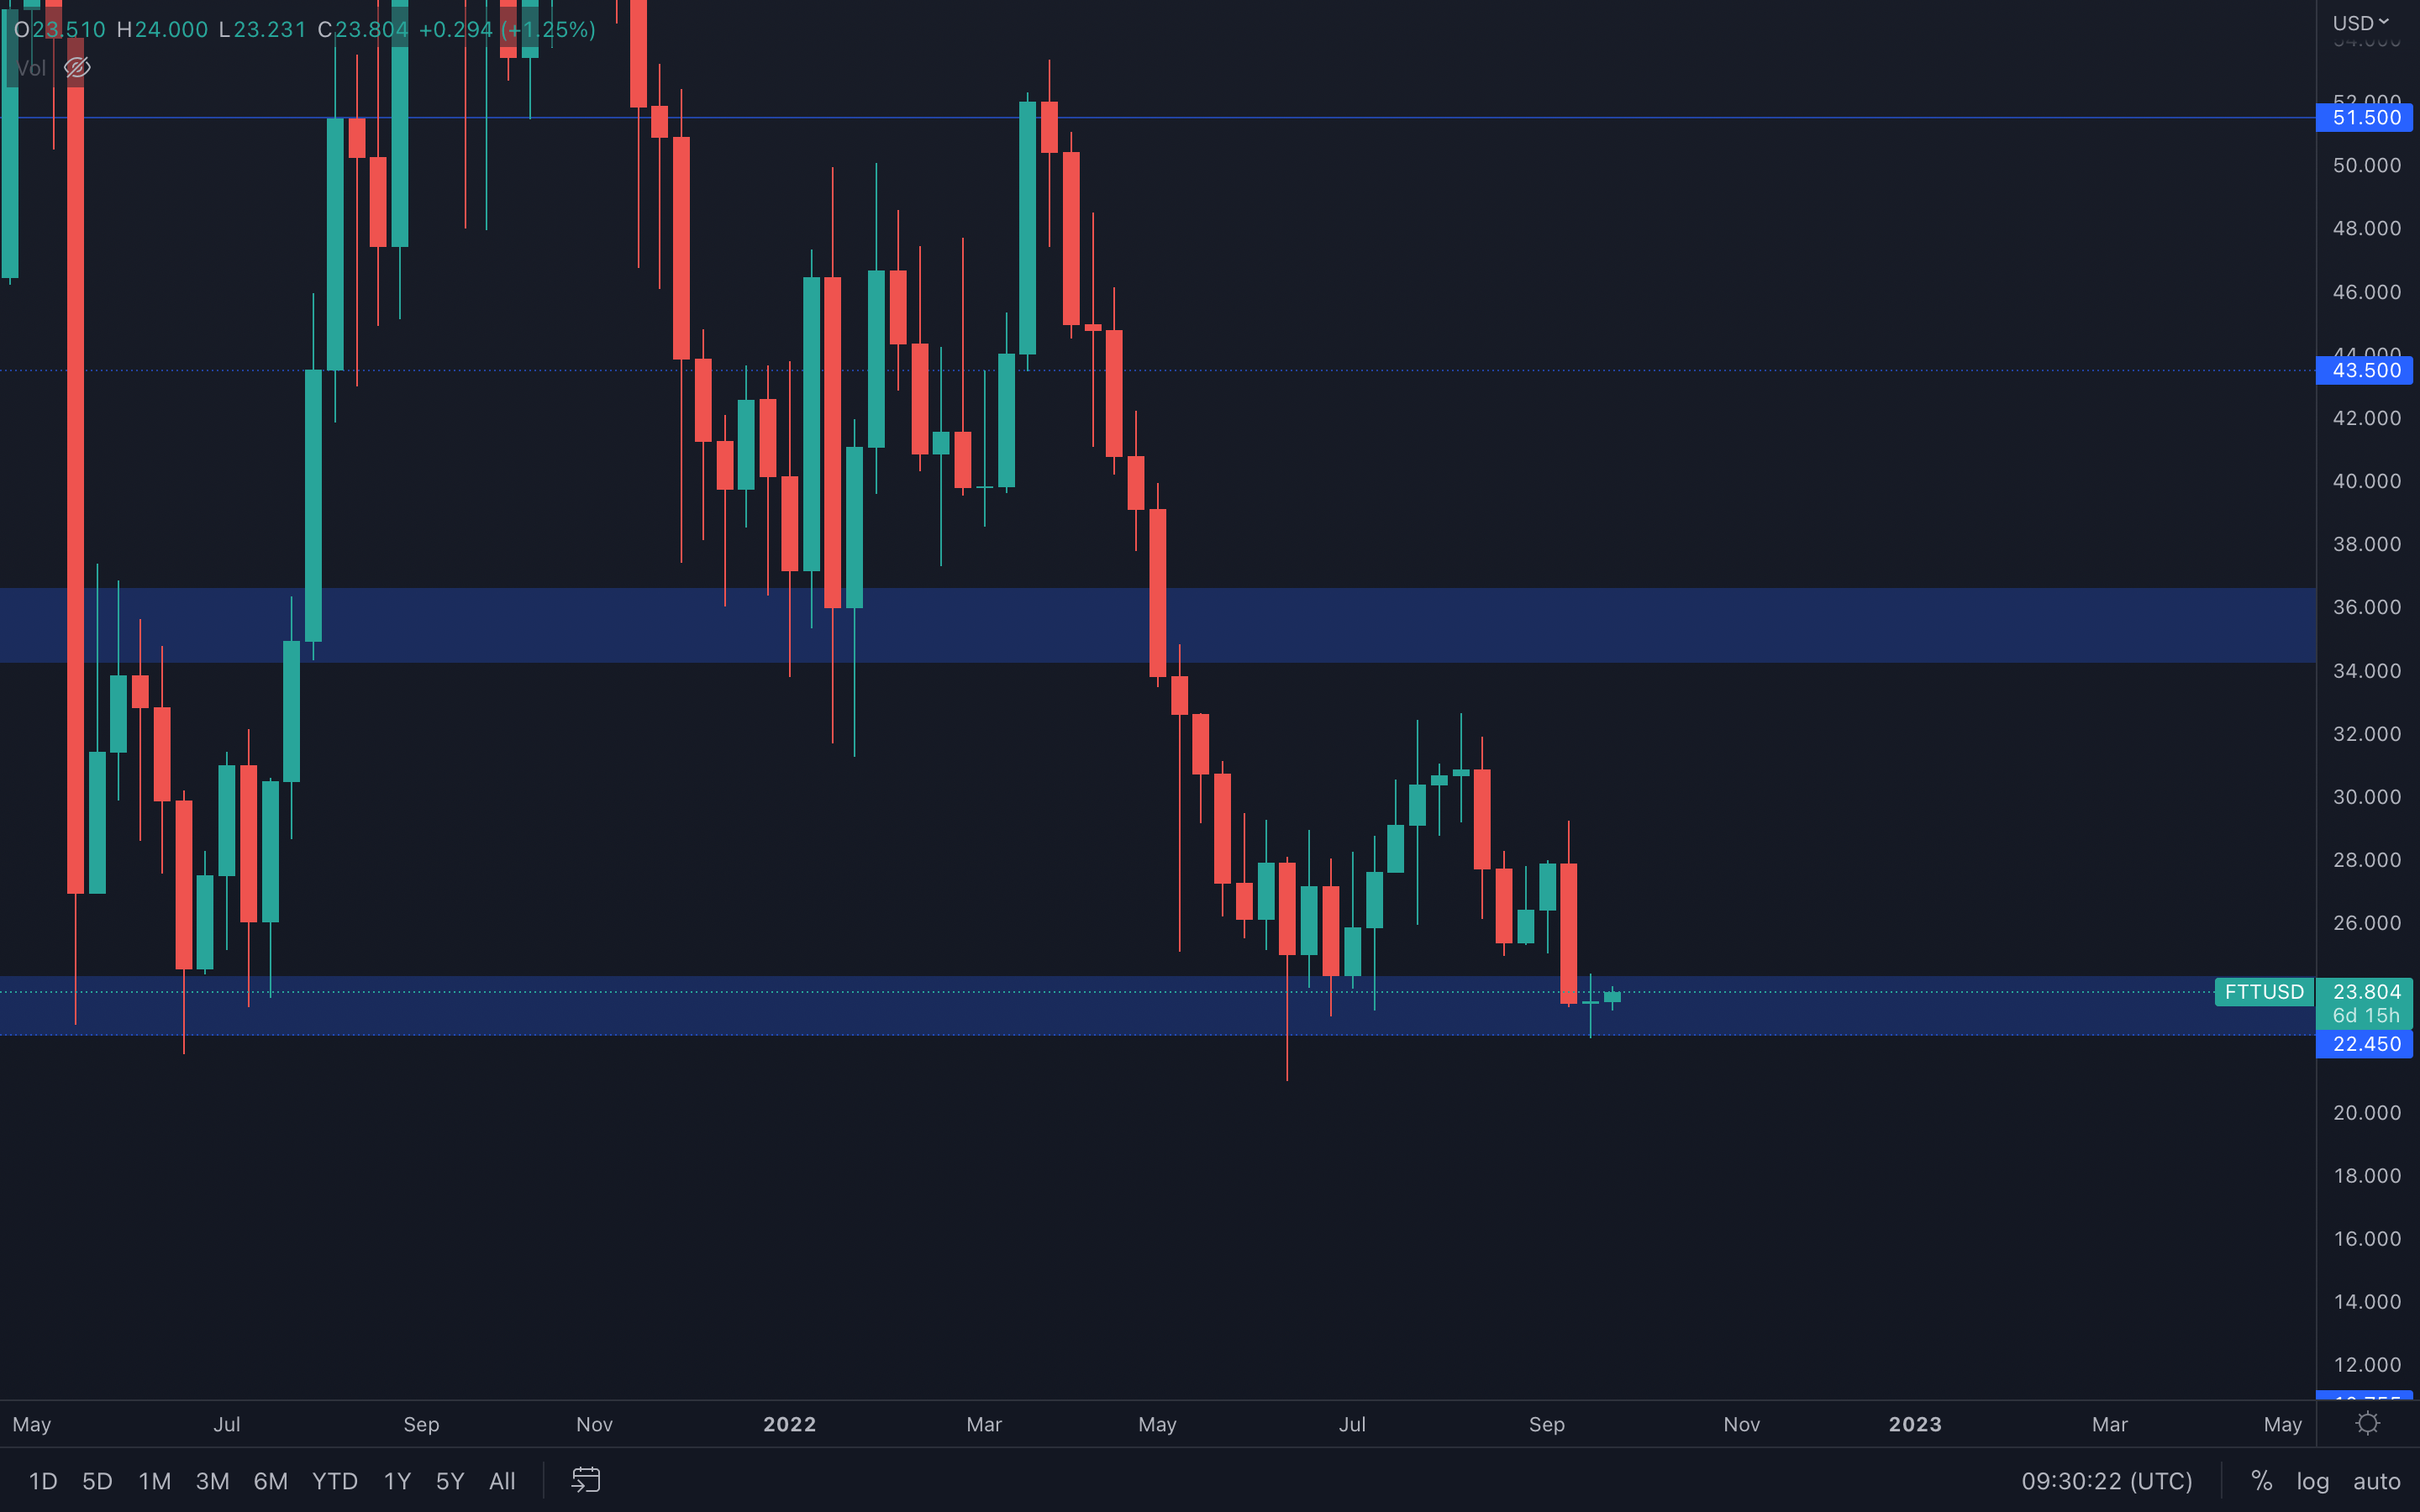 FTT is one of the few assets to actually close green last week, indicating a higher buying pressure compared to most assets in this list. Since FTT is still above a solid area of interest ($22.45 - $24), we can see some upside movement occur over the next few days.
However, we also cannot ignore that FTT has registered the lowest weekly candle closure since February 2021 two weeks ago - this is an obvious sign of weakness that can lead to lower prices, which is why we're going to take any potential upside movement with a grain of salt.
MINA
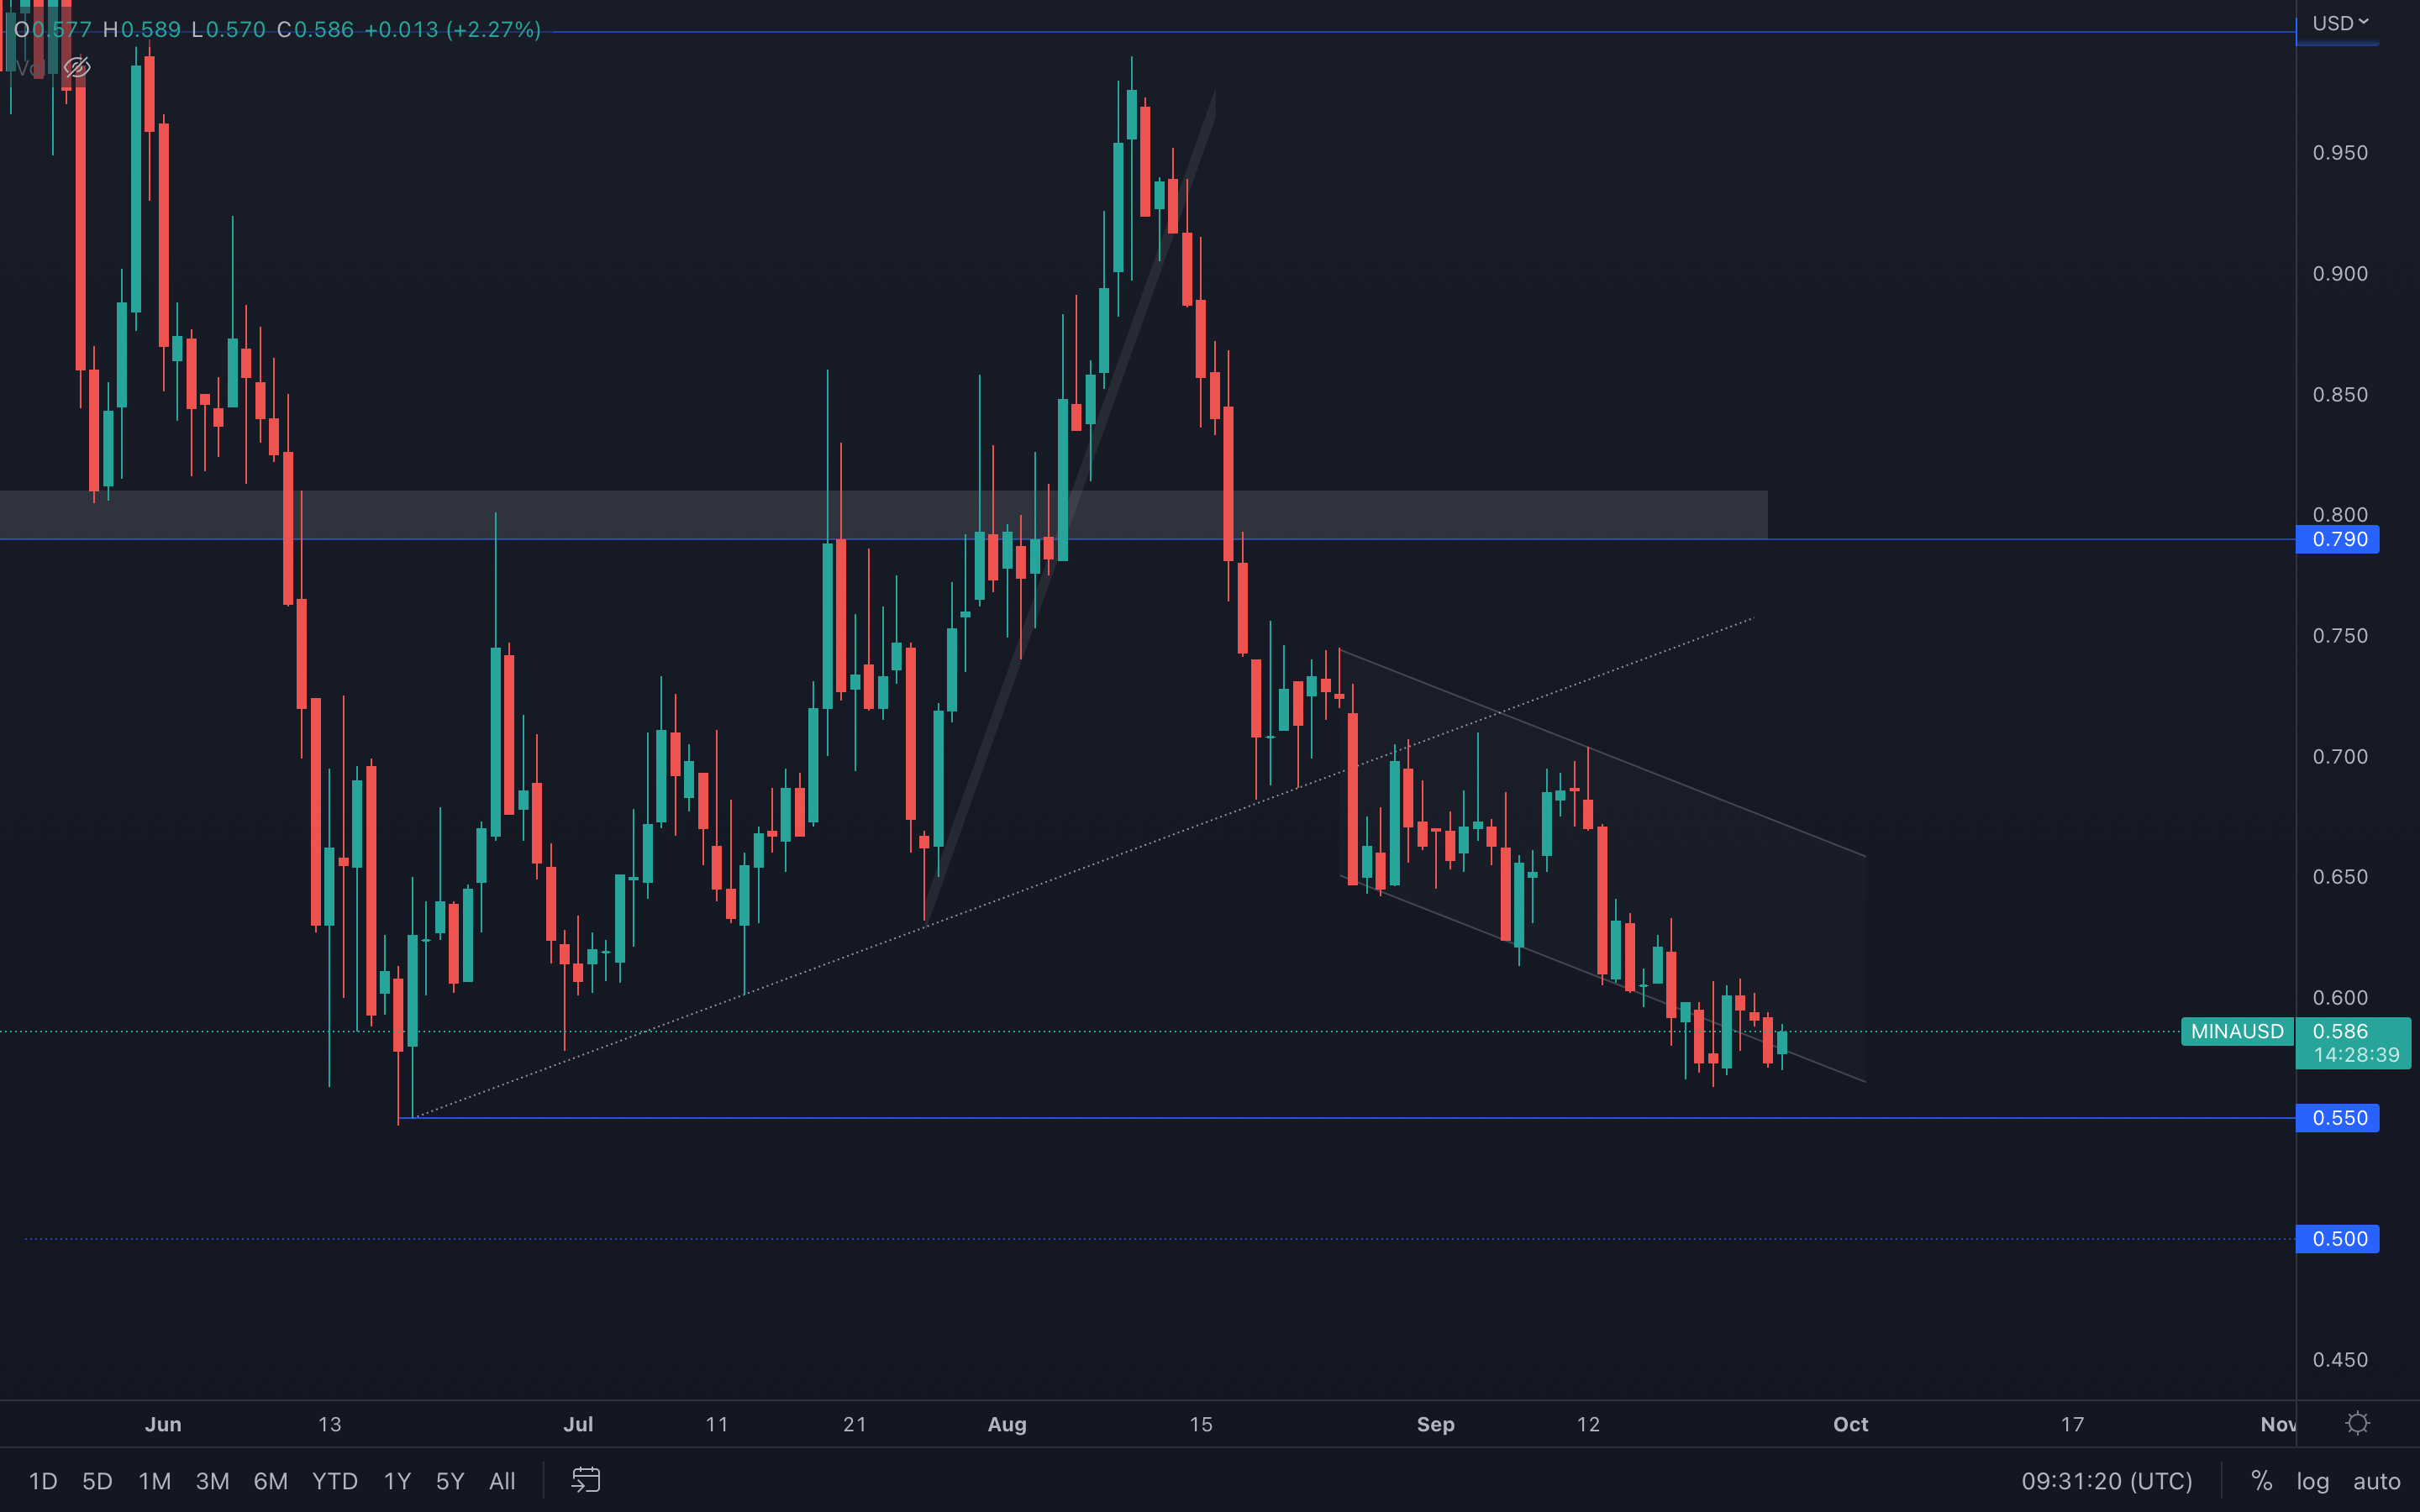 (Daily chart was used)
Still inside this descending channel, with no signs of upside movement occurring anytime soon. Even worse, we can see that due to the minuscule volume that MINA is experiencing, the asset cannot even test the top part of the channel. This aids in our expectation of a $0.55, respectively $0.50 support test in the near future.
dYdX
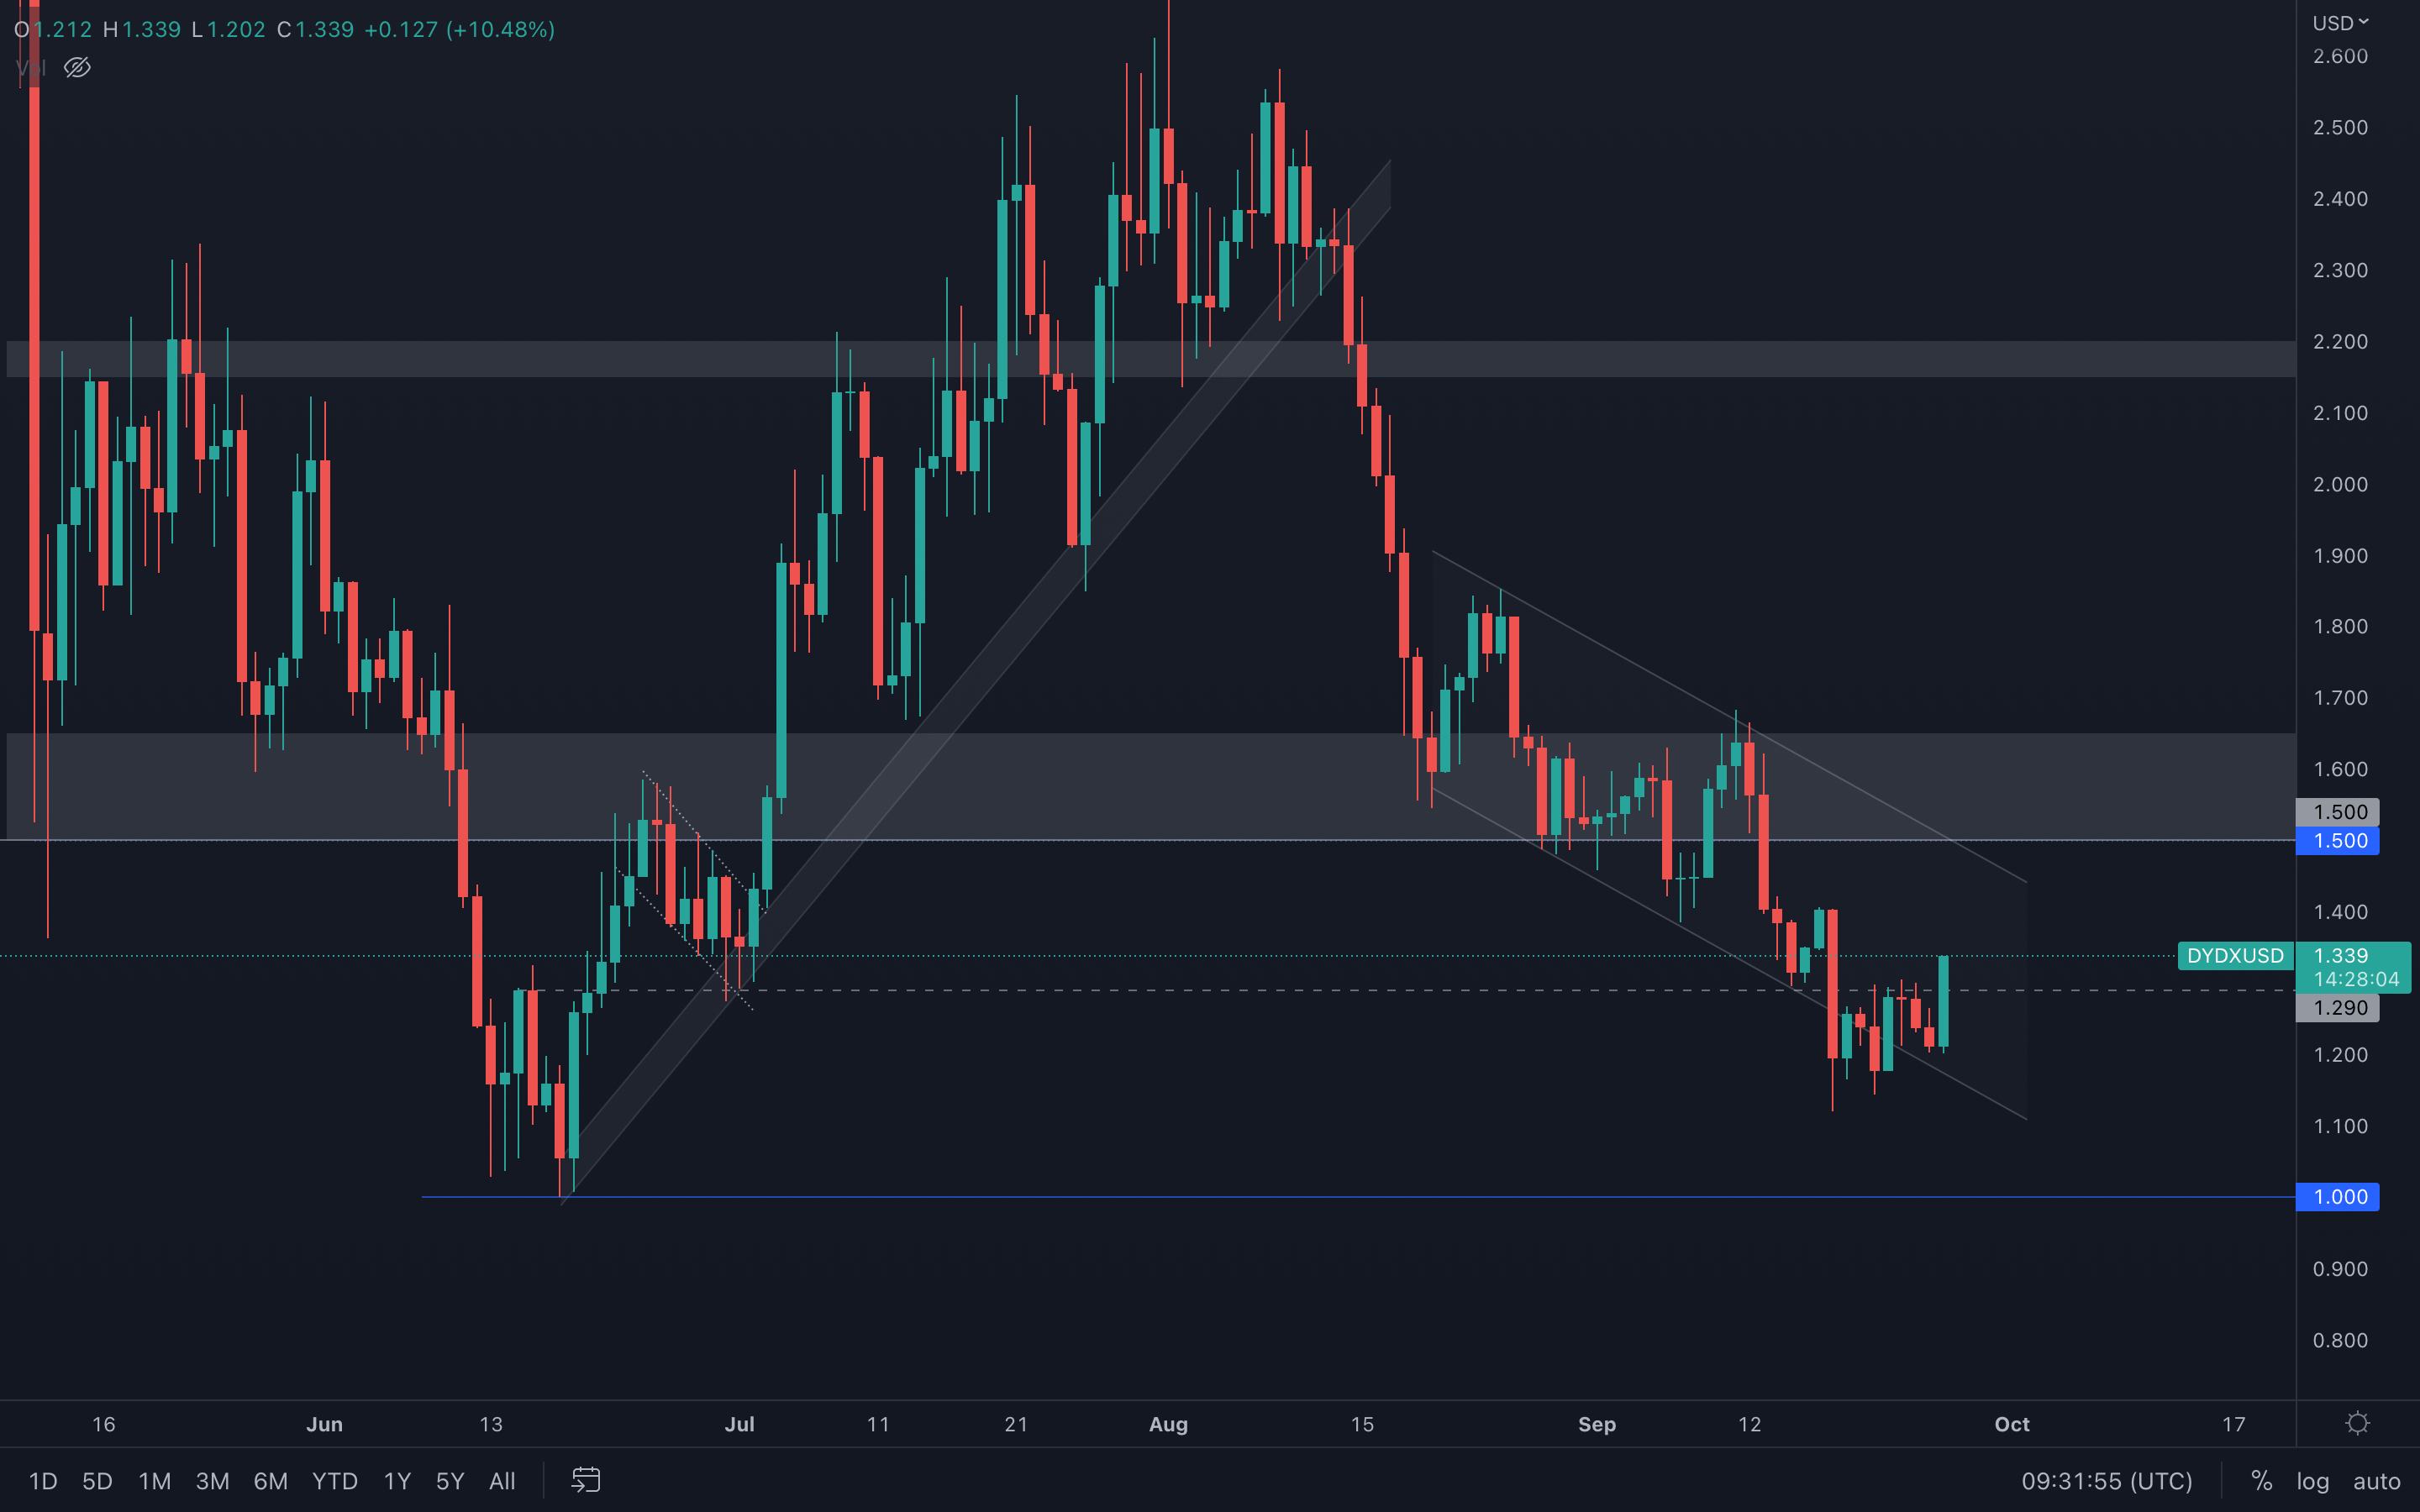 (Daily chart was used)
dYdX is experiencing strong buying pressure today, already breaking through the $1.29 support level, invalidating the move toward $1 that we were expecting and even mentioned in last week's report. If the asset manages to close today's candle above $1.29, then a $1.50 resistance test is on the cards.
Summary
If we put emphasis on the macro side, the metrics presented in this report all show that Bitcoin may be due to see some more downside even though it is currently in a ‘value’ territory. The macro environment continues to cause investors to remain hesitant in risking back-on and until the FED’s rate hike cycle is nearing its conclusion, it’s likely that investors will remain hesitant.However, with the rate hike cycle likely to be nearing its end point in the coming 2-4 months, it’s possible a crypto and Bitcoin macro bottom is formed in this timeframe.


