Save 23% ($351) & Get a Free 1-1 Call with our Team ⏰ : 0d 2h 59m 44s

Disclaimer: Not financial nor investment advice. You are responsible for any capital-related decisions you make, and only you are accountable for the results.
Macro
In this week’s macro updates, we see that there are two key events. The Mid-Term Election on Tuesday followed by the CPI (Inflation) data on Thursday.It is expected that the Democrats will lose either the House or the Senate, which will make it trickier for proposals to be passed. On Thursday, the CPI (inflation) data will be released. It is expected to show that Core Inflation YoY will have increased from 6.6% to 6.7% with MoM increasing from 0.6% to 0.7%. This is the opposite of what the FED wants to be seeing and likely means the FED will continue with their hawkish narrative of rates ‘higher and for longer’. However, it is important to note that there is another set of inflation and jobs data to come out before the next FOMC in December.
TLDR
- The key macro events this week are the mid-term elections and the release of the CPI data which is expected to come in higher than last month.
- New Addresses has spiked higher whilst Active Addresses is still lagging behind, although this is normal to see.
- The largest Bitcoin wallet cohort has seen an increase in the number of wallets over the last 24hrs from 108 to 119 wallets – a large increase in risk appetite.
- The Bitcoin Yardstick (introduced by Charles Edwards), shows that Bitcoin is extremely cheap.
- The Realised Price of $21,200 is continuing to act as a resistance point for Bitcoin.
- The Accumulation Trend Score is showing similar signs to the bottom that formed in late 2018/early 2019.
DXY (U.S. Dollar Index)
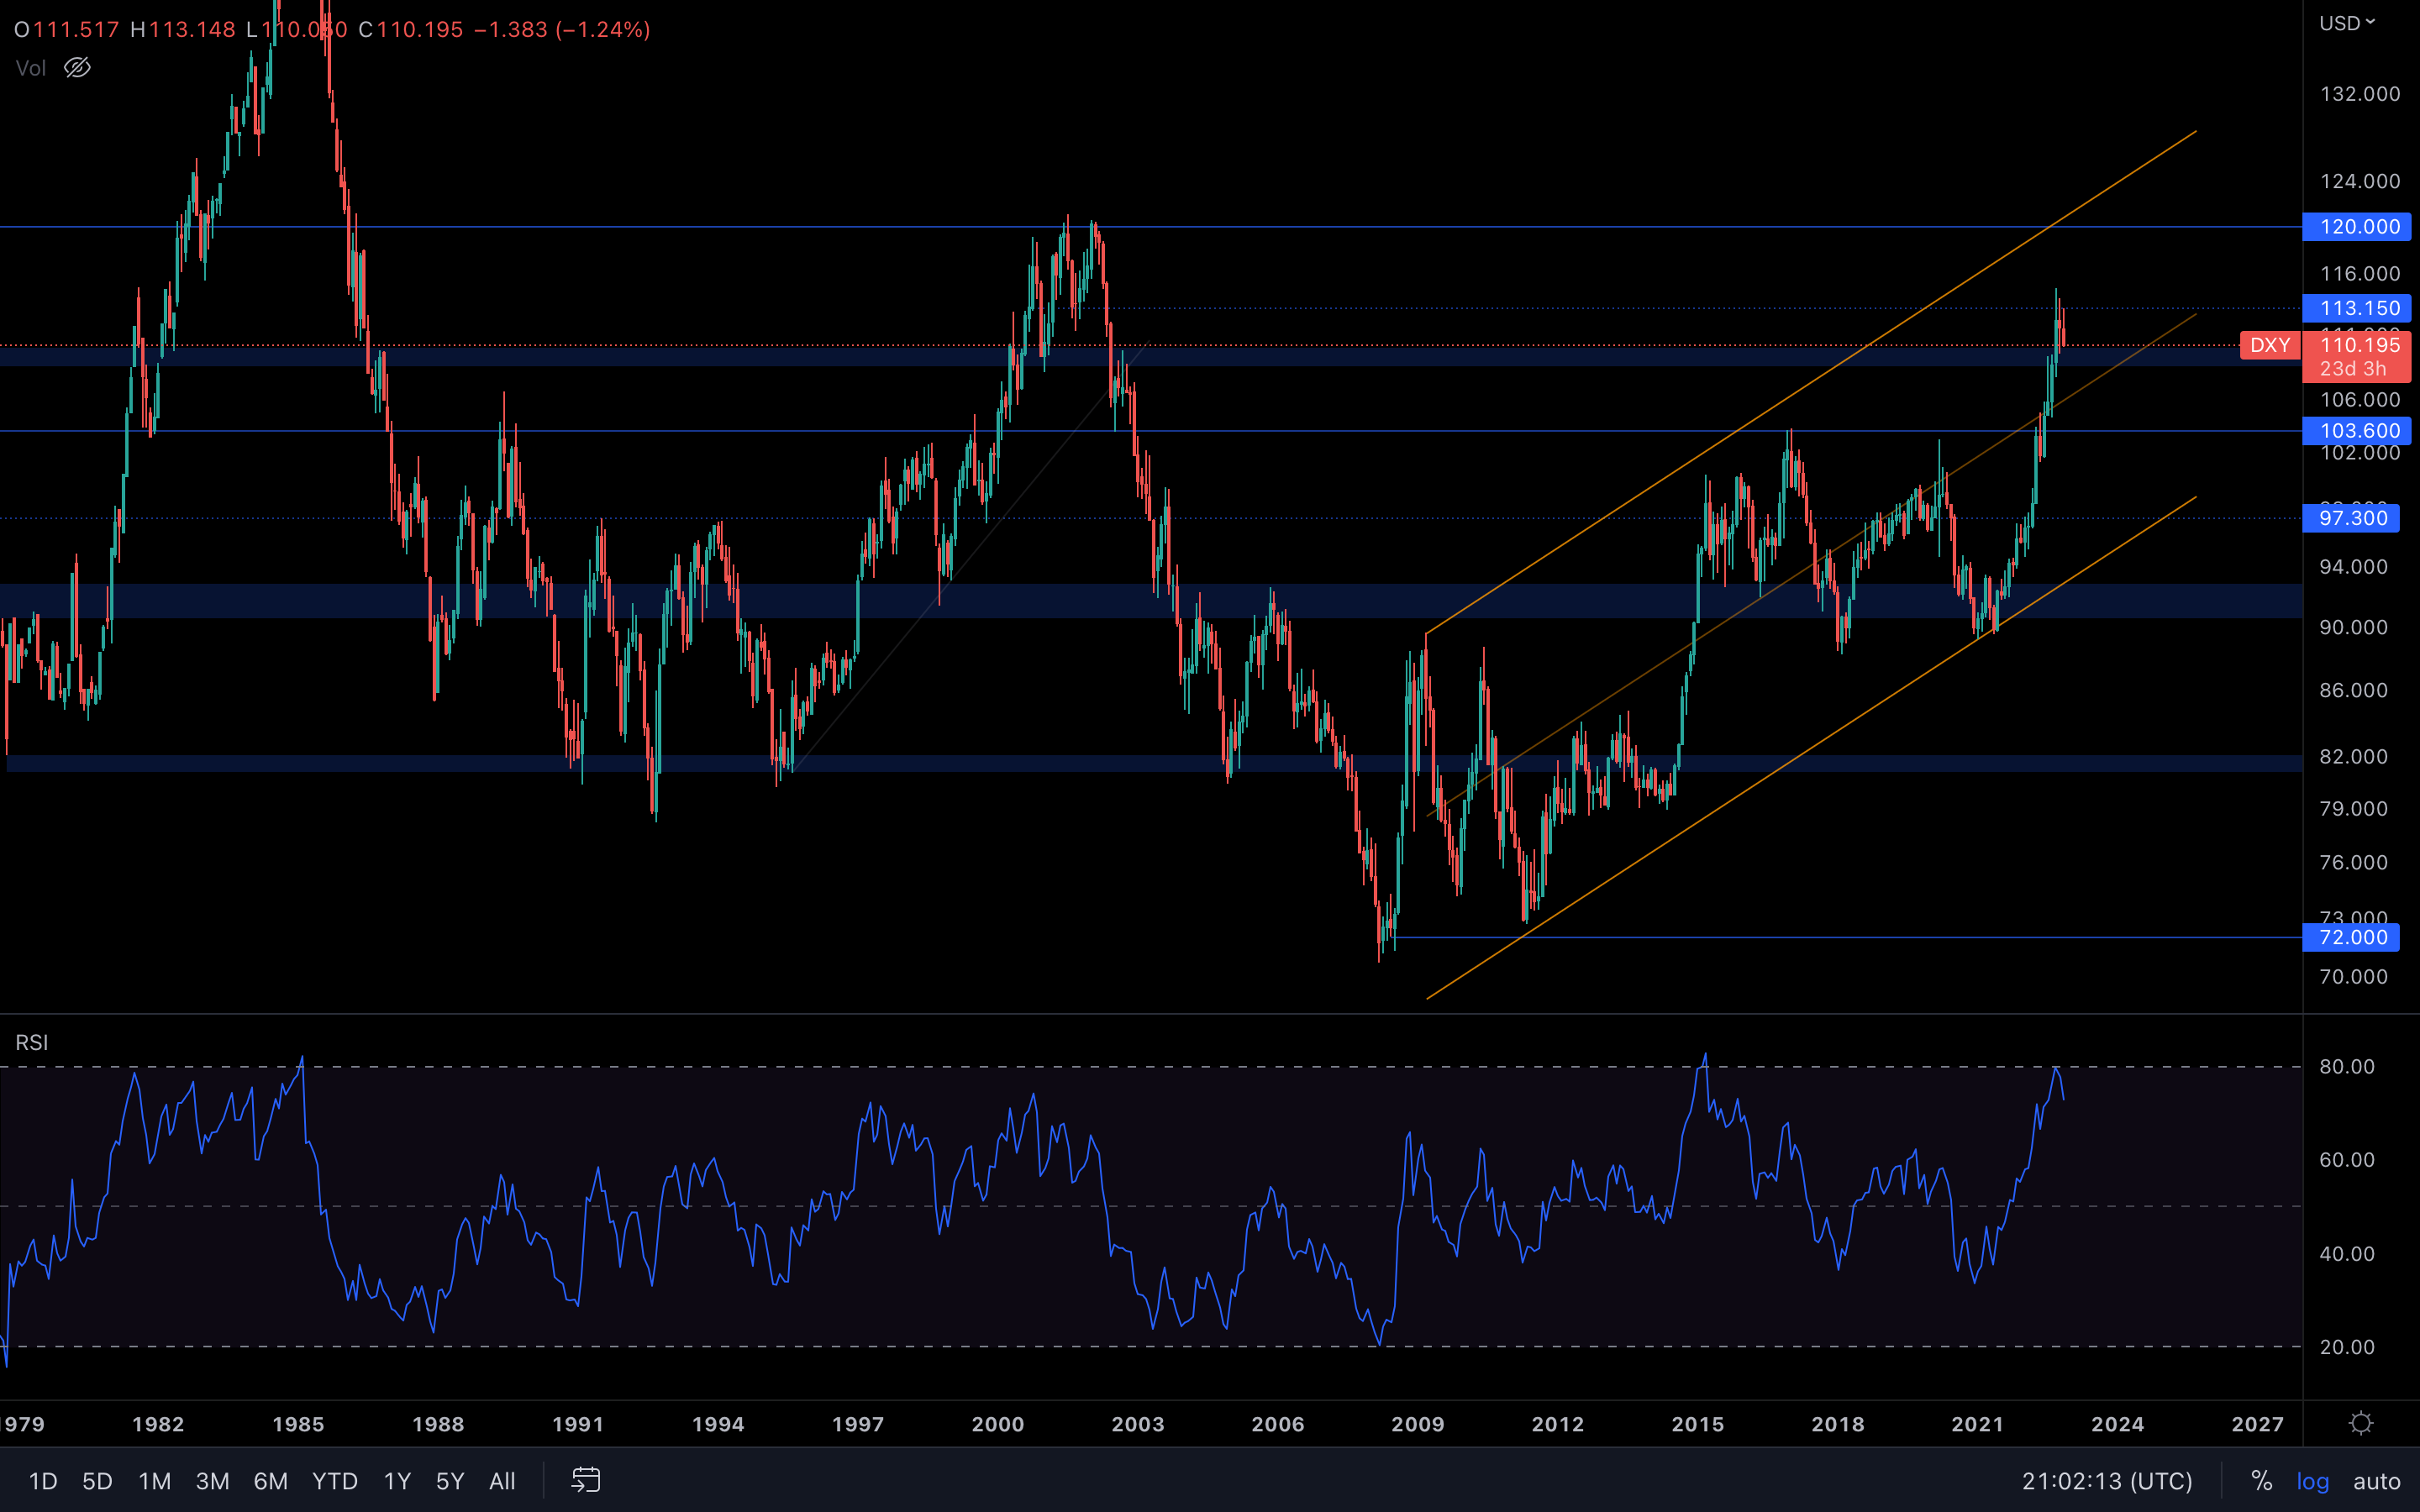 What you can see above is the monthly timeframe for the U.S. Dollar Index. The reason we chose this timeframe specifically is to show how the RSI (Relative Strength Index) has behaved in the past after reaching the 80 mark. Historically, the index has always peaked after reaching the 80 mark (which means the asset is oversold), starting to descend after.
However, there's no telling how long the index can range at the 80 mark. We could be looking at multiple months of ranging or even years. In any case, we can assume the index has peaked at $114 because the RSI has reached its 80 mark. Higher prices can follow, but for now, the index will likely descend - this is healthy for the crypto market.
S&P 500 Index
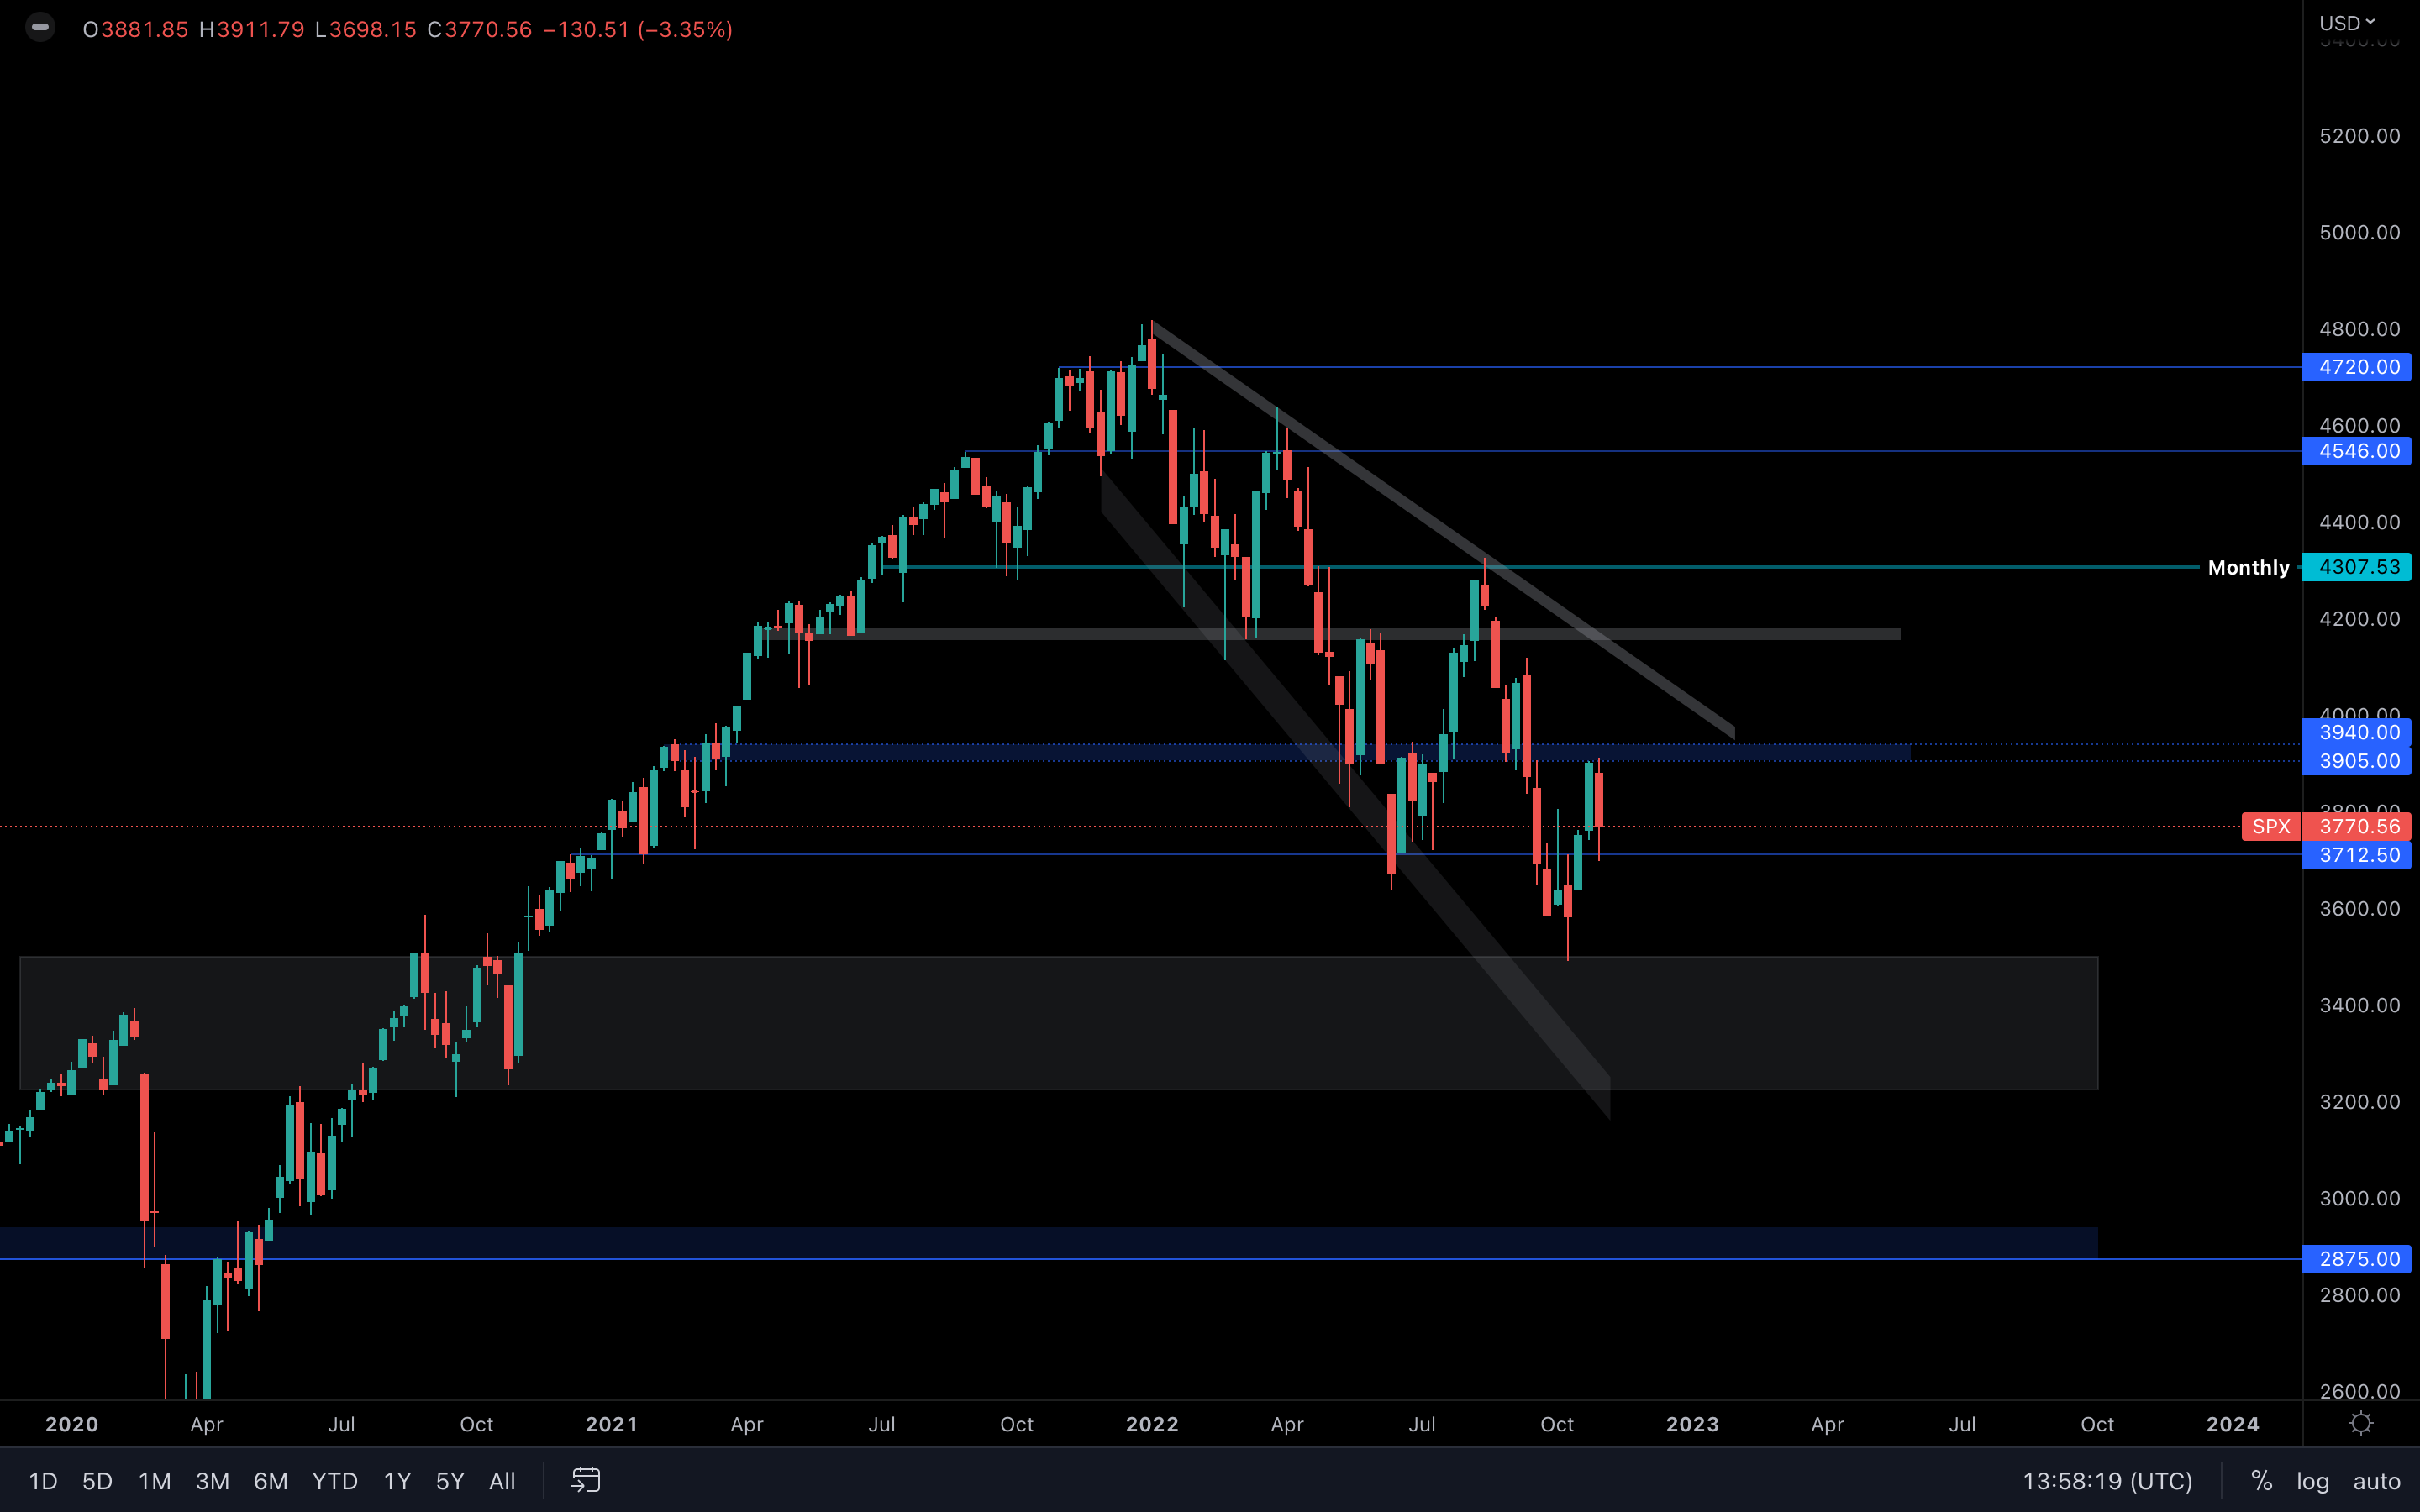 The index is having difficulty breaking above $3900. As a result, we've now retested $3700 as support and will likely experience a higher push toward $4000 in the coming weeks. In order for this to happen, $3900 needs to be taken out.
Total Market Cap
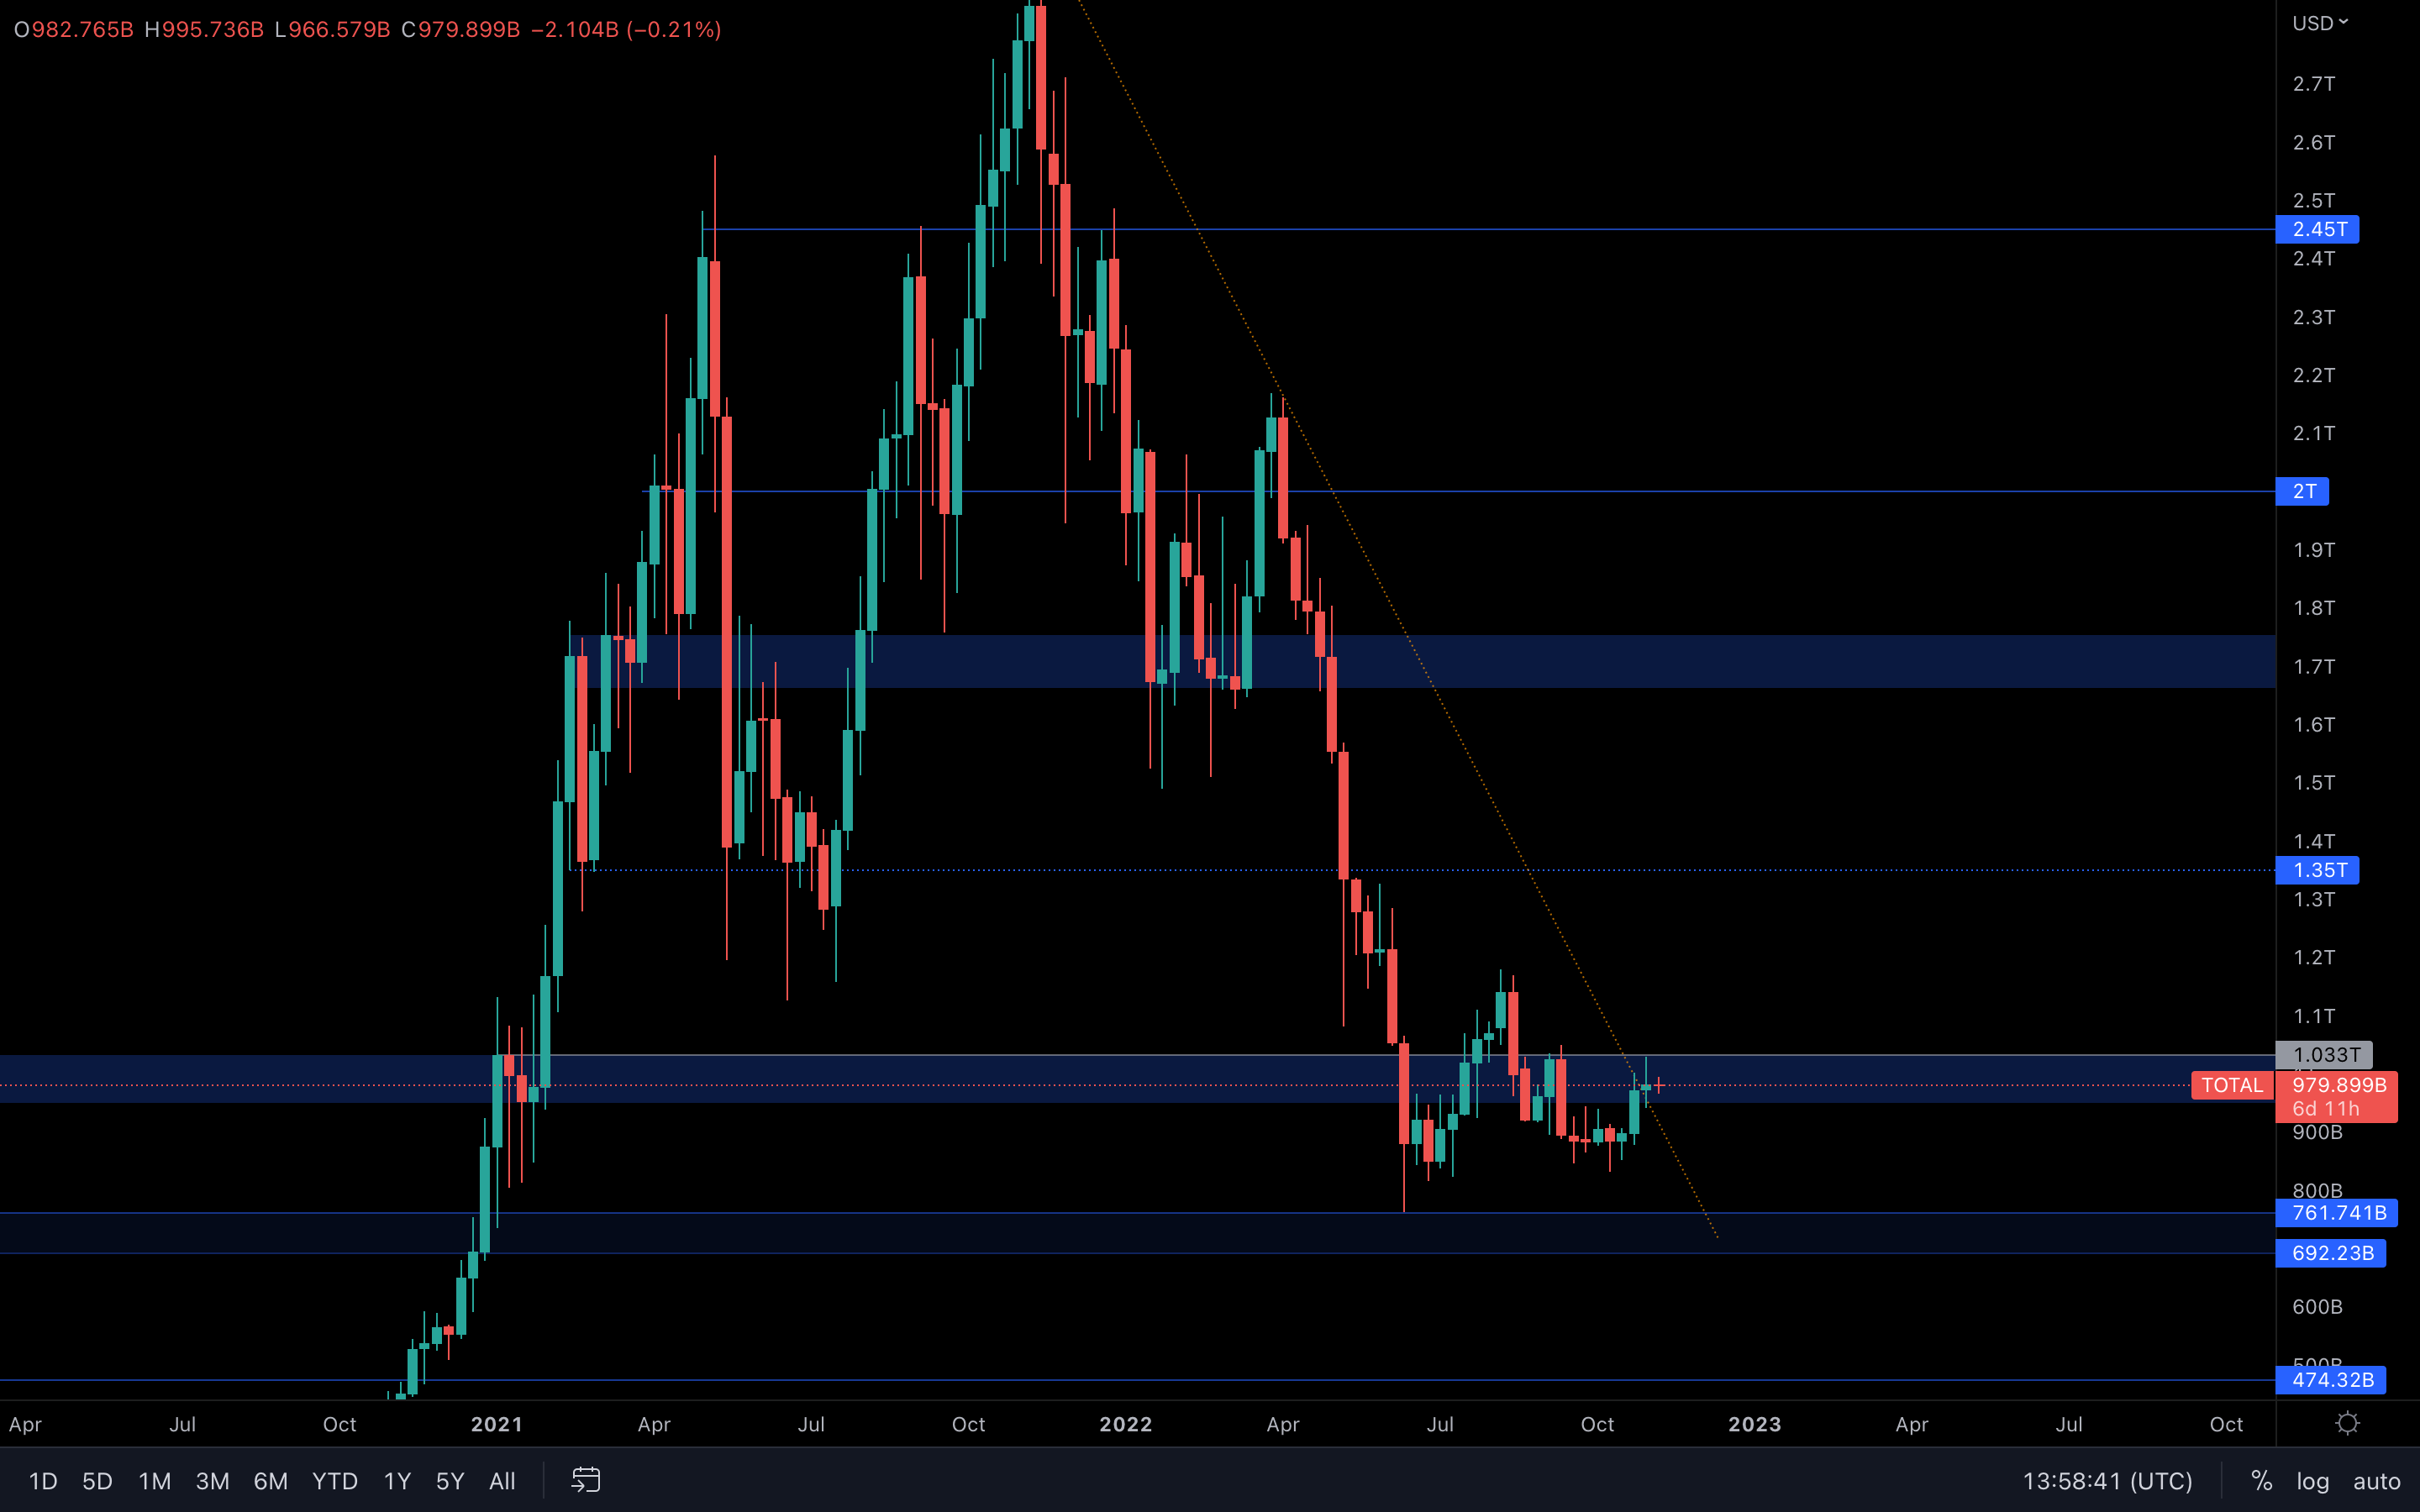 The Total Market Cap index has closed above this 1-year-old resistance and is now sitting inside a weekly range between $950B and $1.03T. With the way the market is currently looking, $1.03T will be tested again soon, most likely followed by a break above that level.
Altcoins Market Cap
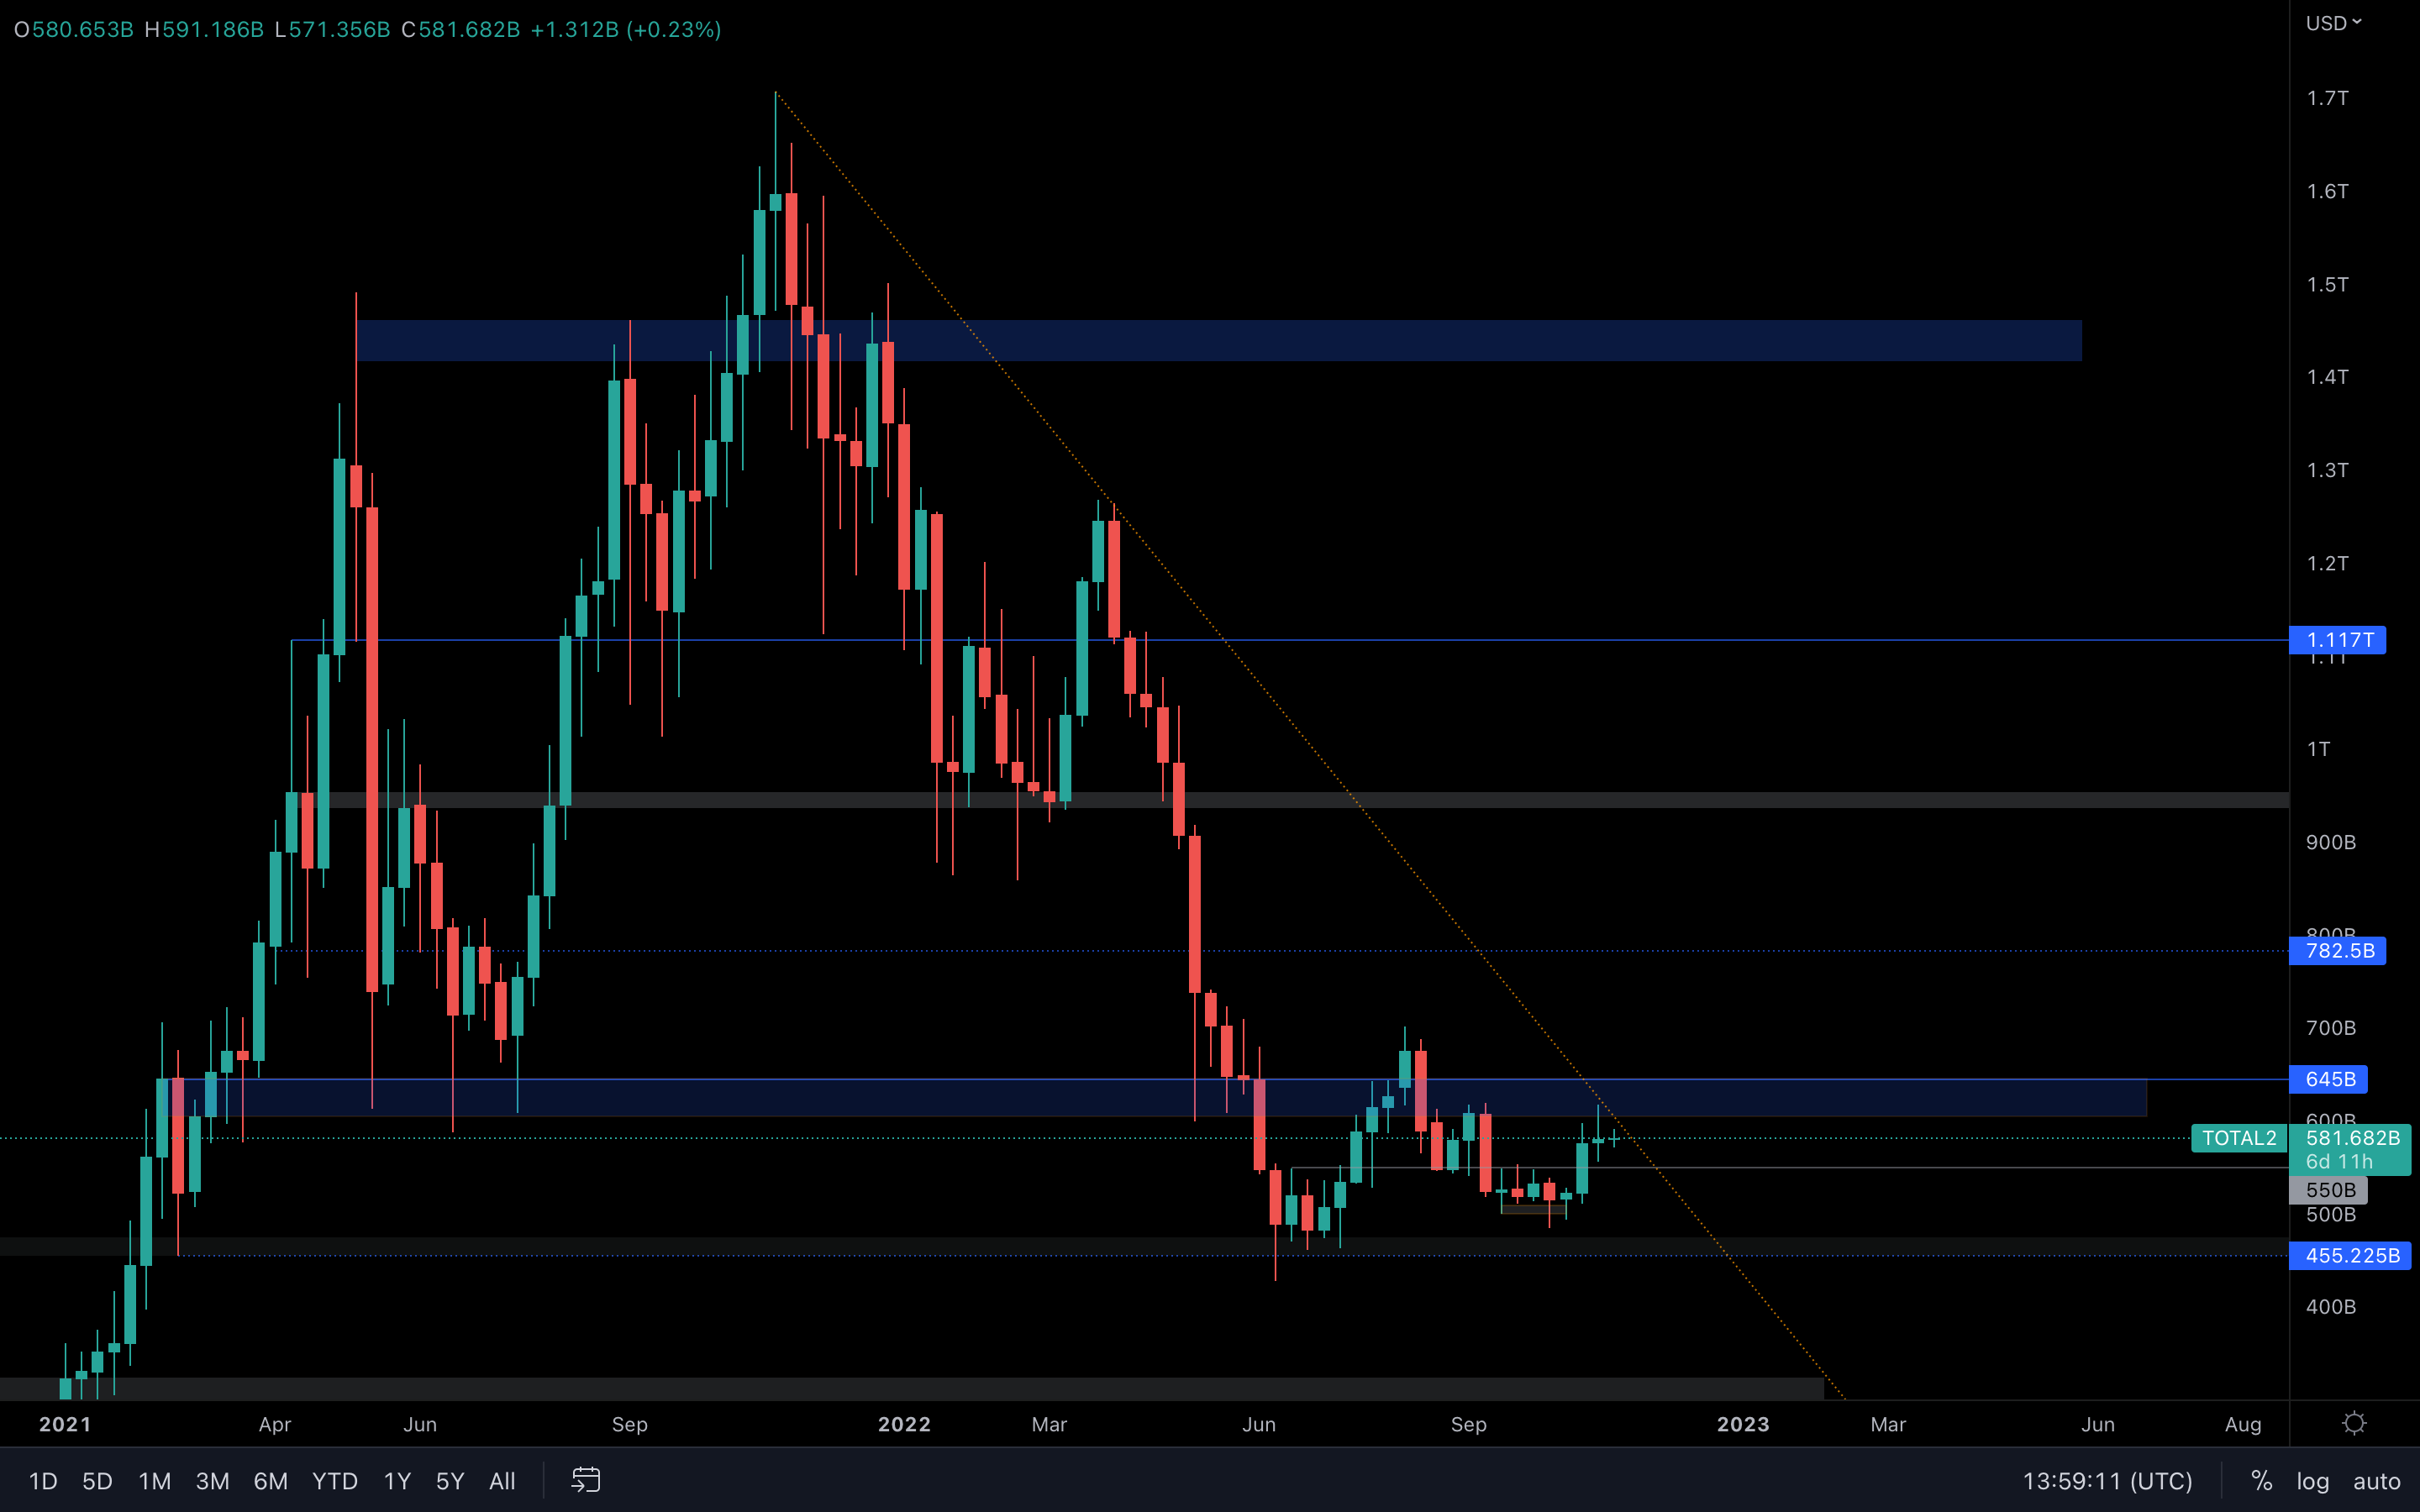 There is now a difference between the two major indexes - the Altcoins Market Cap hasn't broken its current resistance. However, with the Total MCap showing bullish signs over the coming weeks, the Altcoins MCap is due to follow. Expect a break above the current resistance soon.
Bitcoin - Technical & On-Chain Analysis
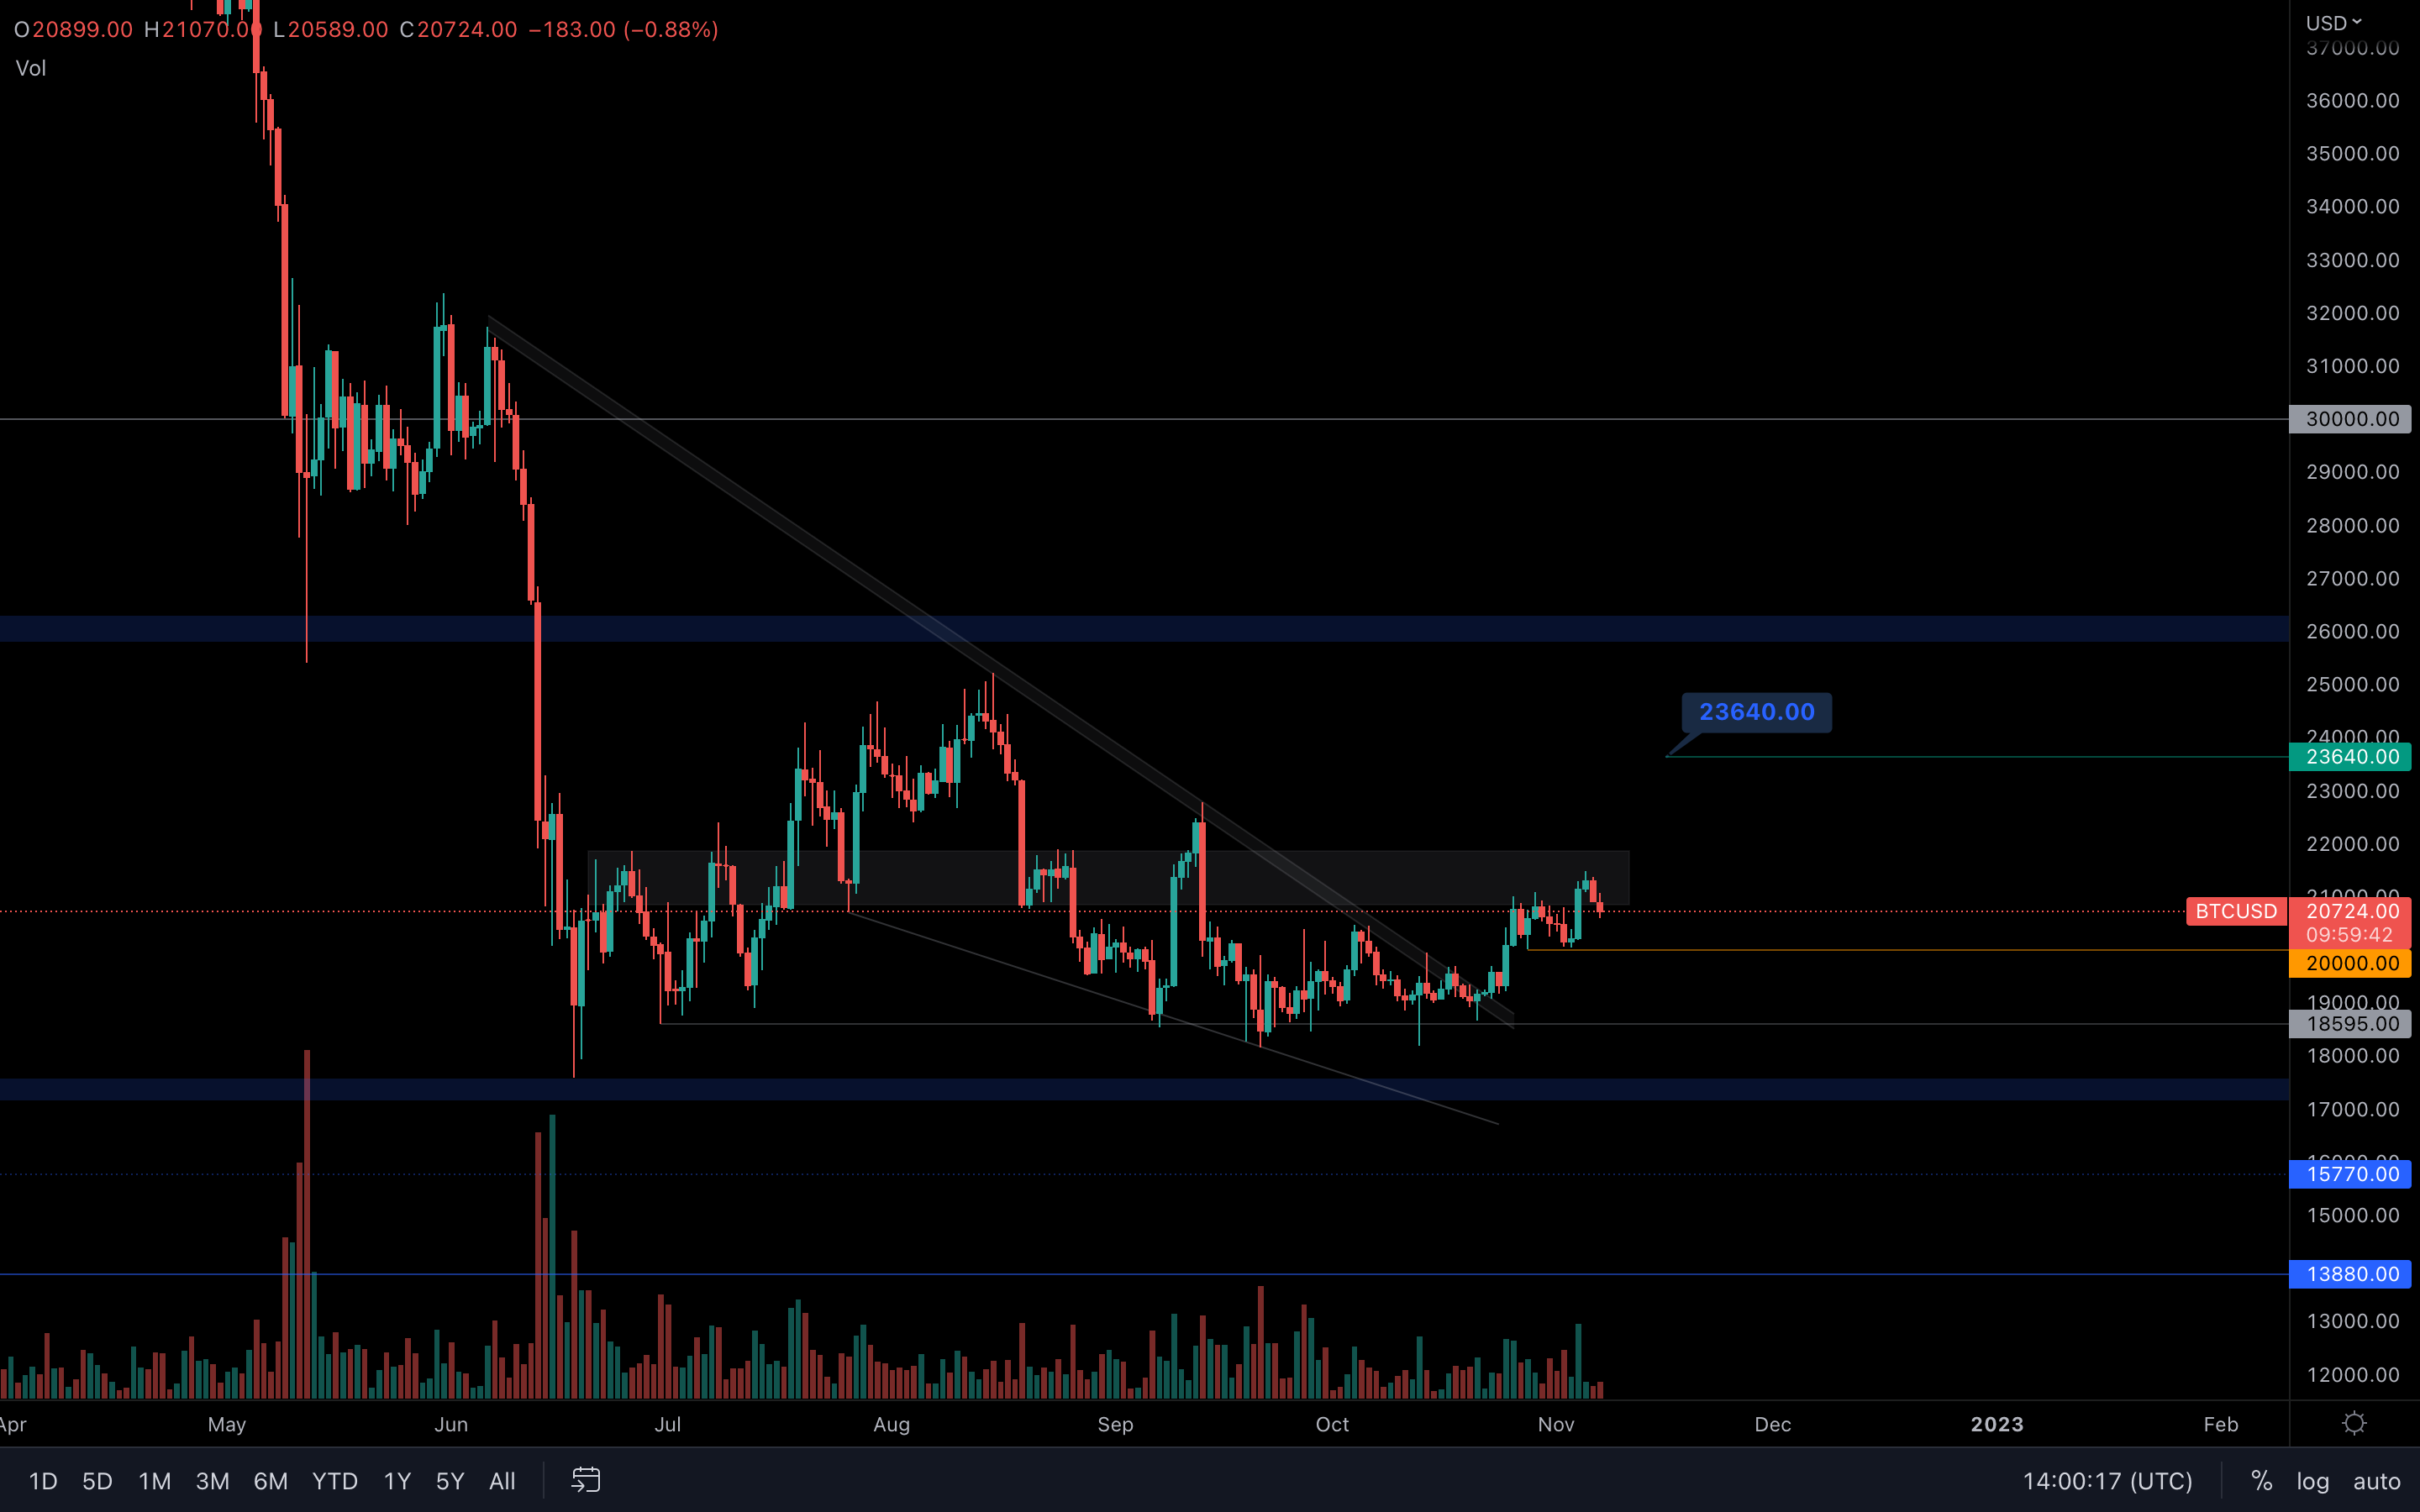 (Daily chart was used)
We used the daily chart here to highlight Bitcoin's current market structure. Yes, there has been a bullish trend over the last 2+ weeks after Bitcoin successfully broke out of the highlighted falling wedge. The current target remains $23,640 and there's nothing in the way other than the $21,800 - $21,000 local resistance area.
(Daily chart was used)
We used the daily chart here to highlight Bitcoin's current market structure. Yes, there has been a bullish trend over the last 2+ weeks after Bitcoin successfully broke out of the highlighted falling wedge. The current target remains $23,640 and there's nothing in the way other than the $21,800 - $21,000 local resistance area.
Once that's taken out, Bitcoin will continue to head toward $23,640. (which is highly likely)
Metric 1 – Addresses + New Addresses
We will first begin with the New Addresses metric. We can see that this metric has begun to form an uptrend that has recently seen the number of New Addresses slightly spike up. This is a positive sign for the space as it may mean an influx or more/new capital.
Bitcoin – New Addresses
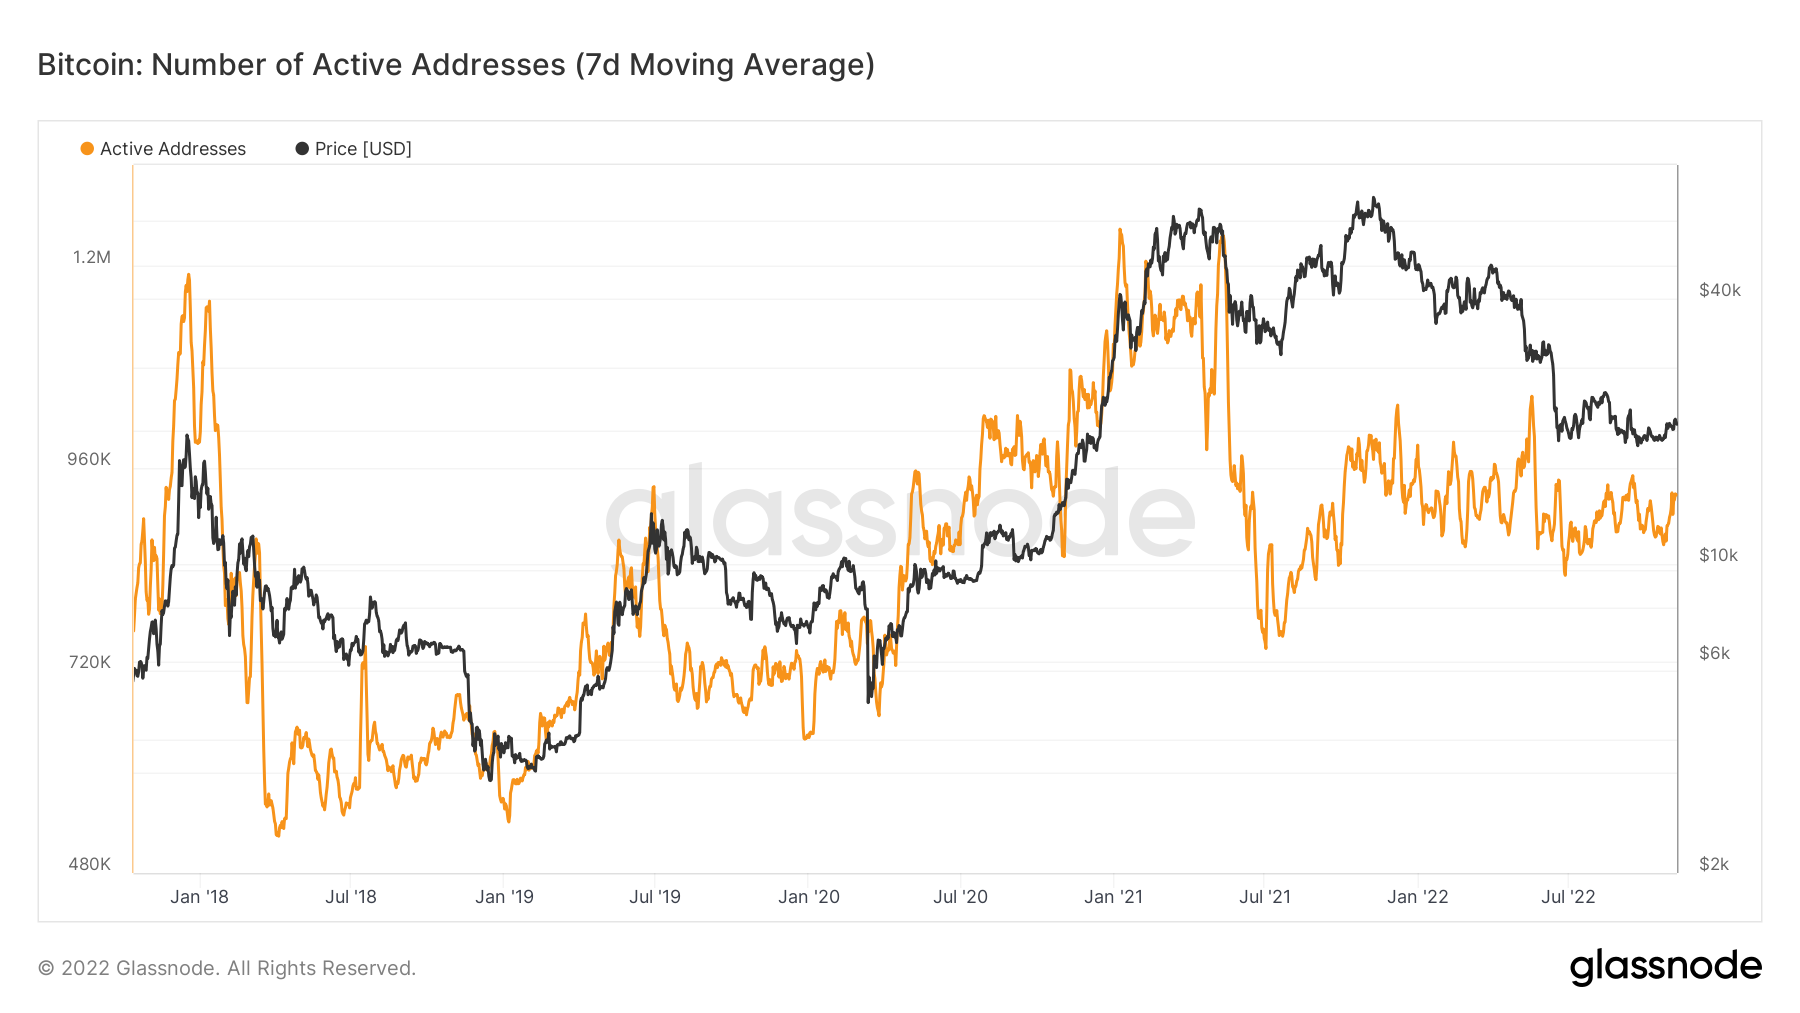
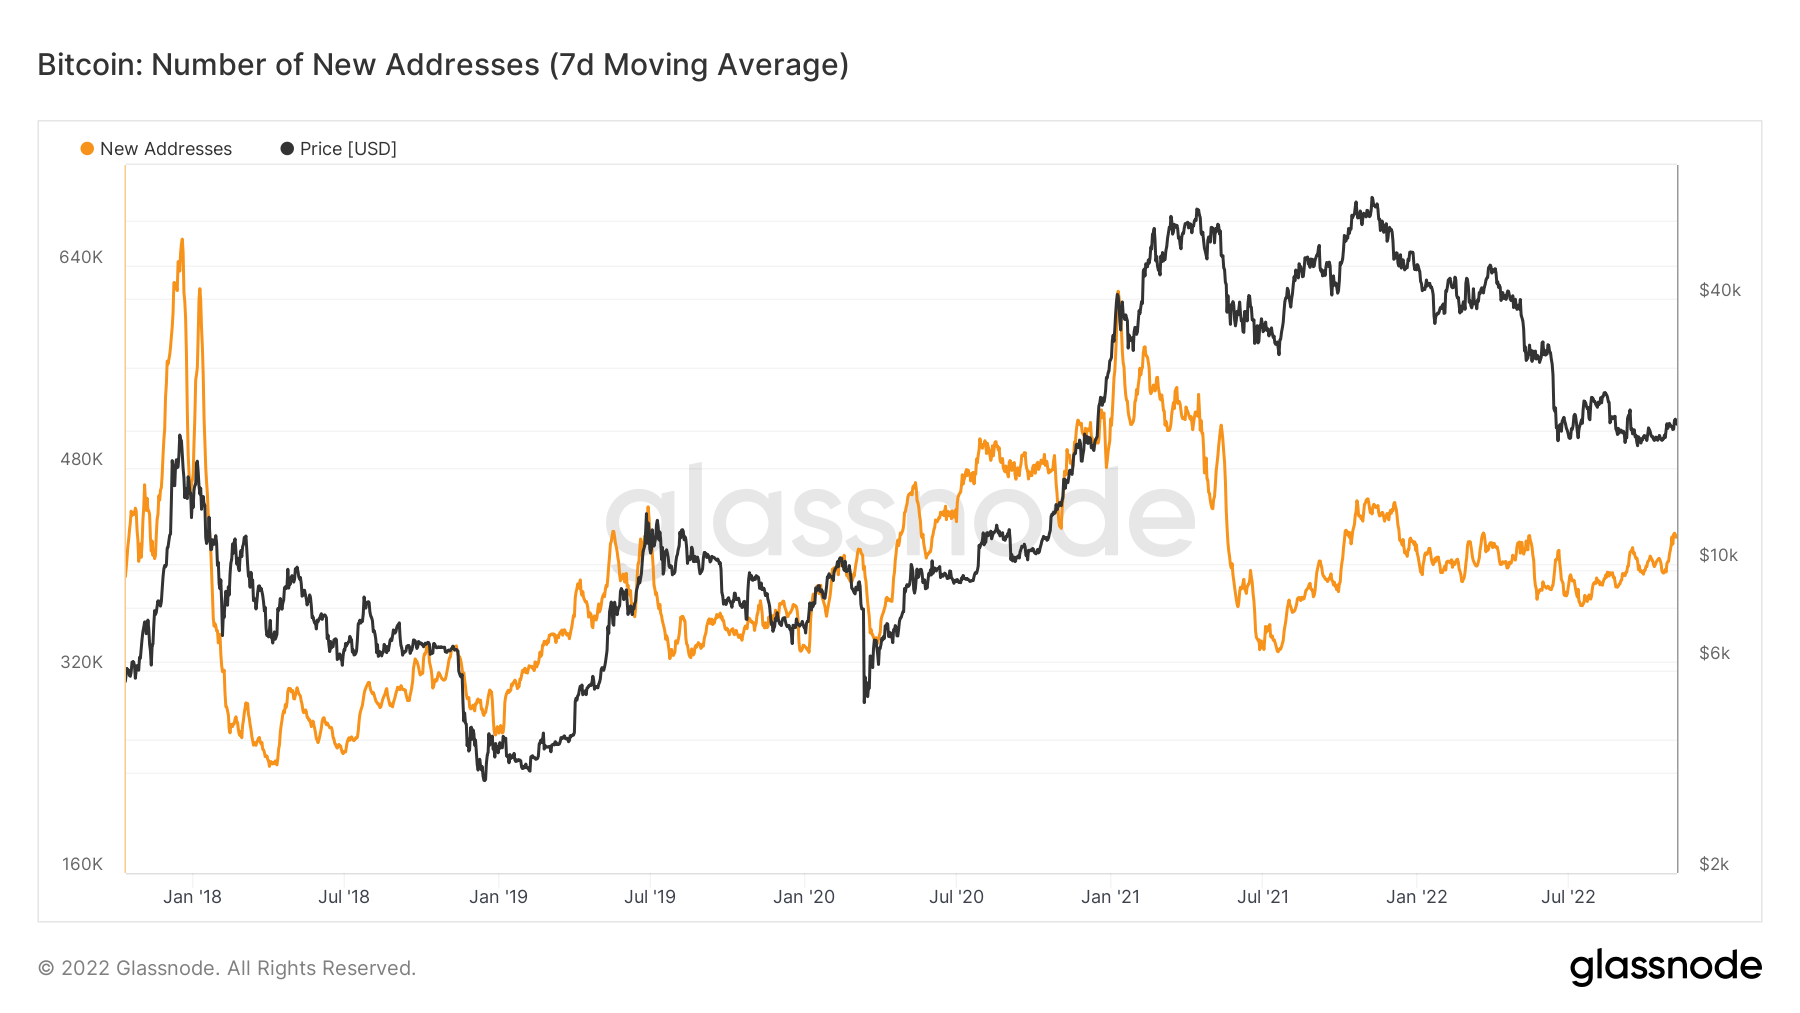 If we turn to Active Addresses, however, we can see that this metric has also spiked up slightly but not to the extent of creating new highs like the New Addresses metric has. A spike up in Active Addresses usually comes following a large move up or down in price, but generally, if prices uptrend, then so will Active Addresses.
Bitcoin – Active Addresses
 If we dive in a bit deeper we can see that many of the wallet cohorts (Bitcoin addresses are grouped into cohorts based on how much BTC they hold), are still risking off – the number of wallets in that cohort decreasing i.e., investors are not adding to their balances. Whilst this continues to be true, in the last 24hrs, we can see that the largest wallet cohort, Addresses with Balance > 10,000 BTC has seen a large spike up in the number of addresses holding more than 10,000 BTC – a significant amount of risking on.
Bitcoin – Addresses with Balance > 10k BTC
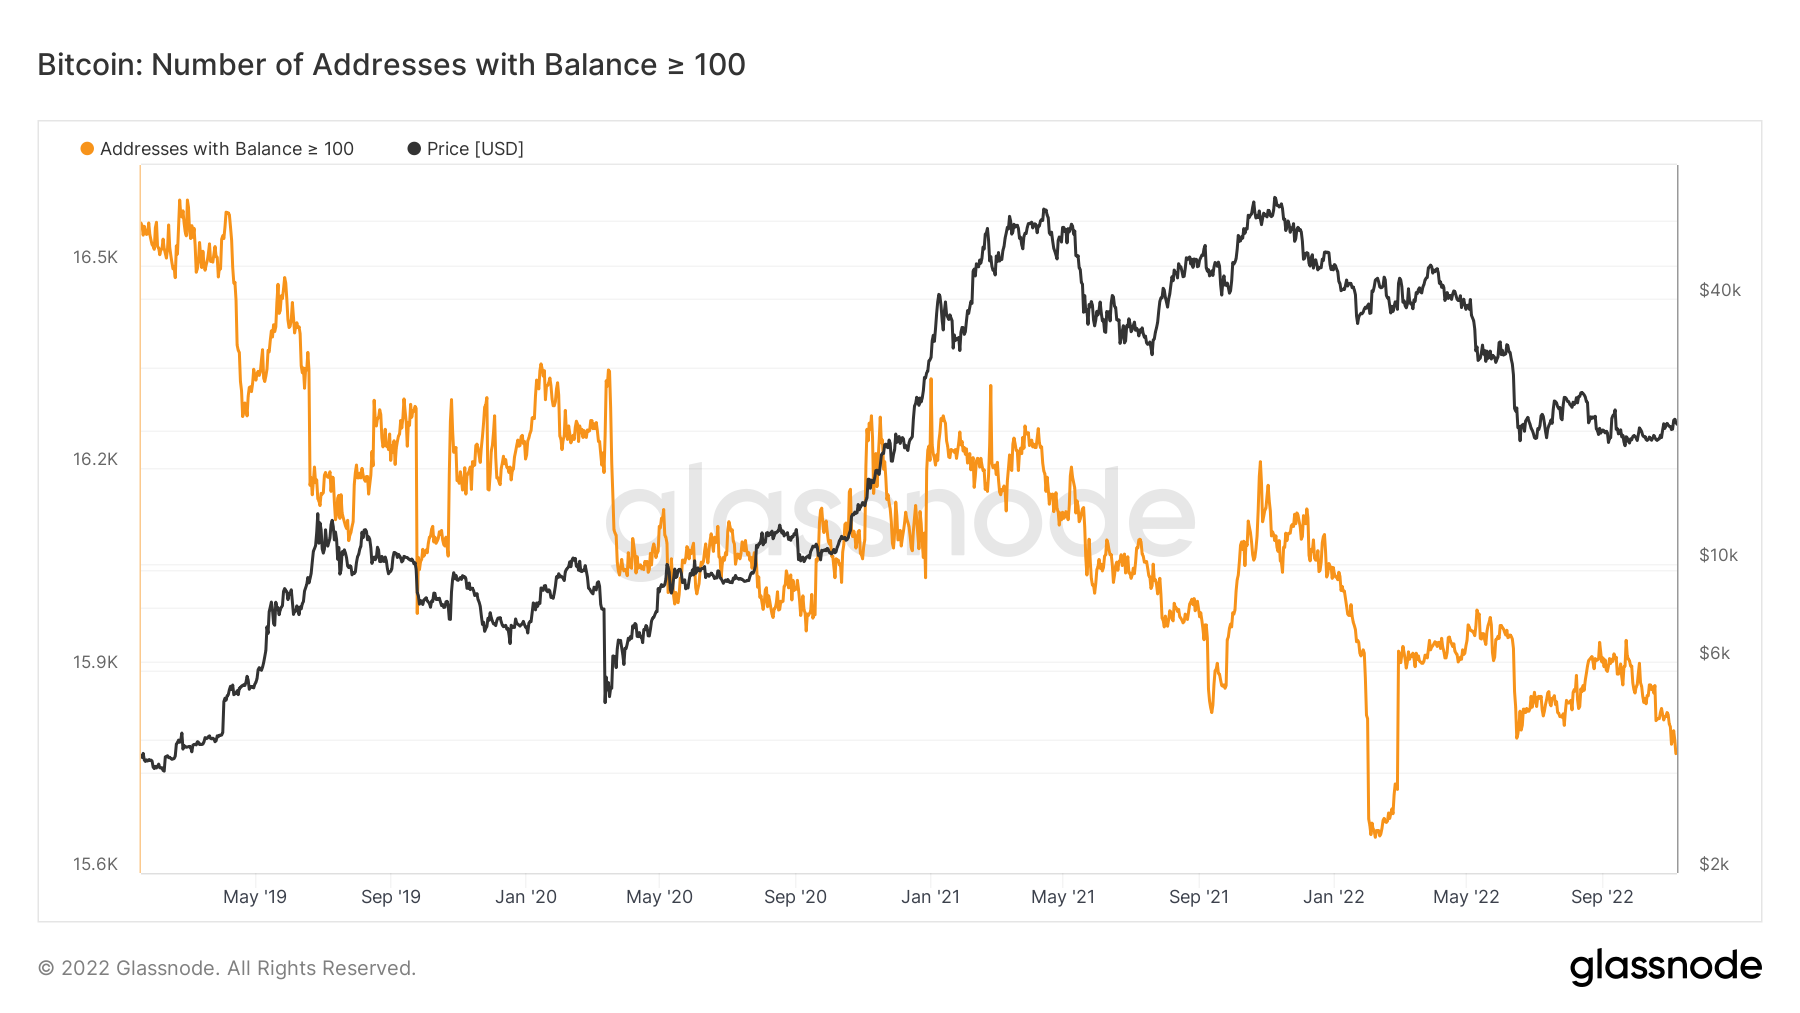
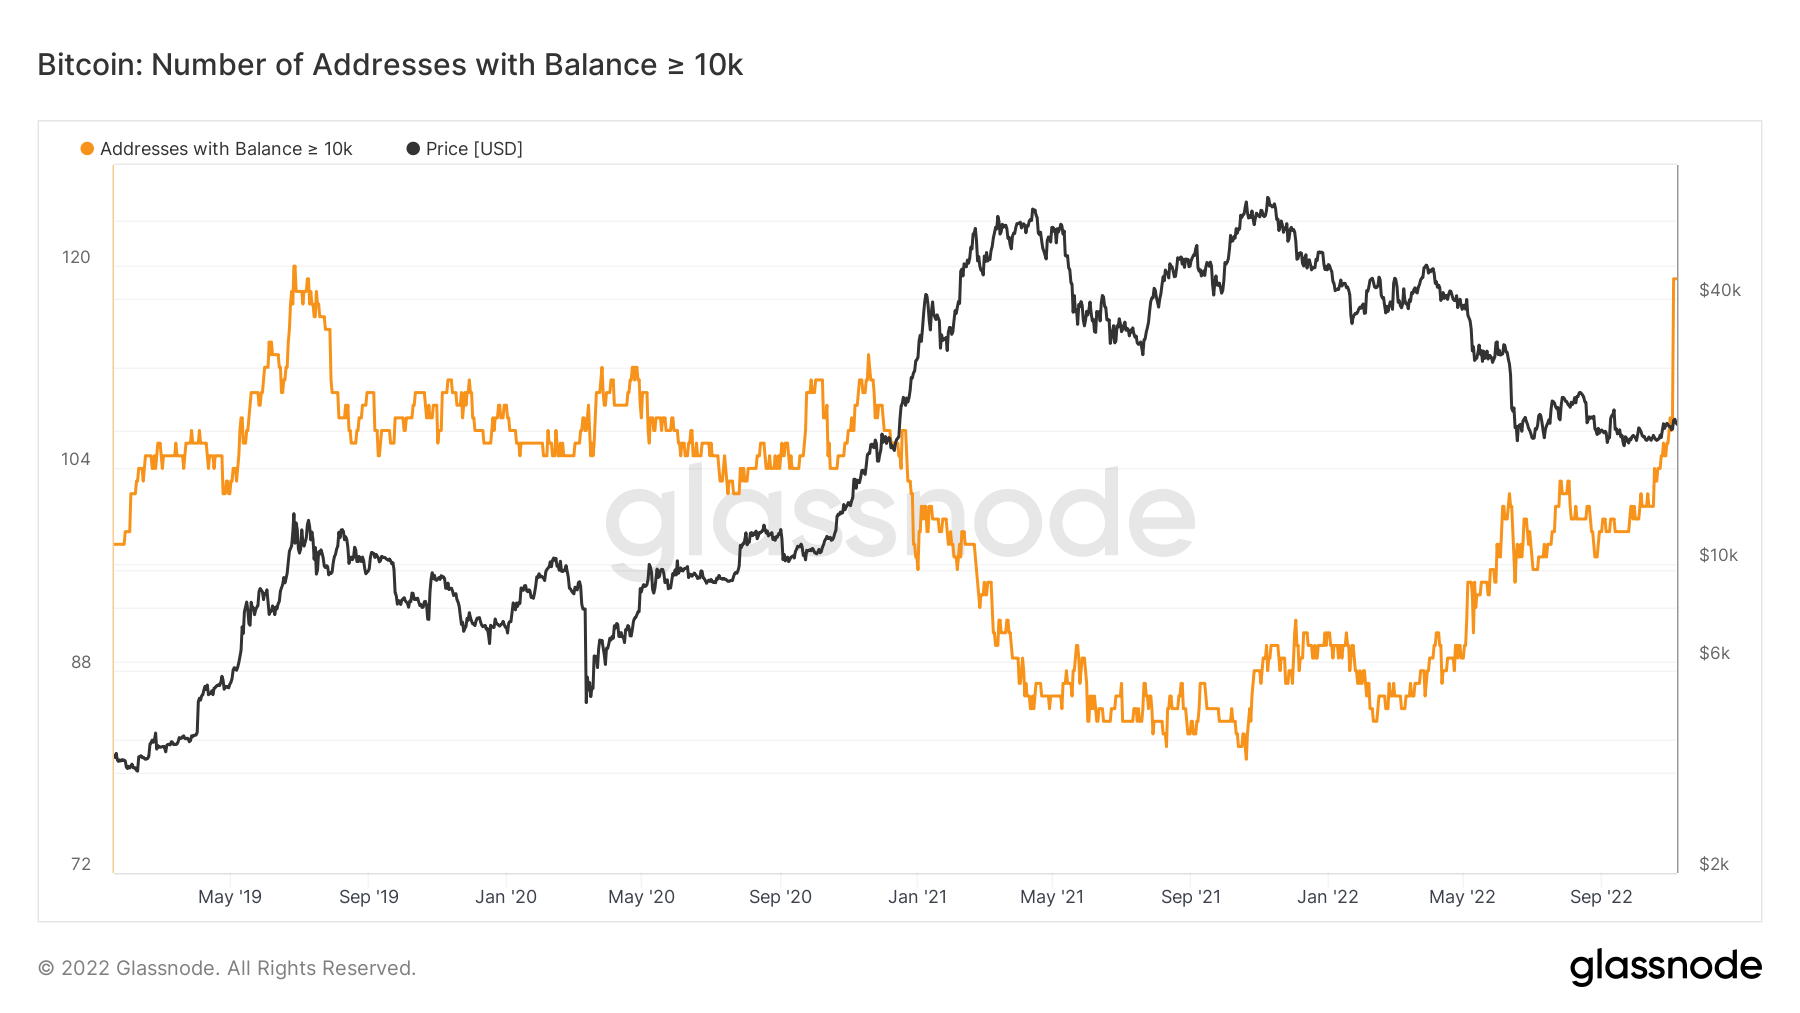 Although the cohorts; Addresses with Balance > 100 BTC and Addresses with Balance > 1,000 BTC have seen the number of wallets in their cohorts decrease (investors risking-off)), the fact that the 10K BTC cohort has seen such heavy and significant risking-on behaviour should be something that we take into strong consideration when thinking of making portfolio changes.
Bitcoin – Addresses with Balance > 100 BTC
 Bitcoin – Addresses with Balance > 1,000 BTC
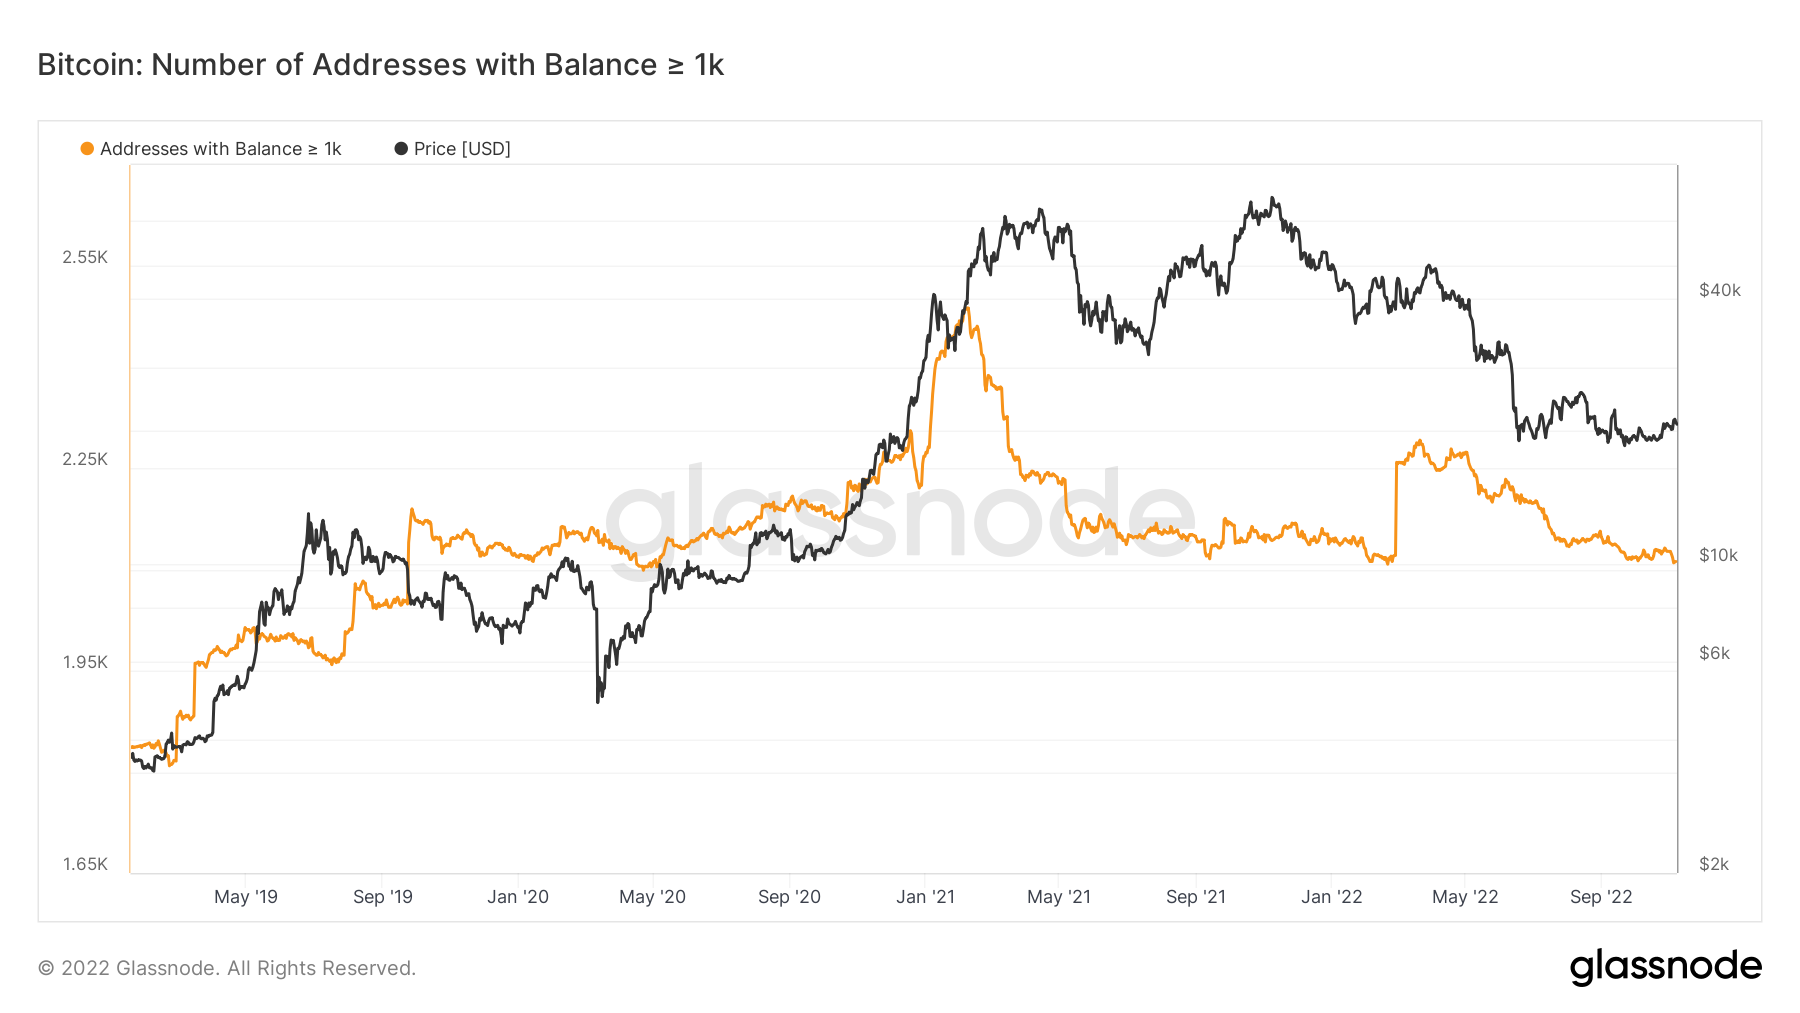
Note: the large move up at the end of Feb 22 was not organic. This was confirmed by the data provider Glassnode.
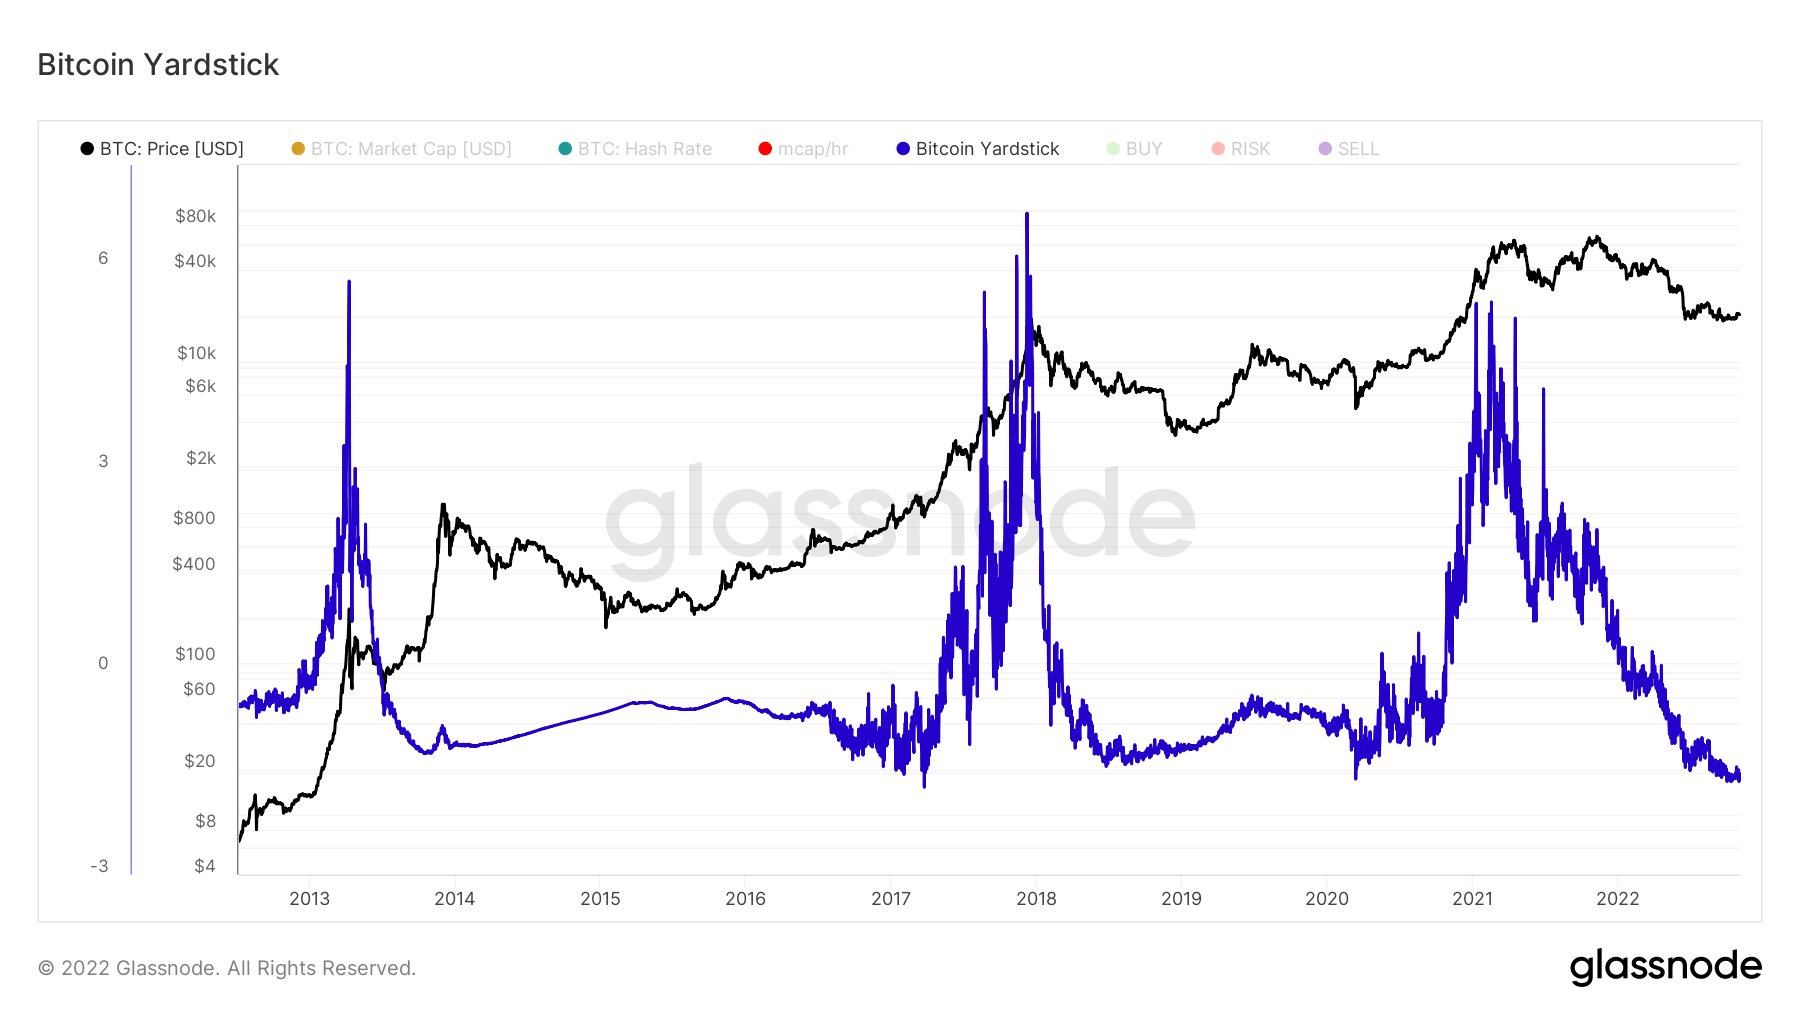
Metric 2 – Bitcoin Yardstick
This past week, the Bitcoin Yardstick metric was introduced by Charles Edwards (the Founder of Capriole Fund). This metric takes the ratio of energy work done to secure the Bitcoin network in relation to price. The lower the metric reading, the cheaper Bitcoin is in these value terms. Currently, this metric is at one of its lowest ever readings, indicating that Bitcoin is considerably below its fair value price-wise.
Bitcoin – Bitcoin Yardstick
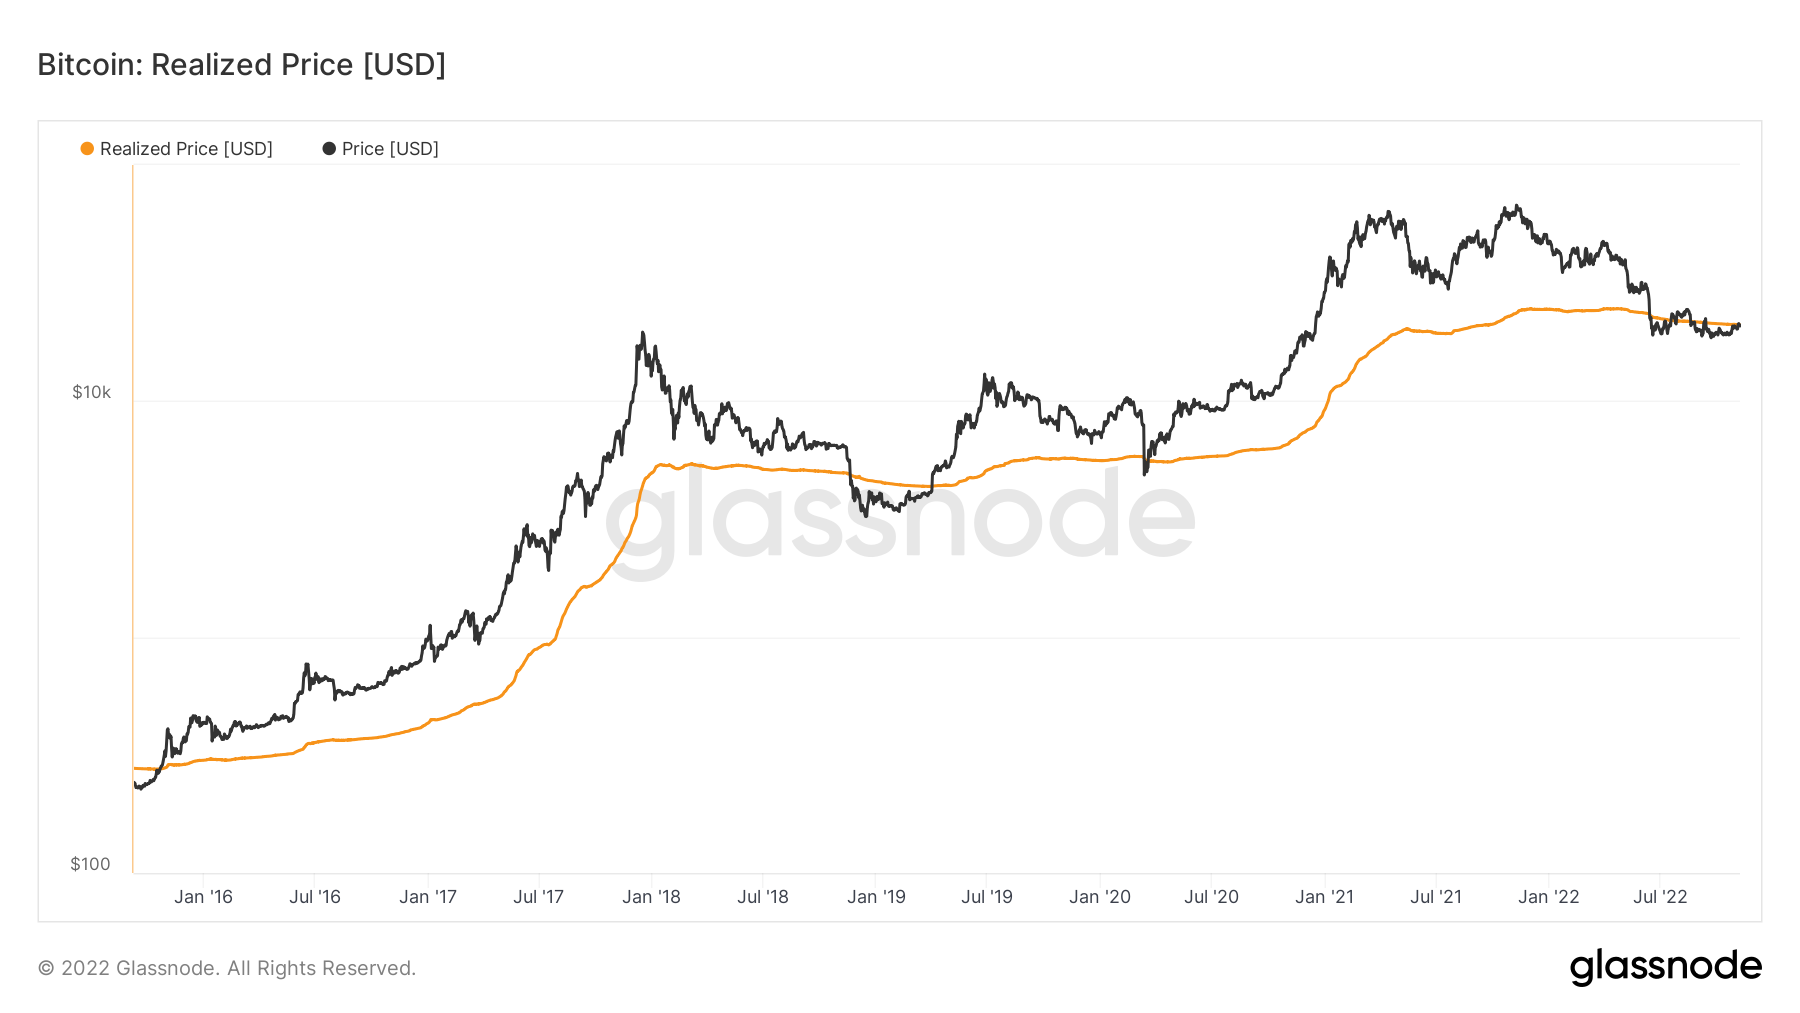
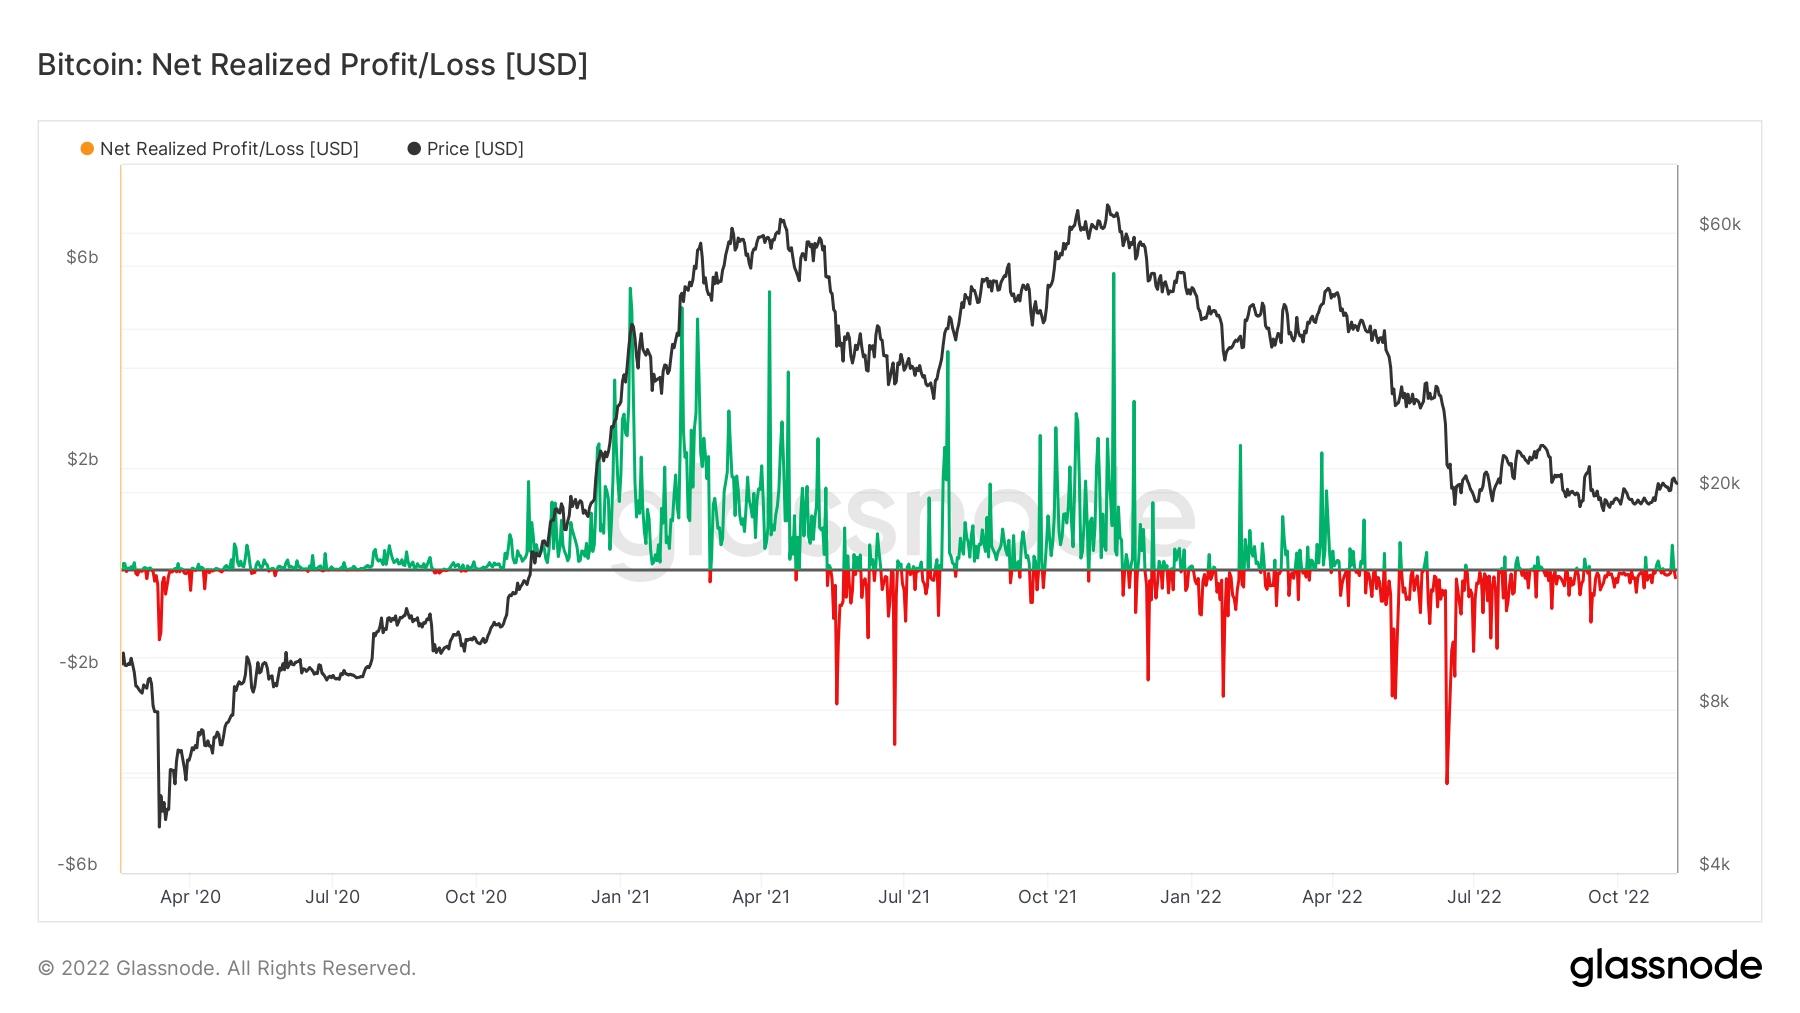
 Metric 3 – Realised Price + Net Realised Profit/Loss
Even though some of the long-term metrics are suggesting that Bitcoin is in value territory, Bitcoin continues to struggle north of $21,000 due to running into the Realised Price. This is where the average investor is at break-even levels and looks to sell their coins due to them being thankful to get out loss free at a time when sentiment is not suggesting higher prices are on the near-term horizon. This is also reflected in the Net Unrealised Profit/Loss, which we can see struggles to maintain green spikes, and naturally falls back to printing small red spikes beneath the 0 break-even line.
Bitcoin – Realised Price
 Bitcoin – Net Realised Profit/Loss
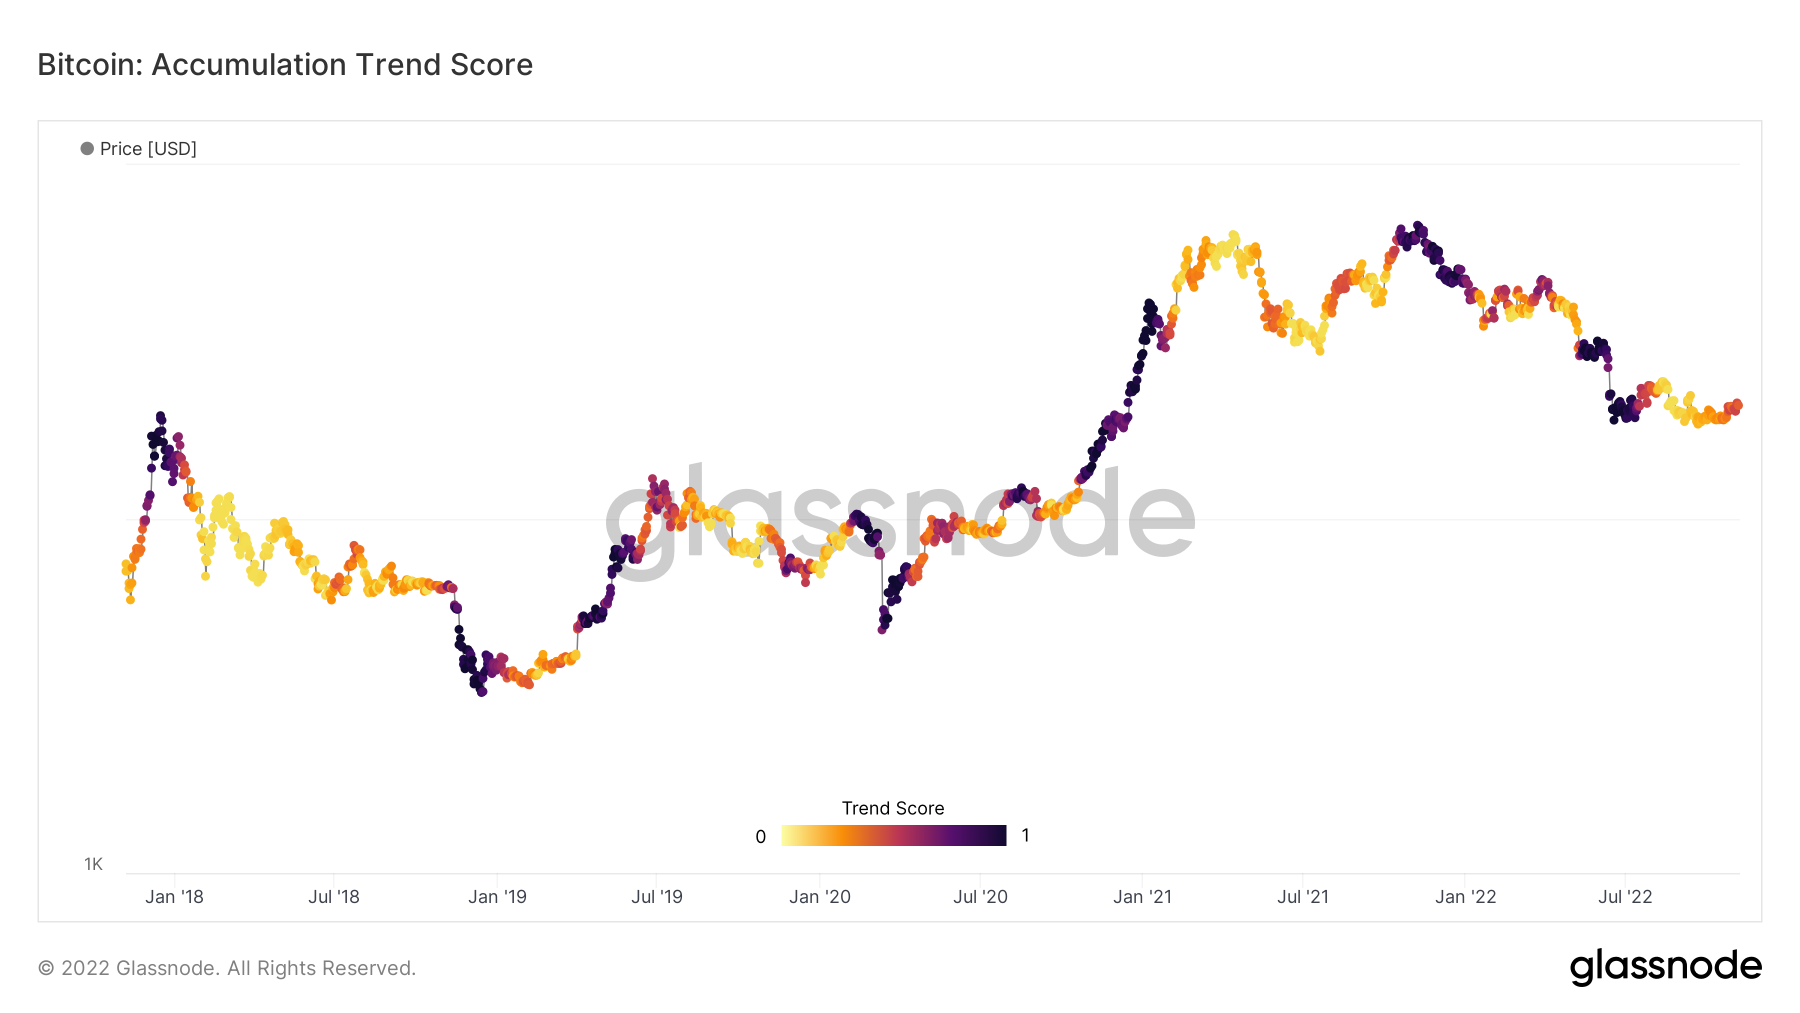
 Metric 4 – Accumulation Trend Score
The last metric in today’s report is the Accumulation Trend Score. This metric shows the relative size of entities that are actively accumulating coins on-chain in terms of their BTC holdings. We can see that the late 2018, and early 2019 bottom looks very similar to the past few months' price action for Bitcoin.
Bitcoin – Accumulation Trend Score
Ether - Technical Analysis
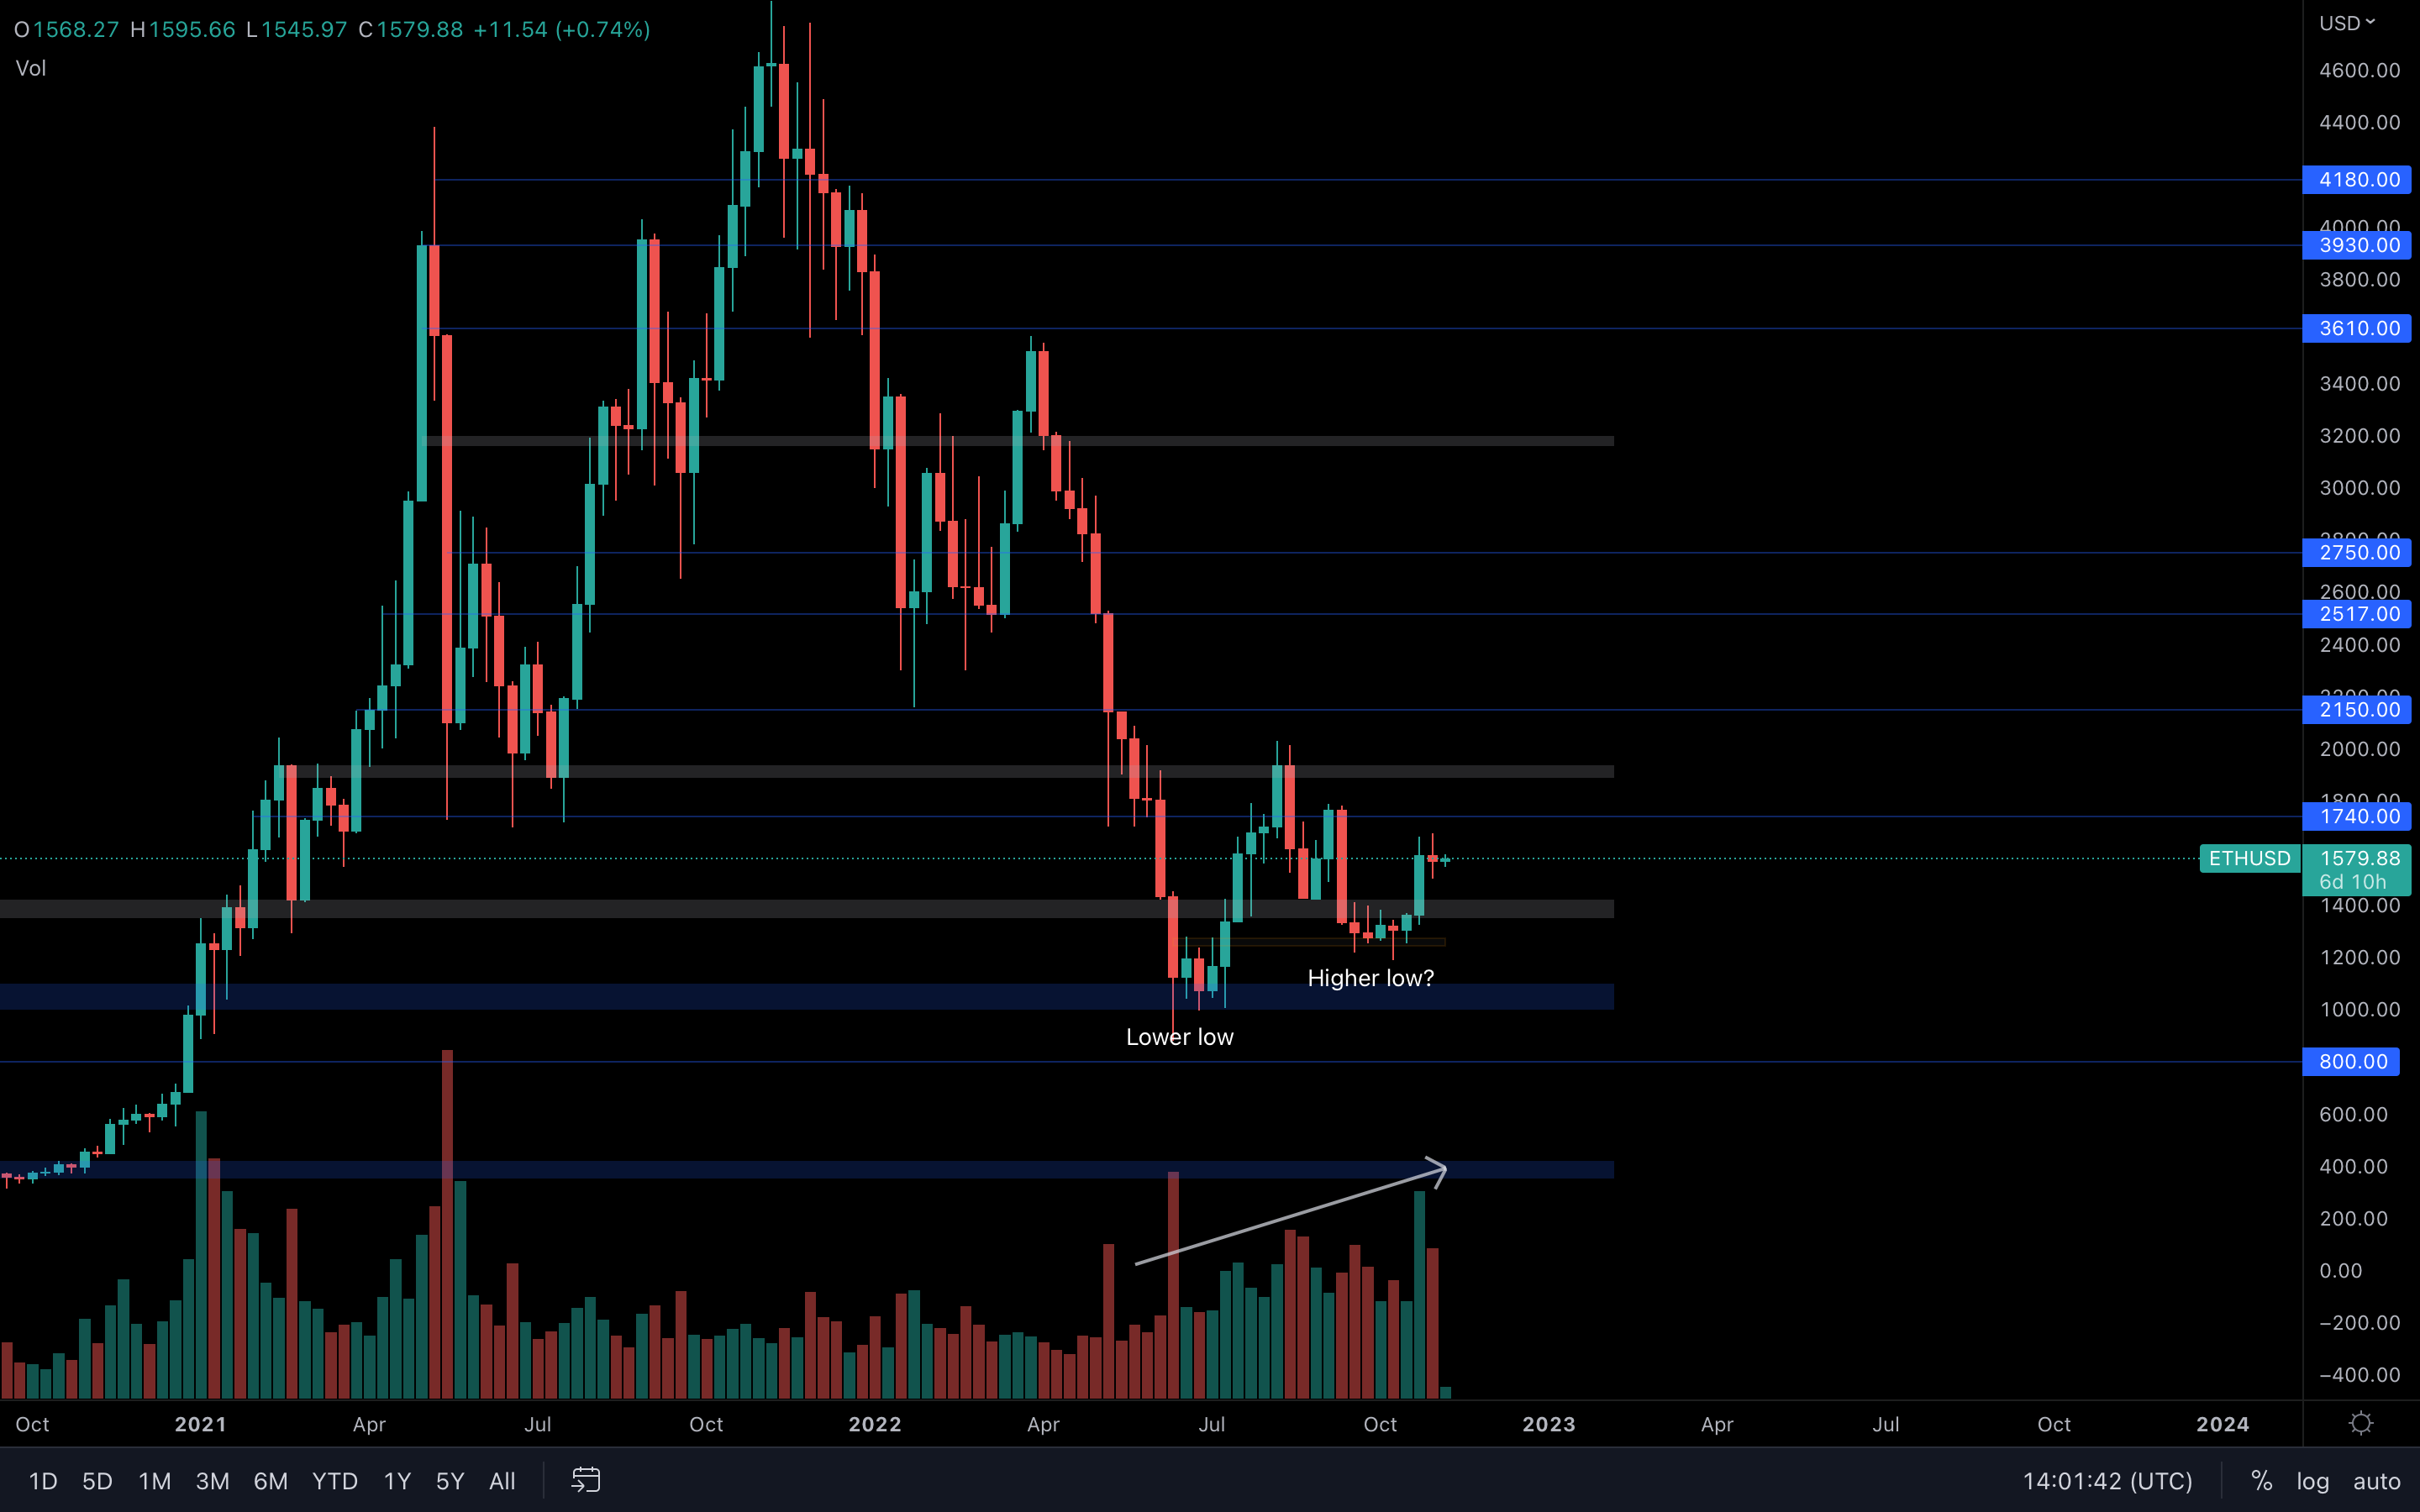 $1400 has been reclaimed and turned into support, which means the low $1700s are within reach.
One important note here - we can see that ETH has been forming a potential weekly higher low after the rise we experienced two weeks ago. With a bullish engulfing candle on the monthly timeframe as well, the odds of Ether going even higher than $1700 in November are quite high.
We should also take into consideration how ETH's volume is still increasing. This could easily end up as a double bottom if the markets play out right.
DOT
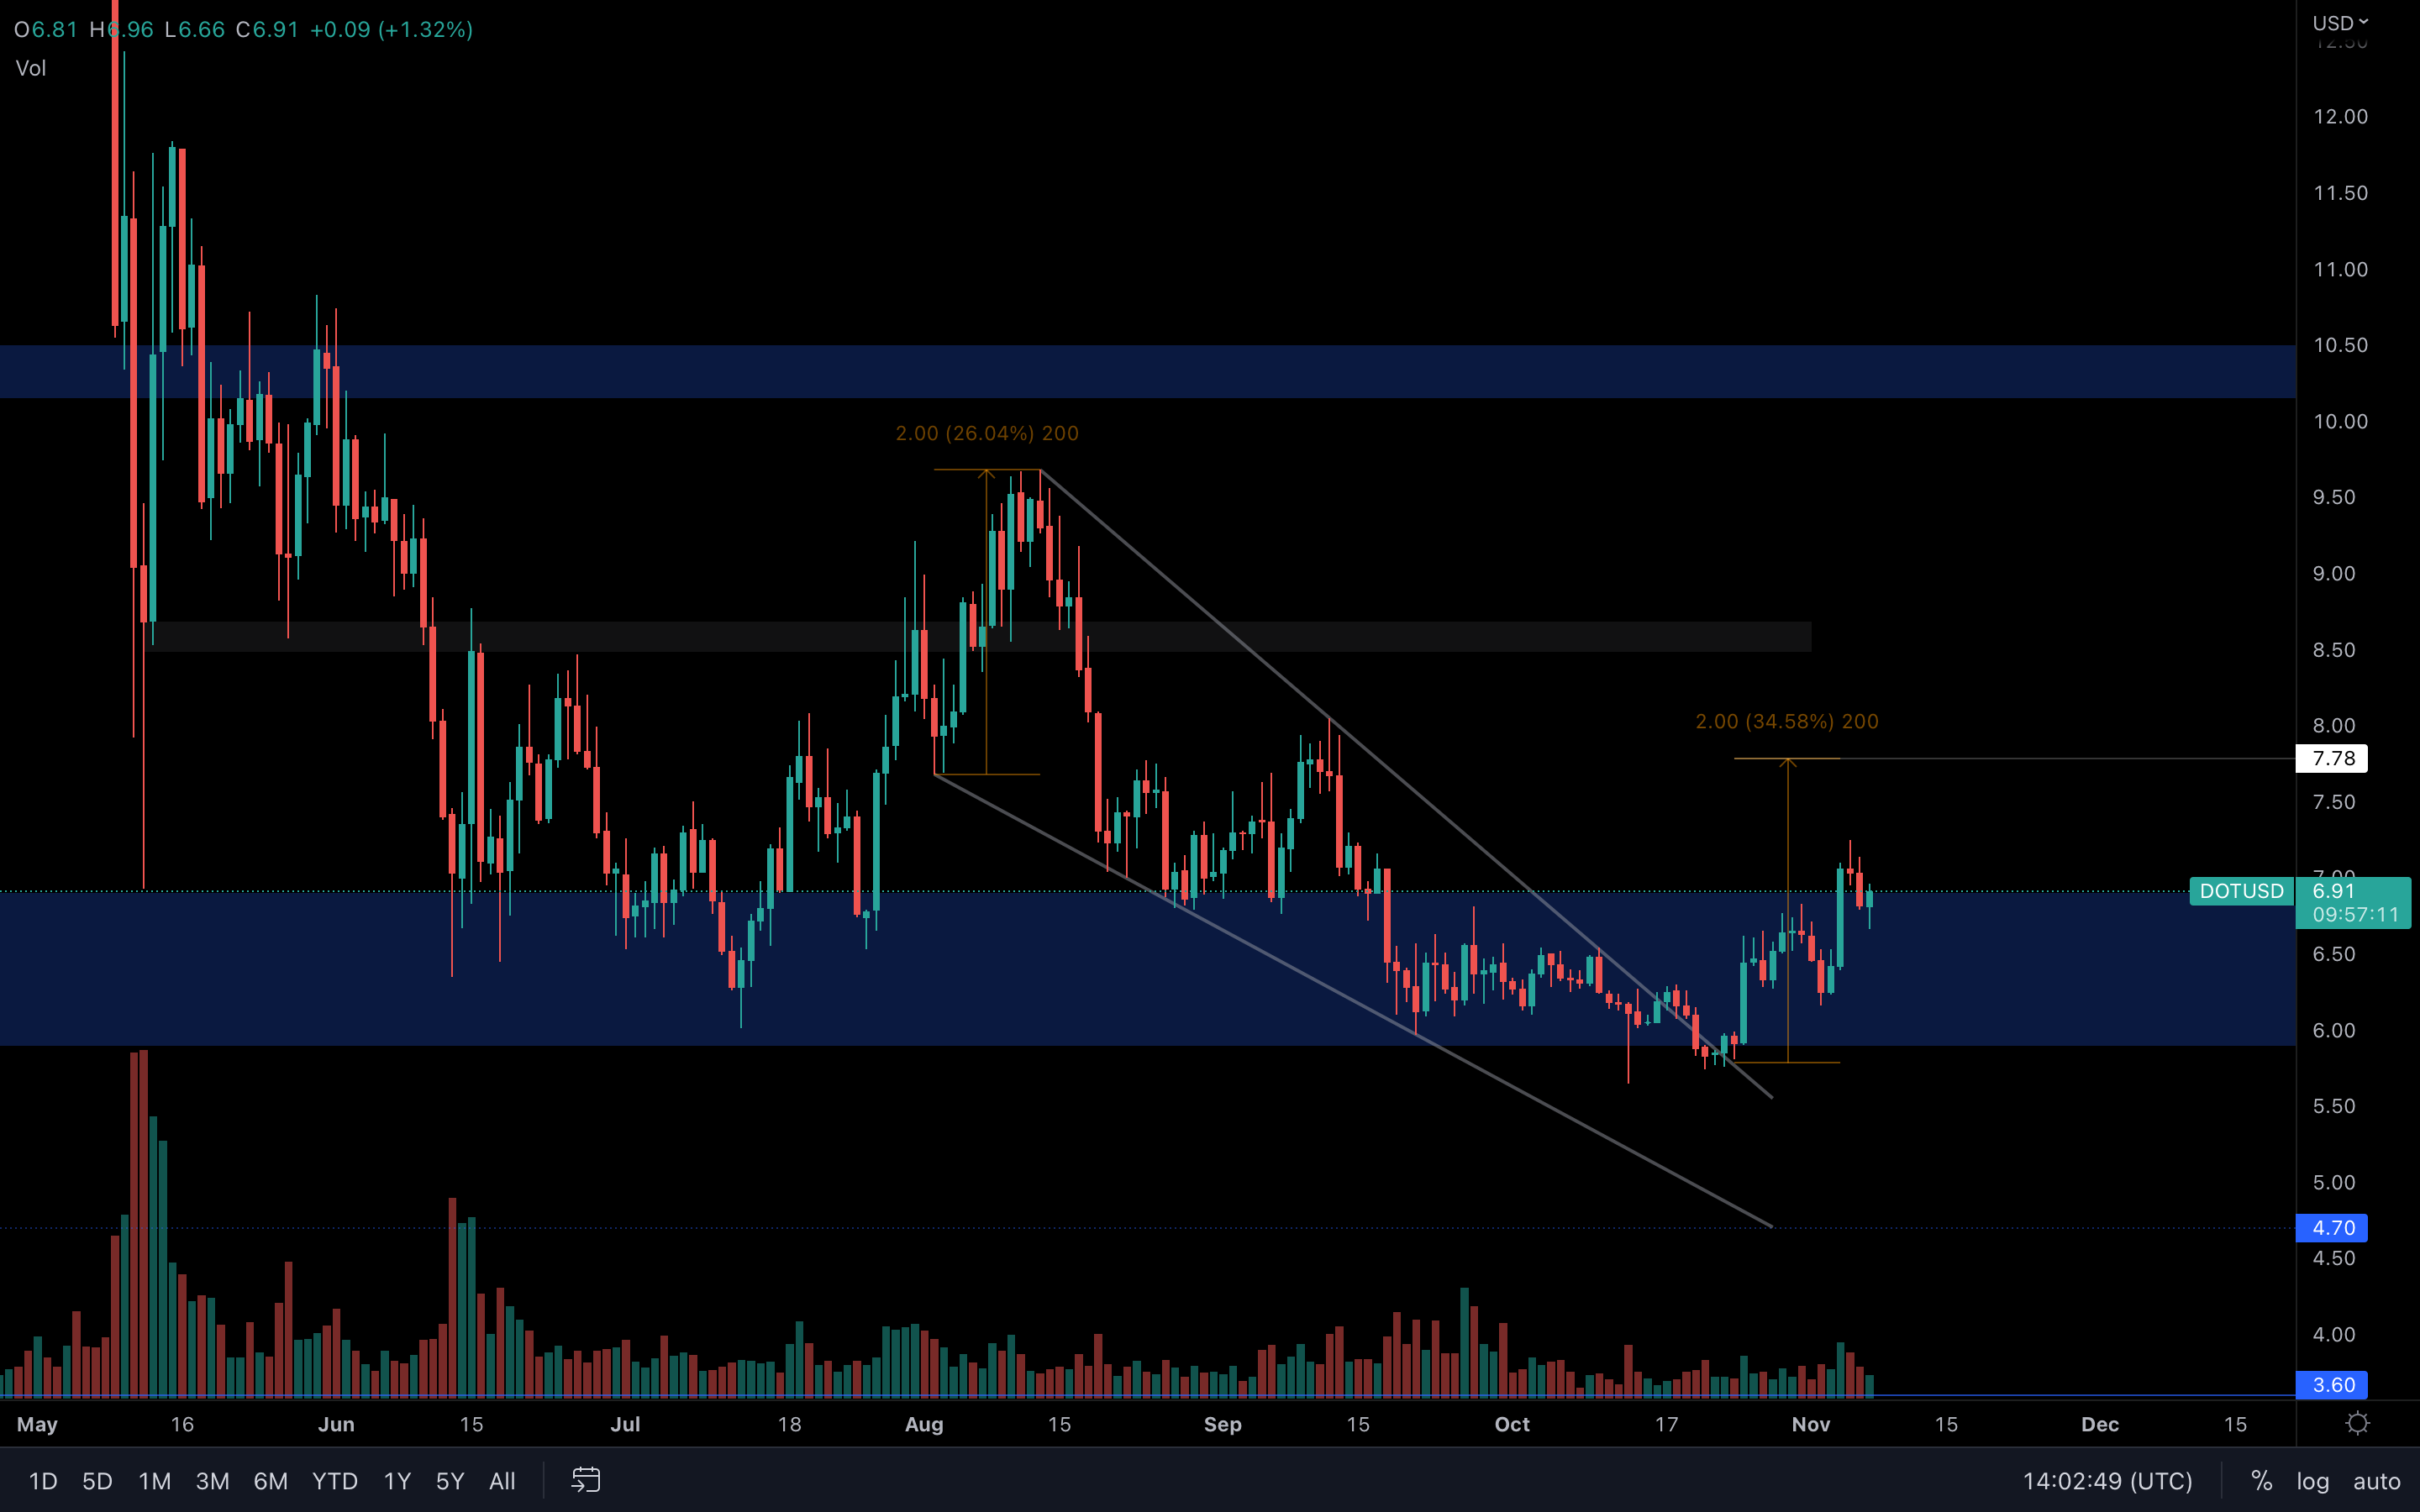 (Daily chart was used)
Bullish market structure after breaking out of this falling wedge. There's nothing stopping DOT from reaching $7.78, its first target which also marks a weekly lower high.
(Daily chart was used)
Bullish market structure after breaking out of this falling wedge. There's nothing stopping DOT from reaching $7.78, its first target which also marks a weekly lower high.
However, its volume is quite low. Not something we'd like to see when looking for upside potential. There are both bullish & bearish scenarios here - choose one with your own doing.
SNX
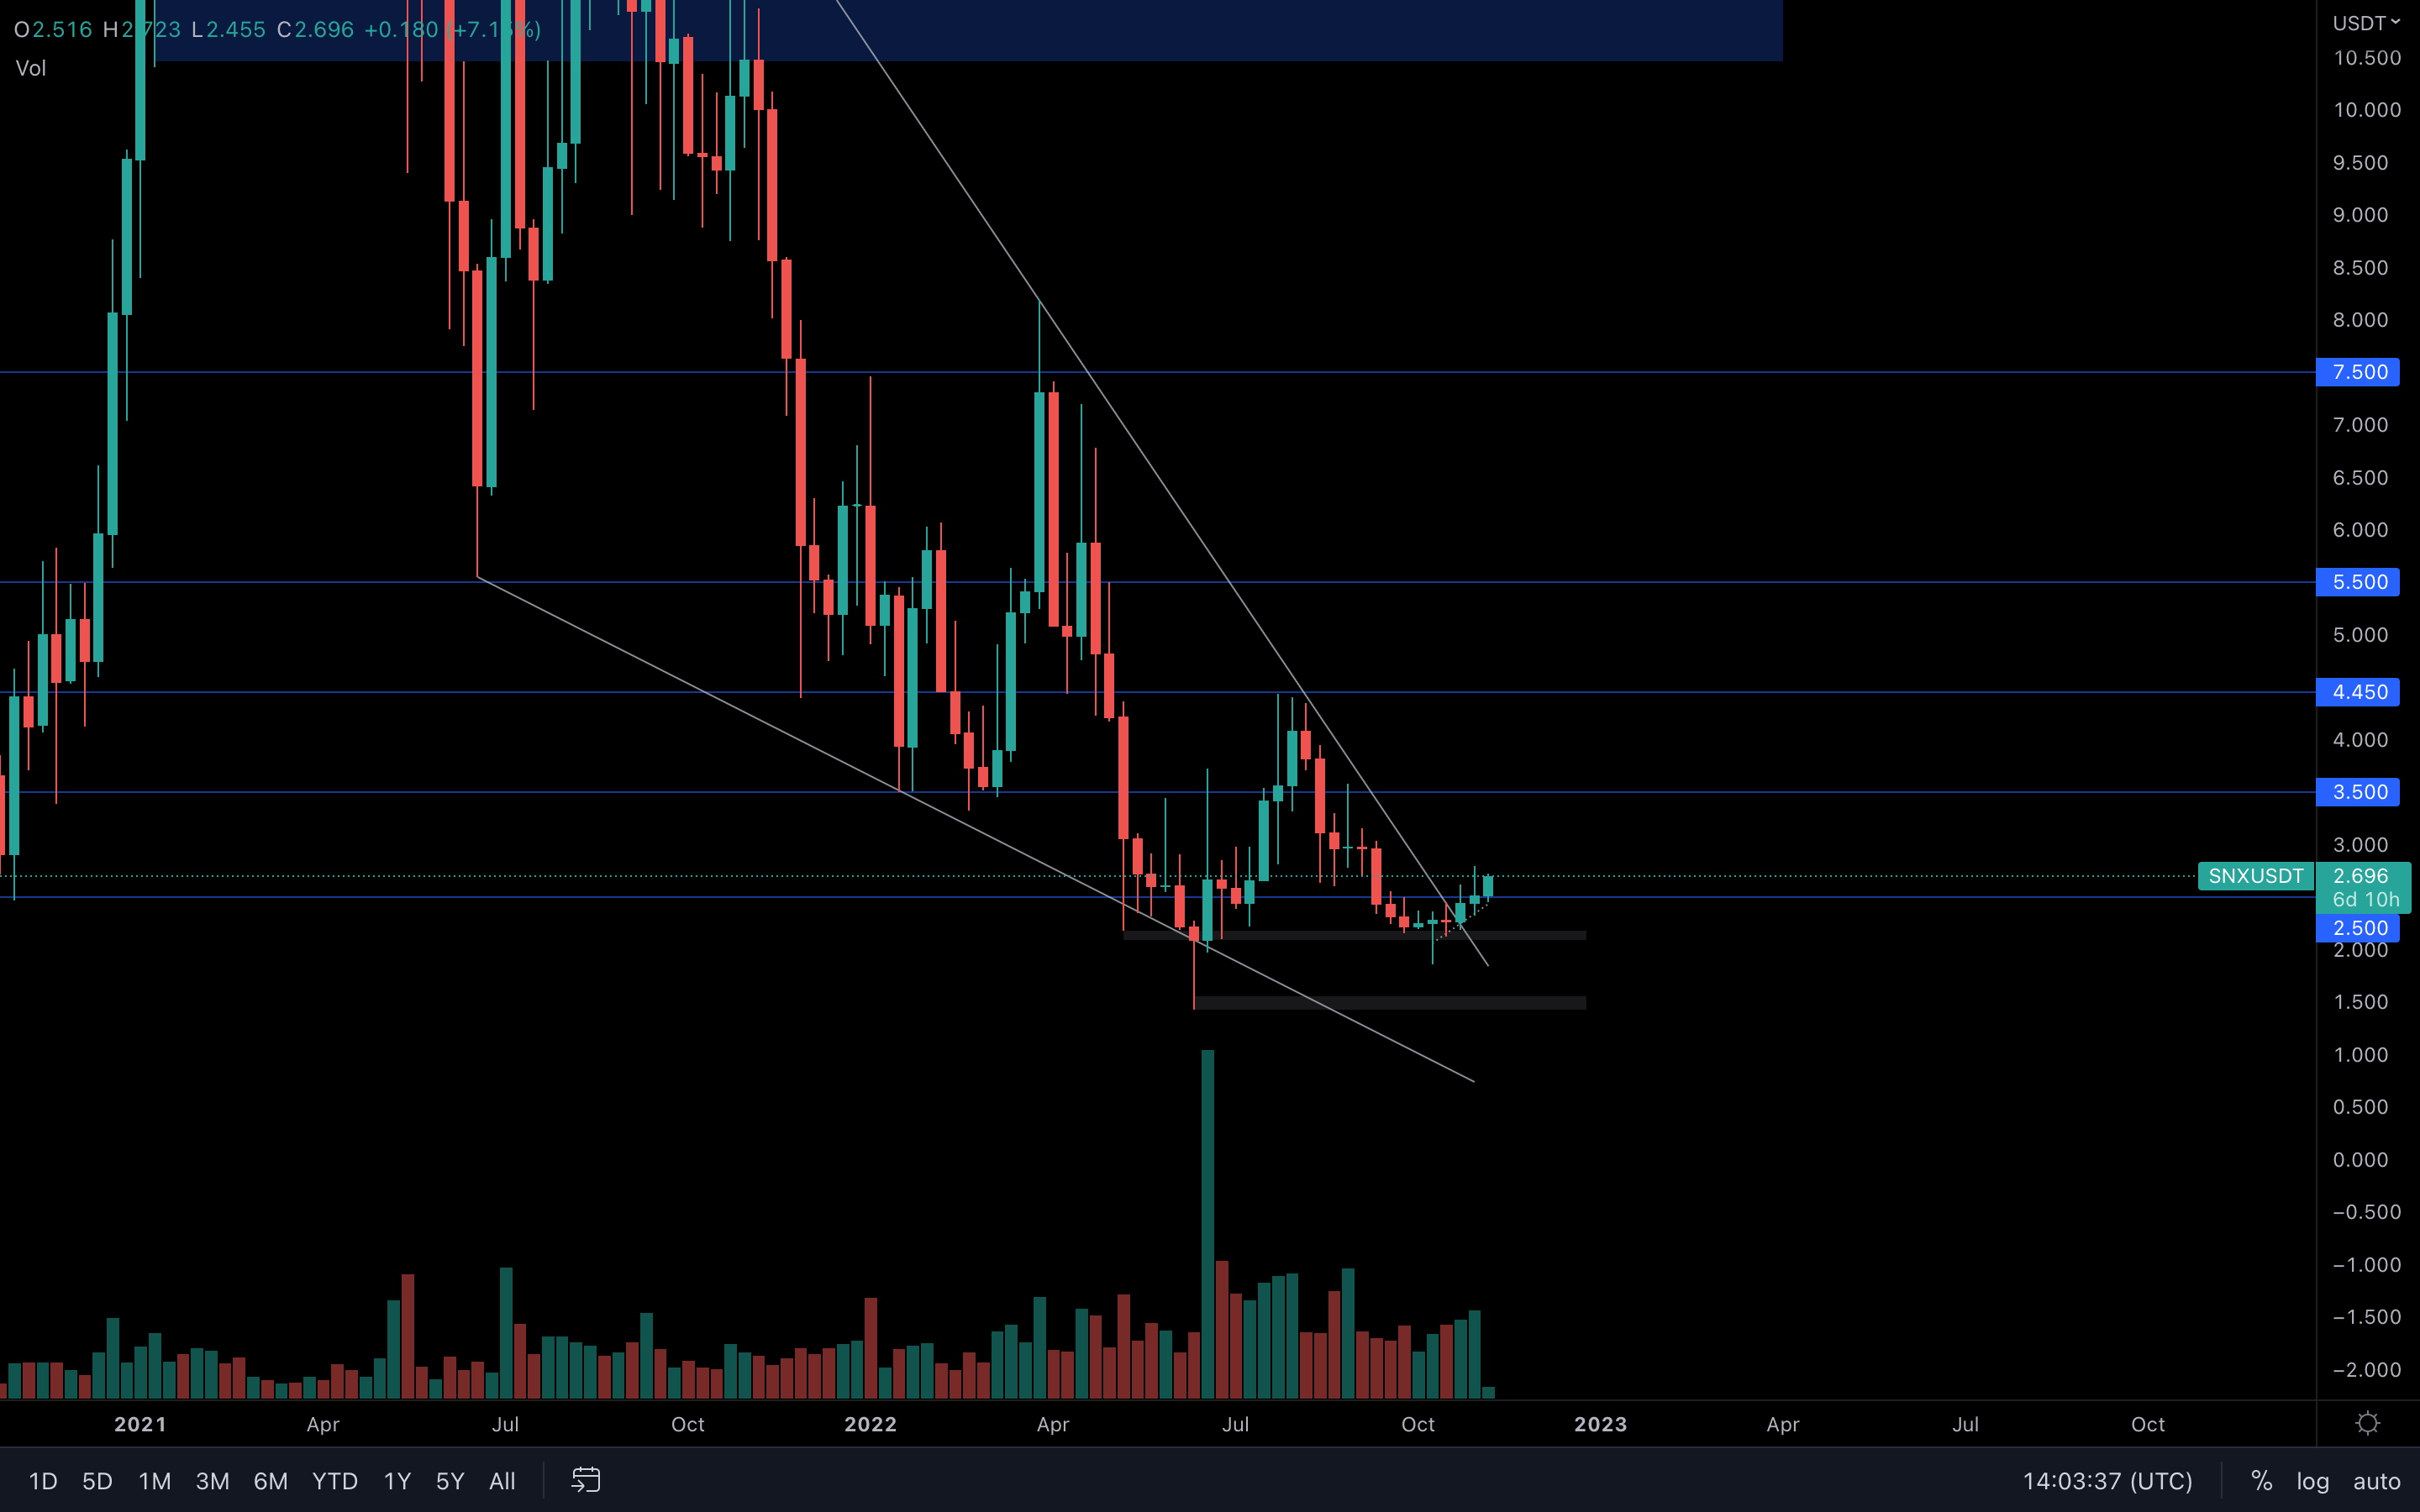 SNX is on a path toward $3.50. Nothing else to say here.
RUNE
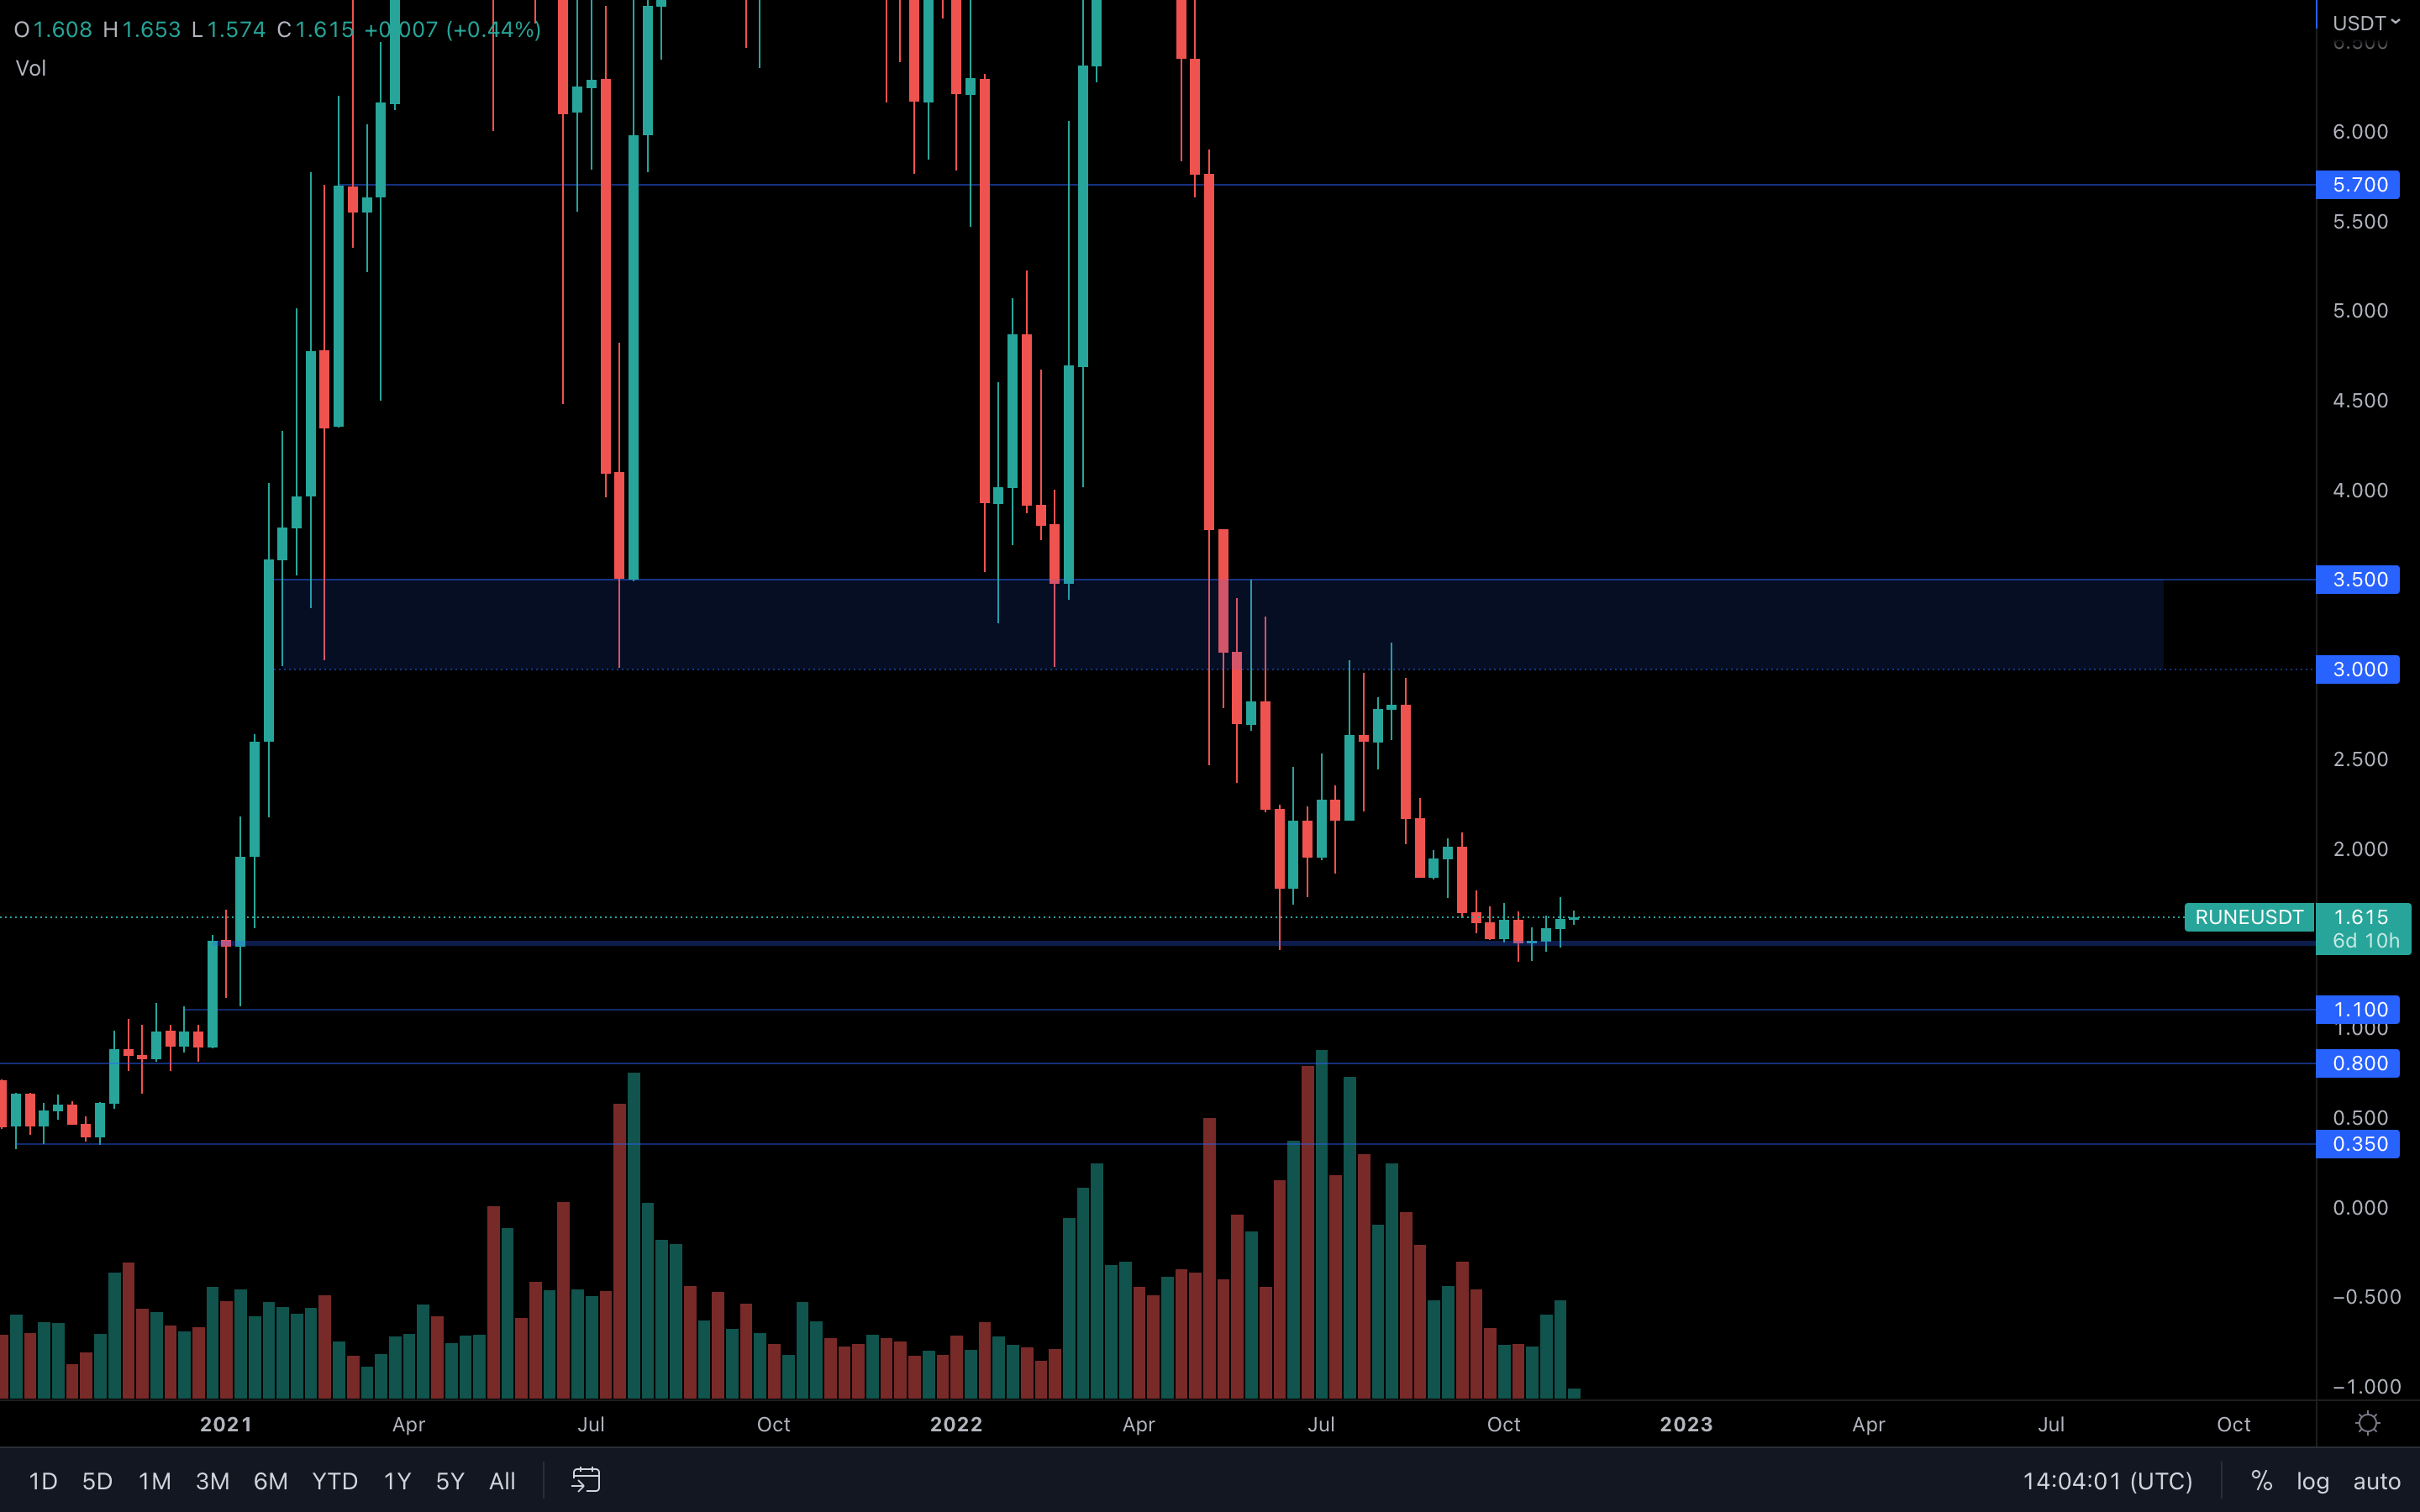 For the past three weeks, RUNE has barely moved due to its minuscule volume. The asset is left in the hands of the majors, and whatever happens to them, happens to RUNE.
With that said, we could see THORChain rise in the coming weeks.
SOL
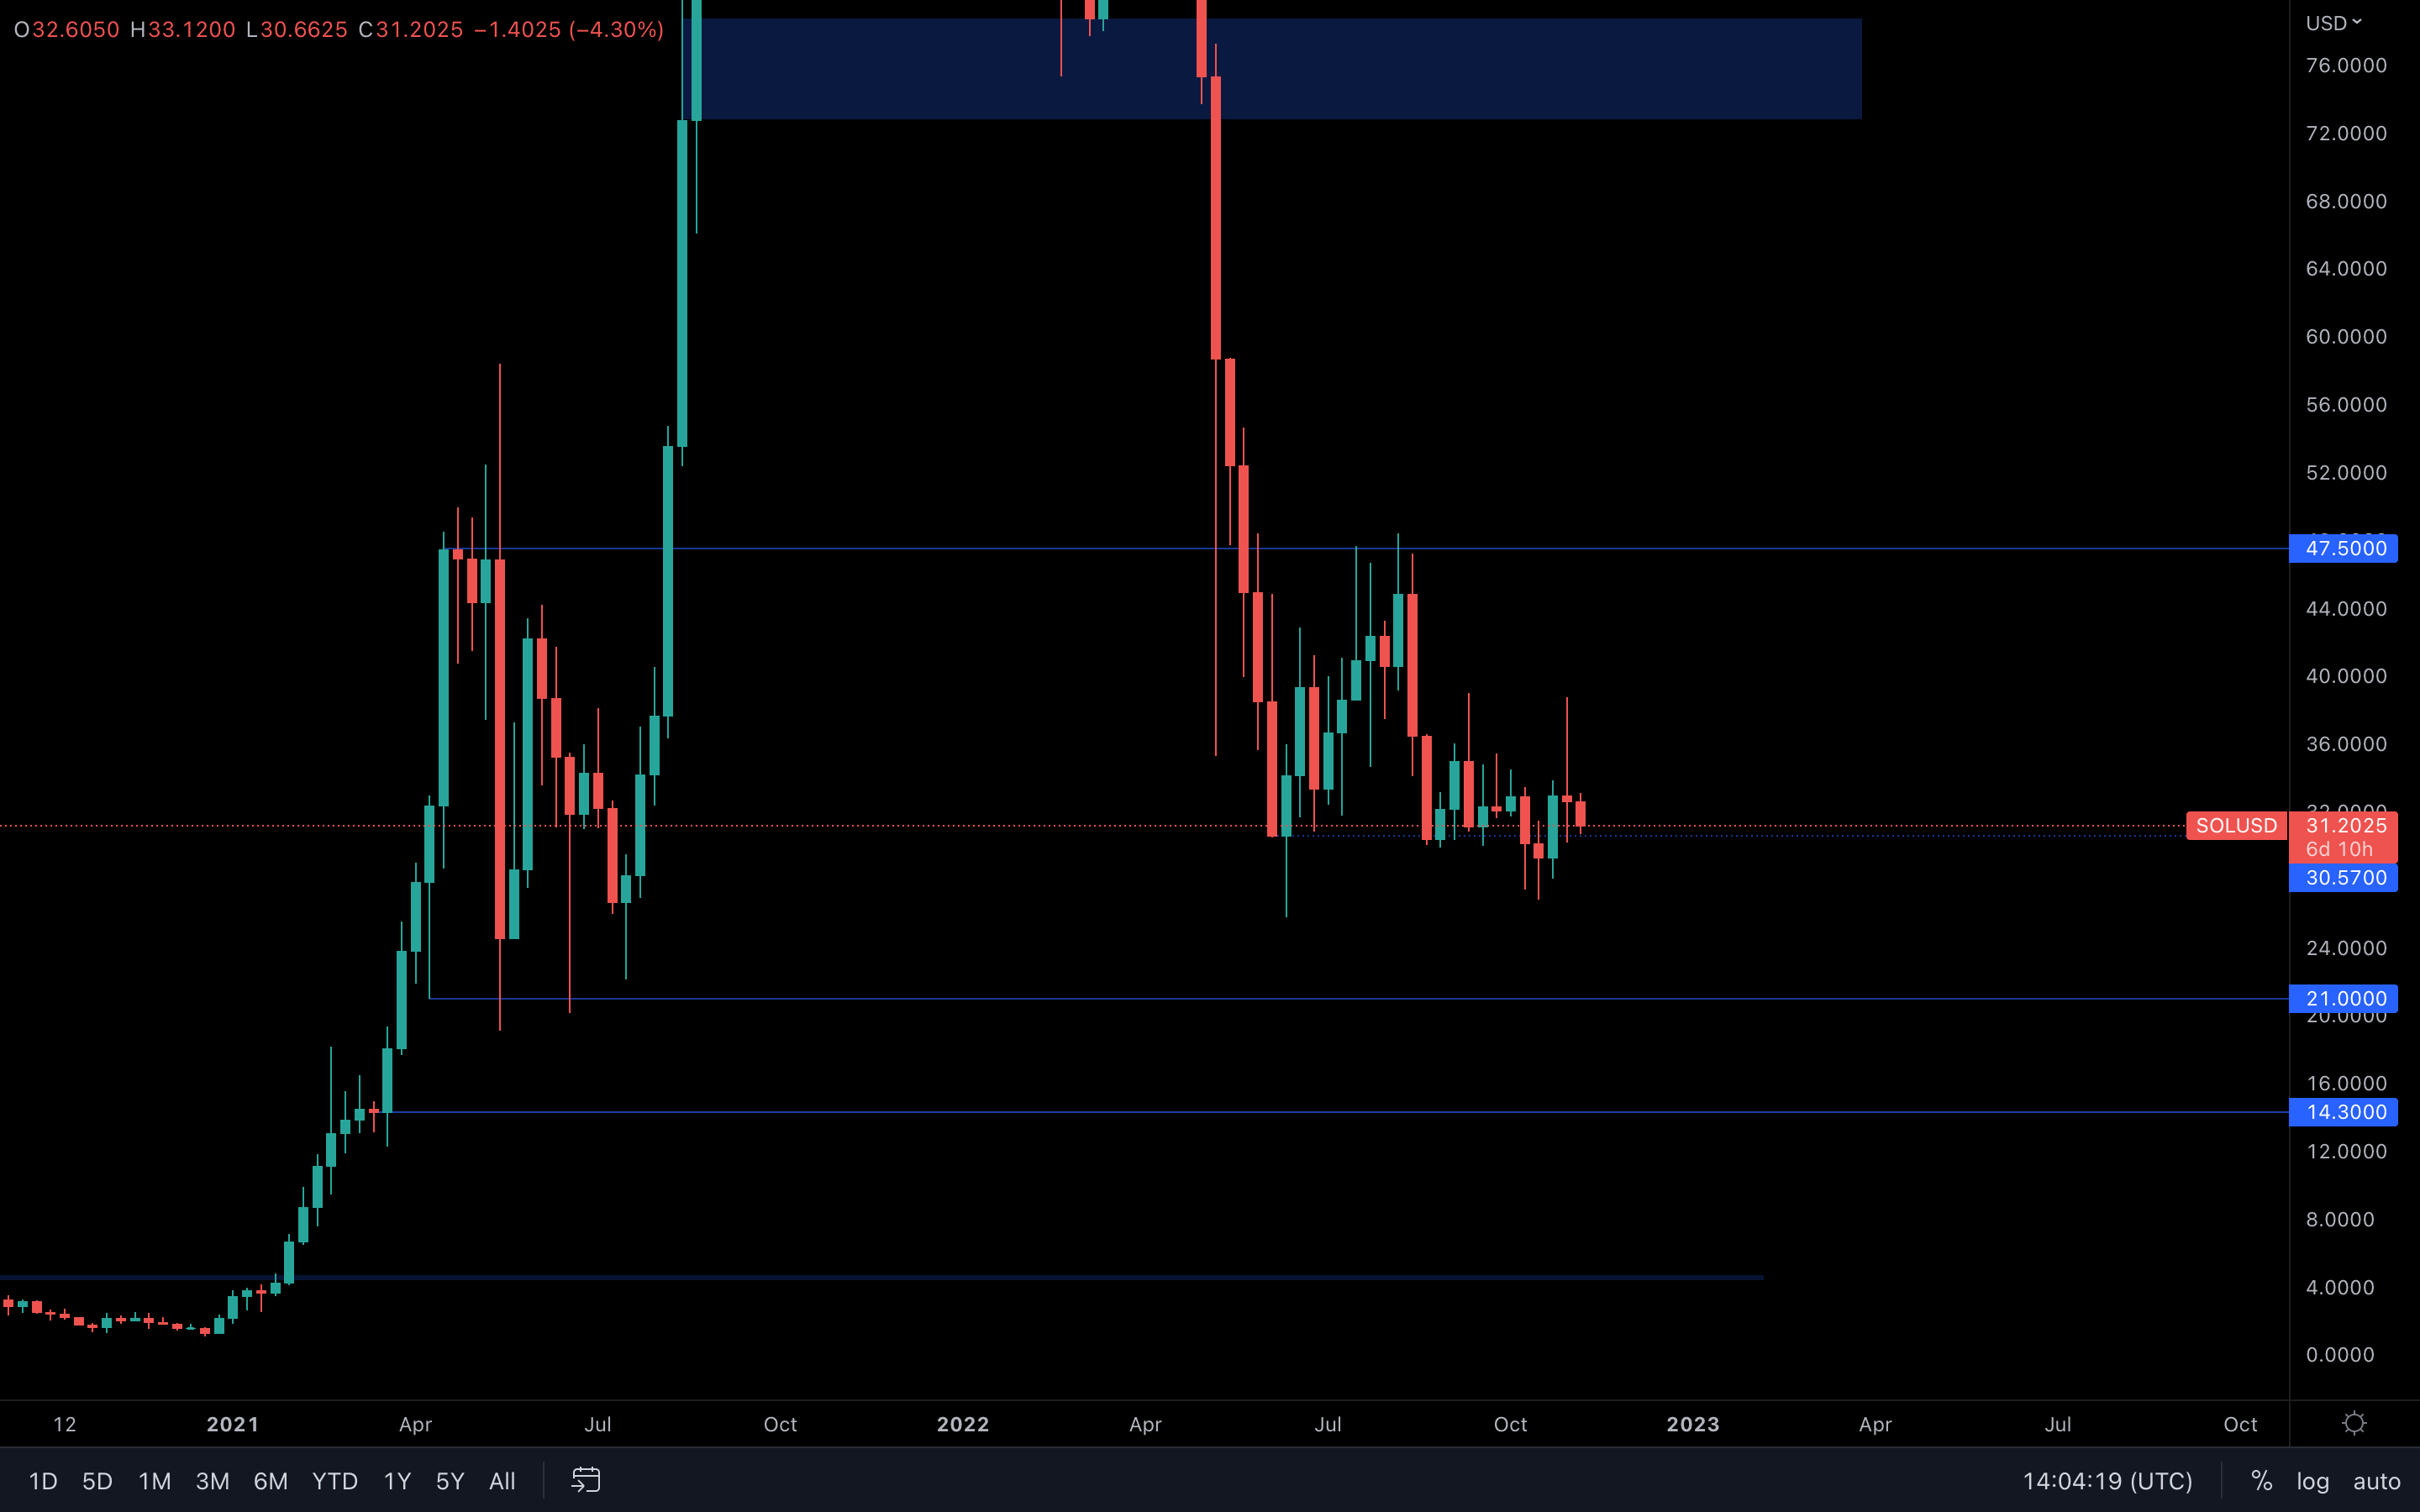 Unfortunately, SOL happens to be in the other team. Last week, a large increase in its price occurred, after which sellers completely invalidated the rise by taking over control. Probably an artificial play by the market makers, but that doesn't matter.
What matters is that the candle itself is bearish, which means more bearish momentum can follow as sellers remain in control. Until there's a shift in control (bullish candle preferably), then we wouldn't be looking at SOL for any potential long trades. There are better looking charts out there.
SRM
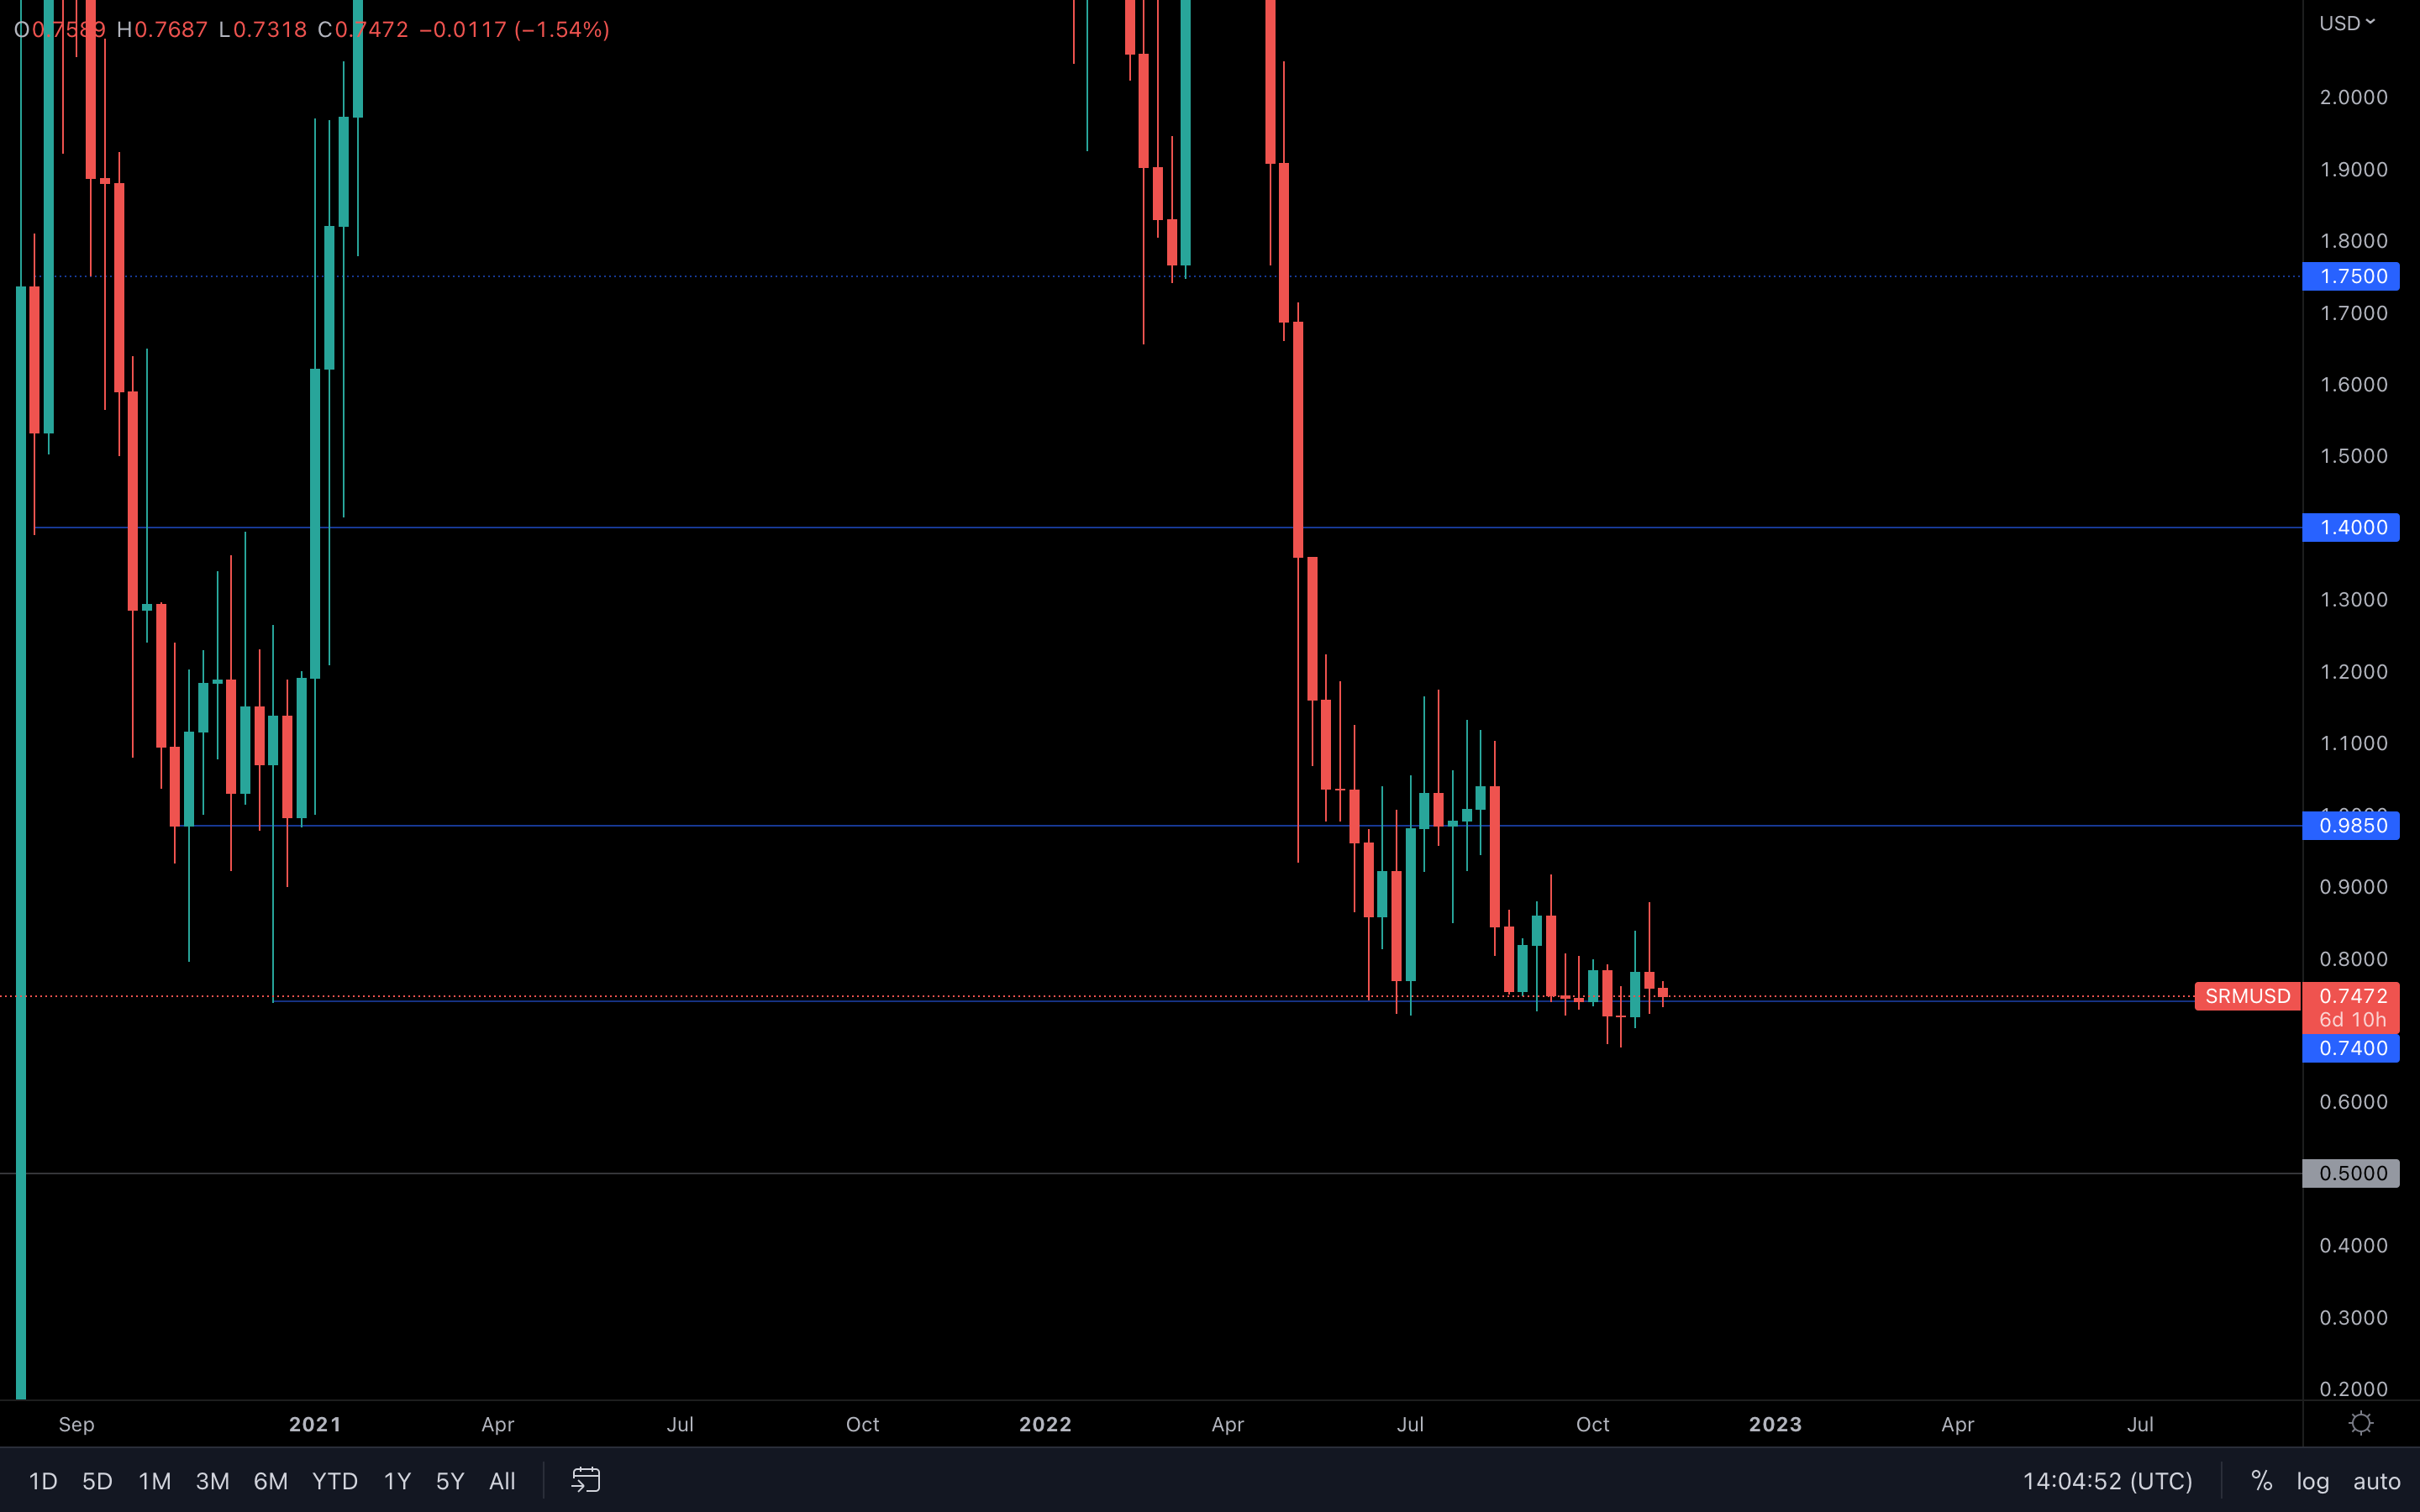 Similar price action as to that of SOL - last week, SRM registered a bearish candle as well, suggesting sellers are now in control. There is one key difference here - SRM is just above its $0.74 support level. We've monitored this level over the last months multiple times as this once acted as a threshold between higher prices and all-time lows.
There goes without saying that a loss of $0.74 isn't something we'd like to see here, otherwise the asset risks of heading toward all-time lows once more. Holding $0.74 is key.
FTT
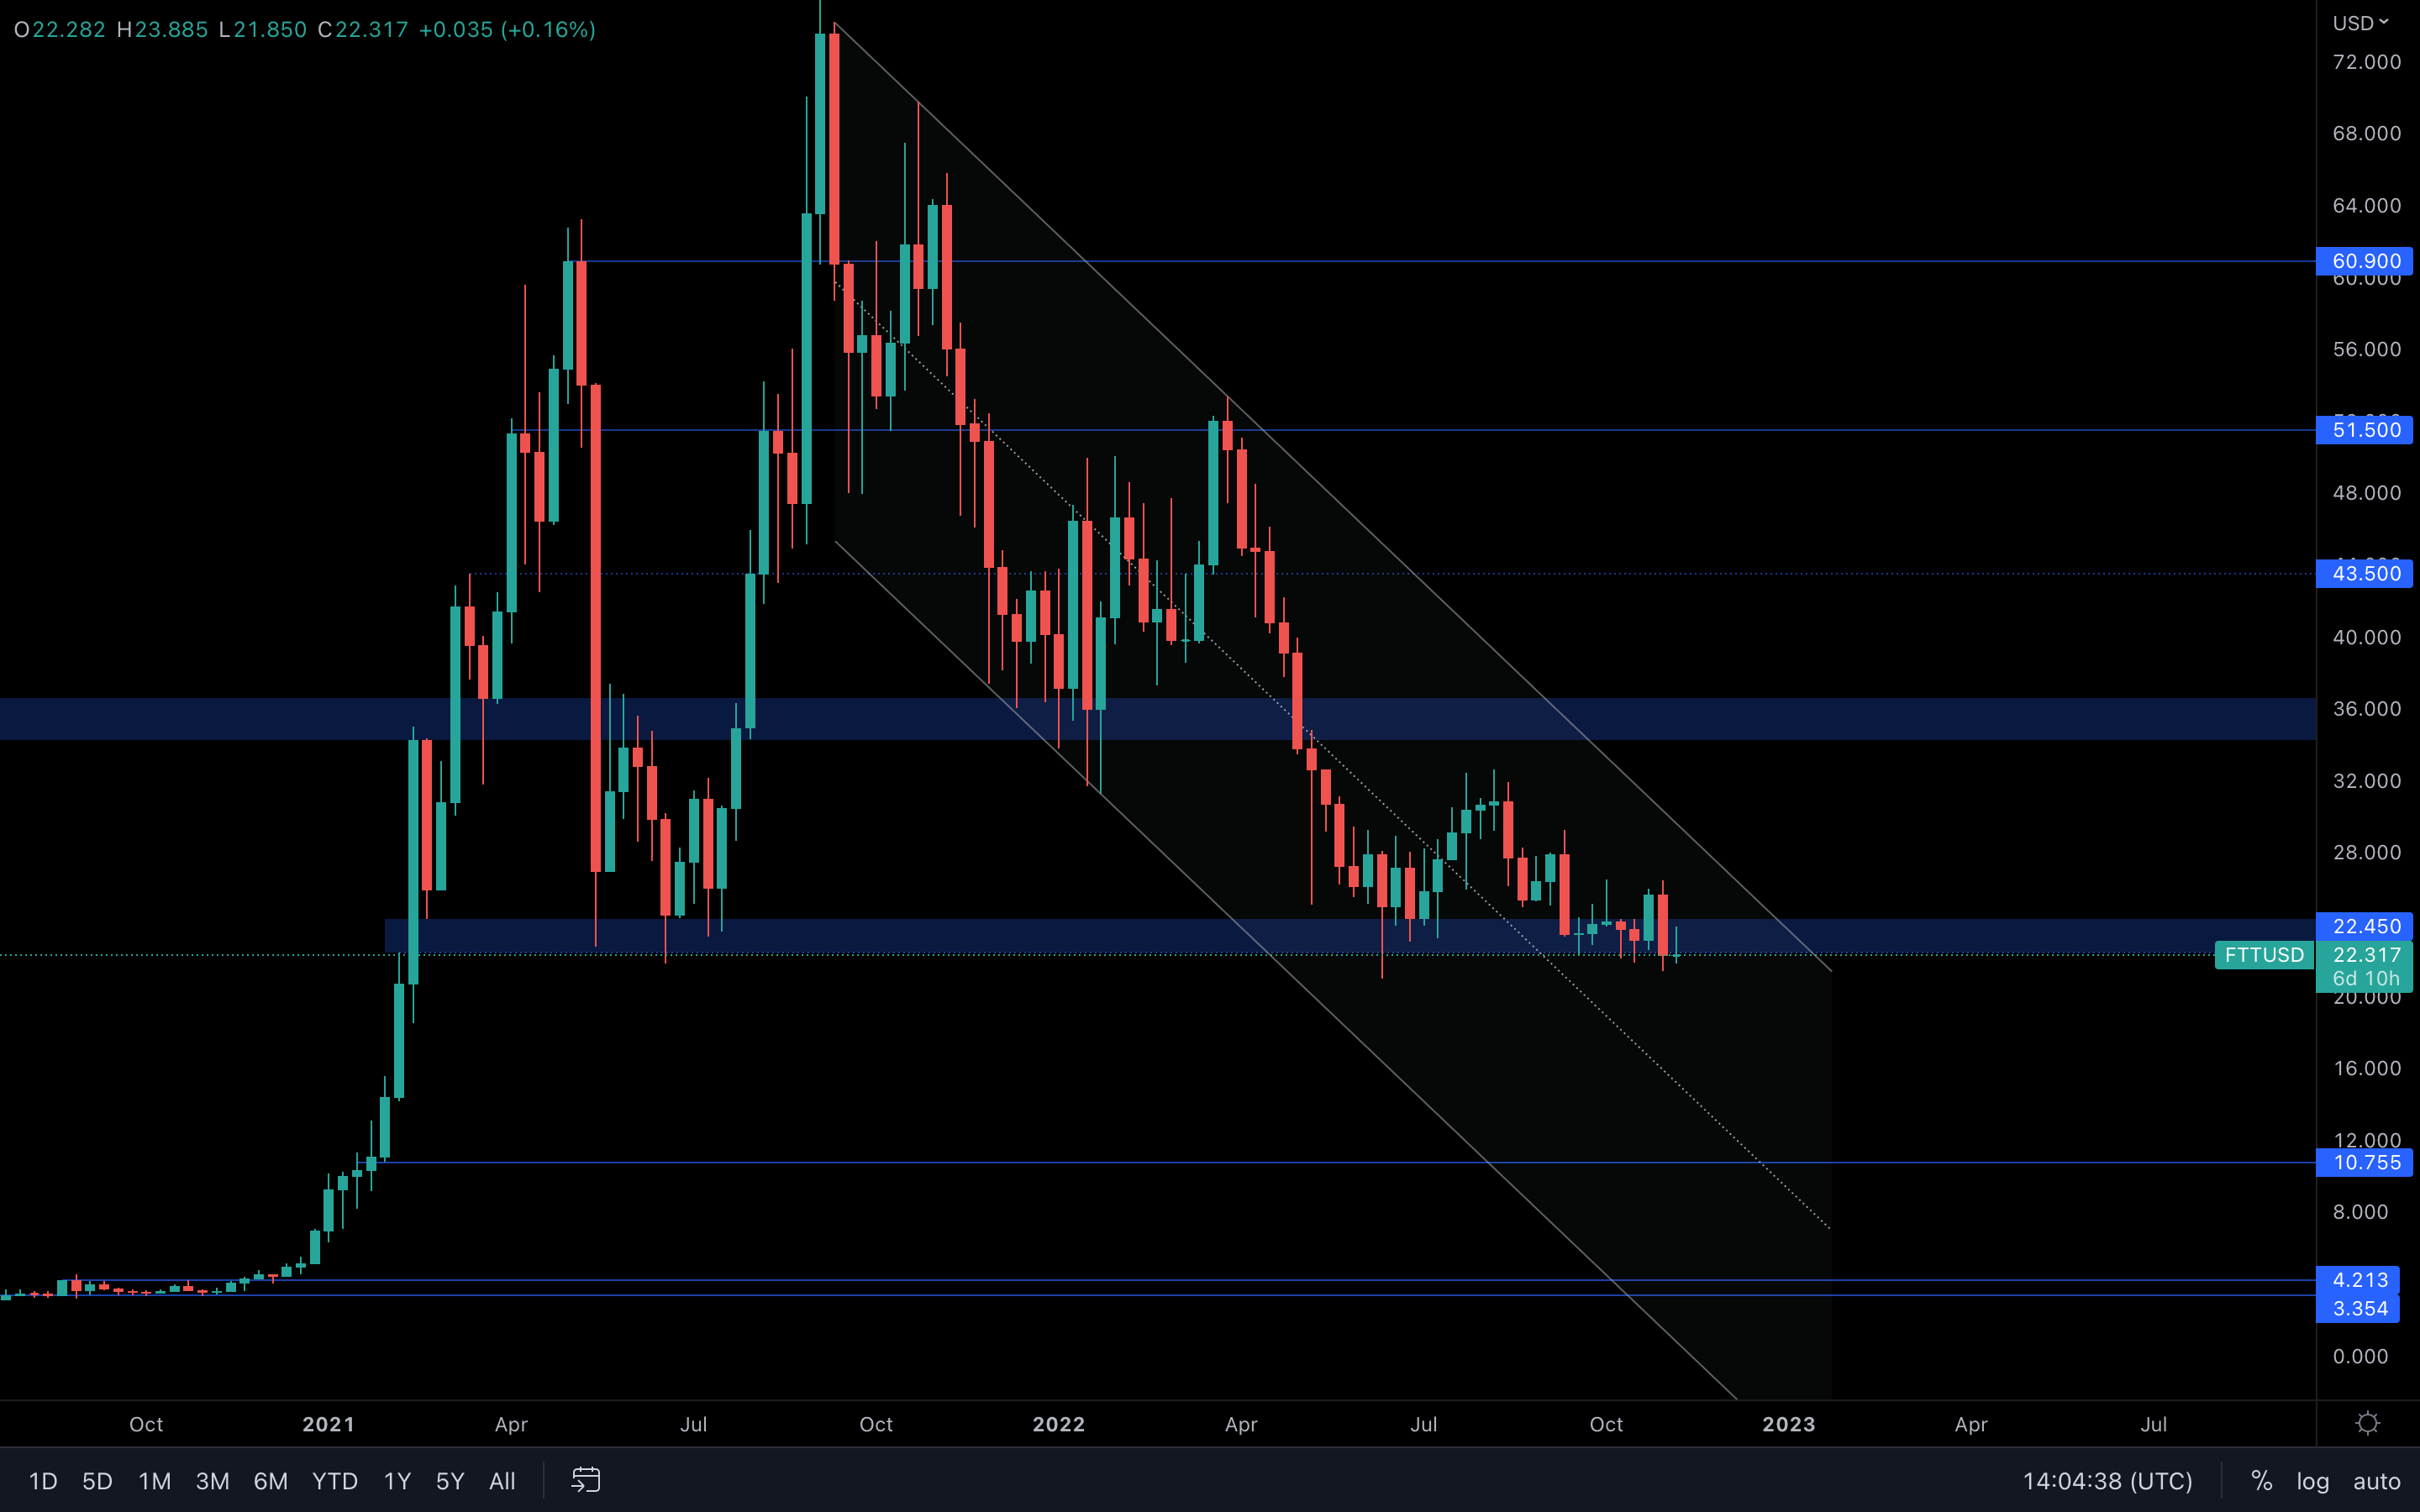 Indecision 101. Not only did FTT register a bearish engulfing candle into support, but it has also closed under $22.50. This is the first weekly closure under $22.50 since February 2021.
Failure in reclaiming this level will lead to a fast descent in FTT's price, especially with everything that's going on between FTX & Binance. News do matter.
MINA
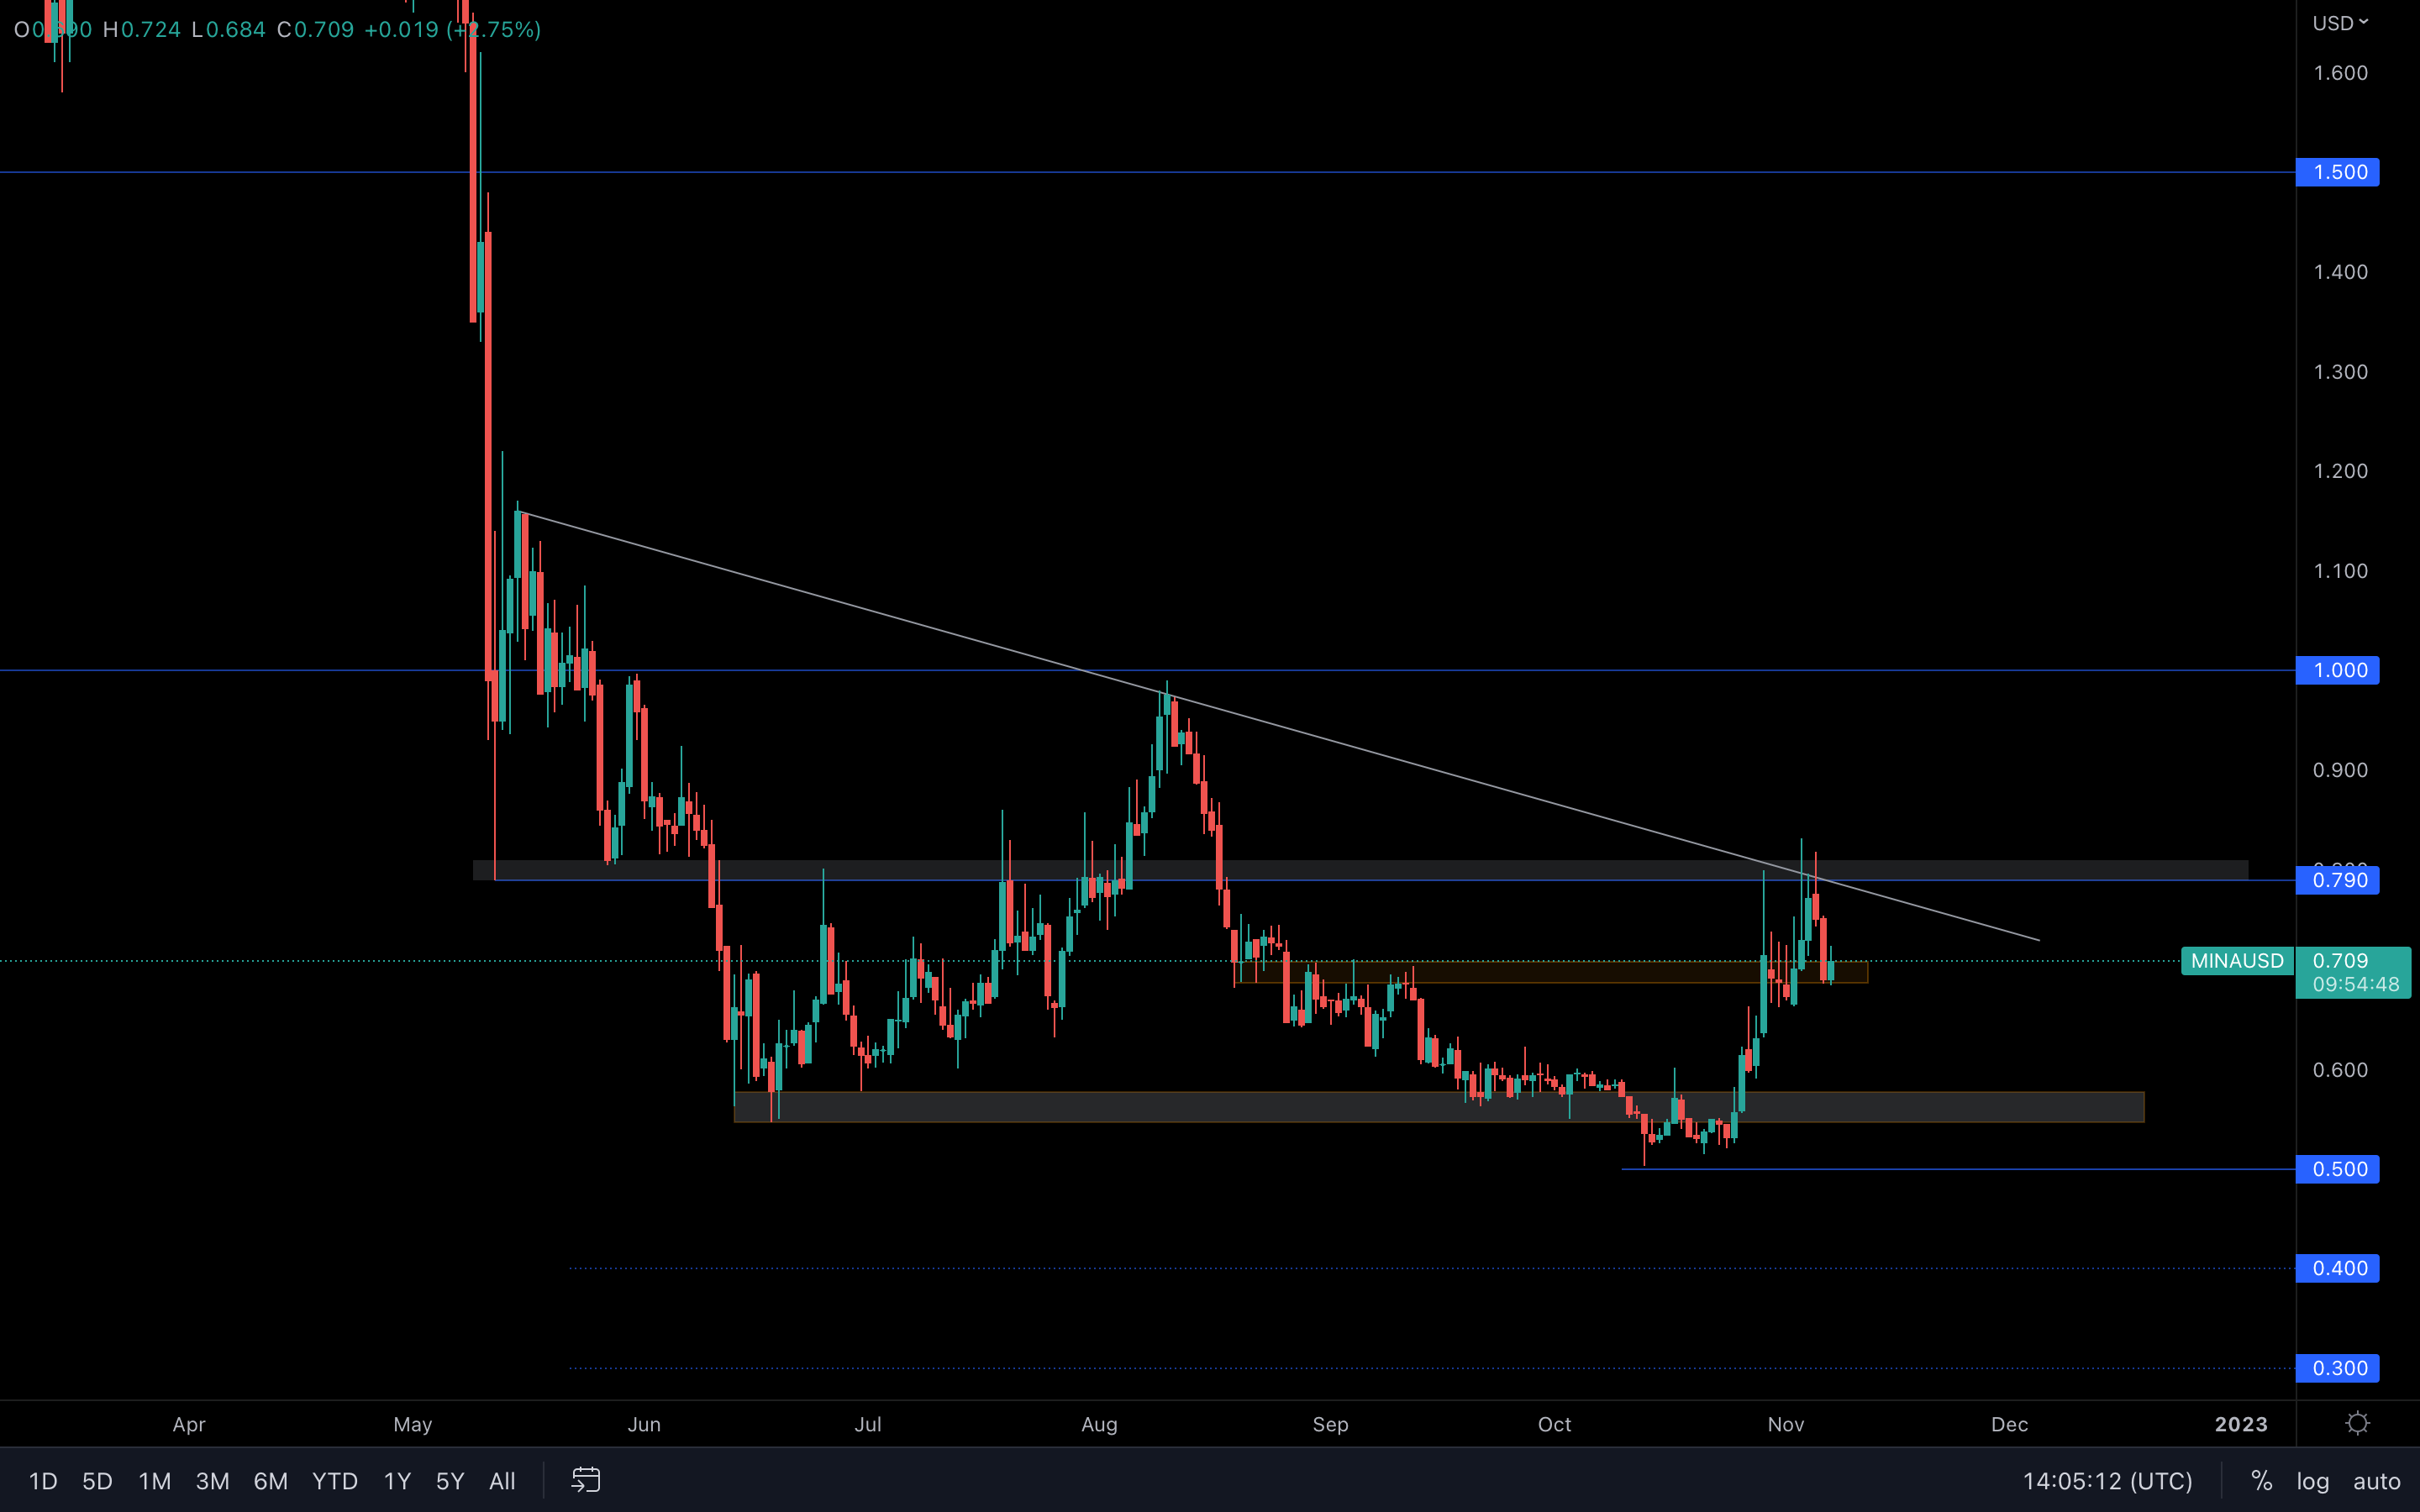 (Daily chart was used)
Two days ago, MINA tested this 6-month resistance trend line again and instantly got rejected. Now, MINA has found support at the local $0.70 level and will likely take another swing at the trend line in the coming days, if of course the majors aid this scenario by performing well.
(Daily chart was used)
Two days ago, MINA tested this 6-month resistance trend line again and instantly got rejected. Now, MINA has found support at the local $0.70 level and will likely take another swing at the trend line in the coming days, if of course the majors aid this scenario by performing well.
dYdX

"Well, what a change here. New weekly high. If it offers the opportunity, a dip to $1.50 - $1.60 may be a location to consider a long, considering how BTC looks at the time. But $2.15 has now come into play." This message was sent in our Discord (#pro channel) a week ago. $1.50 - $1.60 was indeed a good location to consider a long, and $2.16 had indeed come into play.
Because we've witnessed strong selling pressure upon testing $2.15, we can only assume sellers remain in control. For this week, expect dYdX to retest the $1.50 - $1.60 once more.
Summary
Several of the metrics are showing that Bitcoin is in “cheap” value territory. Now, address metrics are beginning to also show signs of this, and there has been some carry through in that there is some accumulating taking place although the cautious approach is still the more dominant one. This week we have a sign that the largest Bitcoin wallet cohort has seen a significant increase in its risking-on and this is something that can’t be ignored. A sub $20,000 Bitcoin should be seriously considered for beginning a Dollar-Cost-Averaging strategy, although a 20-30% flush of the lows still can’t be ruled out, it is looking increasingly less likely.Recommended from Cryptonary


