Save 23% ($351) & Get a Free 1-1 Call with our Team ⏰ : 0d 2h 59m 43s

Disclaimer: Not financial nor investment advice. You are responsible for any capital-related decisions you make, and only you are accountable for the results.
Macro/FTX
This past week has been one of the more chaotic weeks with the collapse of FTX. This was highly unpredictable, and we feel for all those that may have been affected.The news that FTX was using customer deposits to fund external investments has created a great sense of fear and mistrust in the space which has led to assets dramatically selling off. Assets may also be selling off due to contagion fears although CZ (Founder and CEO of Binance) took to a Twitter space today (14/11/2022) to say that he/Binance has not heard big cries for help from portfolio companies.
On the macro side of things, last week Inflation data came in considerably less than expected. This saw the Nasdaq and the S&P have one of their best-ever daily gains as the markets became excited about seeing a decrease in the Core Inflation Rate YoY – possible peak Core Inflation.
TLDR
- This past week’s FTX blowup has seen crypto prices trade considerably lower.
- There have been significant outflows from Exchanges most likely due to a greater emphasis now being placed on the self-custody of coins.
- The Coin Days Destroyed metric shows a small spike that was generated from short-term holders. Long-term holders are remaining highly convicted to continue holding their coins.
- Several significant on-chain market indicators suggest that Bitcoin is in deep value territory.
- In the past week, much of the leverage on Exchanges has decreased, finally showing a change in sentiment for leverage.
DXY (U.S. Dollar Index)
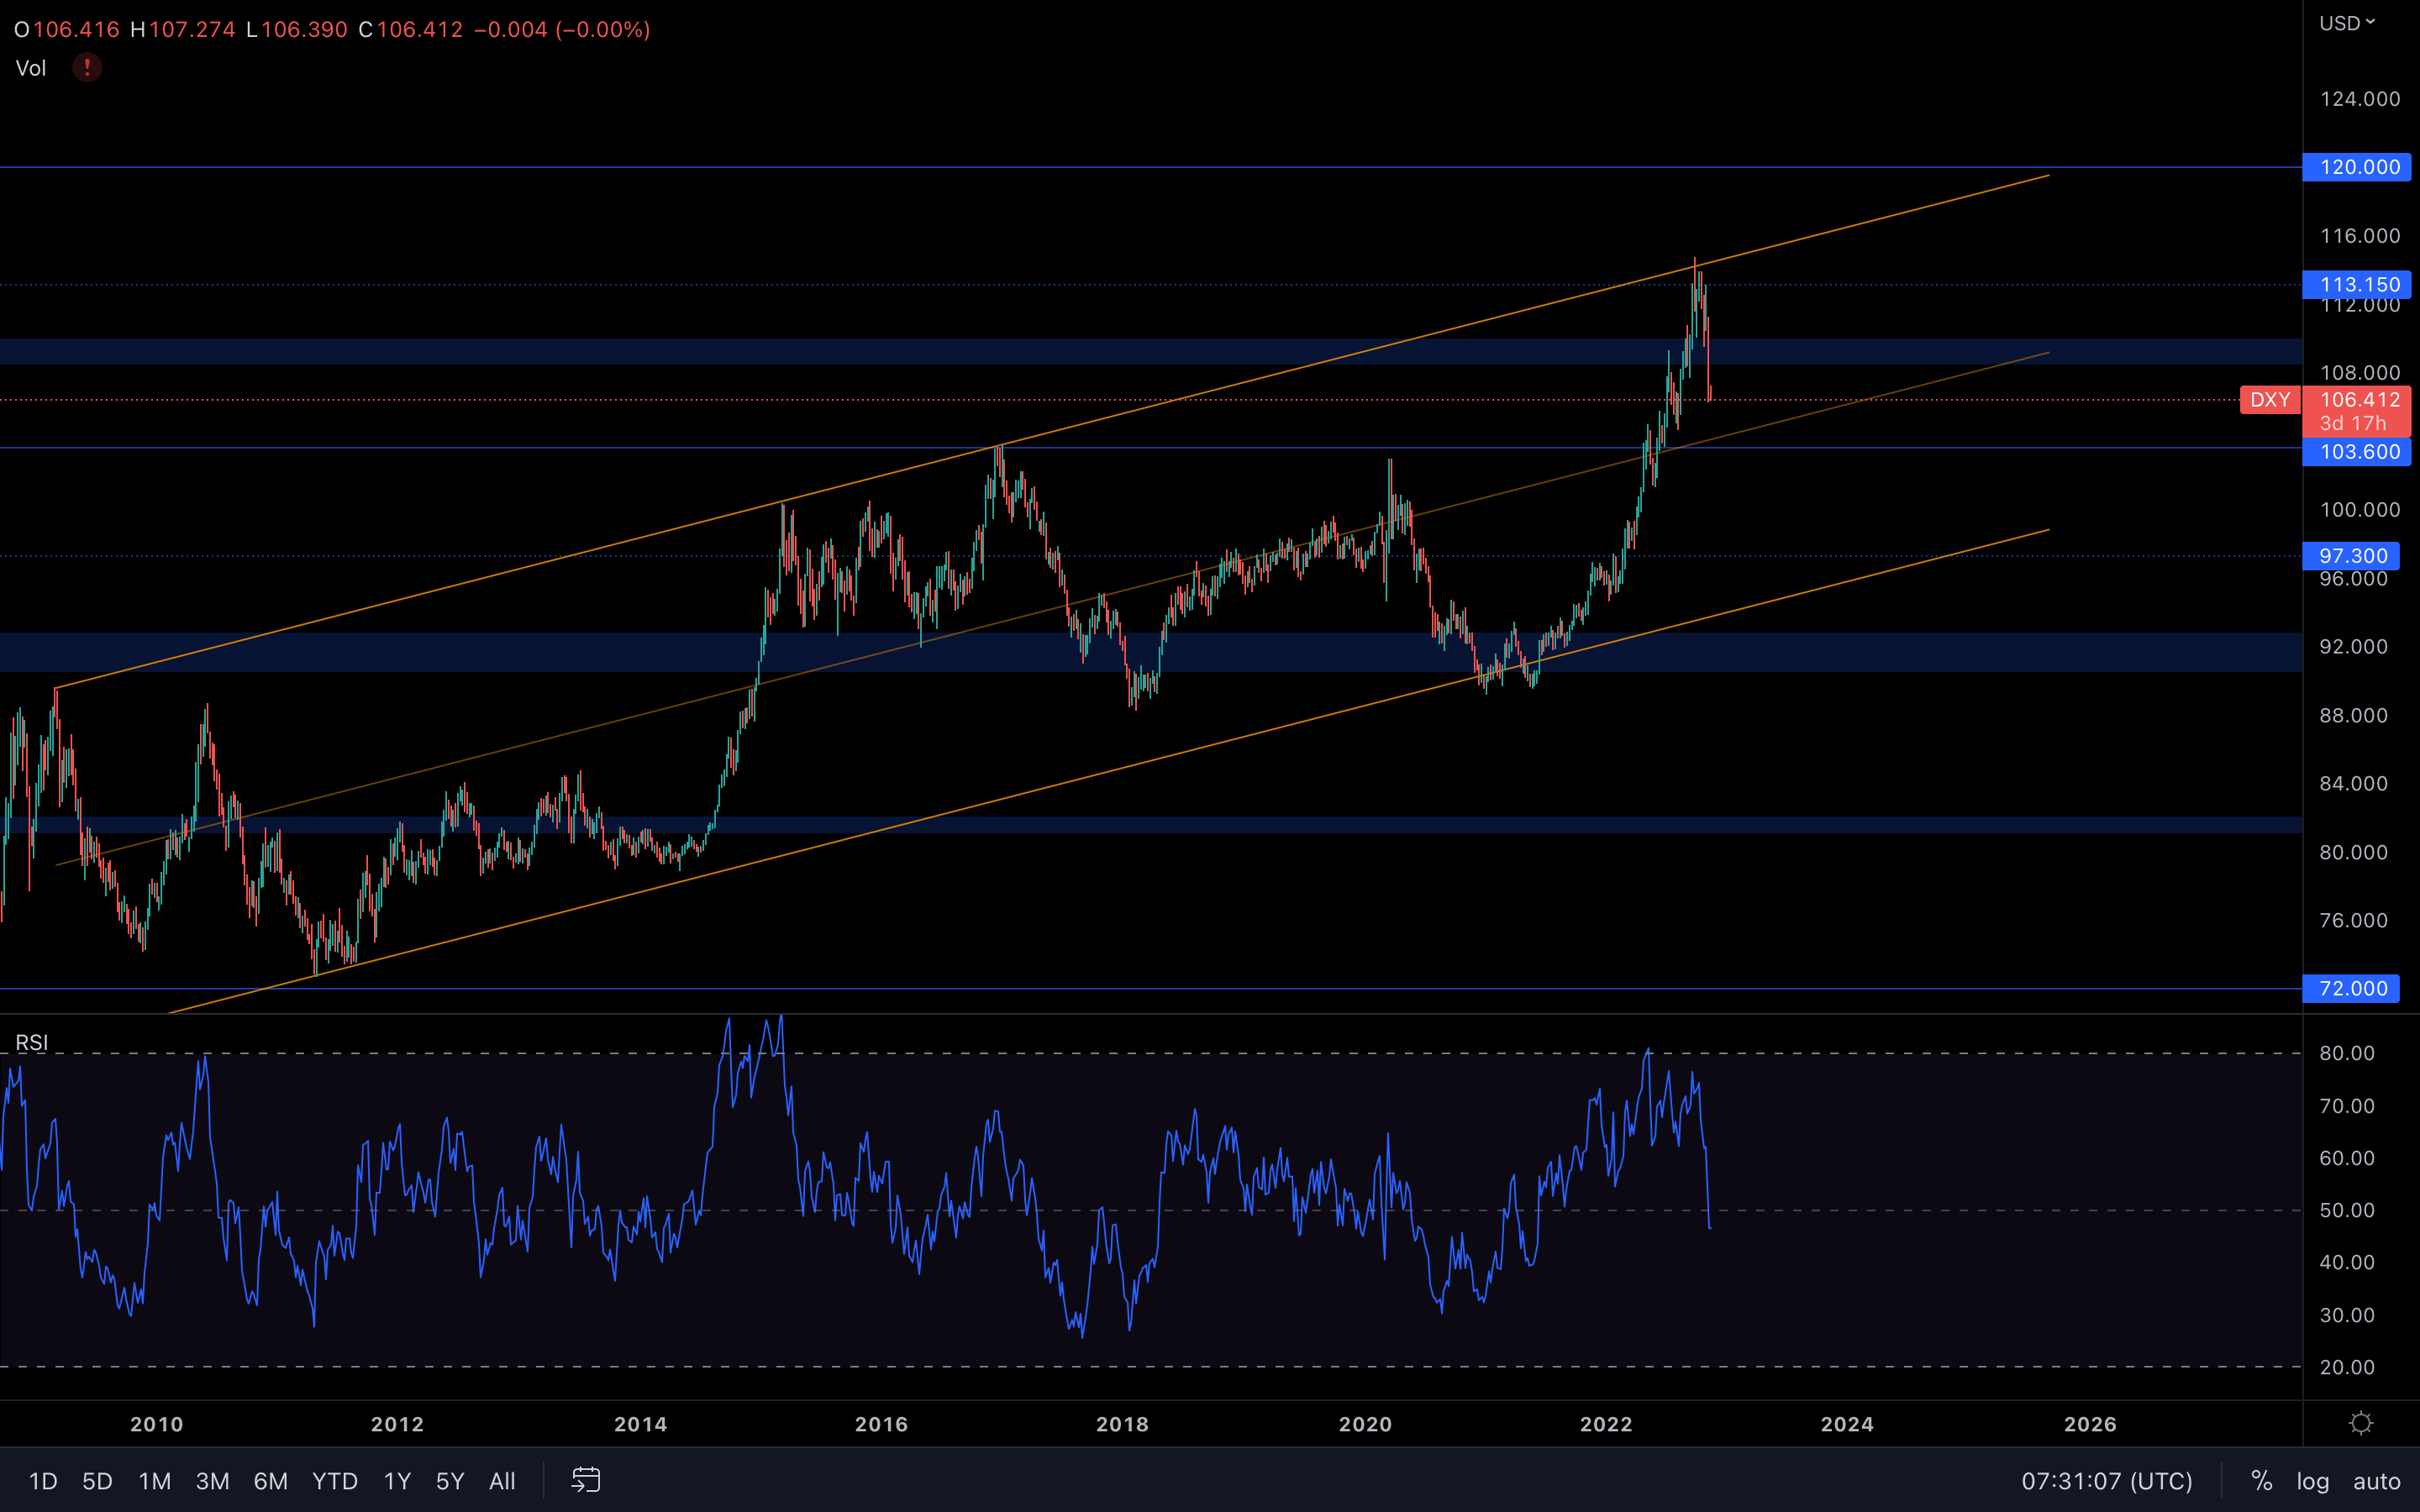 The Relative Strength Index (RSI) indicator seems to have taken a hit after last week's unfortunate turn of events. This suggests that the index is now in normal territory once more - it's neither oversold nor overbought. We can see that the $108 support has been lost, which implies a $103.6 test is on the cards this week or later.
As we know, a descending DXY usually comes with both an ascending crypto market and an ascending S&P 500, something which we can already see happening on the SPX chart below.
S&P 500 Index
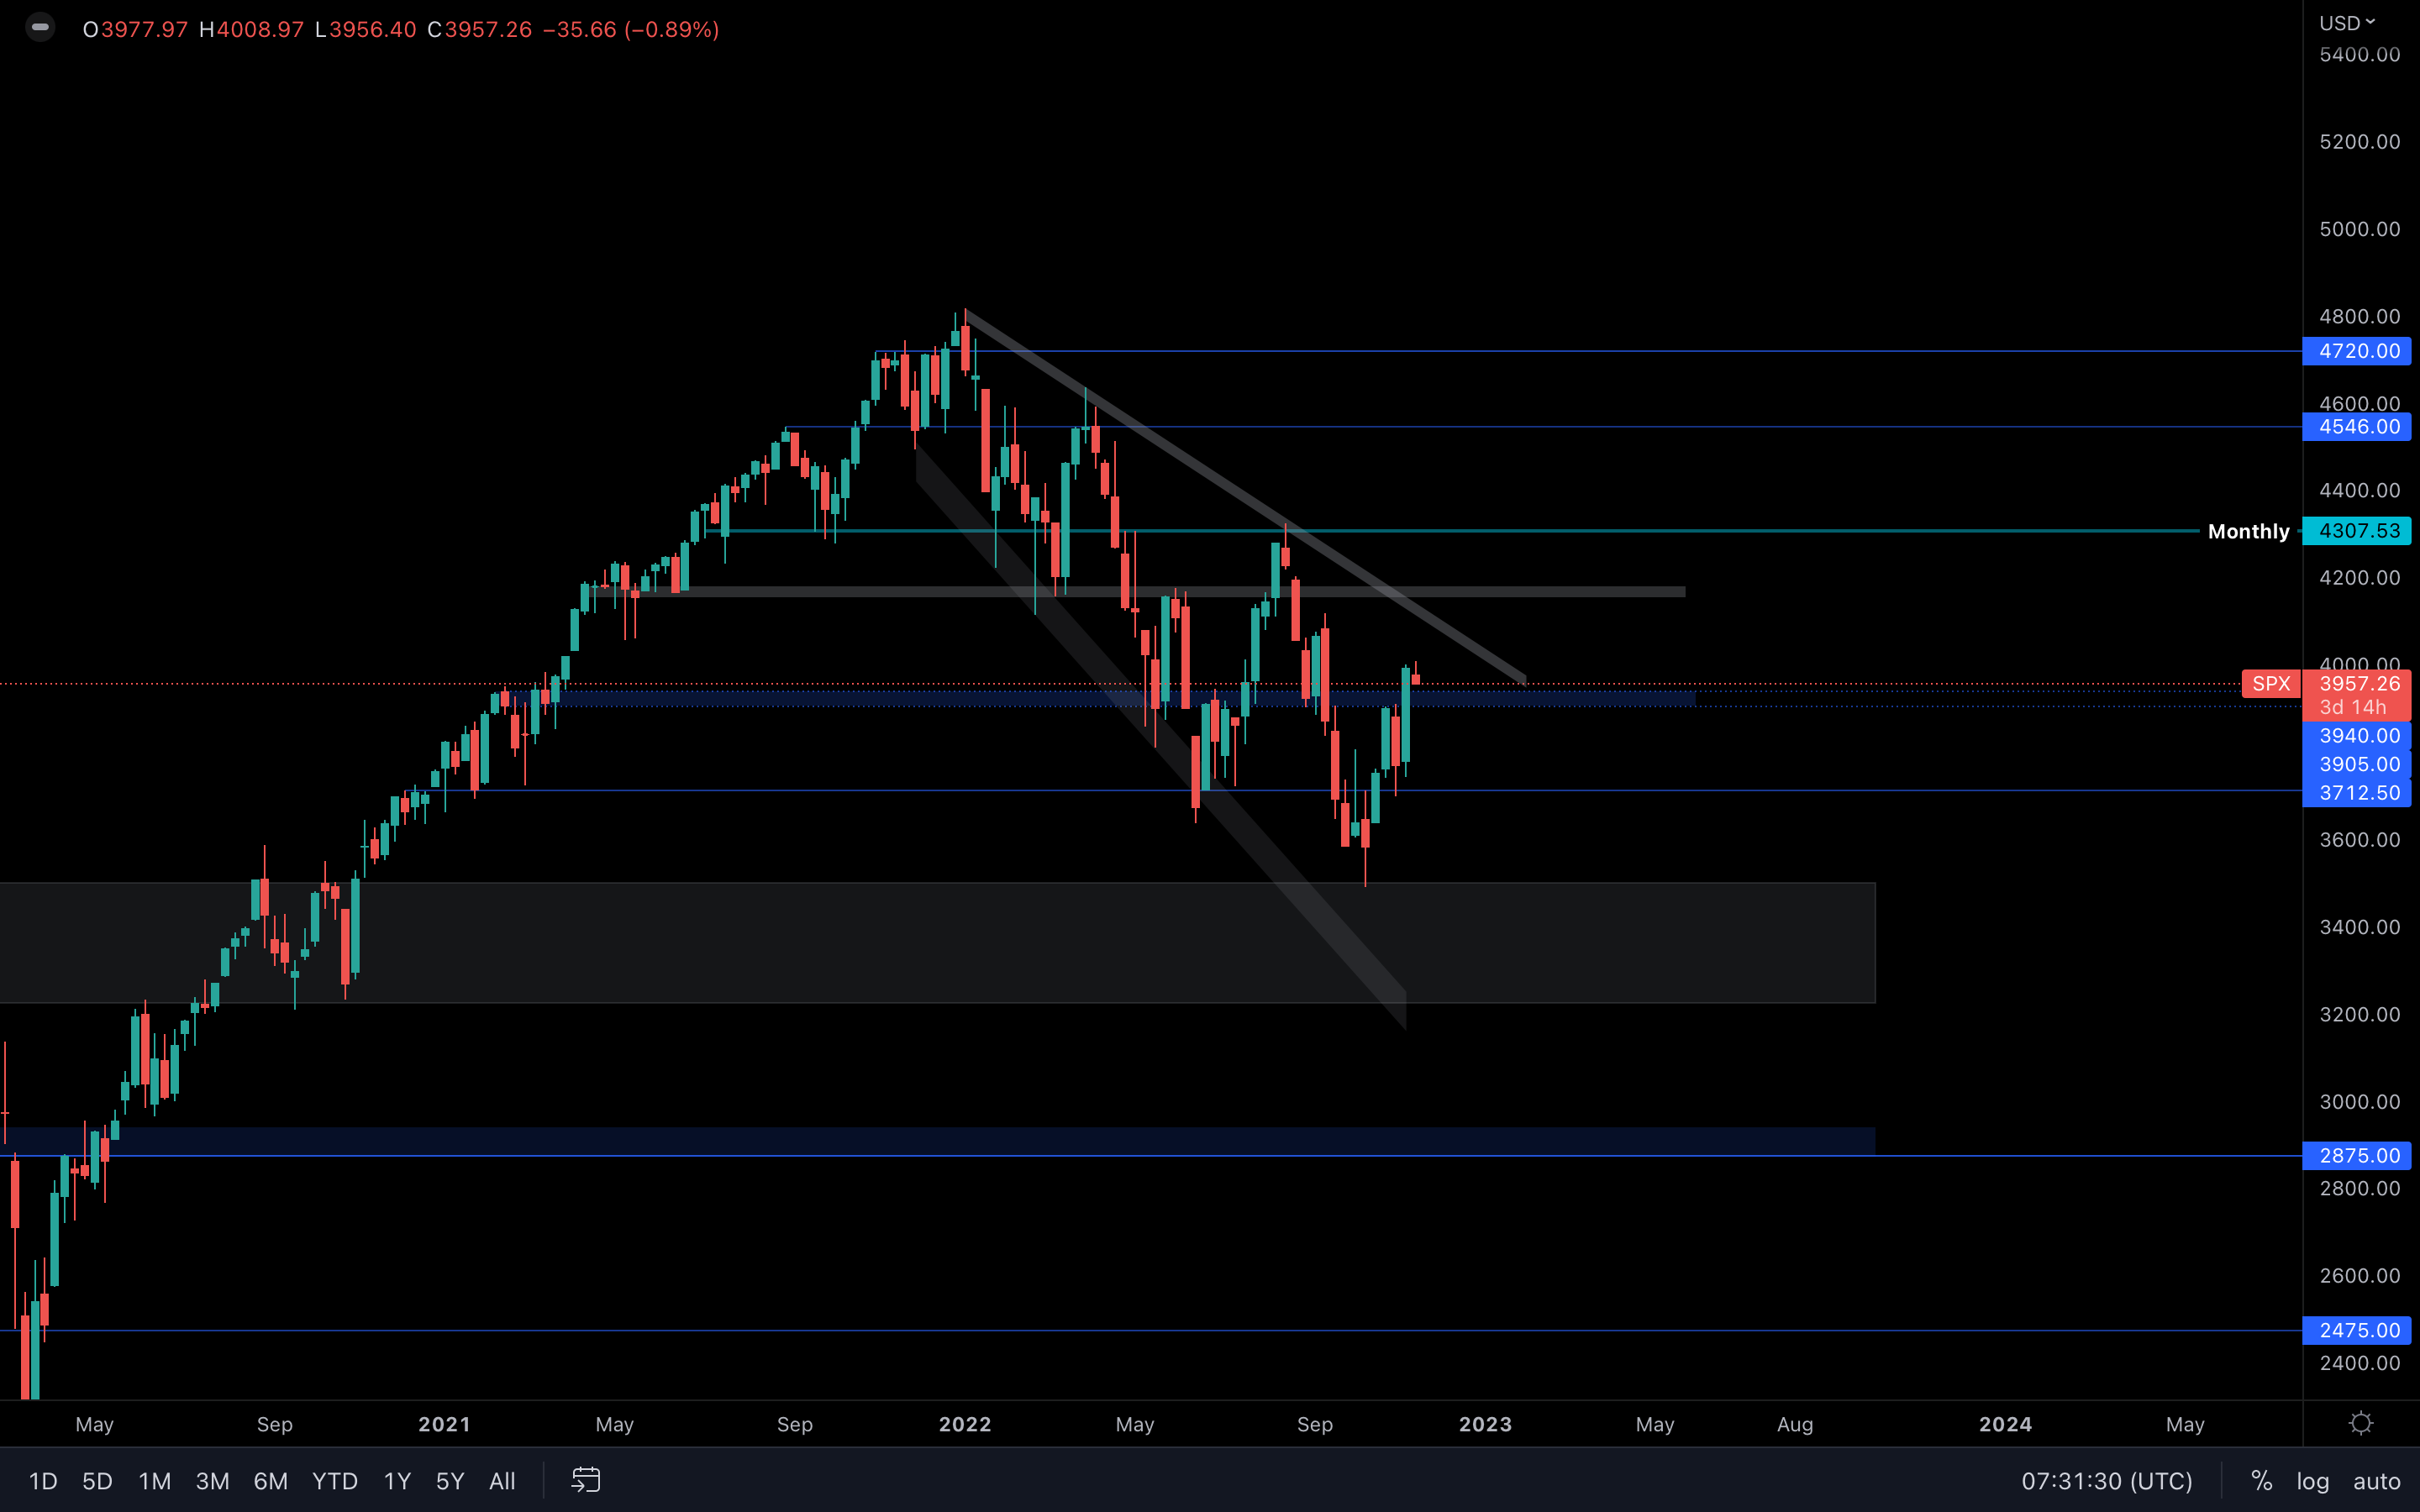 The index has registered a bullish engulfing candle on the weekly timeframe that also closed above the $3900 - $3940 weekly resistance area. This means that the same area has now been turned into support. If that holds, the index can test the top trend line of this descending broadening wedge.
As to if we'll see a break to the upside, that remains uncertain. On the other hand, a top trend line test is likely.
Total Market Cap
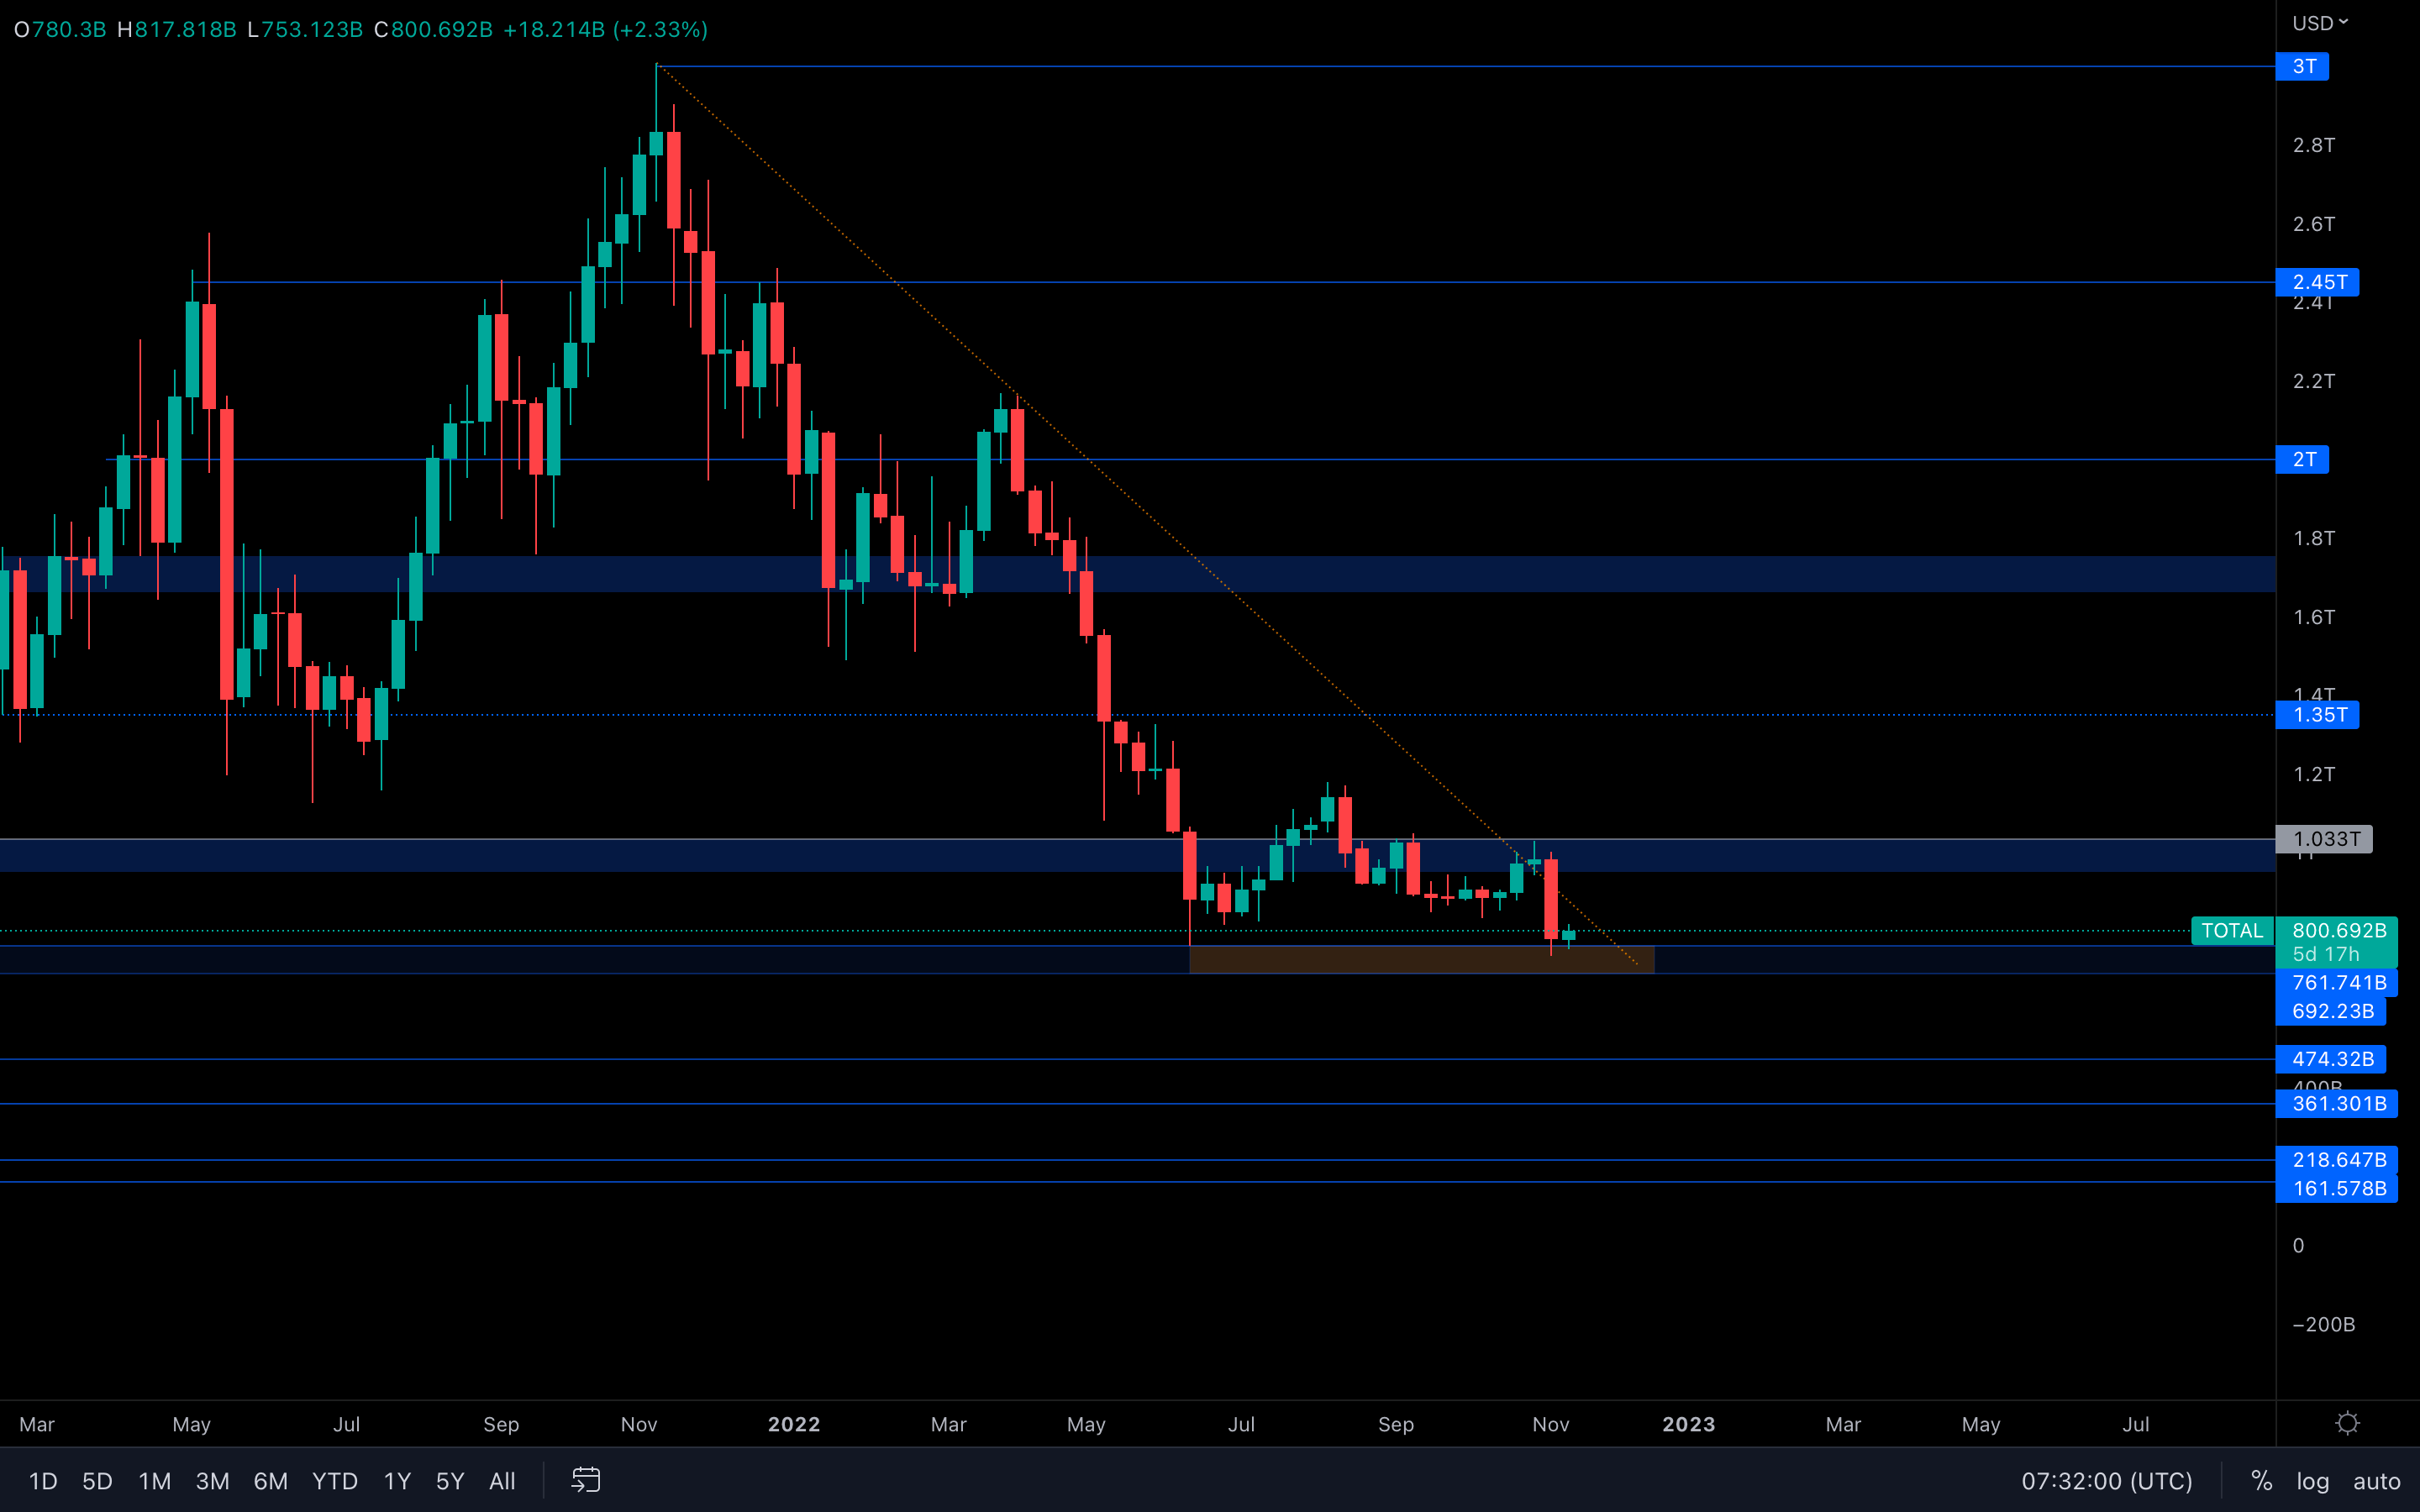 The Total Market Cap has been rejected upon testing $1.03T, and because of the recent turn of events, the index has been pushed back to its June lows. From a technical standpoint, we did form a lower low on the weekly timeframe here, by both candle & wick. The market structure remains unchanged, but the index has also found itself above the 2018 all-time high - this suggests that we do have some major support under the current price and that a price increase from here is likely.
Nothing major can be expected, the market has taken a solid hit last week, and investors' trust has been stained. Although a recovery seems unlikely this fast, we can still see the market rise at the same pace as before the FTX incident - it's just not going to be anything of major importance because we'll encounter difficulties in breaking certain resistance levels, such as $1.03T.
Altcoins Market Cap
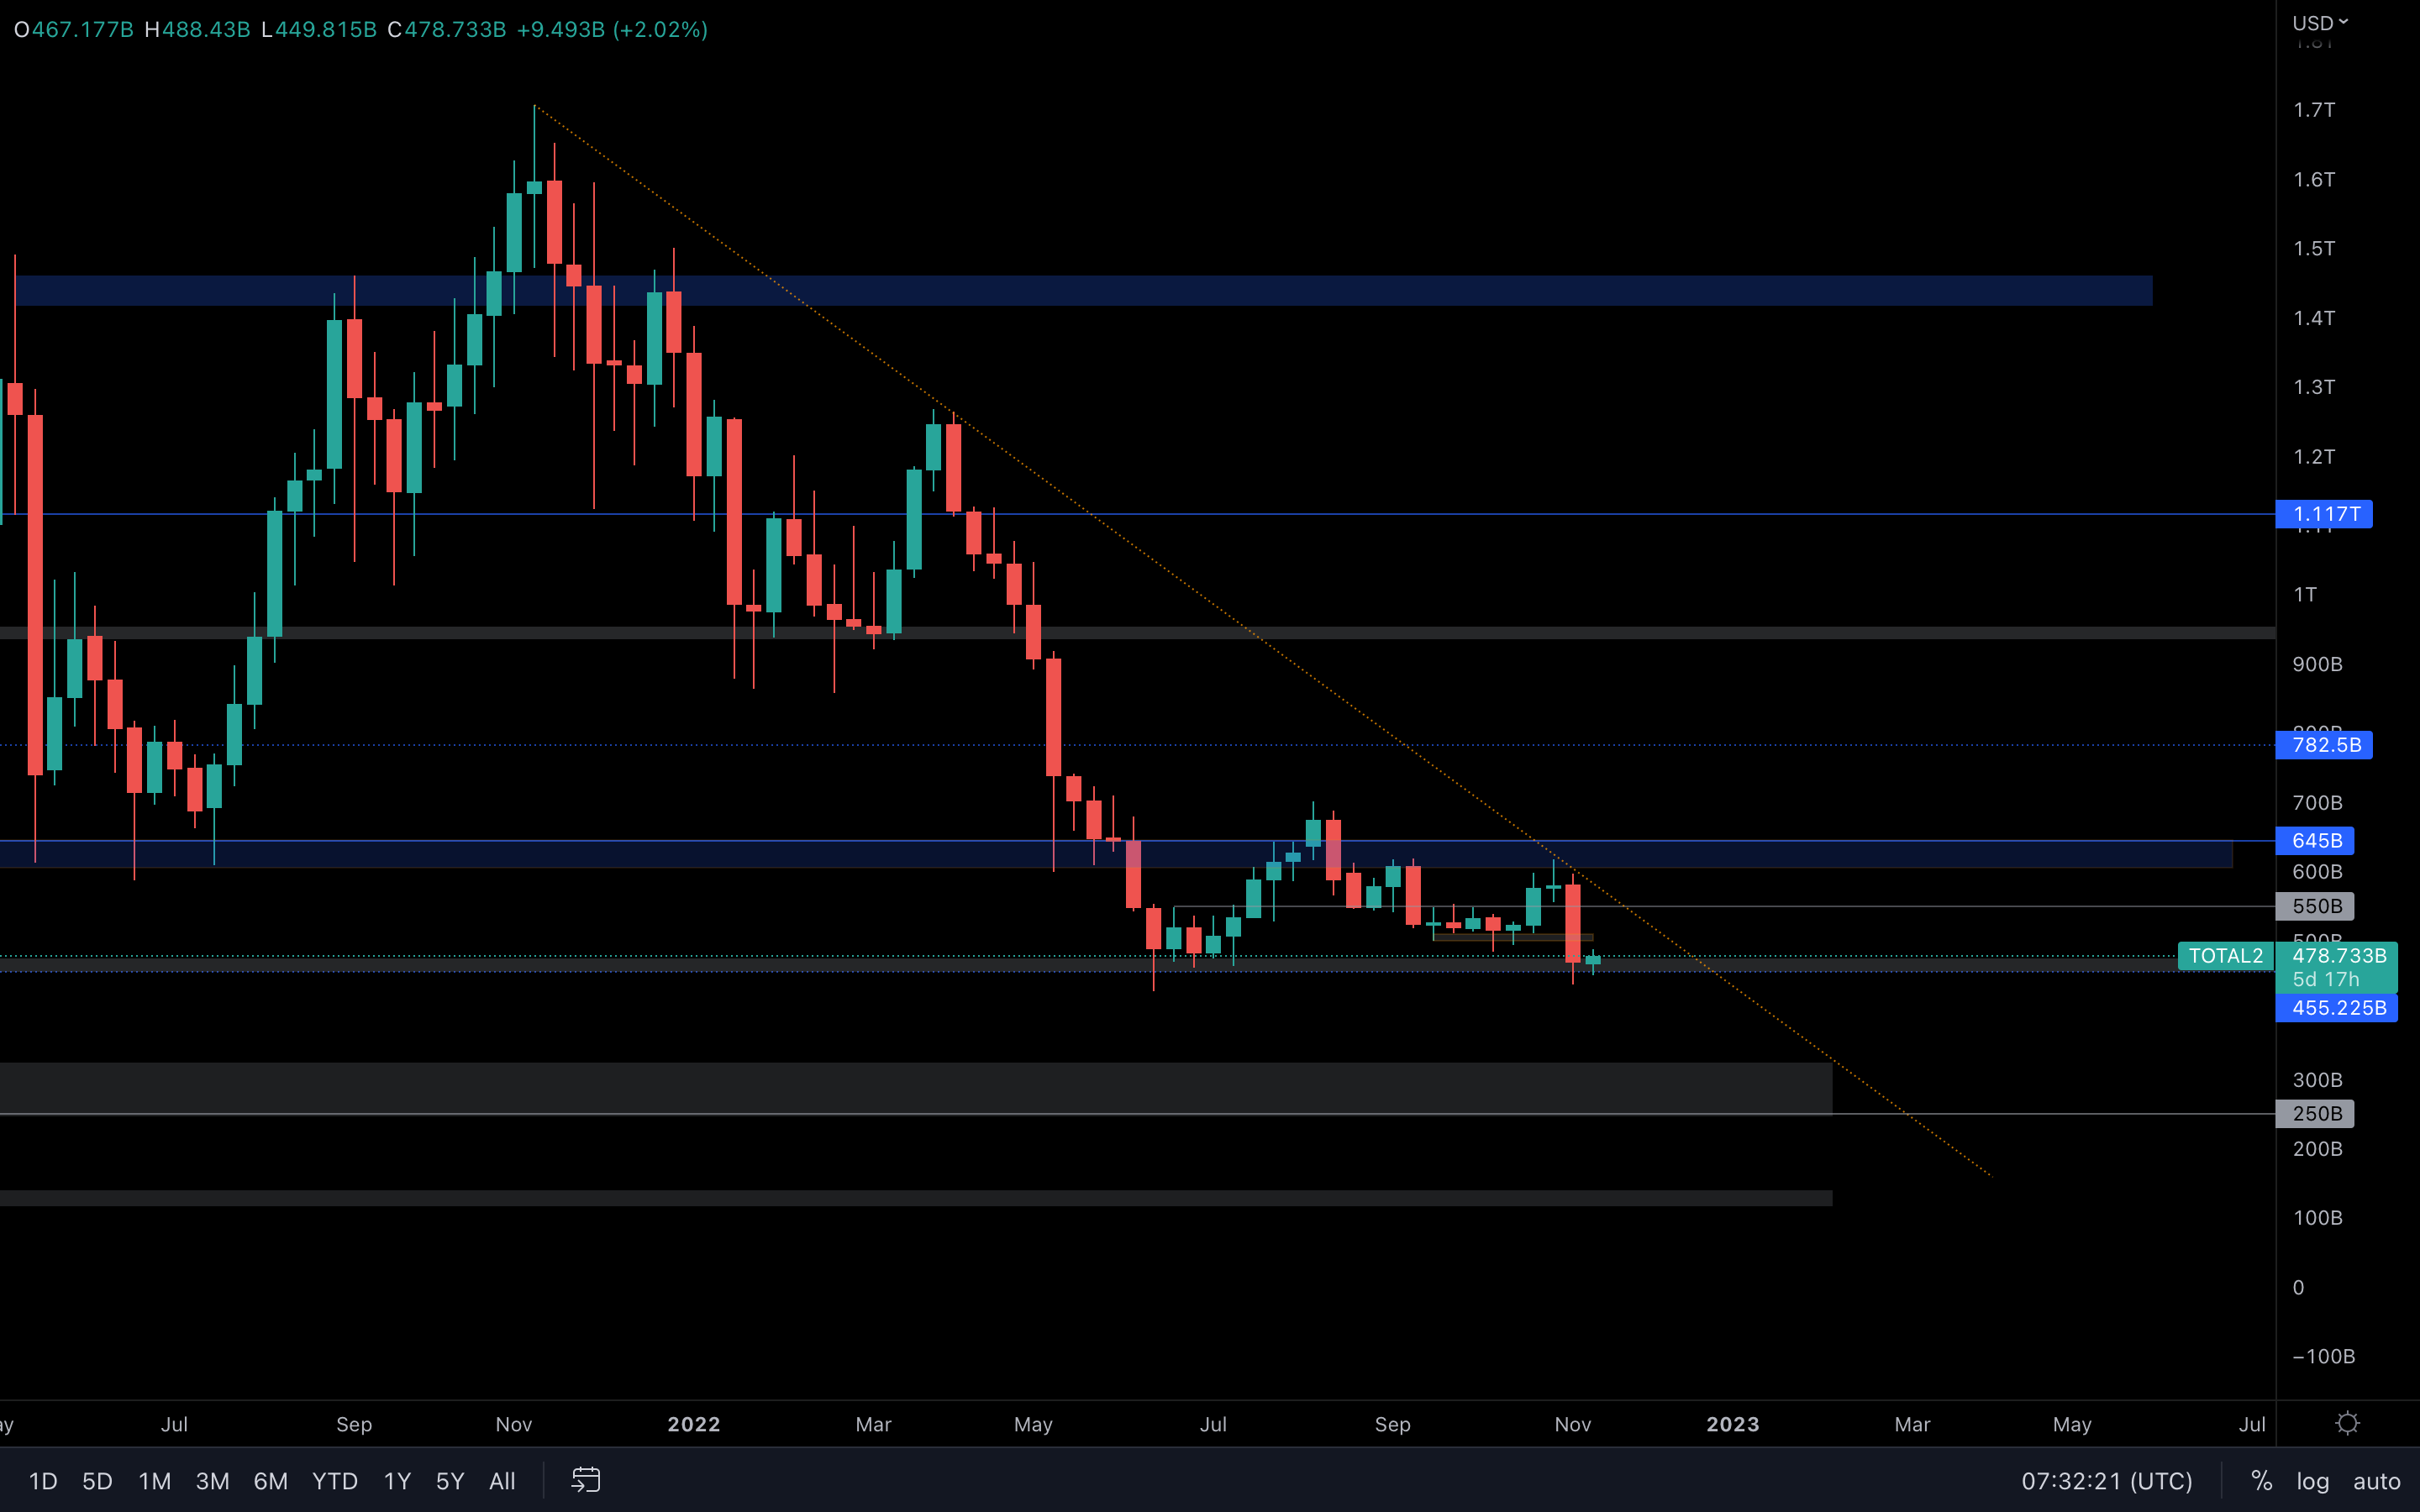 The Altcoins Market Cap has also seen a rejection from this weekly resisting trend line, followed by a $450B support test. In this scenario, the index hasn't registered a new low, which means the current support area should hold. We should look at this from the following perspective:
Even with the market taking a huge hit after last week's events, the Altcoins MCap index still managed to hold itself above its June low. This suggests that buying pressure is still present around that level and that buyers are not going to lose this level just yet.
As long as $450B holds, then we could see $550B being tested soon.
Bitcoin - Technical & On-Chain Analysis
 (Daily chart was used)
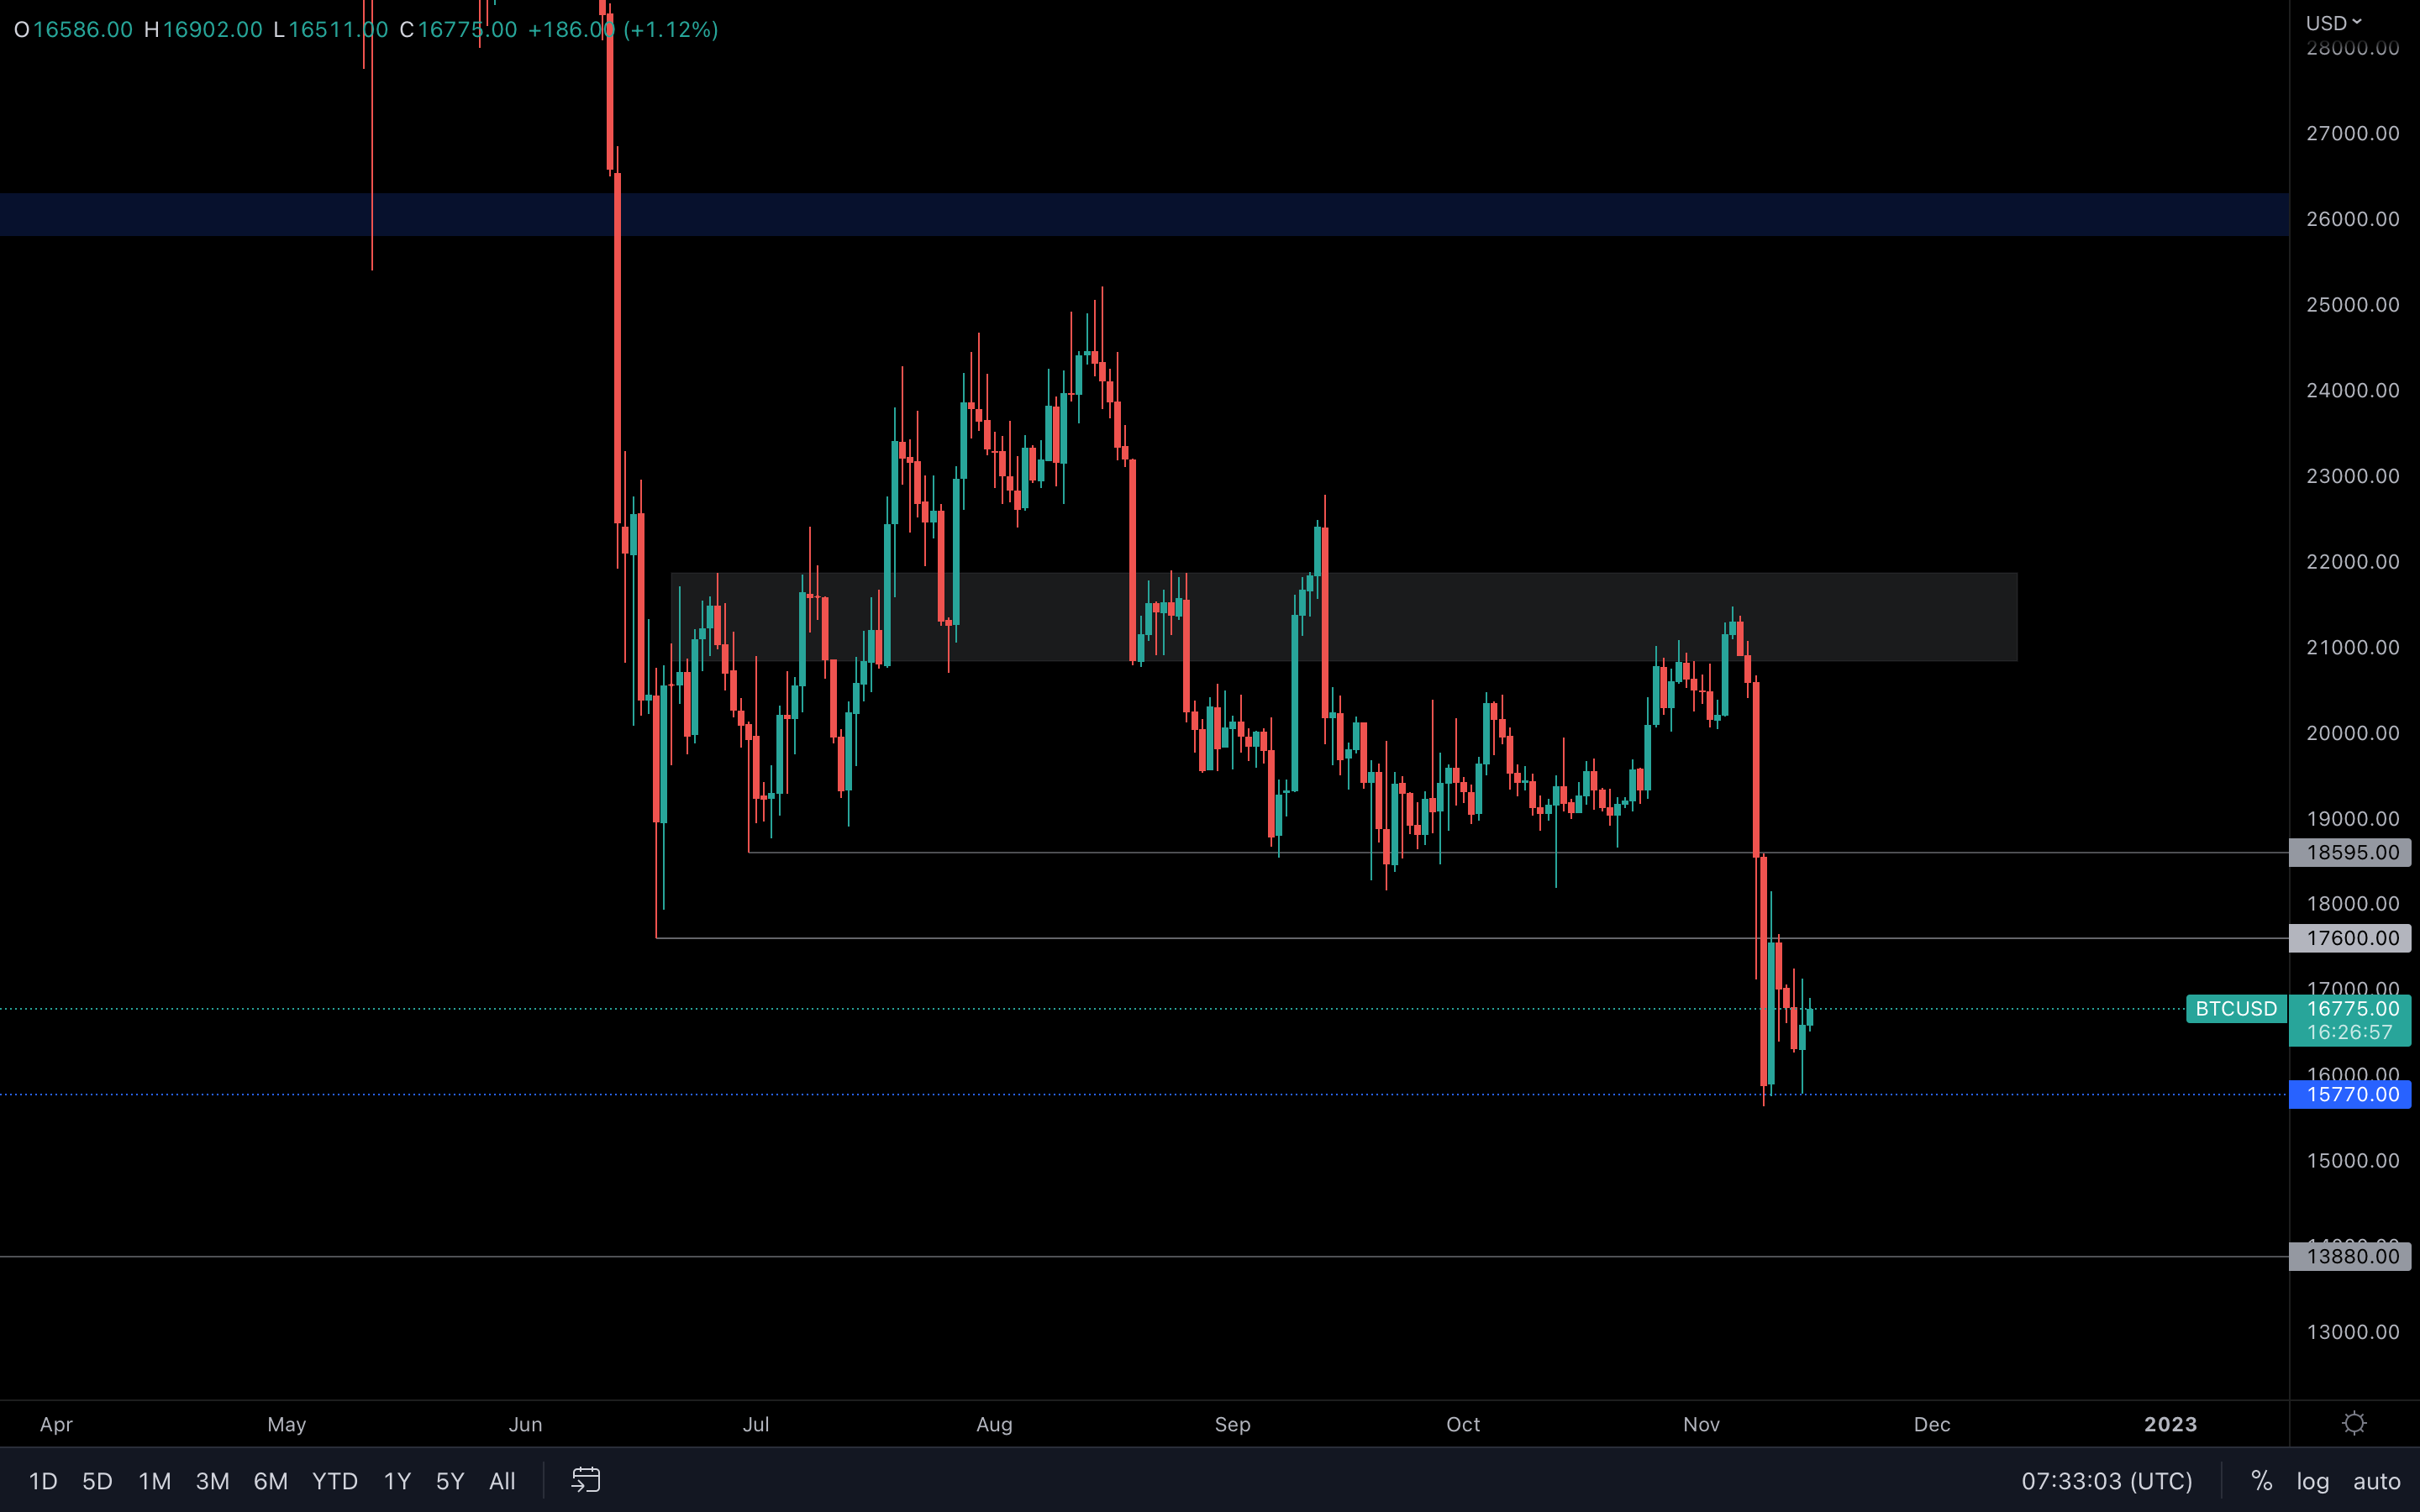
Something major happened last week - Bitcoin closed under its 2017 all-time high. This is the first time we've seen the price of Bitcoin drop under its previous bull run's all-time high - ever. Obviously, this changes things. It's a direct indication that technicals are worth only to a certain point, and that we can't always rely on technicals alone to understand where the market is going. This was something we were already aware of, and something that we kept mentioning over and over again.
(Daily chart was used)
Something major happened last week - Bitcoin closed under its 2017 all-time high. This is the first time we've seen the price of Bitcoin drop under its previous bull run's all-time high - ever. Obviously, this changes things. It's a direct indication that technicals are worth only to a certain point, and that we can't always rely on technicals alone to understand where the market is going. This was something we were already aware of, and something that we kept mentioning over and over again.
After last week's events, Bitcoin lost both $18,600 and $17,600, after which the price found some buying pressure at the $15,770 level. On the higher timeframe, there's nothing that's stopping Bitcoin from testing $13,880 now, after losing the 2017 all-time high support. On a shorter timeframe (this week), we could see the price of Bitcoin retest $17,600.
We will now dig into the on-chain metrics to see what the past week’s chaos is telling us.
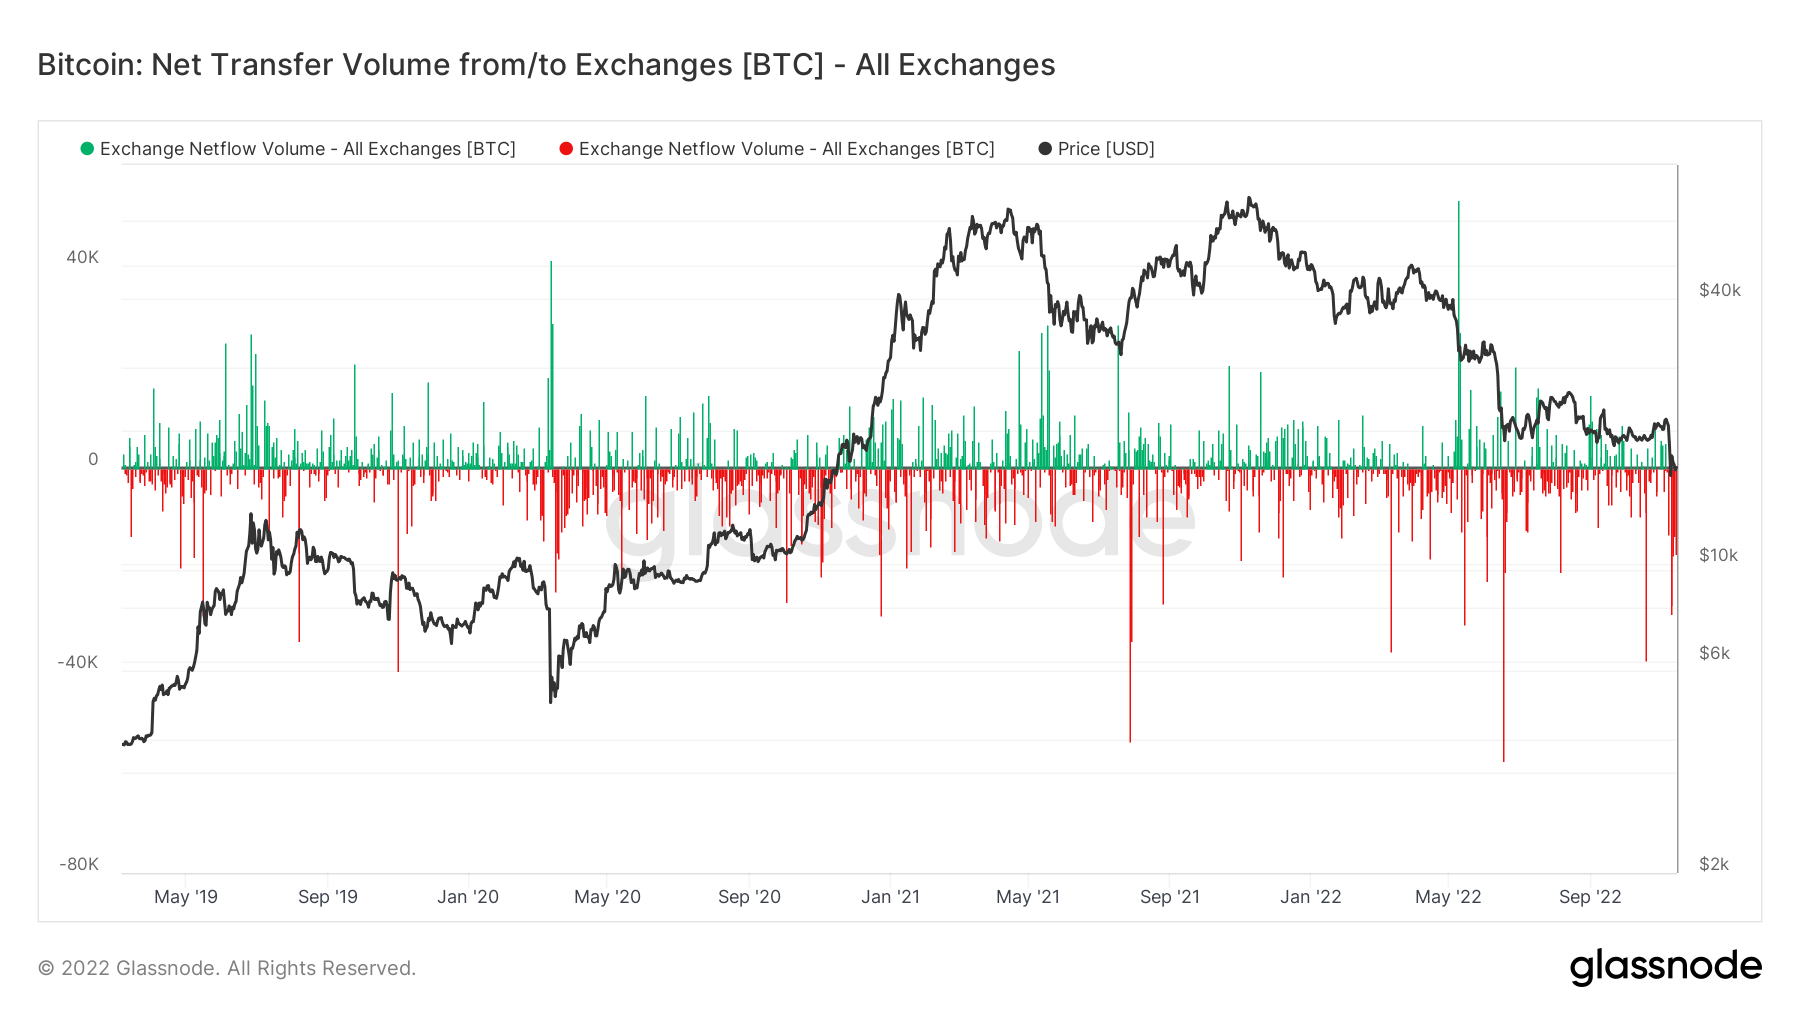
Metric 1 – Exchange Netflow Volume
After the past week, the phrase ‘not your keys, not your coins’ has never had a greater emphasis placed on it – bar the Bitfinex and Mt Gox hacks maybe. This has now shown in the data as Exchanges have seen significant net outflows of coins over the past few days – the large and grouped red spikes.
Bitcoin – Exchange Netflow Volume
 Metric 2 – Coin Days Destroyed
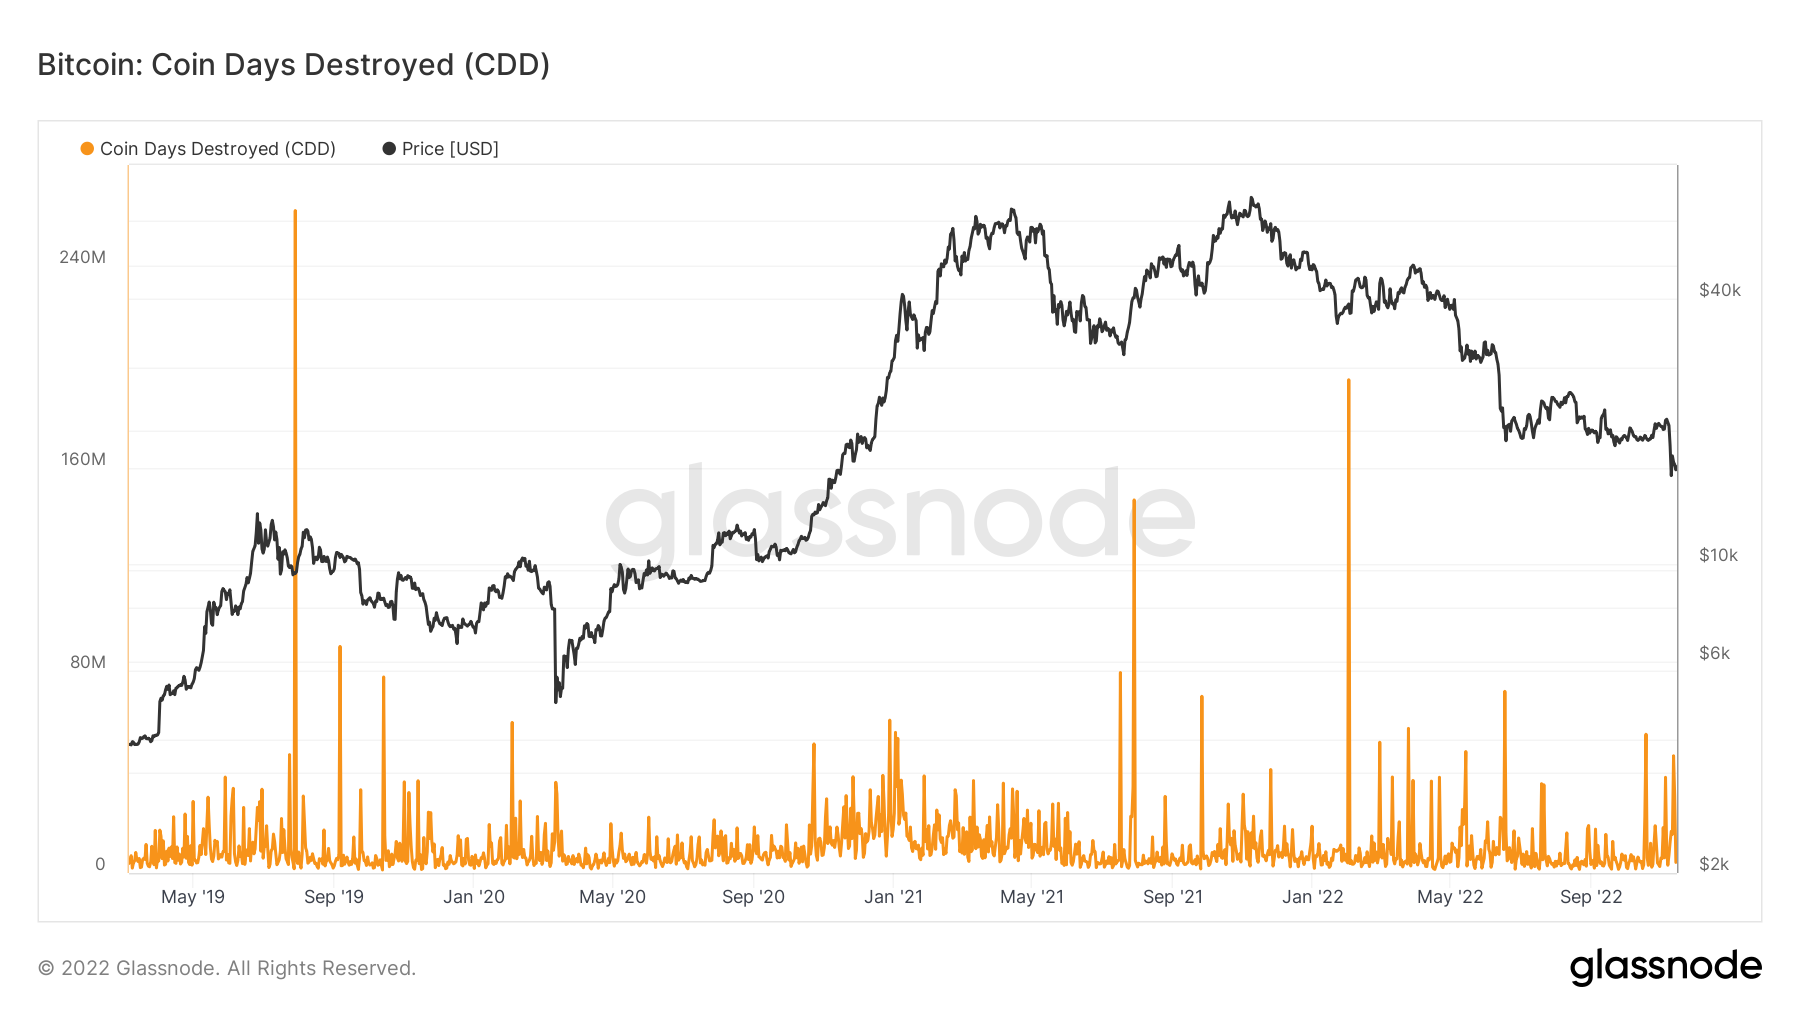
The Coin Days Destroyed metric is calculated by taking the number of coins in a transaction and multiplying it by the number of days since those coins were last spent. The larger the spike the more long-term holders are likely to sell. However, in the past week, this metric has seen a slight spike. Historically, spikes in this metric are generated by older coins being moved/spent, yet in the past week, this metric has spiked due to coins aged between 3 and 12 months being the coins that were most recently spent. These coin ages are still mostly considered short-term (less than 155 days) but what we didn’t see is a spike in coins being spent that are aged older than 1 year. This suggests that this week’s selling was mostly driven by short-term holders.
Bitcoin – Coin Days Destroyed
 Metric 3 – MVRV Z-Score
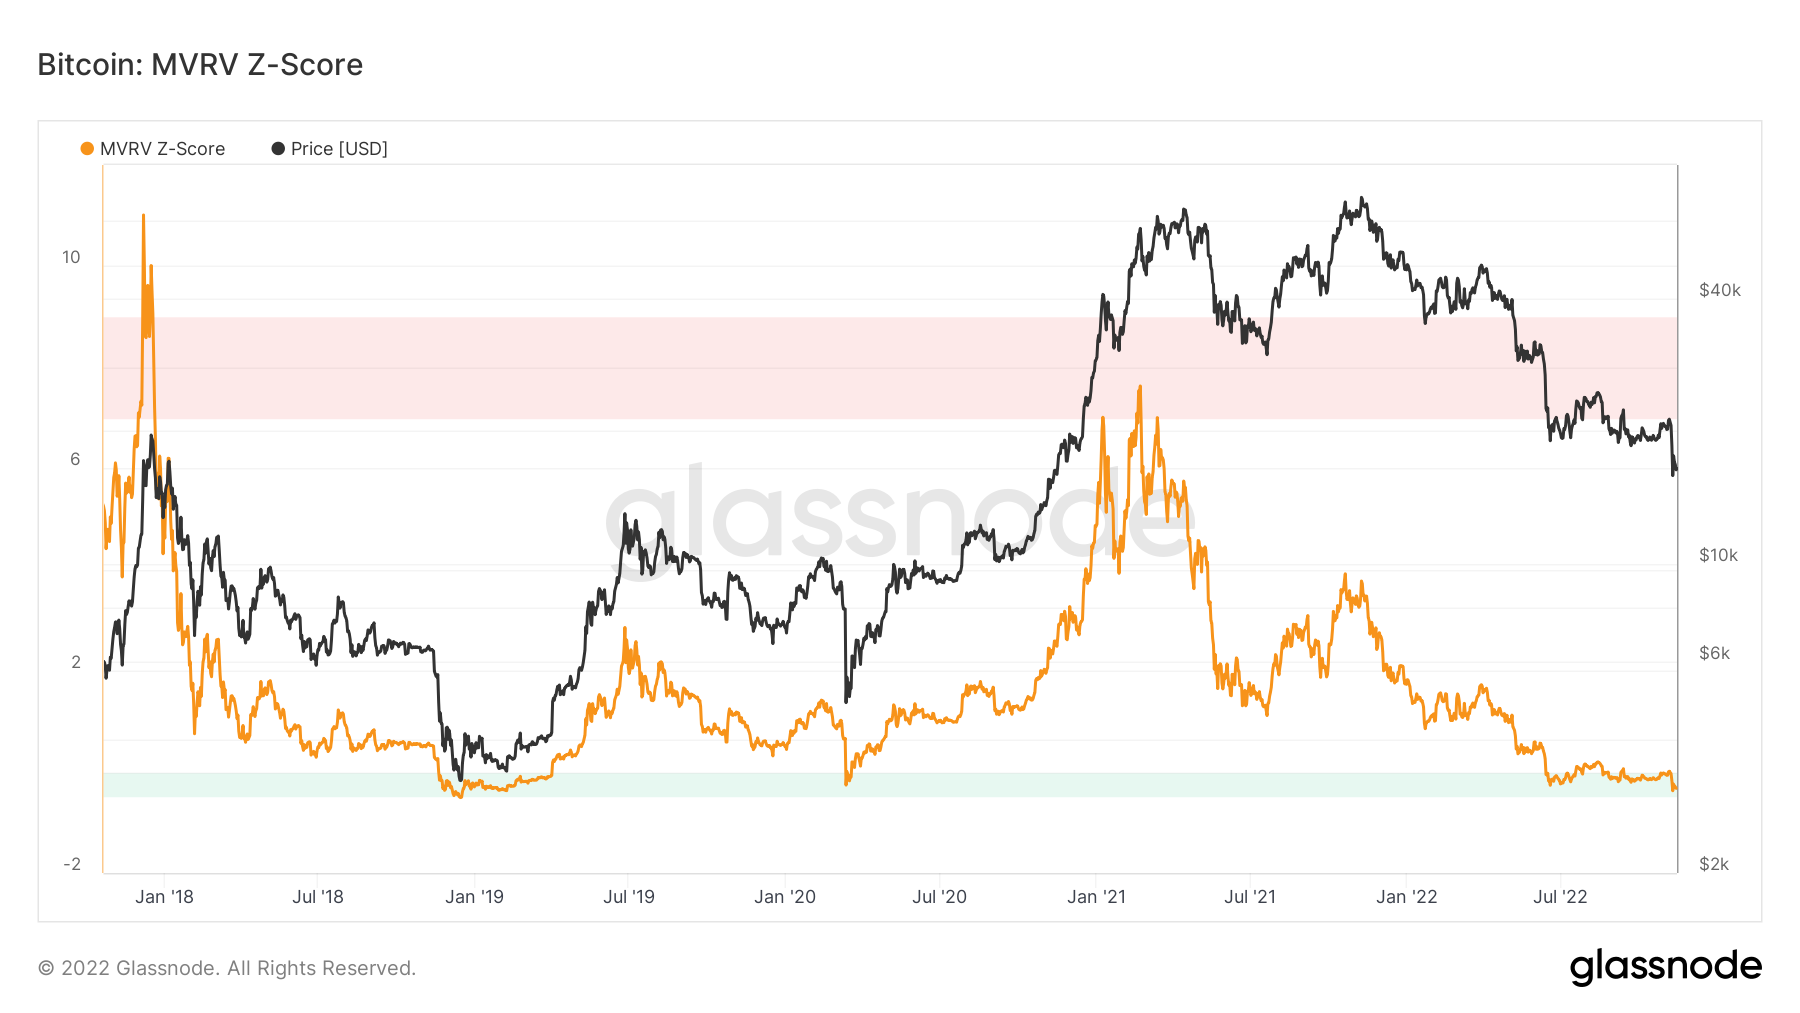
The MVRV Z-Score is used to assess when Bitcoin is under or overvalued relative to its “fair price”. We can see below that when this metric has been in the lower range of the green zone, this has historically been a fantastic time to buy Bitcoin. On last week’s puke out on the FTX news, this metric reached its lowest point since December 2018 – the last cycle’s macro bottom.
Bitcoin – MVRV Z-Score
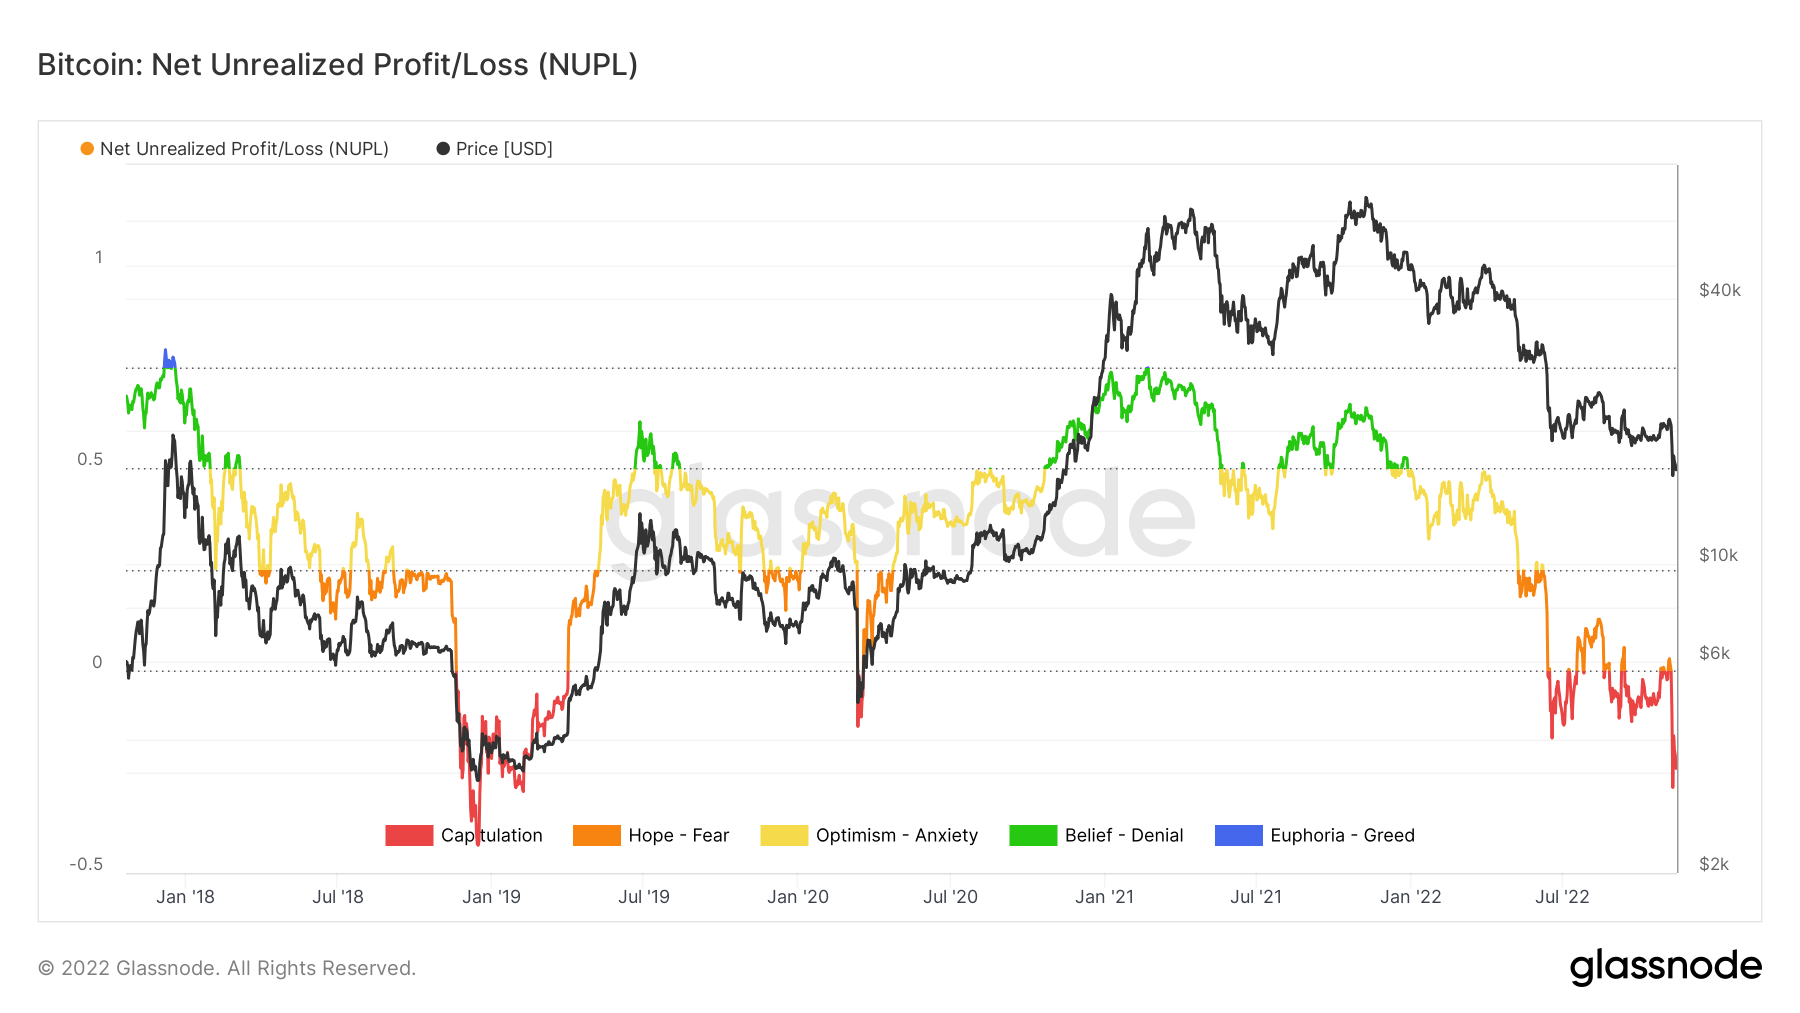
 Metric 4 – Net Unrealised Profit/Loss
Another metric that has reached its lowest point since December 2018 is the Net Unrealised Profit/Loss. This measures the difference between Relative Unrealised Profit and Relative Unrealised Loss. When this metric has previously been deep into the red “capitulation” zone, this has marked a great time to buy Bitcoin for the long term. We are currently well into this territory now.
Bitcoin – Net Unrealised Profit/Loss
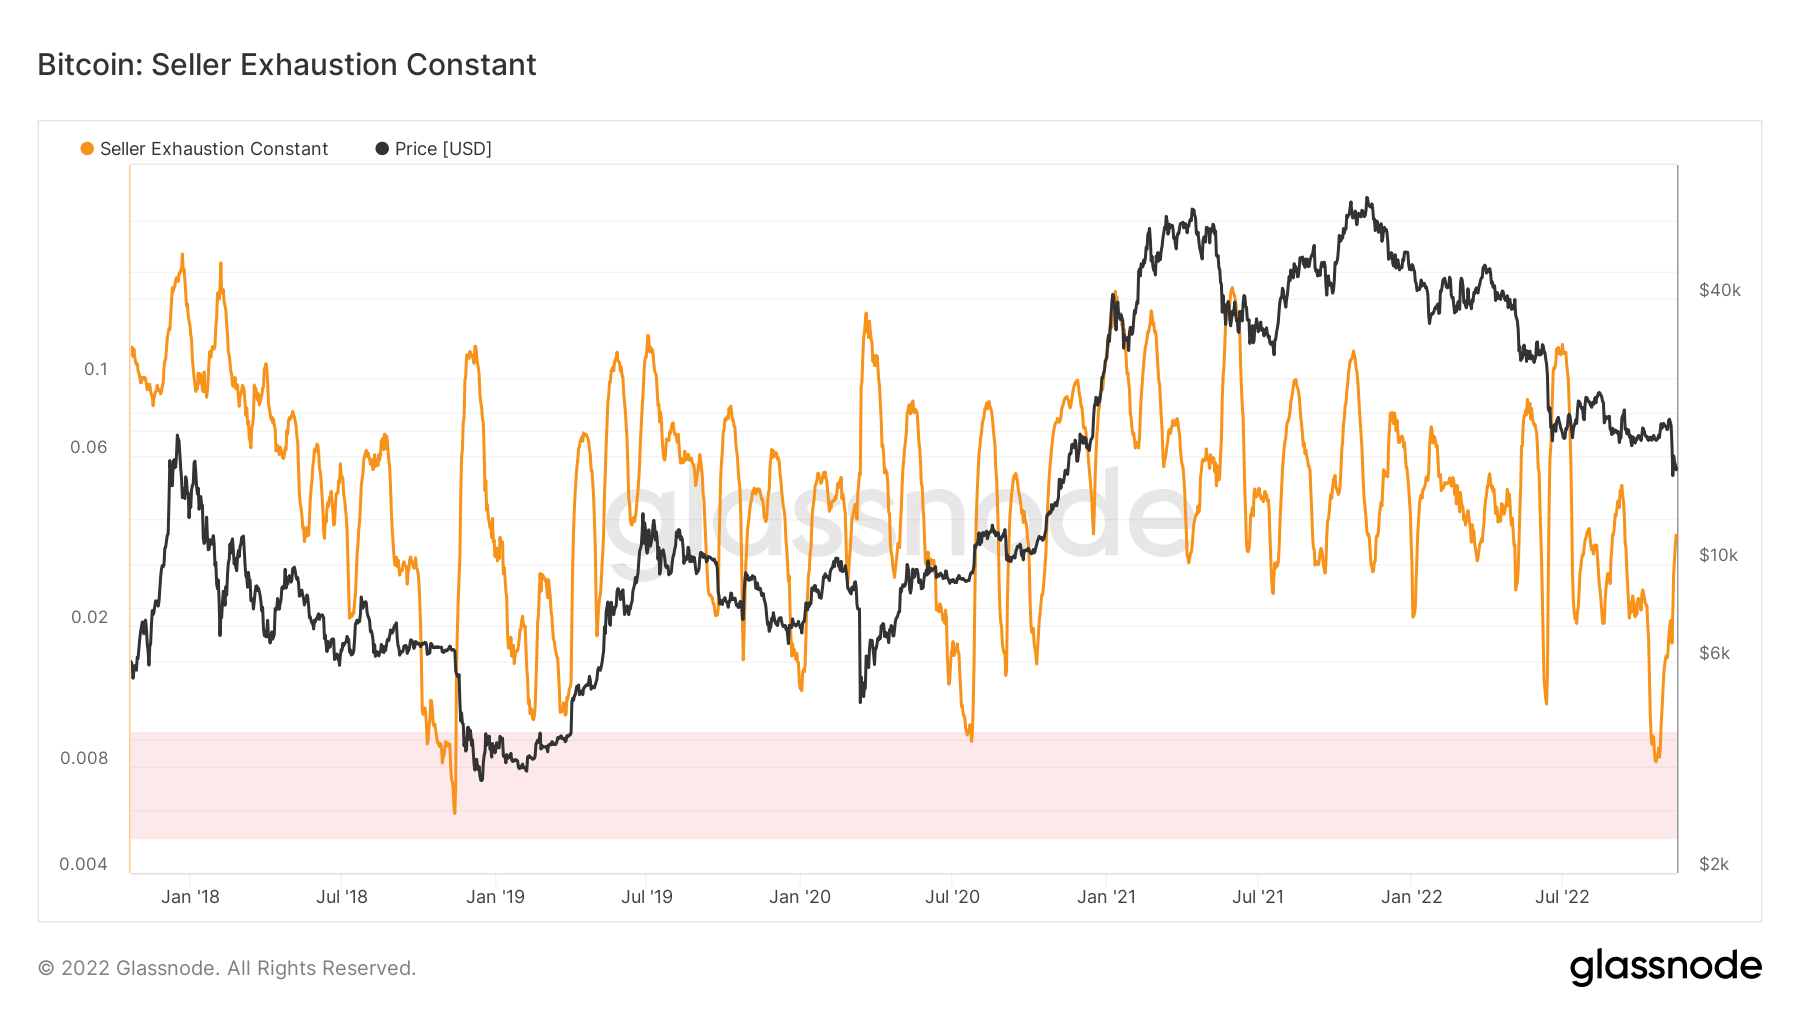
 Metric 5 – Seller Exhaustion Constant
The Seller Exhaustion Constant detects when two factors co-align: low volatility and high losses e.g., low-risk bottoms. At previous macro bottoms, this metric has moved into the red zone before dramatically spiking higher as the volatility after a price puke out declines… a low-risk bottom. Now we’re seeing this metric move into the red zone and move higher. This may mean there is still some more downside ahead of us, but likely not a huge amount more.
Bitcoin – Seller Exhaustion Constant
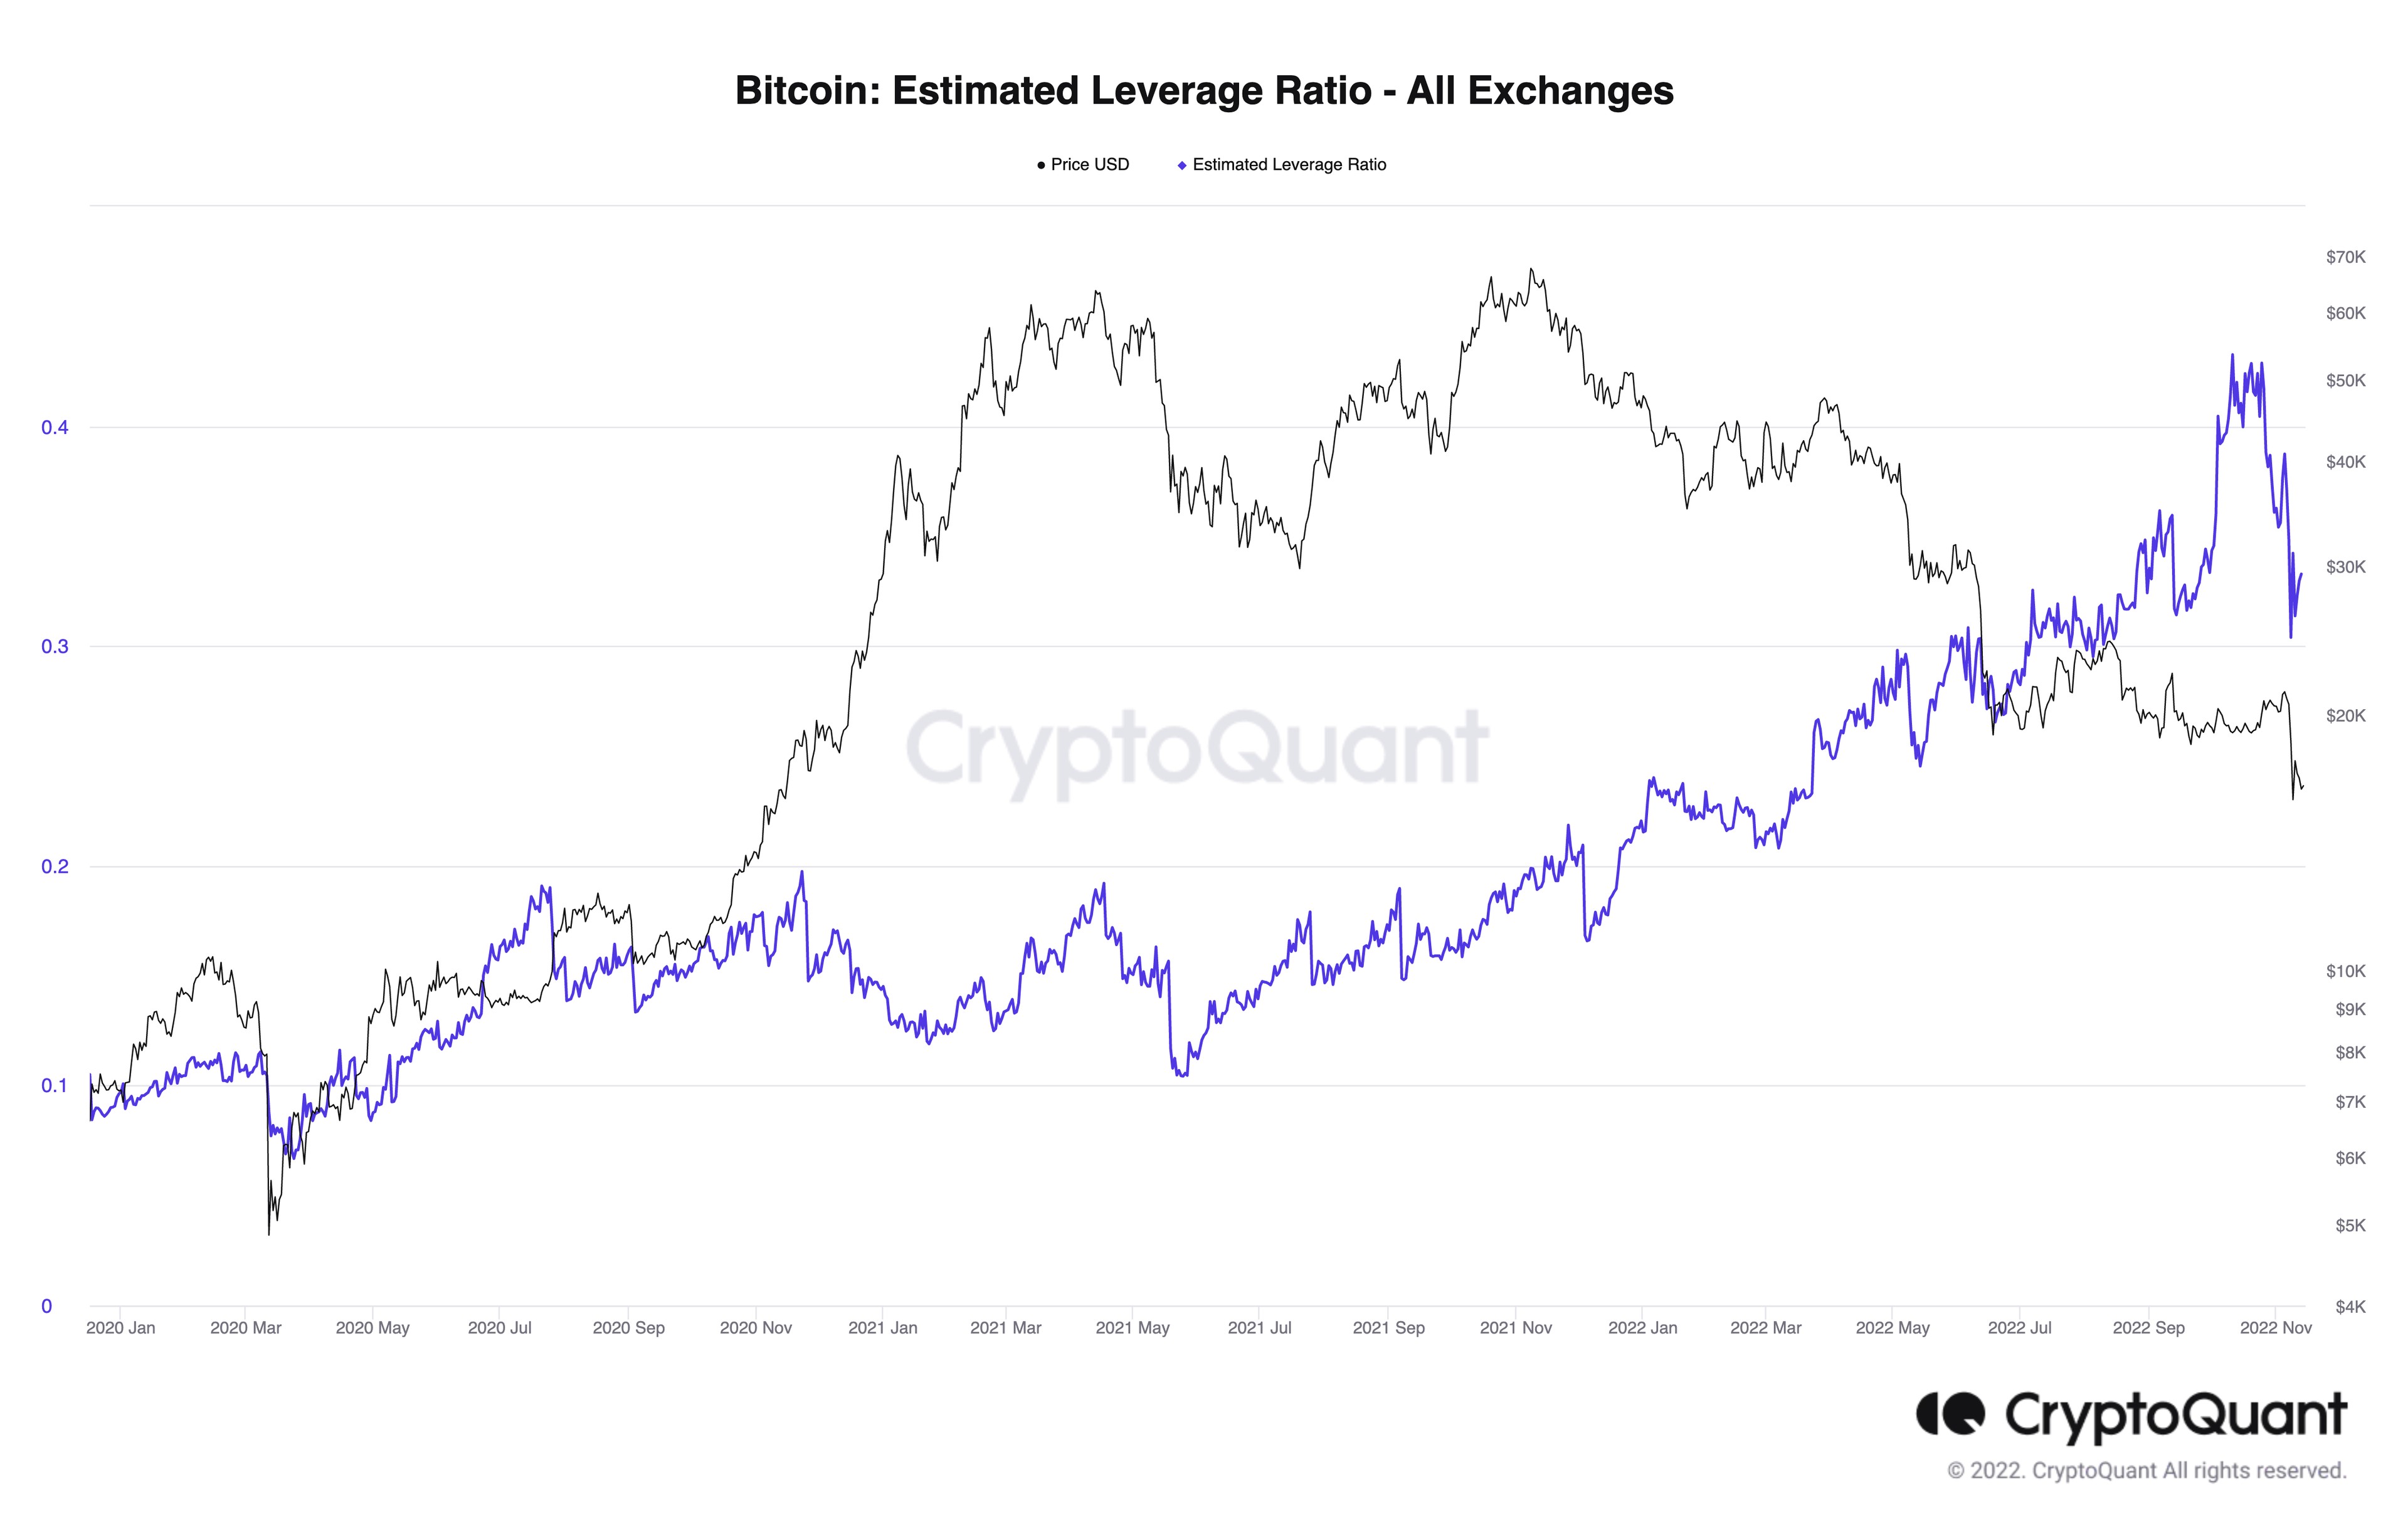
 Metric 6 – Estimated Leverage Ratio
Another great chart to look at is the Estimated Leverage Ratio. This shows the Exchange’s open interest divided by their coin reserves which shows how much leverage is being used. We can see here that the leverage ratio has come down dramatically in the past few weeks, potentially indicating that a significant portion of the excess that this market was seeing has been flushed out or that the majority of it has been flushed out.
Bitcoin – Estimated Leverage Ratio
Ether - Technical Analysis
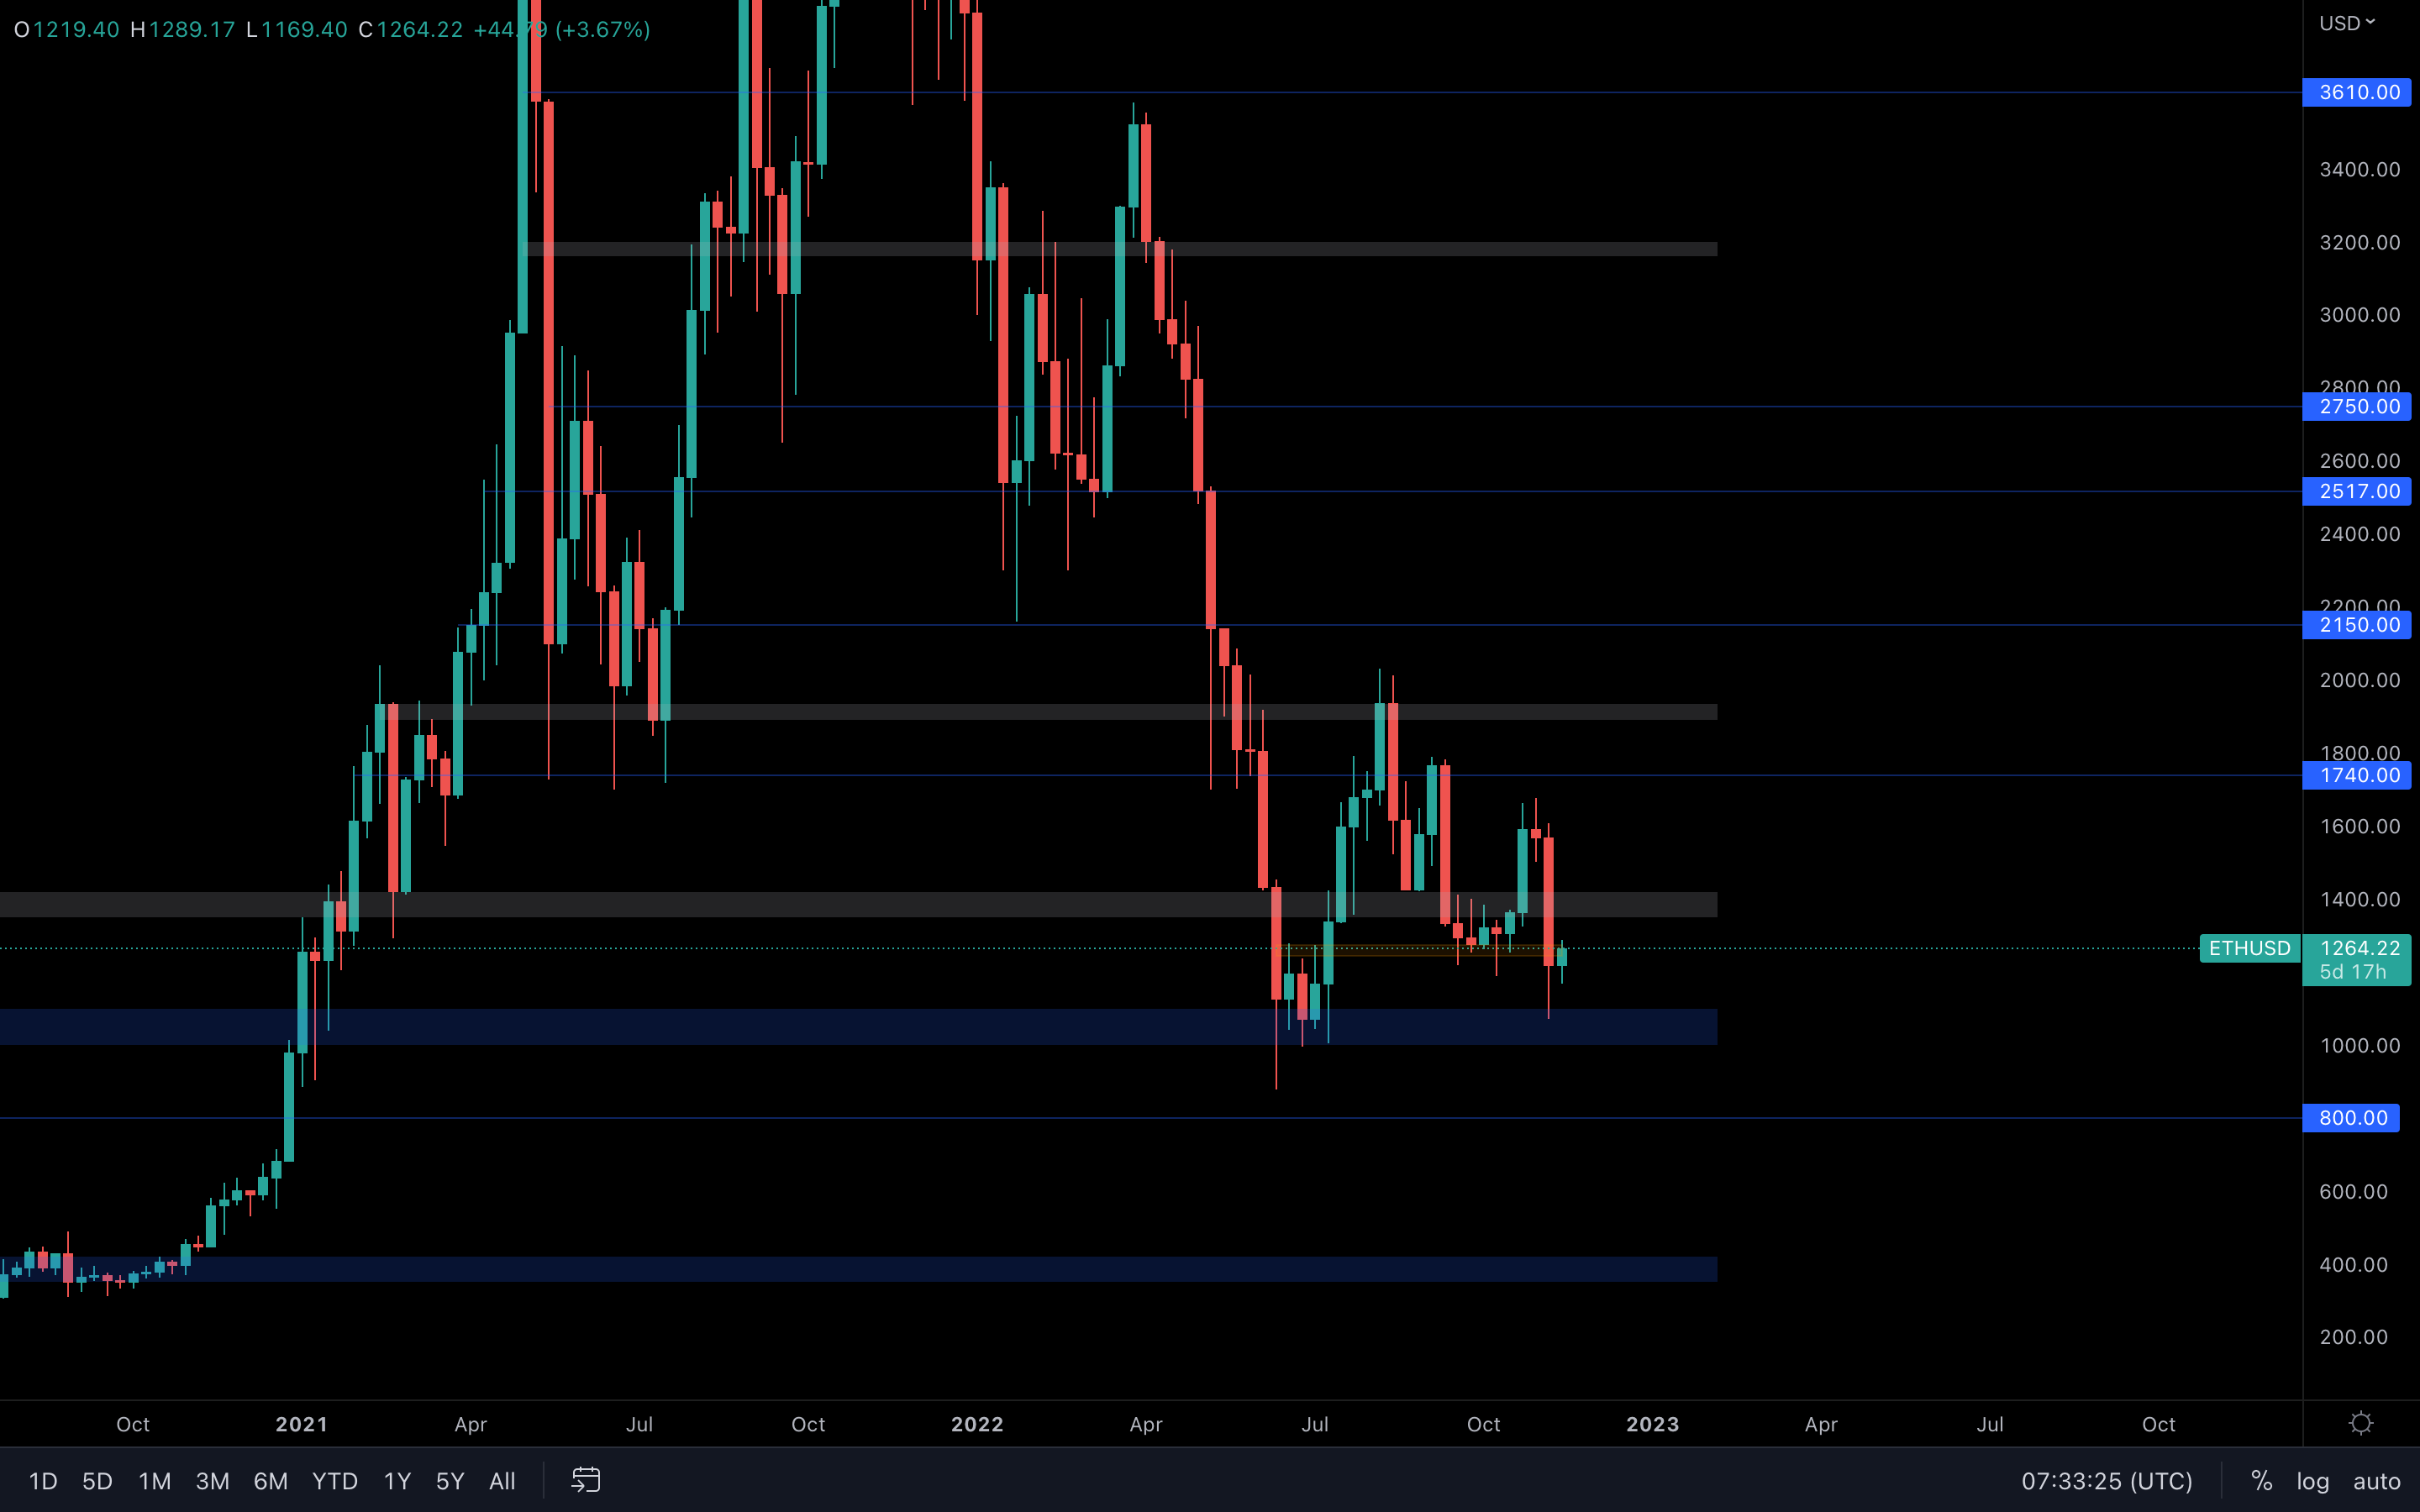 Ether has seen quite the selling pressure last week, but even that wasn't enough to take out the June low. Ether experienced some buying pressure around the psychological and technical level of $1000, and is now trading between $1400 and $1000.
Whether this range will be broken soon remains to be seen, but for now, we should expect nothing less than for Ether to range between $1400 and $1000. This week, we could potentially witness a $1400 retest since the selling pressure has slowed down and most of the leverage in the market has been flushed out.
DOT
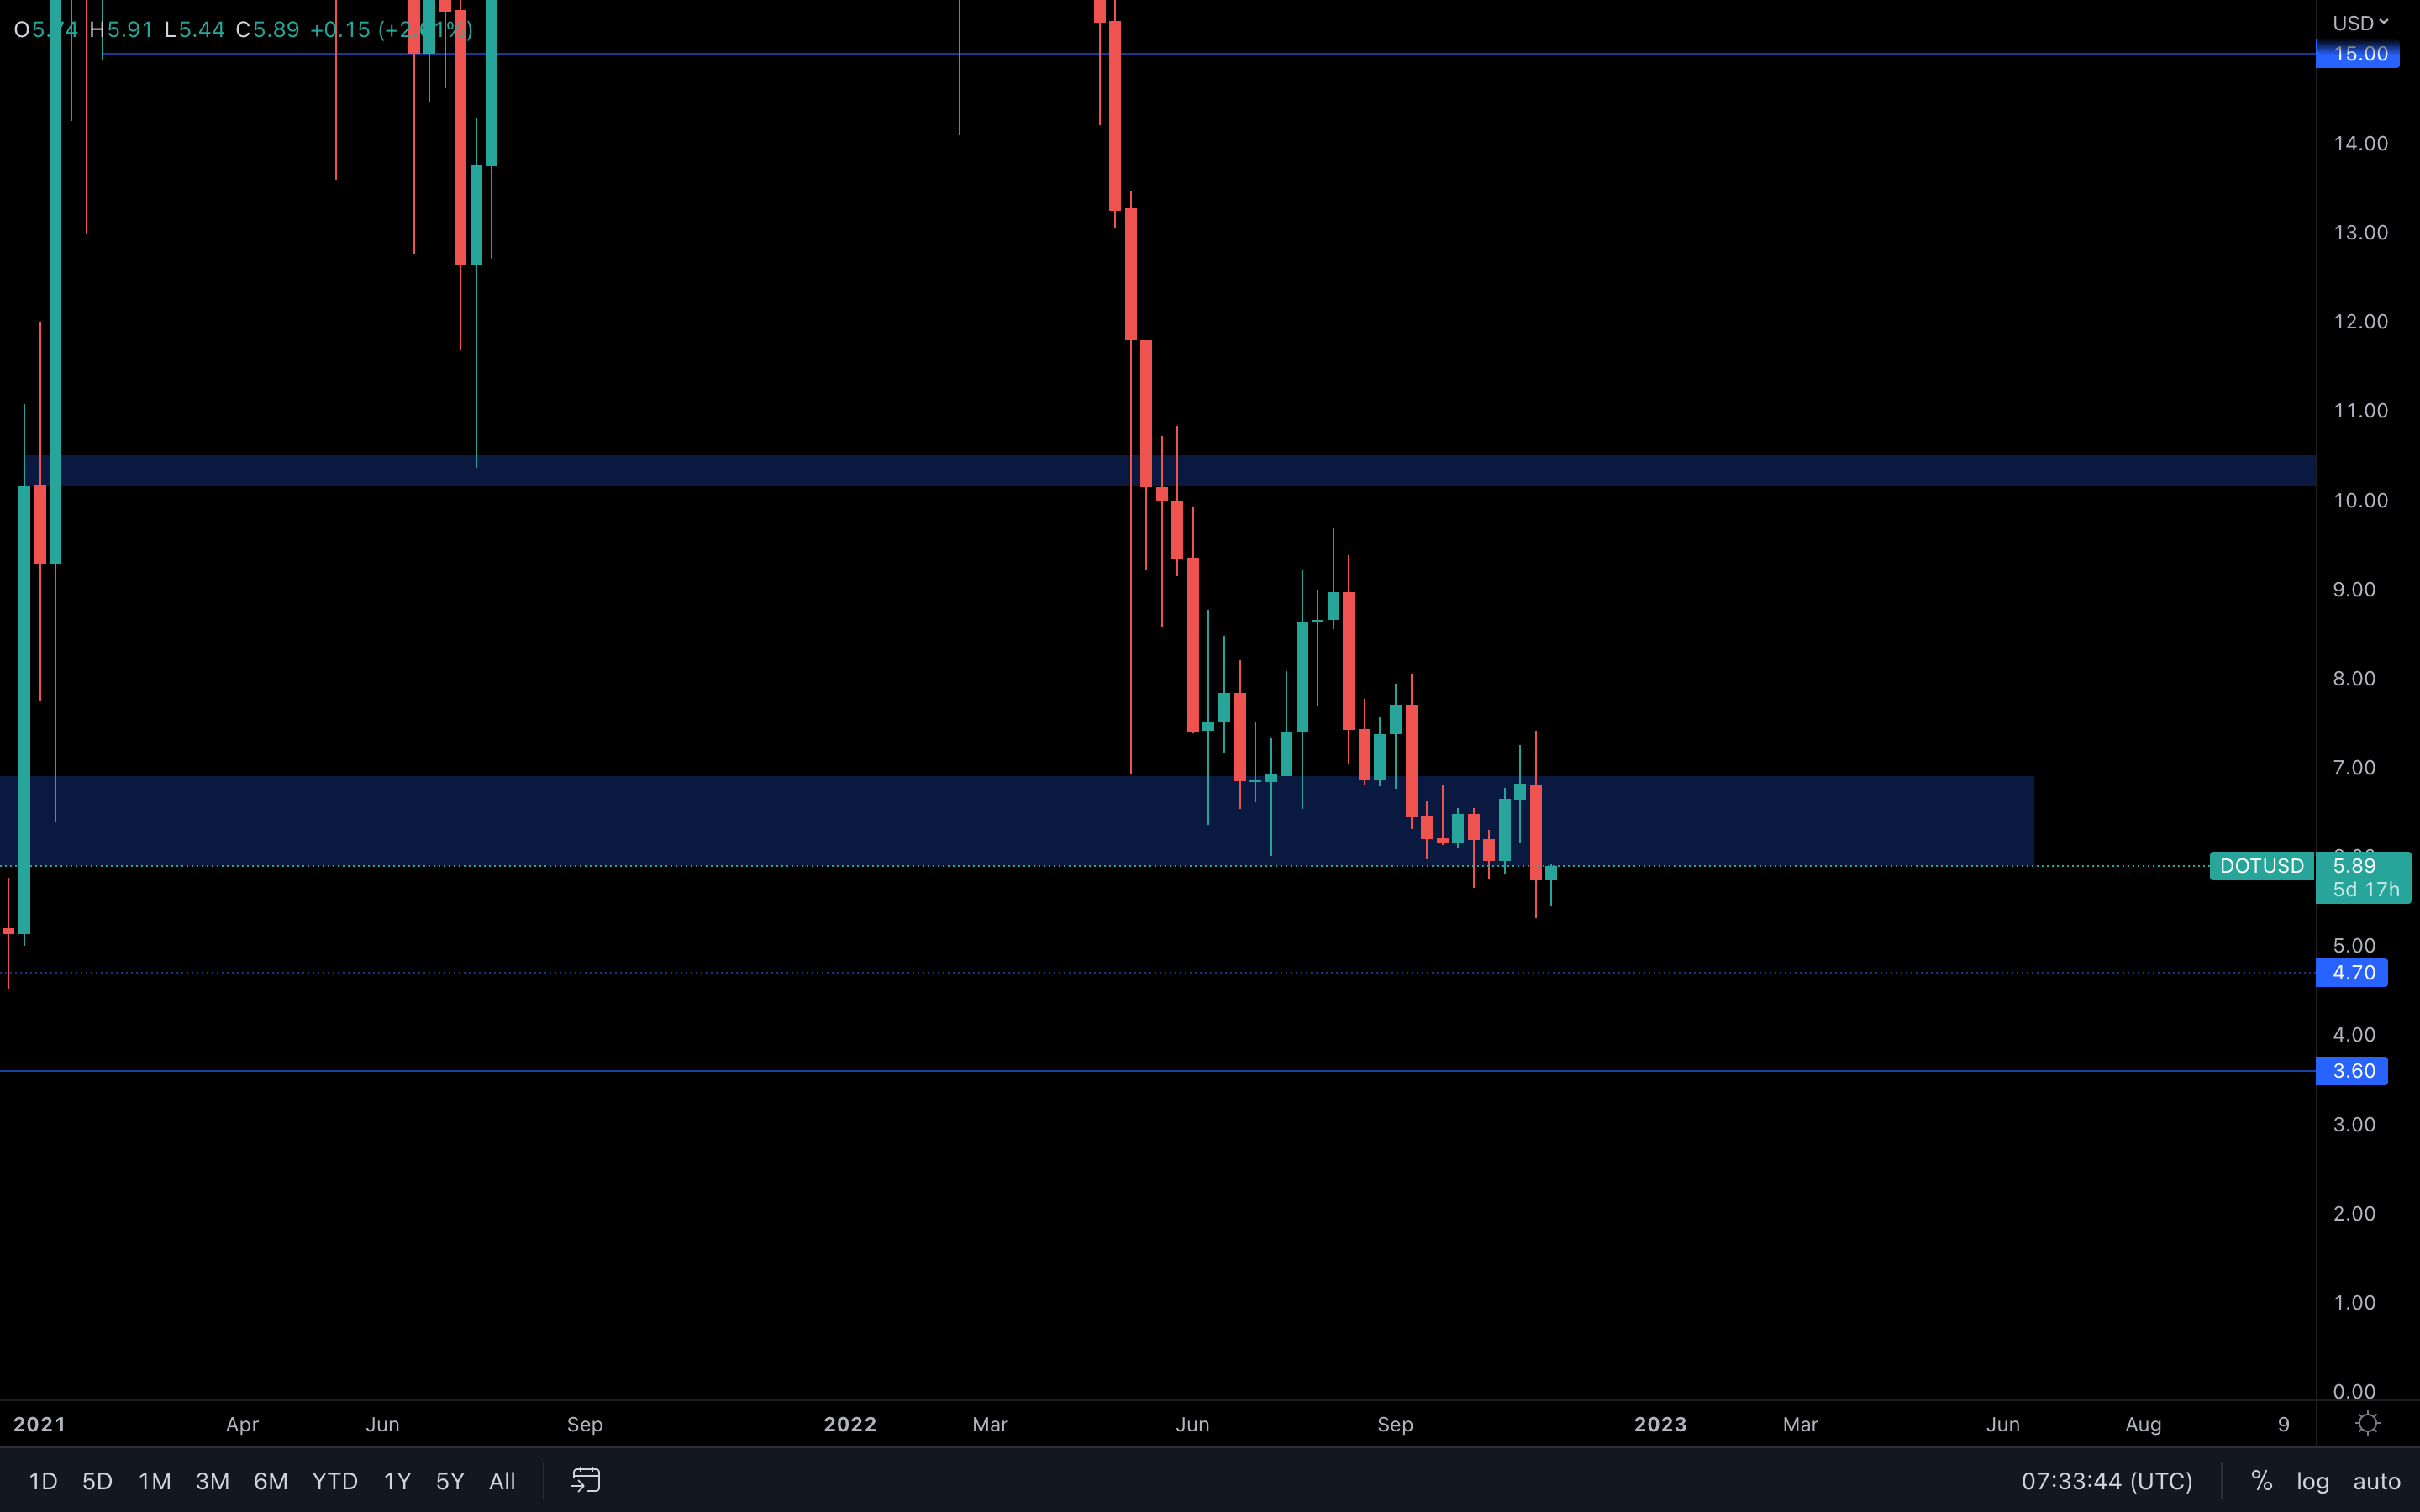 DOT has finally lost its $6 level and is now trying to reclaim it. Although a reclaim here is possible, we can see that there have been continuous lower highs on the weekly timeframe - it just leaves it to question, will DOT be unable to register a higher high at this point, since there's little to no volume left for prices to push higher?
As long as the majors and other external influences such as the DXY & SPX do not play out right, then yes - DOT will likely continue to form lower highs, which means that at some point in the future the $3.60 level will be tested, especially since we now lost $6.
SNX
 (Daily chart was used)
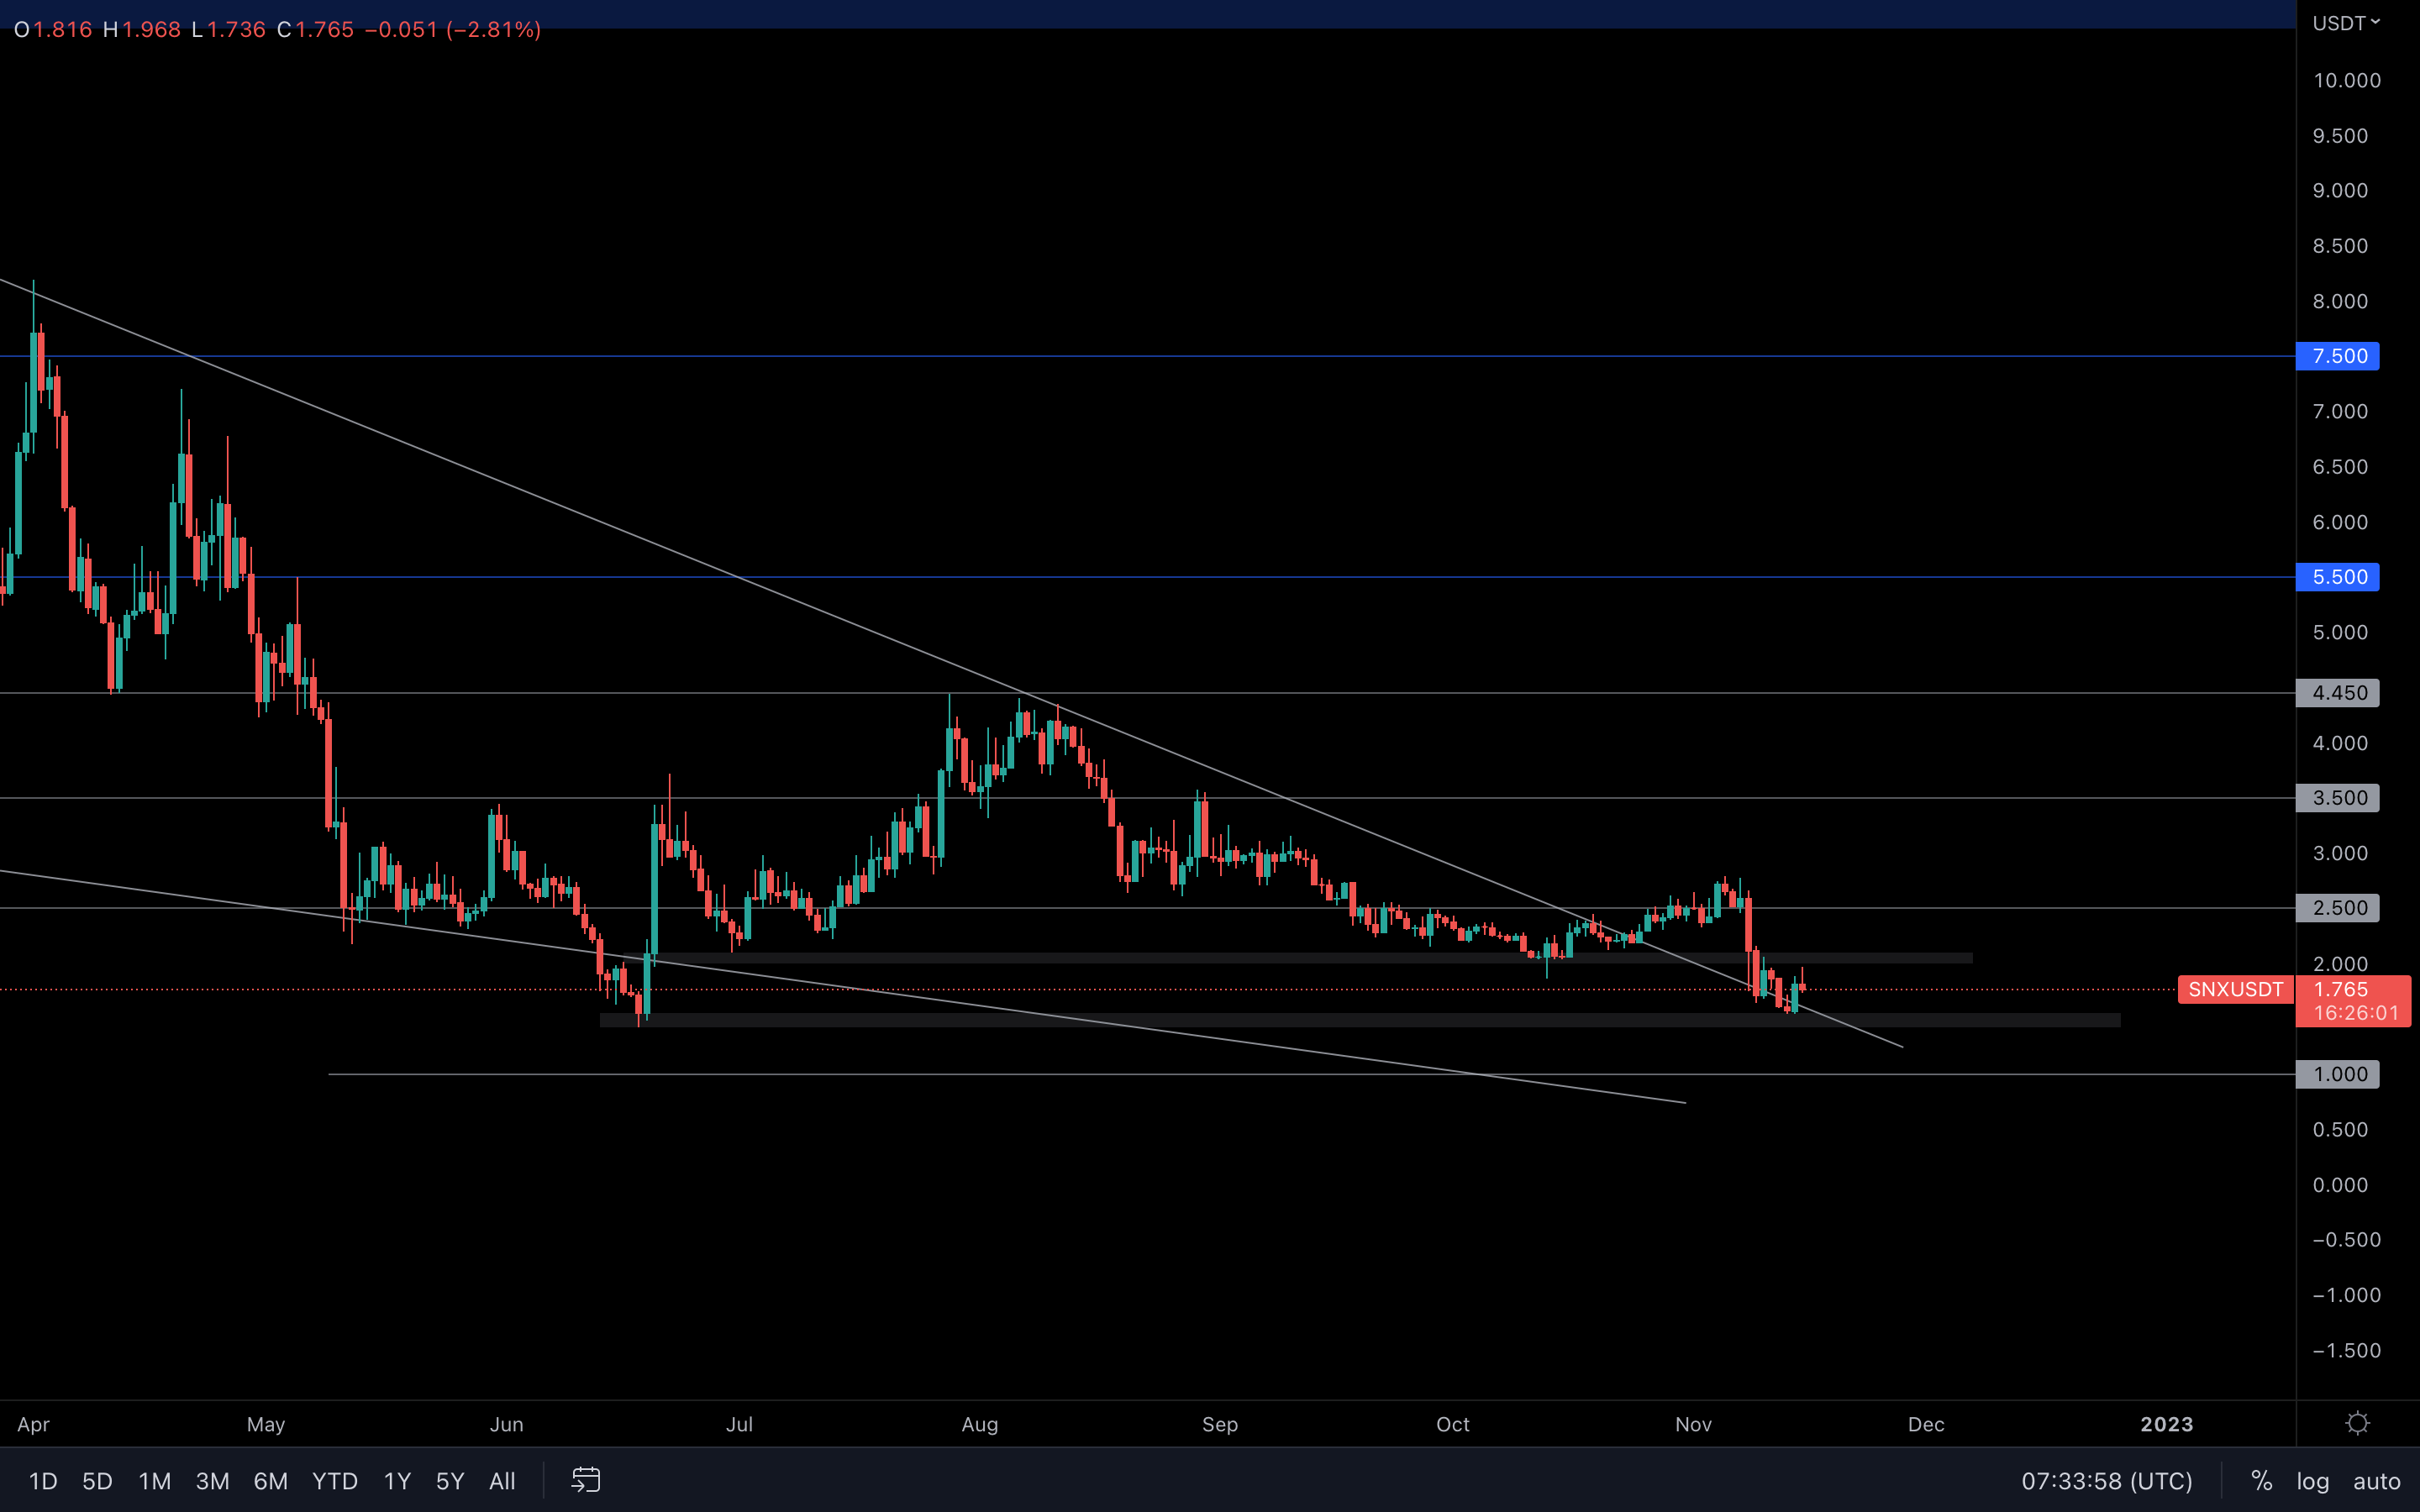
Unfortunately, SNX was not able to hold $2.50 - this invalidated a $3.5 test that we mentioned could happen in last week's report. Now, SNX also has to battle with the $2 level since it was lost last week.
(Daily chart was used)
Unfortunately, SNX was not able to hold $2.50 - this invalidated a $3.5 test that we mentioned could happen in last week's report. Now, SNX also has to battle with the $2 level since it was lost last week.
Failure in reclaiming $2 will push SNX to $1.50 once more, which also happens to be the June low. However, if $2 is reclaimed on the daily timeframe, a push toward $2.5 is on the cards. We're now gonna have to wait and see which direction
RUNE
 He's here. (*Steppenwolf's voice*)
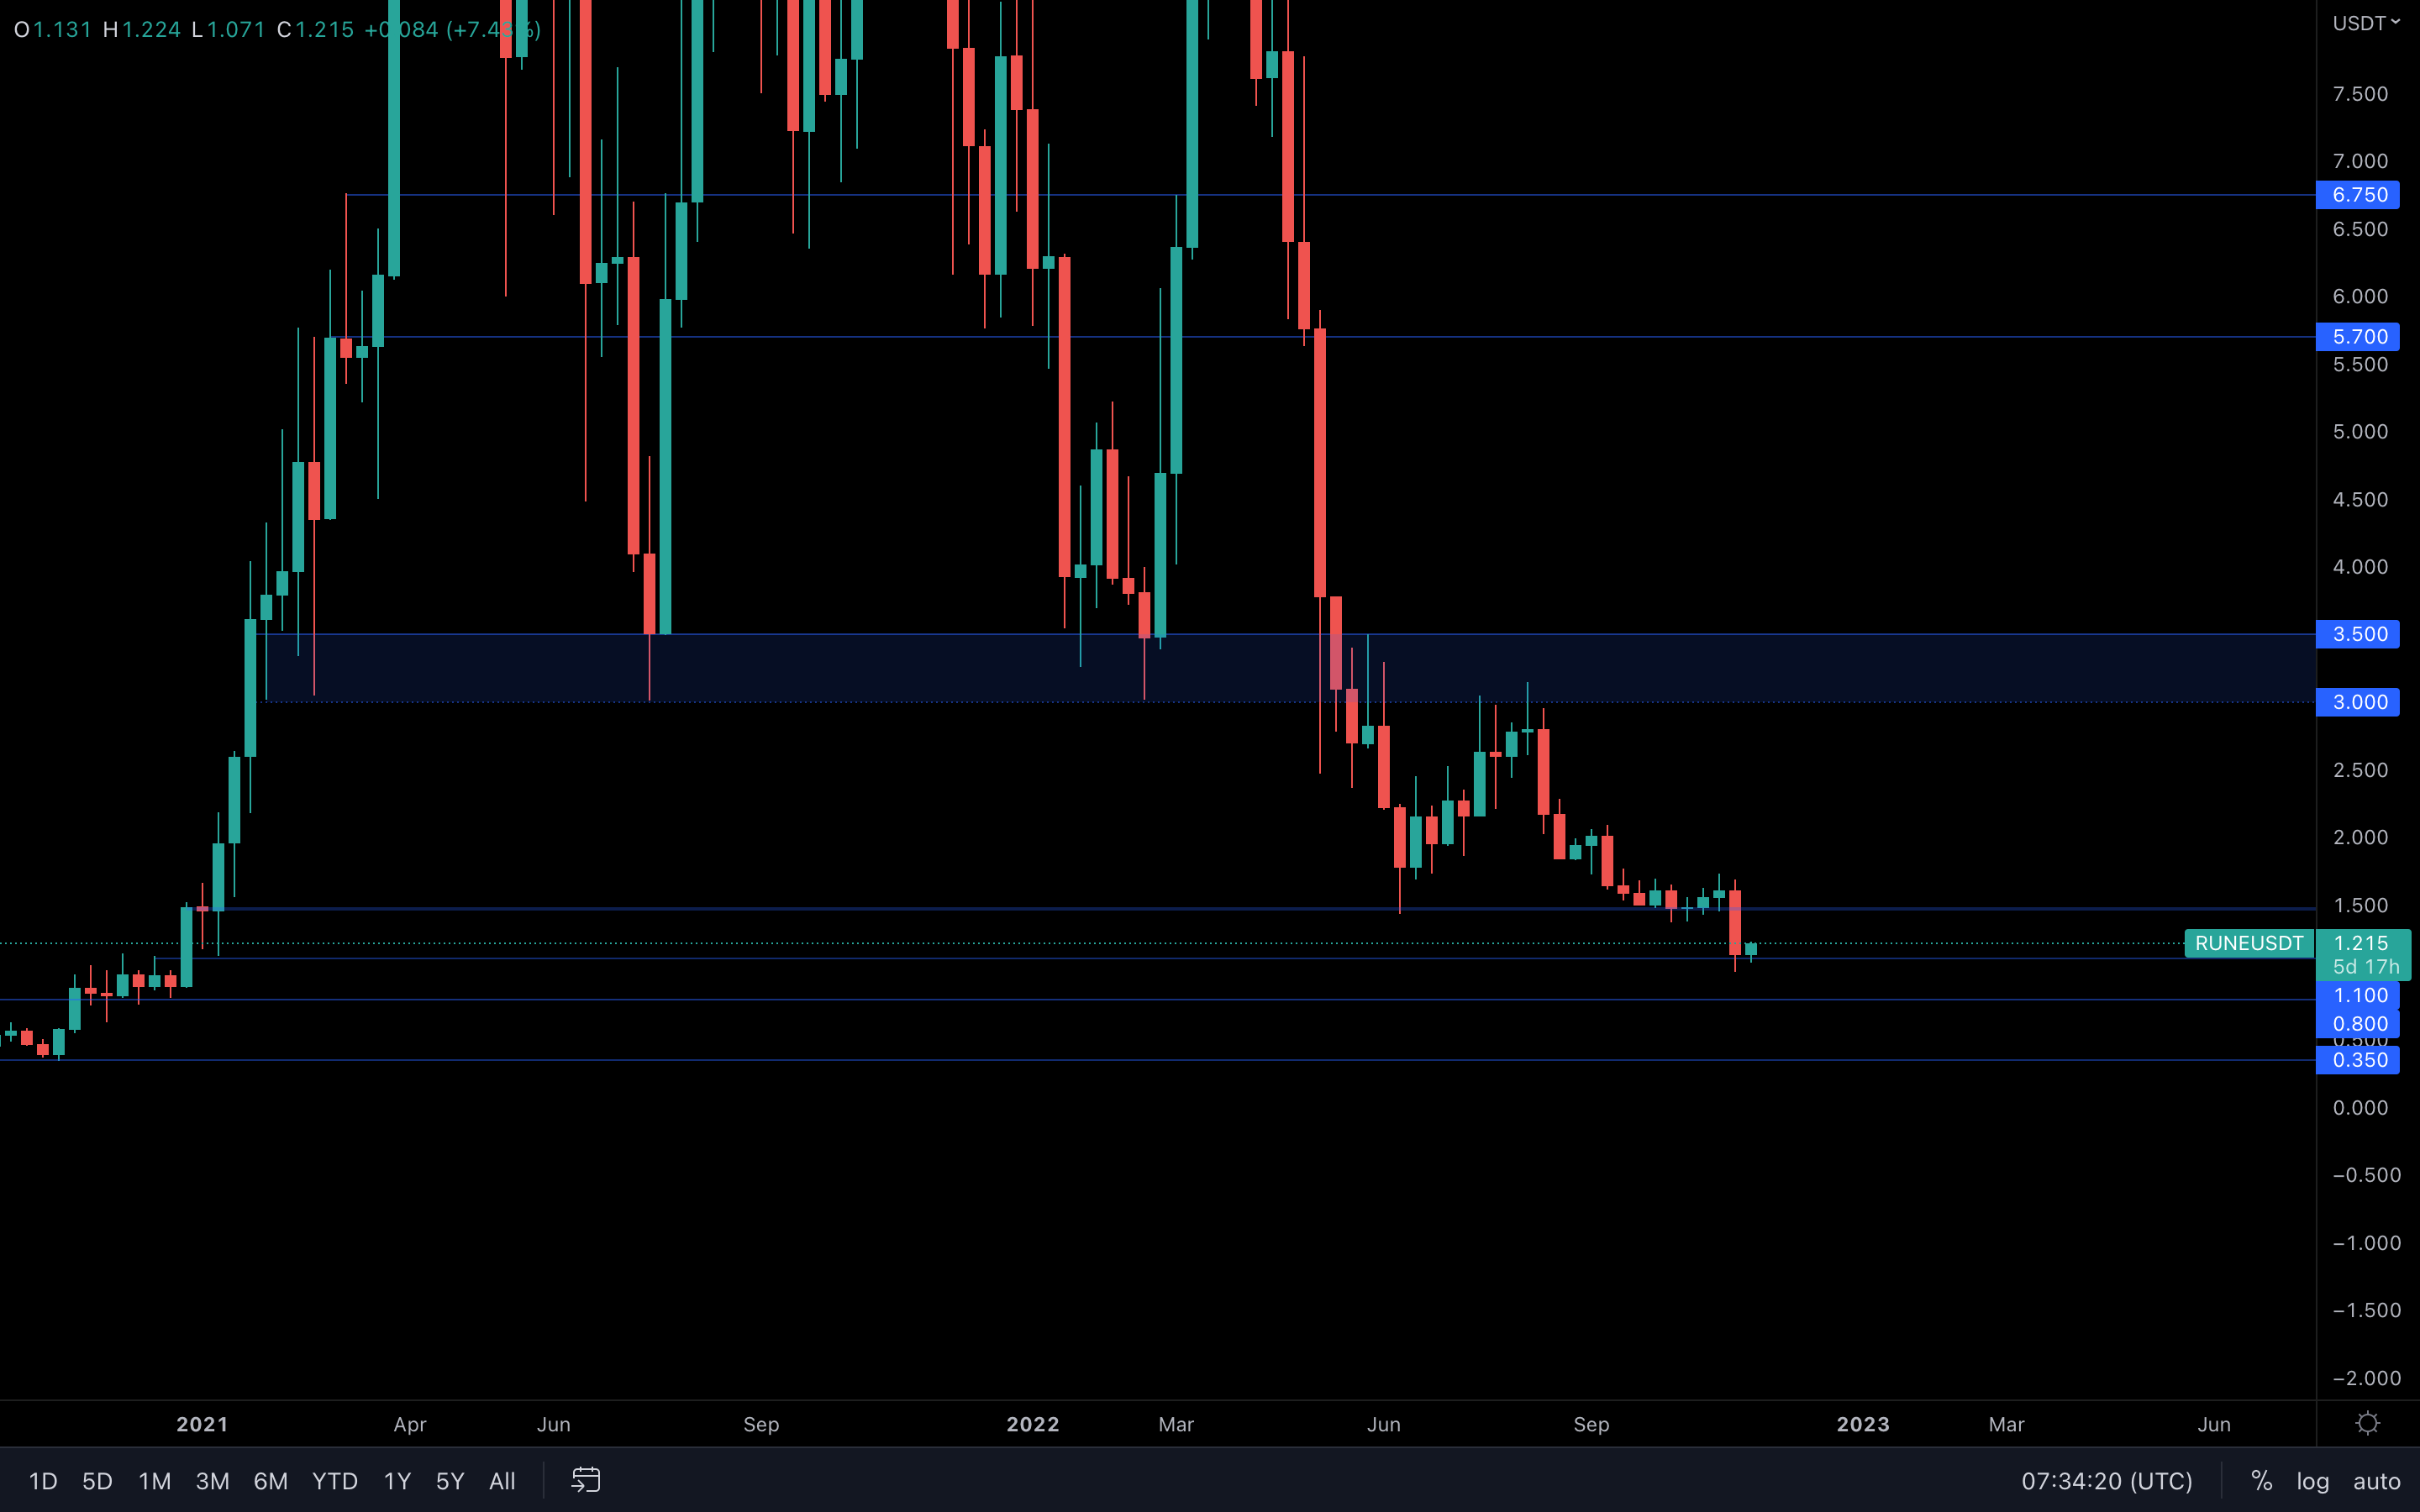
$1 RUNE has arrived. The team at Cryptonary strongly believes in THORChain's potential, so its fundamental value is not changed at all even with its current price. From a technical standpoint, although RUNE has seen some buying pressure at the $1 level, the $1.10 level specifically is what we're going to monitor as it has acted as a more accurate support/resistance level in the past.
As long as $1.10 holds, then a retest of $1.50 will likely occur in the coming days/weeks.
SOL
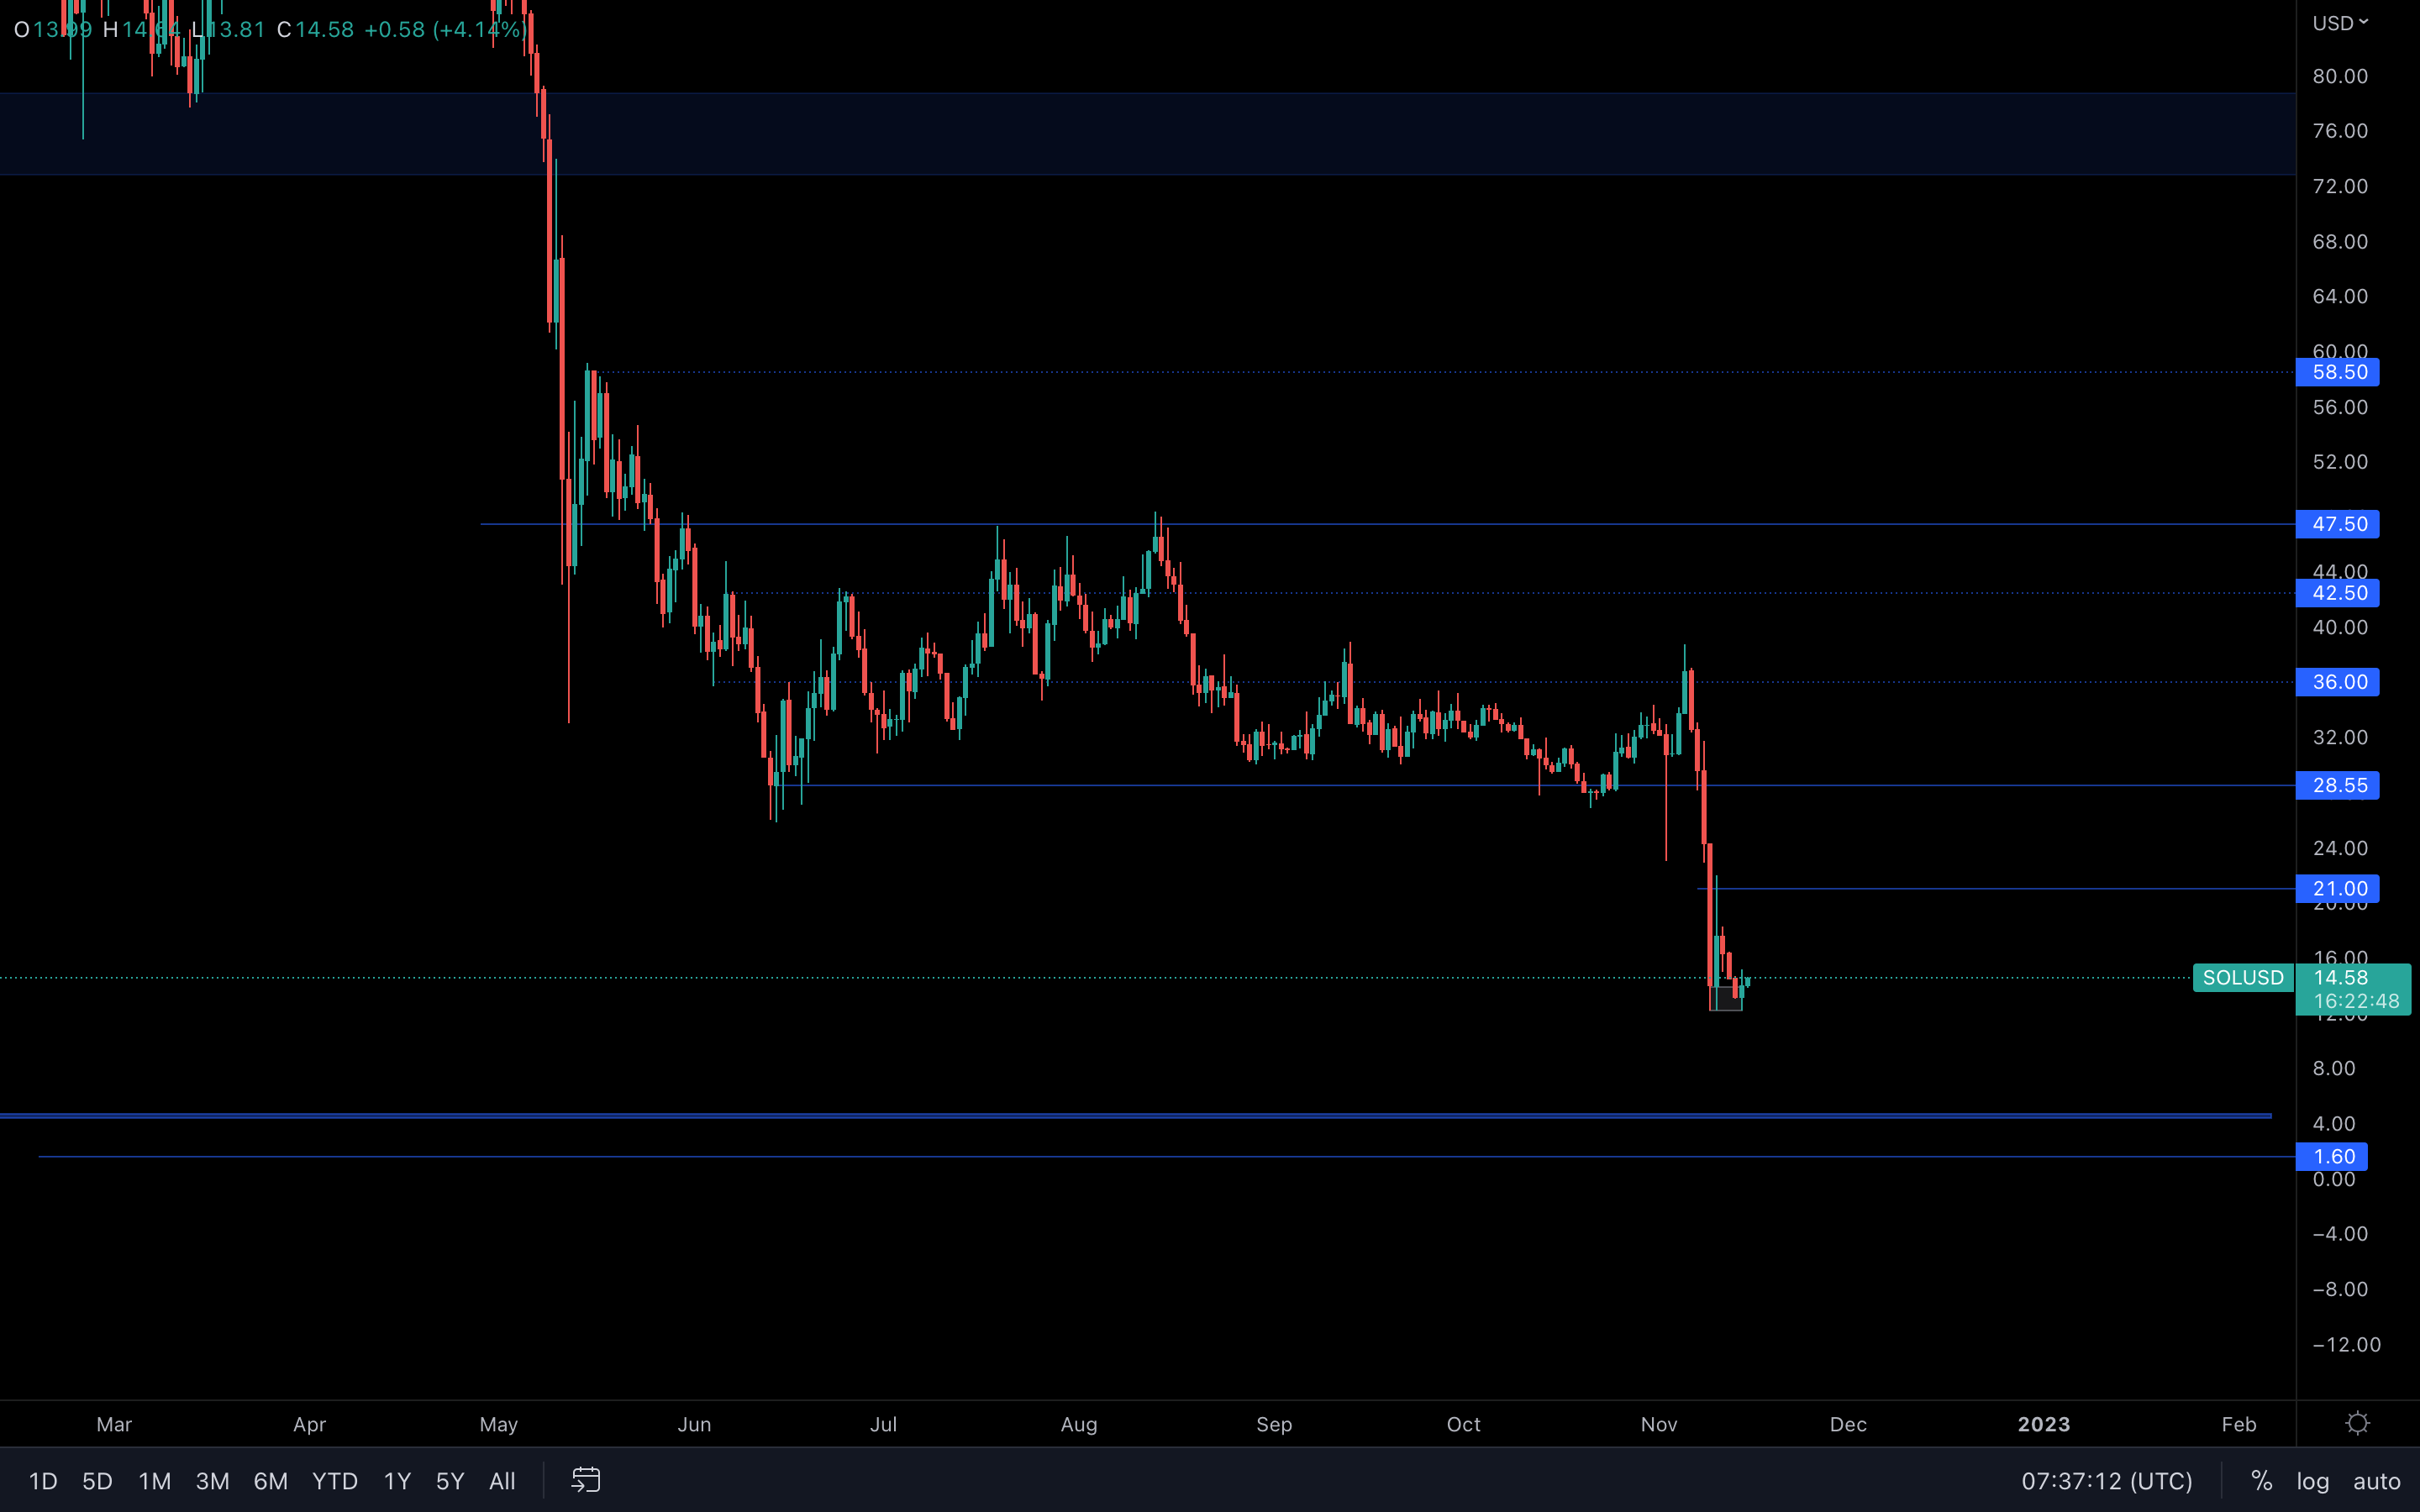 What an unexpected turn of events for SOL 🤨. The asset has descended over 50% in the last week alone and it seems a local bottom has been set in. From here, a push toward $21 is likely, but the overall market structure for SOL has annihilated any bullish expectations.
What's left now, you might ask? Although a $21 retest is likely, I just cannot see the price going any higher than that.
In fact, what could happen here is that because most of the leverage has been flushed out and the selling pressure has slowed down, we are indeed going to retest $21, but will ultimately get rejected and get pushed toward the $14 - $12 local bottom shortly after.
SRM
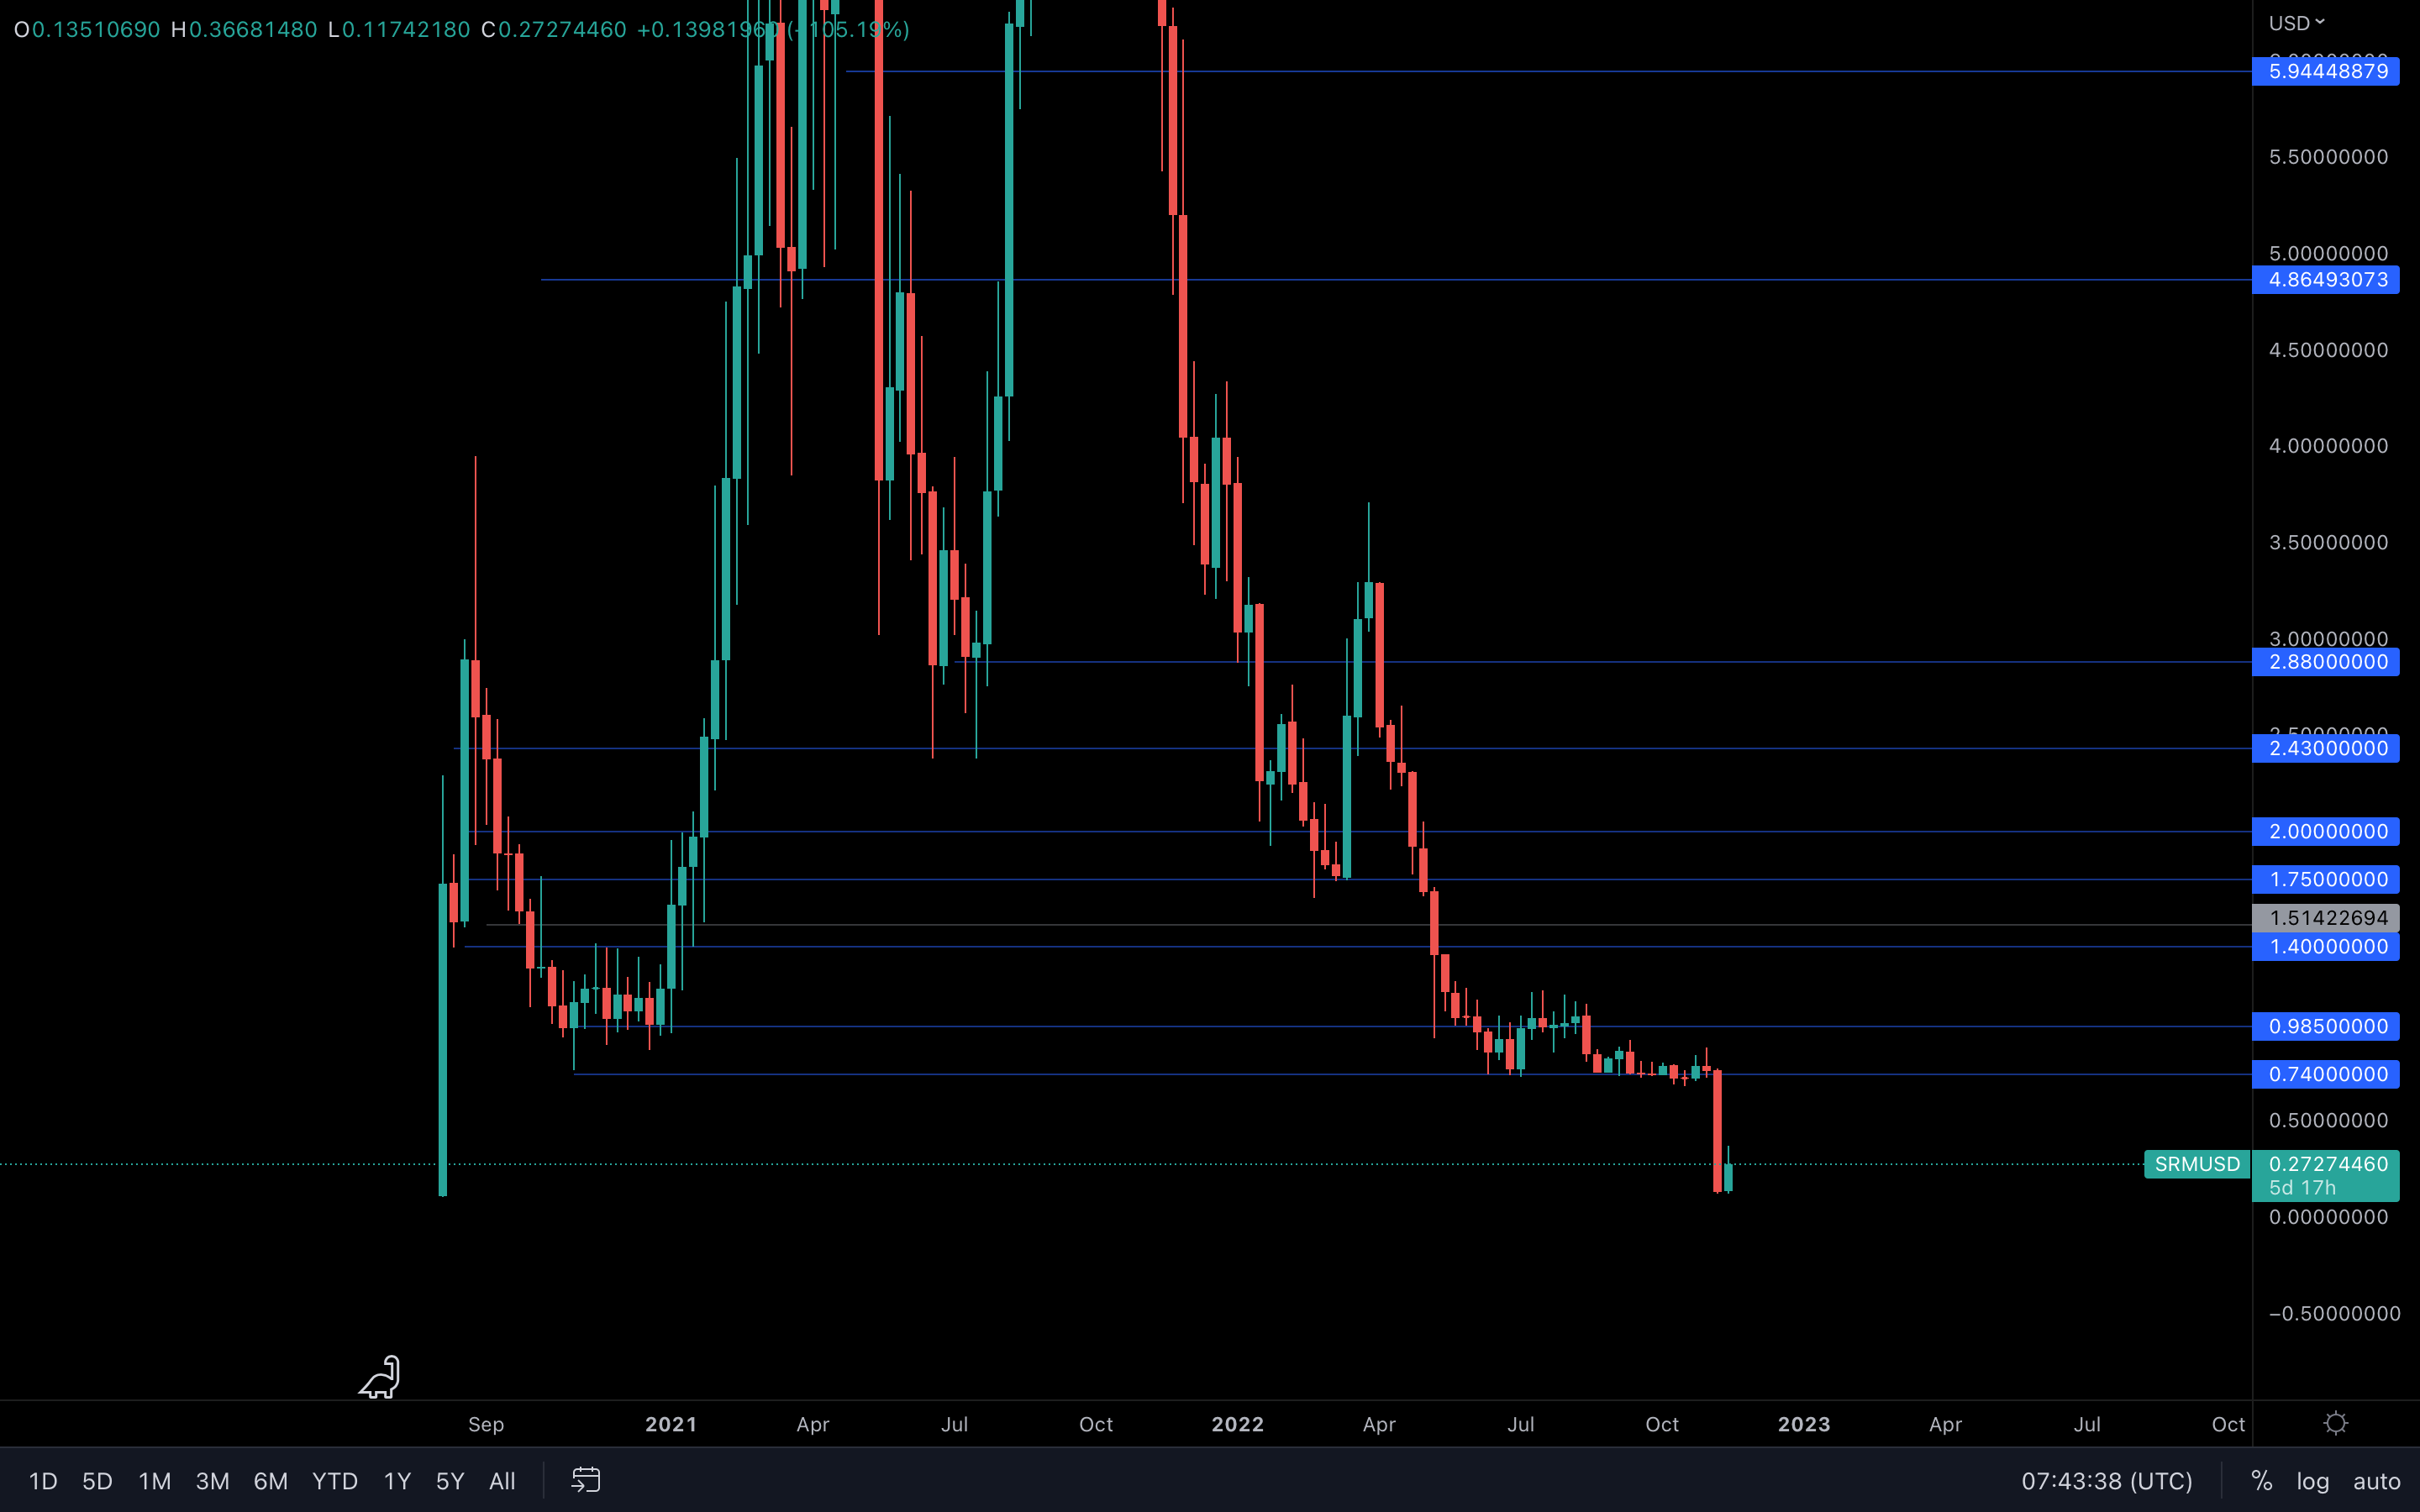 $0.74 was lost, and SRM entered a downside price discovery once again - brutally. In the last two days alone, the asset has seen a 170% increase after the aftermath of FTX, which implies that there are still some buyers left to pick up what's left here.
It's quite impossible to predict if/when the asset will actually retest $0.74, but based on how we've seen the market react in the past, a $0.74 retest is definitely a possibility in future weeks. As for the short-term (this week, maybe even next week), we can only expect somewhat of a choppy price action, and indecisive candles here and there as we're still trying to recover after the FTX incident. I personally would not be eager to jump into SRM at this current time (NFA)
SYN
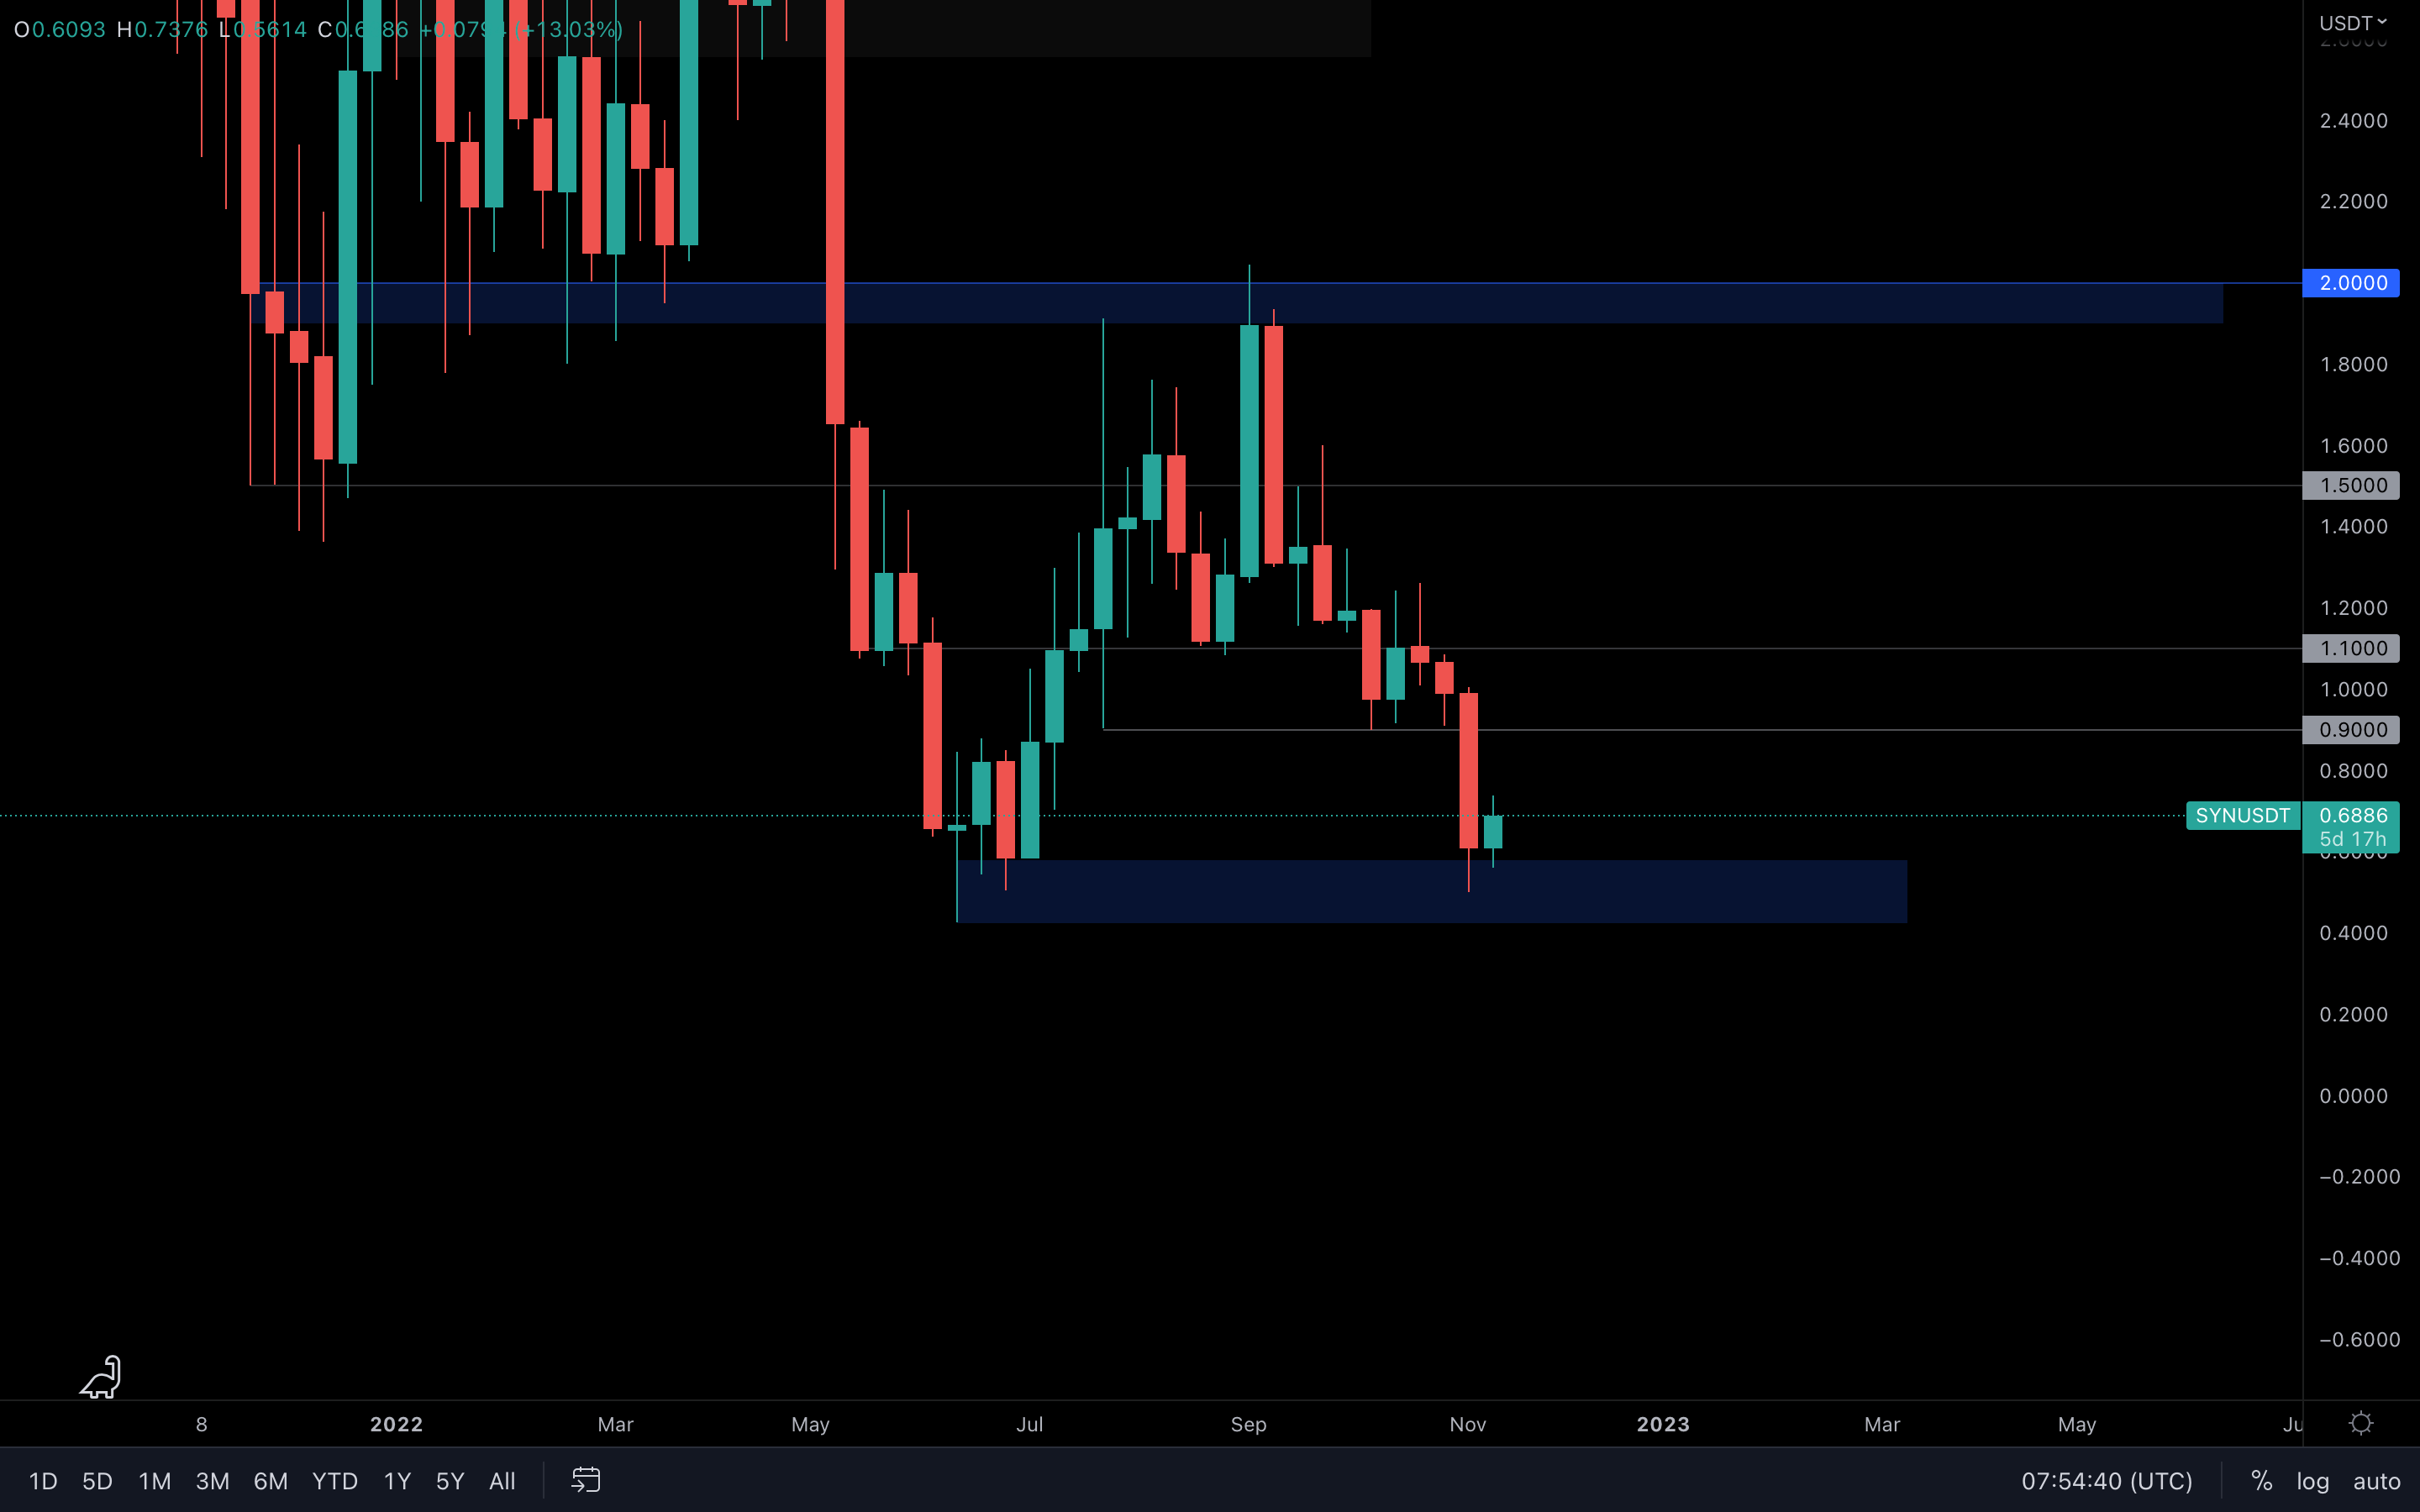 From now on, FTT will be replaced by SYN in our analysis reports.
We can see that SYN has also been affected by last week's events, but not to a high extent. The asset has descended to its June low and will likely push toward $0.90 in the coming days, maybe next week - it all depends on how the market will play out.
MINA
 (Daily chart was used)
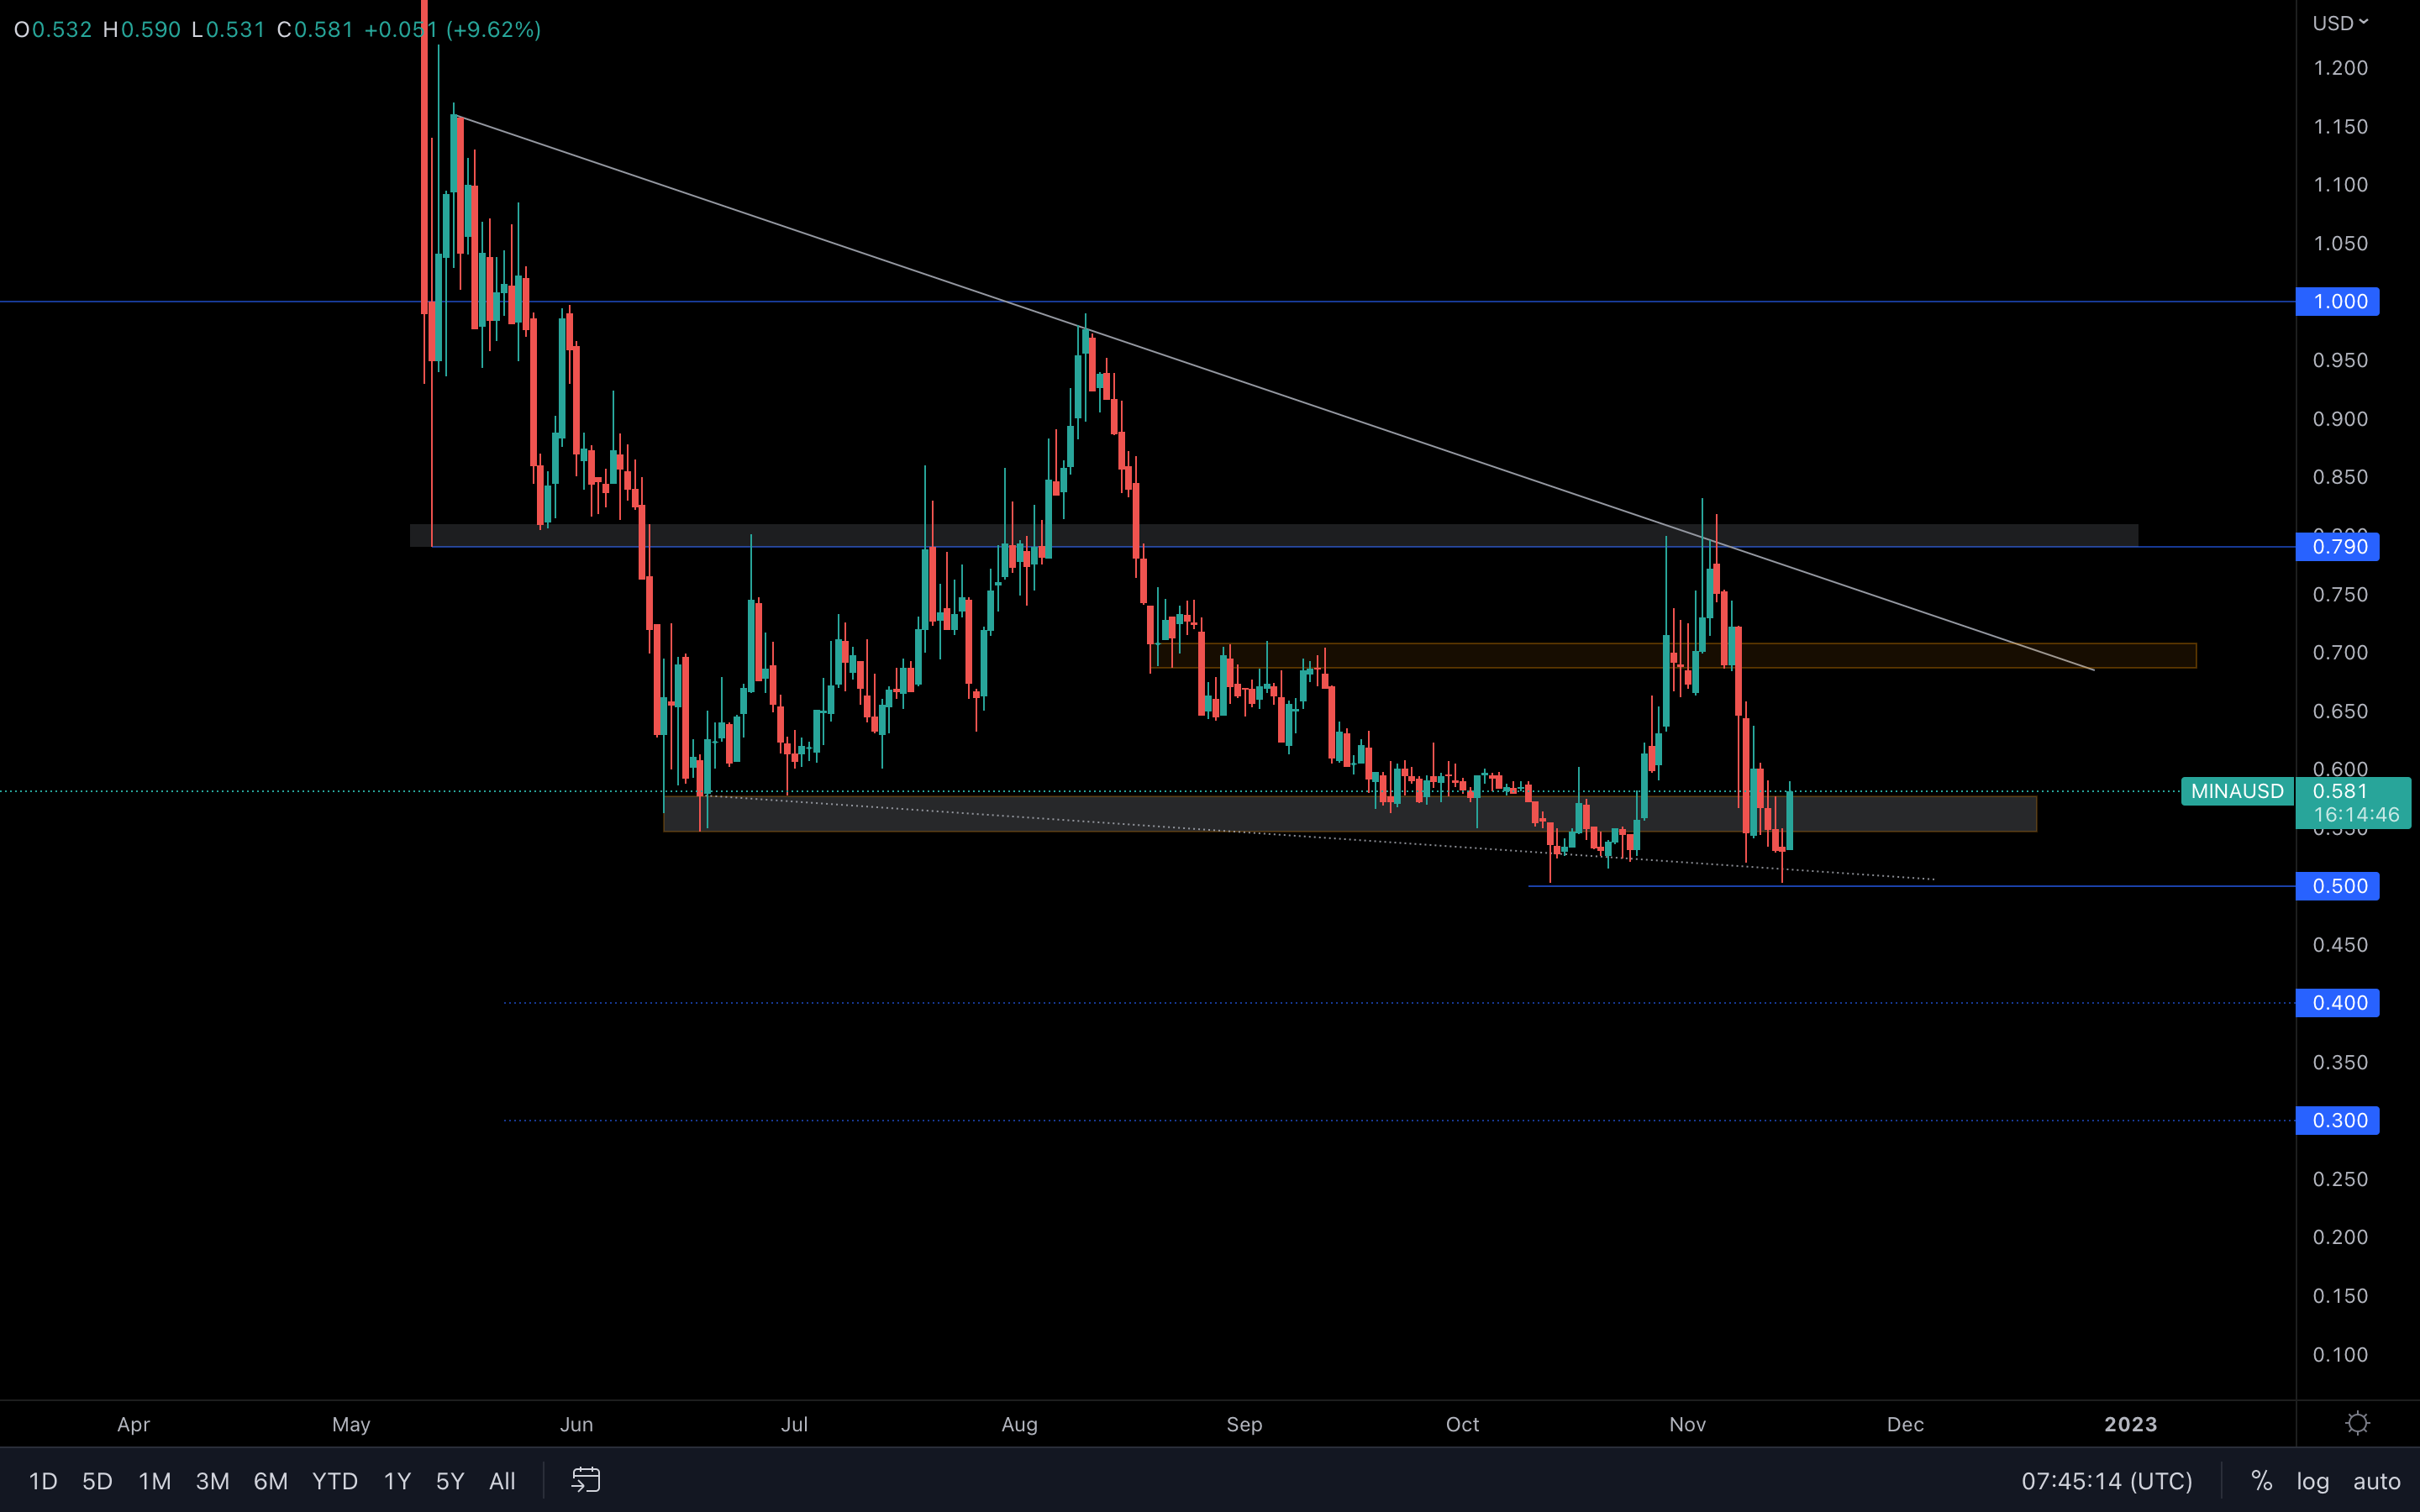
Of course, MINA is no different as it was also affected by last week's event. The asset has descended to $0.50, after which buyers stepped in and pushed the price to its current value. As we can see on the chart, there is a major local support area between $0.50 and $0.58, an area that will have to be broken if we were to see MINA perform well in the coming days/weeks.
(Daily chart was used)
Of course, MINA is no different as it was also affected by last week's event. The asset has descended to $0.50, after which buyers stepped in and pushed the price to its current value. As we can see on the chart, there is a major local support area between $0.50 and $0.58, an area that will have to be broken if we were to see MINA perform well in the coming days/weeks.
A weekly closure above the $0.58 level will suggest that $0.70 can be retested soon. For now, that's the main priority. If MINA is unable to close above $0.58, then $0.50 will be tested again shortly after.
DXDY
(Daily chart was used)
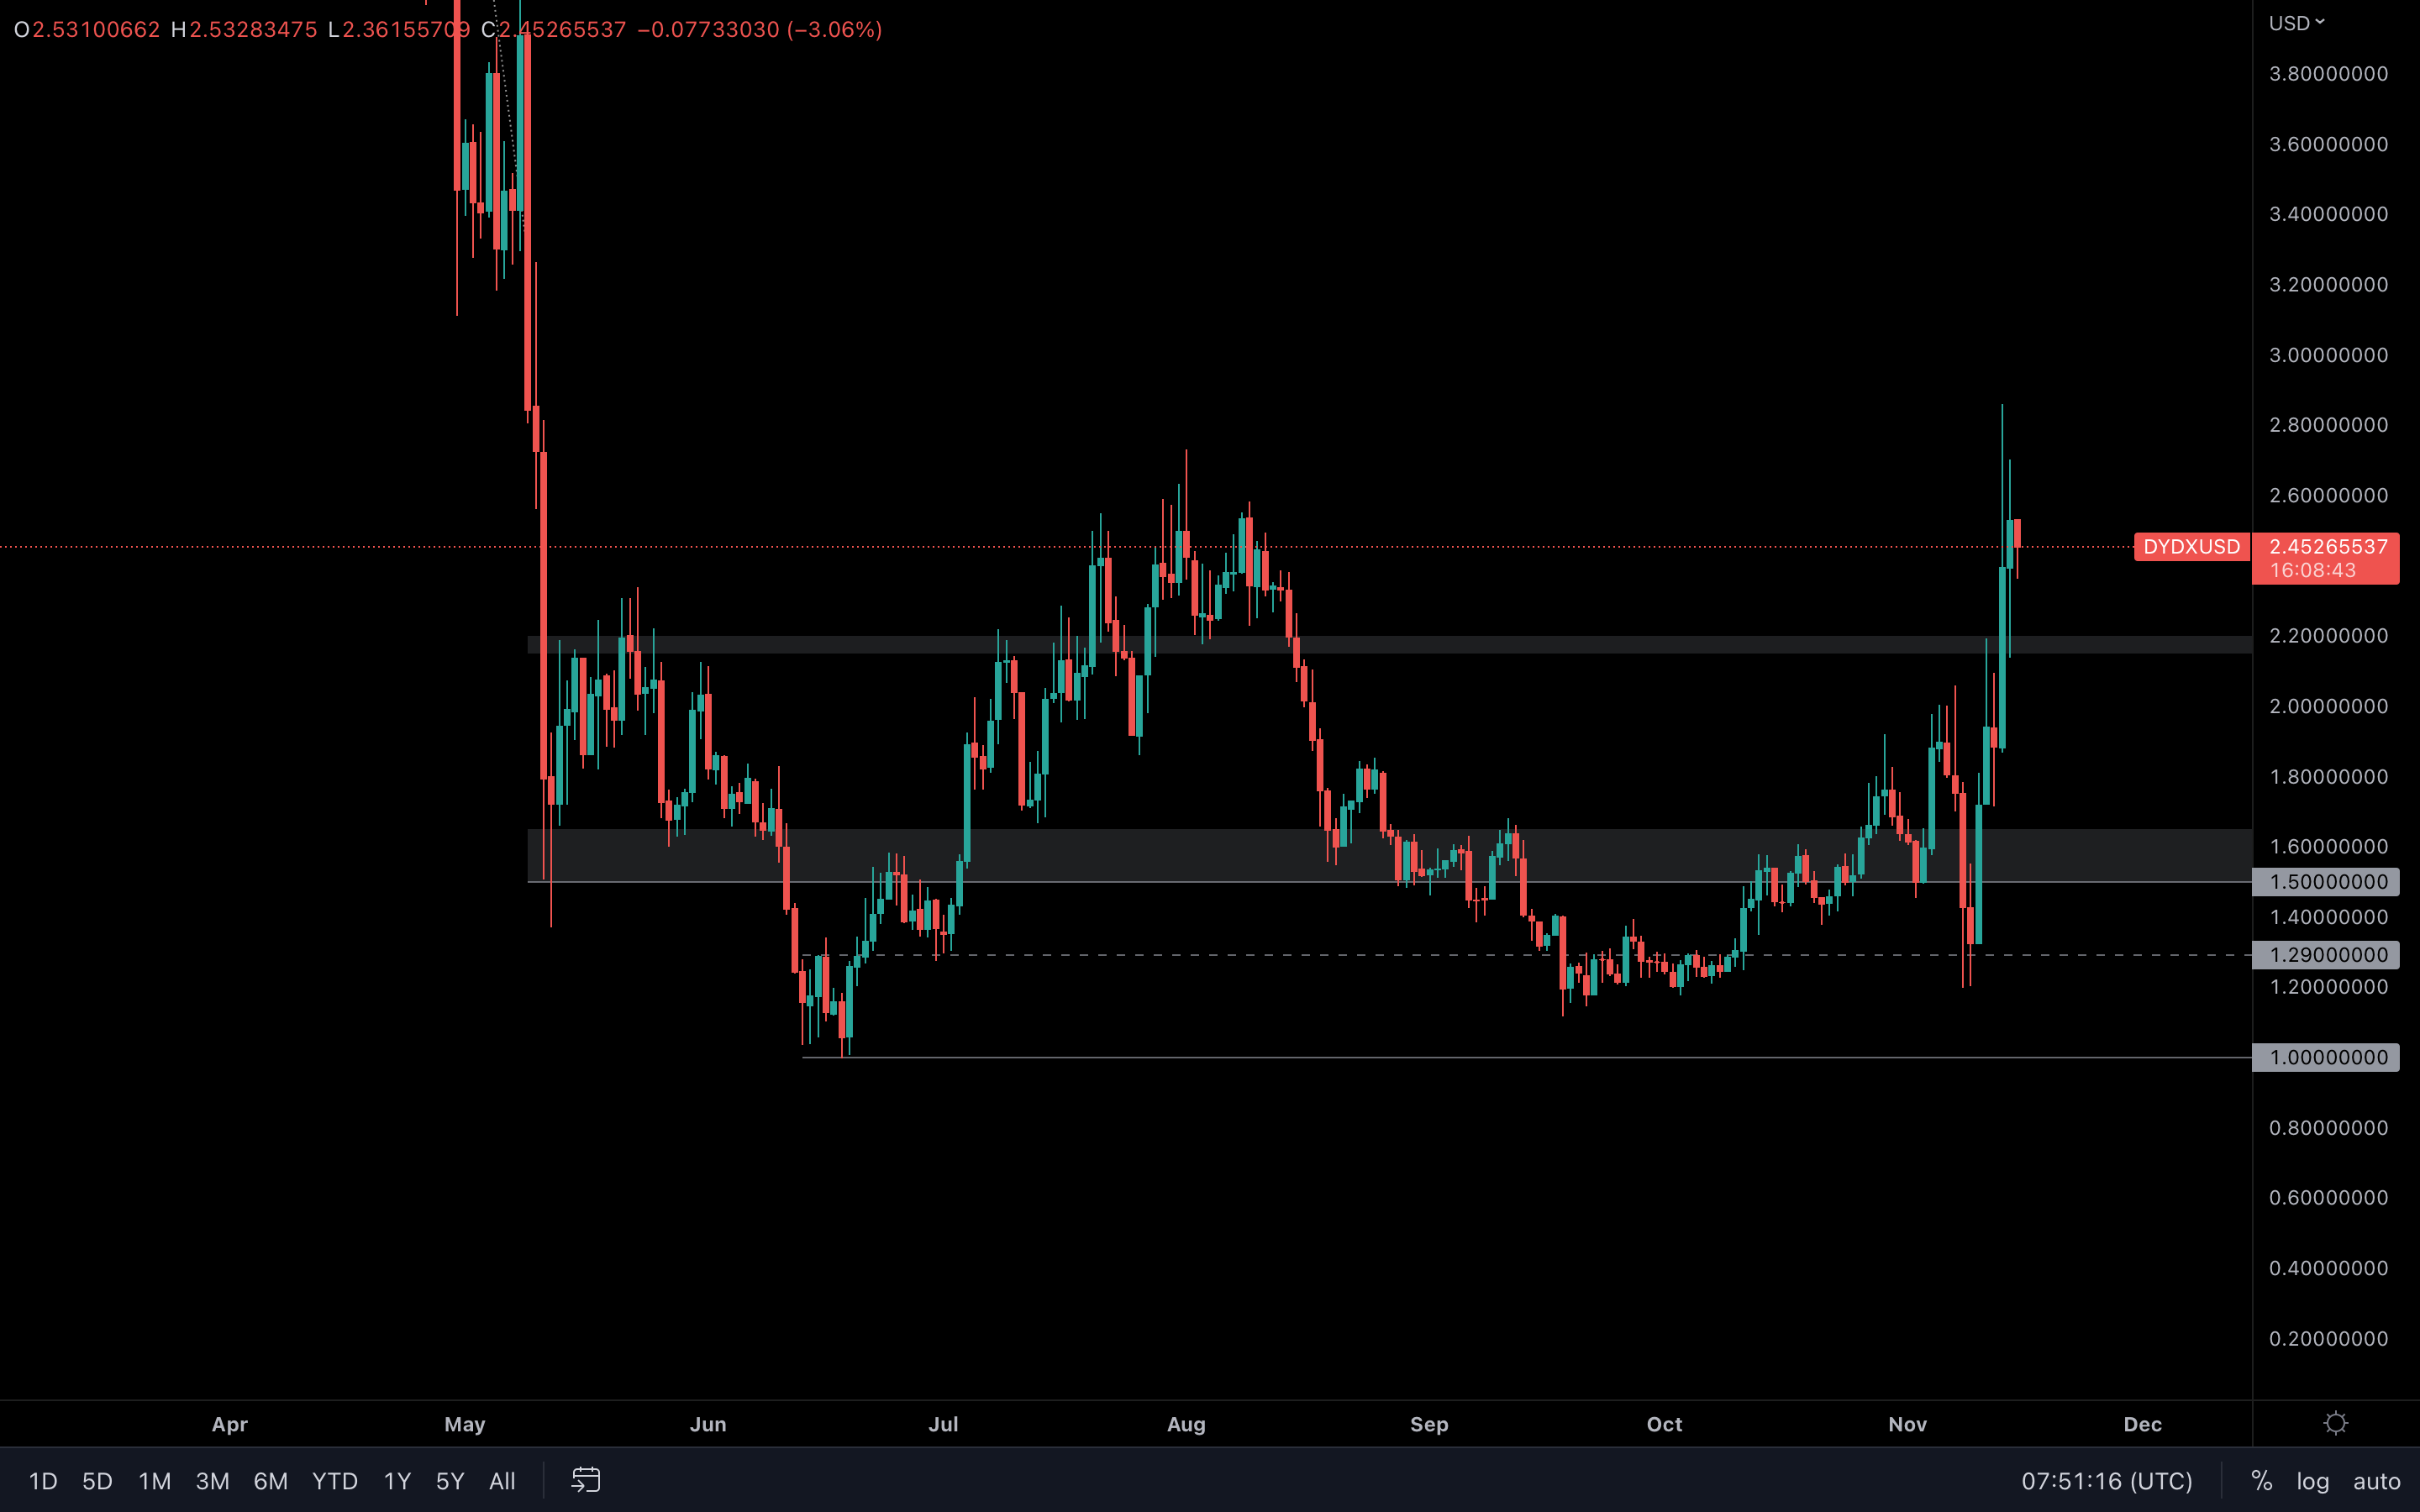
Top 5 biggest comebacks of 2022, am I right?
Even though dYdX was also affected by last week's events, we can obviously see that buyers didn't even care at all. In fact, dYdX experienced an even greater rise than what we've seen in quite some time. Another bullish note here, the asset has now formed a higher high on the weekly timeframe, confirming a market structure shift from bearish to bullish after registering a lower high back in September - October. Although we hope that this shift will last, we should also not deny that it is not sustainable given the rest of the market.
Not only that, but dYdX managed to close green last week as well, even with all the selling pressure that we've experienced.
Enough bragging about its price action though. Since dYdX has broken & closed above $2.20, this now acts as weekly support. As long as it holds, then dYdX actually has a shot at $3, $3.50, and so on. Of course, after levels are broken (especially at this magnitude), then usually a retest comes shortly after. For now, we should expect dYdX to properly retest $2.20.
The rise was mostly fundamentally-driven. After FTX, market participants decided to switch to more decentralized exchanges, and dYdX is one of them.
Summary
This past week has been chaos for the Crypto market as we have seen the blow-up of FTX and many users have lost their funds. This has seen prices significantly decline. For those who have been unaffected, the metrics suggest that current prices are very low and represent a great long-term opportunity for those willing to buy at these levels. It is certainly possible that the market can go lower from here, but Bitcoin is currently in deep value territory and Dollar Cost Averaging should be strongly considered at these levels. It is possible that a bottom is somewhere between $12,000 and $16,000 for Bitcoin and DCA strategies should be targeting and positioning for the above price points.Recommended from Cryptonary


